Generating Sustainable Value - The Renewables Infrastructure Group November 2020 Investor Update - TRIG
←
→
Page content transcription
If your browser does not render page correctly, please read the page content below
The Renewables Infrastructure Group
      November 2020 Investor Update

                           Generating Sustainable Value.

East Anglia One, England

                                                           trig-ltd.com
Important Information

 This document has been issued by and is the sole responsibility of The Renewables Infrastructure Group Limited ("TRIG"). This
 document has not been approved by a person authorised under the Financial Services & Markets Act 2000 ("FSMA") for the
 purposes of section 21 of FSMA. The contents of this document are not a financial promotion. None of the contents of this
 document constitute (i) an invitation or inducement to engage in investment activity; (ii) any recommendation or advice in respect of
 the shares in TRIG ; or (iii) any offer for the sale, purchase or subscription of shares in TRIG.

 If, and to the extent that this document or any of its contents are deemed to be a financial promotion, TRIG is relying on the
 exemption provided by Article 69 of the Financial Services and Markets Act 2000 (Financial Promotions) Order 2005/1529 (the
 "Order") in respect of section 21 of FSMA. If this document is sent only to investment professionals and/or high net worth
 companies, etc. (within the meanings of Articles 19 and 49 of the Order) and it is deemed to be a financial promotion, TRIG is
 relying on the exemptions in those Articles. Although TRIG has attempted to ensure the contents of this document are accurate in
 all material respects, no representation or warranty, express or implied, is made to, and no reliance should be placed on the
 fairness, accuracy, completeness or correctness of the information, or opinions contained herein.

 Neither TRIG, its investment manager, InfraRed Capital Partners Limited, its operations manager, Renewable Energy Systems
 Limited, nor any of their respective advisors or representatives shall have any responsibility or liability whatsoever (for negligence or
 otherwise) for any loss howsoever arising from any use of this document or its contents or otherwise arising in connection with this
 document. Nothing in this paragraph shall exclude, however, liability for any representation or warranty made fraudulently.

 The information set out herein may be subject to updating, completion, revision, verification and amendment and such information
 may change materially. The document is intended for information purposes only and does not constitute investment advice. It is
 important to remember that past performance is not a reliable indicator of future results. Furthermore, the value of any investment
 or the income deriving from them may go down as well as up and you may not get back the full amount invested. There are no
 guarantees that dividend and return targets will be met.

                                                                                                                                             2

                                                                                                                                trig-ltd.com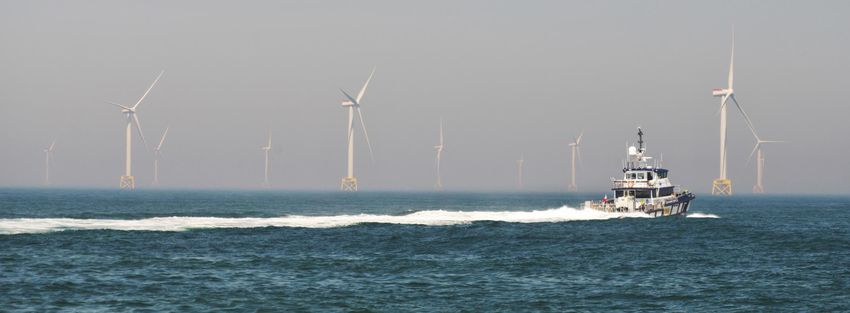
Generating Sustainable Value.
  Overview

          Purpose: To generate sustainable returns from a diversified portfolio of renewables infrastructure
                                   that contribute towards a zero-carbon future

                                                                                                                            ▲ Diverse independent Board
          Portfolio  construction1
                                 to                                                                                         ▲ Sets and monitors adherence to the
           enhance resilience &                                                                                               strategy and policies
               sustainability of                      Sustainable investment                                                ▲ Oversight of Managers
                      returns                          practices, reporting
                                                        transparency                                                        ▲ Day-to-day management, investments
                                                                                                                            ▲ 25-years investment track record
                                                                                                                            ▲ 450+ transactions
                                                                                                                            ▲ £10bn equity under management

                                                                                                                            ▲ Operational oversight of the portfolio
                                                                                                                            ▲ 38 years experience in renewables
                      Proactive asset management to                                                                         ▲ 18GW+ developed and/or constructed
                      preserve & enhance value2
                                                                                                                            ▲     6GW operational assets supported

         Diversified            £2bn                                    Attractive               5%                           High levels
                                Portfolio Value,                        dividend                                              of liquidity5,
                                                                                                                                                        0.96%
         portfolio                                                                               cash
         (as at 30 June 2020)
                                >70 projects
                                                                        yield3,4                 yield                        cost efficient            OCR6
                                UK & Europe

1. Taking into account power markets, regulatory frameworks, weather patterns & technology classes. 2. Through optimising generation, minimising downtime and operating safely. 3
3. Past performance is not a reliable indicator of future results. There can be no assurance that targets will be met or that the Company will make any
distributions, or that investors will receive any return on their capital. Capital and income at risk . 4. The dividend yield is based on target aggregate dividends for
2020 & share price of 132.4p at 20 November 2020. 5. c.3m shares traded daily based on 90-day average volumes as at 31 October 2020. 6. Ongoing Charges Ratio. trig-ltd.com
Strong track record over seven years
 Sustainable dividend growth, continued financial outperformance, scaling portfolio
                           Dividend increased by 13% over 7 years                                                           NAV per share increased by 15% over 7 years

                                       2020 target1 reaffirmed
                                                                                                 160p                                     NAV total return since IPO 8%1
                                          6.76p per share
                                                                                                 140p
                                                                                                 120p
                                                                                                 100p
                                                                                                    80p
                                                                                                    60p
                                                                                                    40p
                                                                                                    20p
                                                                                                          0p
                       2
                                                                                                                      IPO        2014      2015      2016      2017        2018    2019      H1 2020
                                                                                                                                        NAV per share    Cumulative Dividends

                Sustained share price outperformance and low beta3                                                      Portfolio growing in scale (investments made)

                                                                                                              2,250
                                     TSR return since IPO 9.3%1                                               2,000                                                                           281

                                                                                                              1,750                                                                 462

                                                                                                              1,500

                                                                                                 £ millions
                                                                                                                                                                            144
                                                                                                              1,250
                                                                                                                                                                  230
                                                                                                              1,000
                                                                                                                                              255       78
                                                                                                               750                                                                            1655
                                                                                                                                    178
                                                                                                               500
                                                                                                                            21
                                                                                                               250
                                                                                                                        280
                                                                                                                 0
                                                                                                                        2013       2014      2015       2016     2017       2018   2019      H1 2020

1. Past performance is not a reliable indicator of future results. There can be no assurance that targets will be met or that the Company will make any                                                4
   distributions, or that investors will receive any return on their capital. Capital and income at risk.
2. 2.50p per share was paid relating to the first five months of operations following IPO and represents 6.00p on an annualised basis.
3. Source: Thomson Reuters Datastream. Using 250 day rolling beta.                                                                                                                        trig-ltd.com
Generating Sustainable Value.

       ▲ InfraRed has achieved the top A+ rating from PRI                                                     Powering 1 million homes with clean energy1
            for six consecutive years

                                                                                                              1.1 million tonnes of CO2 avoided p.a.1
       ▲ RES ensures ESG integration and
            implementation by asset managers
                                                                                                              12 Operational and Active
       ▲ See slides 21 & 22 for more on TRIG’s Four                                                           Environmental Management Projects2
            Sustainability Goals and contributions to the UN
            SDGs                                                                                              c. £1.4m budgeted for community projects
                                                                                                              in 2020

1. The committed portfolio is capable of powering a million homes and saving around 1.1 million tonnes of CO2 annually based on average household electricity consumption figures
                                                                                                                                                                                    5
   and the IFI Approach to GHG Accounting.
2. Number of operational TRIG sites engaged in pro-active habitat management plans that exceed standard environmental maintenance.
                                                                                                                                                                        trig-ltd.com
Contents

Section                          Slide

Introduction and Highlights           7

Portfolio & Market                   10

Appendices                           14

                                          6

                              trig-ltd.com
Highlights since 30 June 2020
Overall performance remains strong
Generation & Operations
▲ Production c3% above budget to the end of October - down since 30 June, largely due
      to a combination of below average weather resource in October and some localised
      grid constraints
▲ Operations broadly in line with expectations - lock-downs have had limited impact on
      asset availability and construction program, robust contingency plans in place for this
      and Brexit1
Power Prices & Valuation
▲ Q3 long-term power price forecasts not materially changed
▲ The outlook for economic activity remains uncertain, but winter forwards indicating
      recovery (c. £45/MWh)
▲ NAV as at 31 October 2020 remains materially unchanged from 30 June 2020
      valuation of 113p per share
Acquisitions & Pipeline
▲ Acquisitions of subsidised assets (Haut Vannier and East Anglia One) have reduced
      the Portfolio’s power price sensitivity
▲ Attractive pipeline for the Company across key markets - >250MW at advanced
      stages of negotiations, including an offshore wind farm investment
Dividends
▲ Q4 dividend target reconfirmed at 6.76p for 2020
                                                                                                                                              Roos
▲ Target dividend for 2021 expected to be at least maintained at the same level as 2020 2
Past performance is not a reliable indicator of future results. There can be no assurance that targets will be met or that the Company will make any                                                       7
distributions, or that investors will receive any return on their capital. Capital and income at risk.
1. See appendix slide 23 for more details on Brexit. 2. In setting the dividend target for 2021, consideration will be given to items impacting forecast cash flows and expected dividend cover including the
levels of inflation across the Company’s markets, the outlook for electricity prices and the operational performance of the Company’s portfolio, in line with the Company’s dividend policy. trig-ltd.com
Share Placing
Rationale and timetable

 Funding requirement                                             Timetable
 ▲ Following completion of the investment in East Anglia         Placing opens                                             23 November
      One and including near term commitments on other
      projects, the Company is expected to have a c£200m
                                                                 Circular published                                        24 November
      funding requirement
 ▲ Strong pipeline of attractive assets being appraised by       Latest time and date for receipt of commitments           11.00 a.m. 27 November
      InfraRed with >250MW of assets in advanced
      negotiation
                                                                 Trade Date (settlement T+12)                              Friday, 27 November

 Benefits of growth                                              Announcement of the results of the Placing                Friday, 27 November

 ▲ Further diversification of the portfolio and operational      Latest time and date for receipt of Forms of Proxy        11.00 a.m. on Thursday,
      scale benefits                                             or transmission of CREST Proxy Instructions for the EGM   10 December

 ▲ Likely to increase market liquidity of TRIG’s shares                                                                    11.00 a.m. on Monday,
                                                                 EGM
                                                                                                                           14 December
 ▲ Increased size of the Company may help attract a
      wider investor base                                        Results of EGM announced                                  Monday, 14 December
 ▲ More cost effective, lower incremental management
      fee and spreading fixed costs across a larger capital      Settlement date and Admission                             Tuesday, 15 December
      base

1. Total return based on growth in NAV plus distributions paid                                                                                       8

                                                                                                                                       trig-ltd.com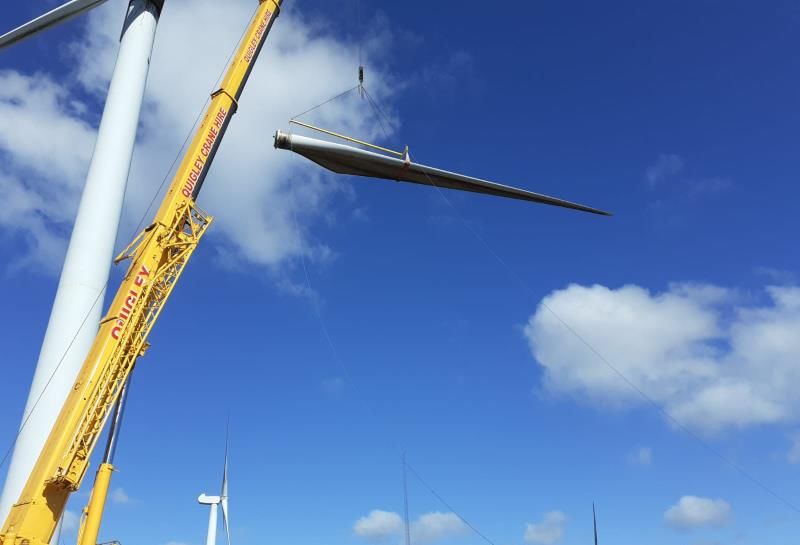
East Anglia One
Newly constructed UK offshore windfarm with CfD subsidy

▲ 14.3% indirect equity interest acquired in newly constructed East Anglia
     One offshore wind farm located 4.3km off the Suffolk Coast
▲ 15 year CfD subsidy fixing the power price with inflation indexation –
     reduces portfolio power price sensitivity
▲ Siemens Gamesa 7MW turbines with direct drive technology
▲ Debt financing at the Holding Company level is fixed rate and fully
     amortising within the subsidy period
▲ Majority shareholder in the project is ScottishPower, a subsidiary of
     Iberdrola, a global energy leader with 34GW of installed renewables
     capacity
▲ Furthers TRIG’s ESG goals underpinning the Company’s contribution to
     supporting the United Nations Sustainability Goals
▲ East Anglia One generates enough electricity to meet the demands of
     630,000 homes

                                                                             East Anglia One, 102 turbines, 714MW

1. https://www.un.org/sustainabledevelopment/                                                                                 9

                                                                                                                    trig-ltd.com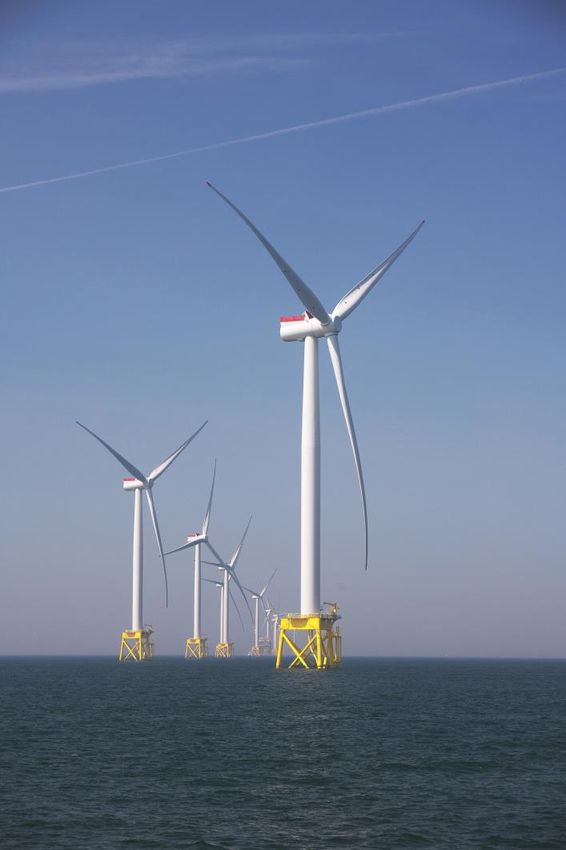
Portfolio & market

Roussas Claves, France

                              trig-ltd.com
Diversified portfolio (incl. East Anglia One)
1.6GW net capacity / 75 projects
By Jurisdiction / Power Market1,2 Ten largest assets1
Oct-20 32% 26% 3%3% 12% 9% 15%
Jun-20 24% 28% 4% 4% 13% 10% 17% East Anglia One 11%
Dec-19 24% 26% 4% 4% 11% 18% 15%
Jadraas 9%
England & Wales Scotland Northern Ireland Republic of Ireland
France Sweden Germany
By Technology1 Other 44%
Merkur 8%
Oct-20 59% 29% 11% 1%
Jun-20 65% 21% 13% 1%
Gode 6%
Dec-19 69% 19% 11% 1%
Garreg Lywd 5%
Onshore Wind Offshore Wind Solar Battery
Blary 2%
Construction Exposure1,3 Pallas 3%
Solway 5%
Oct-20 93% 7% Crystal Rig II 3% Sheringham 4%
Jun-20 91% 9%
Dec-19 94% 6% Key: countries as per Jurisdiction / Power Market bars
Operational Under construction
1. Segmentation by portfolio value. Assets under construction are included on a fully committed basis including construction costs. 11
2. Northern Ireland and the Republic of Ireland form a Single Electricity Market, distinct from that operating in Great Britain.
3. Solwaybank has been included in the construction exposure as at 31 October, completion is expected shortly, once completed the total construction exposure
will be reduced to 3% trig-ltd.comPolicy drivers remain strong
The Green recovery opportunity
European Union – energy transition
▲ European Green Deal and Next Generation EU recovery fund contributing to the
energy transition
▲ Range of energy transition funding including €25bn into renewables between
2021 and 2027
▲ EU Hydrogen strategy seeks installation of 6GW+ of hydrogen electrolysers by
2024 increasing to 40GW by 2030
UK
▲ Total of £3bn green recovery funding – incl. £139m supporting clean hydrogen
and carbon capture and storage
▲ “Build back better and build back greener” – Prime Minister Boris Johnson
▲ COP26 due November 2021 in Glasgow
12
trig-ltd.comForecast new capacity of 90GW by 2030
New capacity from a broad range of revenue and market types
Revenue type Largely subsidised markets Largely unsubsisdised markets
Key
Offshore &
technology Onshore Wind Offshore Wind Onshore Wind Solar
focus
Onshore Wind1
25 40
35 32
Estimated 18 30
26 28
capacity 9 20 22
(GW)2 20 17
15 11 10
12 7
2020 2025 2030 2020 2025 2030 2020 2025 2030 2020 2025 2030 2020 2025 2030
Estimated
secondary
market €15-20bn p.a. €4-5bn p.a.
transactions3
1. Note that new UK onshore wind currently does not attract a subsidy 13
2. Based on estimates from leading market forecasters used in the Portfolio Valuation process. Chart Key: Dark blue = offshore wind; light blue = onshore wind; orange = solar.
3. Based on InfraRed’s estimates of enterprise value transaction volume in TRIG’s key focus markets and technologies. Offshore wind market comprises larger and less
frequent transactions than other technologies, and therefore these estimates represent an averaged view trig-ltd.comAppendices
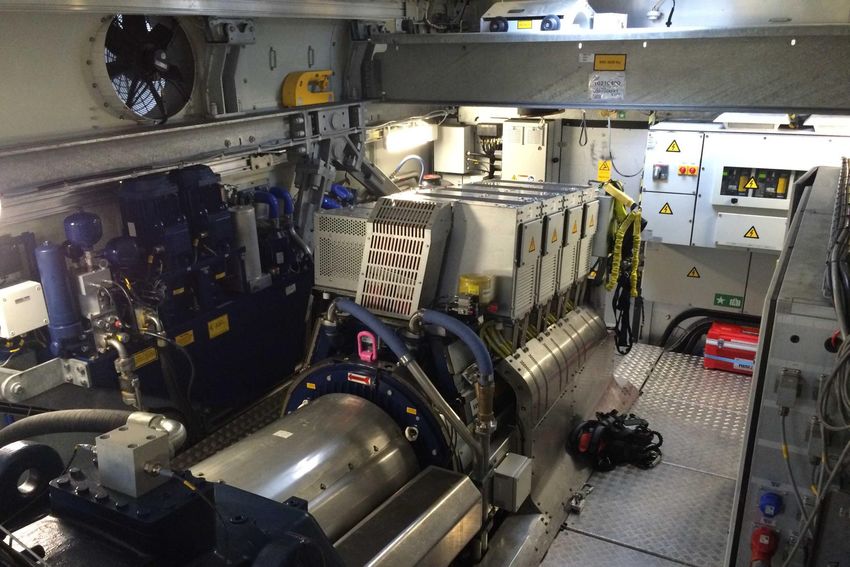
Inside the nacelle at Jadraas, Sweden
trig-ltd.comSummary June 2020 Financial Statements
Resilient Results - NAV per share down 2.0p driven by impact of Covid-19
Income Statement Balance Sheet Cash Flow Statement
Six months to Six months to Six months to Six months to
30 June 2019 30 June 31 December 30 June 2019
30 June 2020 30 June 2020
2020 2019
£m £m £m £m
£m £m
Total operating Portfolio Cash from investments 78.1 63.2
61.1 133.4 2,009.3 1,745.2
income value
Operating and finance costs (9.5) (7.1)
Working
Acquisition (2.4) (2.2)
(0.2) (0.4) capital Cash flow from operations 68.6 56.1
costs
Hedging Debt arrangement costs - -
Net operating (15.8) 12.6
60.9 133.0 liability
income
FX gains/losses (5.1) 5.4
Debt (49.8) -
Fund expenses (9.4) (7.1) Equity issuance (net of costs) 118.7 297.6
Portfolio Refinancing Proceeds - 64.6
Foreign Cash 24.4 127.8
exchange (33.6) (2.1) 49.8 -
Acquisition facility drawn/(repaid)
gains/(losses)
Net assets 1,965.7 1,883.4
New investments (incl. costs) (281.8) (347.3)
Finance costs (1.6) (1.6)
NAV per Distributions paid (53.6) (40.7)
113.0p 115.0p
share
Profit before Cash movement in period (103.4) 35.7
16.3 122.2
tax Shares in
1,739.3m 1,637.5m
issue Opening cash balance 127.8 16.9
Earnings per
1.0p 9.3p
share1
Net cash at end of period 24.4 52.6
Ongoing
Pre-amortisation cover 2.2x3 1.9x3
Charges 0.96% 0.98%
Percentage
Cash dividend cover 1.3x4 1.4x4
1. Calculated based on the weighted average number of shares during the year of 1,659.0 million shares
2. Columns may not sum due to rounding differences 15
3. In H1 2020, scheduled project level debt of £50m was repaid, therefore without debt amortisation dividend cover ratio would be 2.2x (68.6+50)/53.6 (2018: 1.9x)
4. After scrip take-up of 1.0m shares, equating to £1.2m, issued in lieu of the dividends paid in the year. Without scrip take up dividends paid would have been trig-ltd.com
£54.8m and dividend cover 1.25x (H1 2019: 1.4x)Valuation I – H1 highlights: power prices
Valuation movement in the six months to 30 June 2020
Power prices (-£123.1m) TRIG blended power curve1
70
▲ Power price forecasts down – most significantly in the 60
Real 2019 GBP/MWh
near term, driven by Covid-19 impact on power 50
demand 40
▲ Longer-term reduction reflects lower future gas and 30
other commodity price forecasts 20
10 Blended Curve Dec-19 Blended Curve Jun-20
0
Revenue visibility '20 '21 '22 '23 '24 '25 '26 '27 '28 '29 '30 '31 '32 '33 '34 '35 '36 '37 '38
Year
▲ Strong visibility on pricing over the short term – 80%
fixed revenues for remainder of 2020 (comprising Avg. Avg.
Average real forecast power price by region
2020-2024 2025-2050
subsidies & fixing through forward sales) Great Britain £ / MWh 41 44
▲ Over the long term, >50% fixed over next 20 years Average of Euro denominated markets € / MWh 37 48
▲ Active power price management strategy in place –
PPA and market based fixing Forecast proportion of fixed vs. market revenues2
▲ Sensitivity to power price reduced with increased Next 12 months to Dec 24 to Dec 29 to Dec 39
fixing and careful portfolio construction
1. Power price forecasts used in the Directors’ valuation for each of GB, the Single Electricity Market of Ireland, France, Germany and Sweden are based on analysis 16
by the Investment Manager using data from leading power market advisers. In the illustrative blended price curves, the power price forecasts are weighted by P50
estimates of production for each of the projects in the Company’s portfolio. Forecasts are shown net of assumptions for PPA discounts and cannibalisation.
2. Fixed revenues includes subsidies, hedges and fixed price PPAs. trig-ltd.comValuation II – H1 highlights: other key items
Valuation movement in the six months to 30 June 2020
Valuation discount rates (+£29.2m)
▲ Reduced by 0.2% reflecting observations of movements in
market discount rates Mainstreaming of the asset class
▲ Blended rate now 7.0% (31 Dec 2019 7.25%) 10%
9%
8%
Foreign exchange movement (net +£22.4m) 7%
6%
▲ FX gain £56.0m, offset by hedging to net gain of £22.4m –
5%
reflecting 7% weakening in Sterling in the year
4%
3%
Balance of portfolio return (+£98.9m) 2%
1%
▲ Expected return – unwind of the discount rate at 7.25%
0%
▲ Efficient portfolio management and additional value 2013 2014 2015 2016 2017 2018 2019 H1 2020
enhancement: UK Average Long-Term Government Bond Yield Average Risk Premium
▪ Reductions in maintenance costs
▪ Improved PPA terms
▪ Strong generation
17
trig-ltd.comProduction in H1 2020
Geographic diversification continues to benefit the portfolio
2020 Jan-Jun generation: 2,141GWh1
▲ 50% increase over H1 2019
▲ Total generation 9.3% above budget
▲ GB wind, Scandinavian wind and UK solar performing well above
budget
2020 Jan-Jun generation by region
Electricity
Performance
Technology Region production
vs Budget
(GWh)
Wind onshore GB 728 +13%
Scandinavia 446 +28%
France 250 -1%
Ireland 182 0%
Wind offshore UK & Germany 439 -1%
Solar UK & France 95 +6%
Total Portfolio 2,141 +9.3%
Construction at Venelle,
France
1. Includes compensated production from grid curtailments and insurance 18
trig-ltd.comWeather in H1 2020
Geographic diversification continues to benefit
Wind and solar variation to long-term average
80%
60%
40%
20%
0%
Jan-20 Feb-20 Mar-20 Apr-20 May-20 Jun-20
-20%
-40%
-60%
-80%
GB Wind Ireland Wind France Wind Scandinavia Offshore Solar & Storage Portfolio
Total generation 9.3% above budget Monthly wind speed correlation 2000-2019
Geographic diversification mitigates large monthly GB NI & ROI Scandinavia France
Germany
regional variances in weather (Offshore)
GB 100%
Lower wind speeds in UK&I, France and Offshore in April
offset by high wind resource in Scandinavia NI & ROI 97% 100%
Strong wind generation in Q1 2020 across all regions Scandinavia 80% 75% 100%
Strong solar resource throughout the half year France 74% 68% 63% 100%
Germany
86% 79% 82% 70% 100%
(Offshore)
Altahullion yaw ring replacement
19
trig-ltd.comValue enhancements
Proactive management continues to preserve and enhance value
Value preservation
Condition monitoring to ensure timely maintenance. Proactive main
component management key for maintaining availability during pandemic
Commercial enhancements
Early participation in National Grid’s ODFM1 scheme, protecting revenue
during periods of oversupply
Capacity Market contract secured for Blary Hill, with15-year fixed revenue
stream
New O&M contracts on better commercial terms at three French projects Lendrum's Bridge blade replacement, Northern Ireland
Technical enhancements
Turbine performance upgrades, increasing annual energy yield & revenue
Operating costs reduced at recently acquired asset by improved grid
settings
"Wake Steering” – small adjustments to turbine direction increasing overall
production. Full-scale pilot progressed at Altahullion wind farm in Northern
Ireland, with an expected production increase over 1%
Penare Farm, England
1. Optional Downward Flexibility Management 20
trig-ltd.comSustainability
Continued progress towards TRIG’s Four Sustainability Goals
To mitigate climate ▪ 640k tonnes of CO2 emissions avoided in
change H1 2020
To positively impact the ▪ Additional Covid-19 recovery support
communities we work in brings 2020 community support to £1.4m
To preserve the natural ▪ 12 active environment plans in place
environment
Tablets funded by TRIG at a local primary school
To maintain ethics and ▪ Sustainability Policy in place
integrity in governance
▪ Enhanced sustainability due diligence
Supporting the UN SDGs1 incorporated into the investment process
▪ InfraRed maintains A+ PRI rating
▪ RES released it’s second Sustainability
Report
▪ Sustainability incorporated into managers’
performance objectives
New canopy at Llanbister Community Primary School
1. https://www.un.org/sustainabledevelopment/ 21
trig-ltd.comStakeholder engagement: Blary Hill case study
Active engagement with local supply chain
In the period and during lockdown, the Blary Hill project held its first
virtual Meet-the-Buyer event
Opportunity to connect with local businesses capable of working on the
project
Strong business interest resulted with additional sessions added to
ensure that everyone who signed-up had the opportunity to speak to
RES
Advert placed in the local paper as well as posting a video about the
event on the project website
Local business skills, qualifications and experience have all been
recorded and will be used throughout construction when tendering for
work
22
trig-ltd.comRisks relating to the outcome of UK negotiations with the EU
Outcome of negotiations with EU on a trade deal expected to have low impact
Key EU trade deal risks Key Mitigants
• Managers well resourced
Workforce skills shortage
• Wide range of subcontractors in place mitigates individual asset risks
• All key suppliers reviewed for approach to anticipated challenges and uncertainties
Supply chain failure
• Additional spares being stored both sides of Irish border
• Potential disruption to interconnectors with the UK outside the Internal Energy Market, but
Revenue disruption – GB
UK a net importer - tighter supply positive for GB wholesale prices
• No immediate impact on electricity generation and flow is anticipated
Revenue disruption – SEM¹
• Significant support for cross border interconnection to ensure the “lowest-cost pathway to
decarbonisation”
Revenue disruption – • Replacement Carbon Price Support expected
lower carbon taxes outside
EU ETS² • Carbon taxes support decarbonisation targets and generate tax revenues
1. Single Electricity Market (SEM) is the wholesale electricity market for the island of Ireland 23
2. European Union Emissions Trading System
trig-ltd.comValuation – Key assumptions
Power price reductions partly offset by reduced discount rates
As at 30 June 2020 As at 31 December 2019
Discount Rate Portfolio return 7.00% 7.25%
Power Prices Weighted by market Based on third-party forecasts Based on third-party forecasts
UK 2.75% 2.75%
Long-term
Inflation1
France & Rep. of Ireland 2.00% 2.00%
Foreign
EUR : GBP 1.1039 1.1827
Exchange
Wind portfolio, average 29 years 29 years
Asset Life
Solar portfolio, average 30 years 30 years
1. A change in the long-term inflation assumption would be equivalent to a similar (but inverse) change in the valuation discount rate. Short-term inflation in the UK 24
is assumed at 3.0% for 2020 (ROCs only). Outside of the UK, inflation is assumed at 1.75% for 2020.
trig-ltd.comNAV sensitivities
Based on portfolio at 30 June 2020
-30000.0% -20000.0% -10000.0% 0.0% 10000.0% 20000.0% 30000.0%
Discount rate +/- 0.5% -3.6% 3.9%
Output P90 / P10 (10 year)* -11.4% 10.2%
Power price -/+ 10% -6.6% 6.8%
Inflation -/+ 0.5% -4.1% 4.4%
Operating costs +/- 10% -4.6% 4.5%
Exchange rate -/+ 10% -1.5% 1.5%
Interest rate + 2% / - 1% 0.4% -0.1%
Tax +/- 2% -1.0% 1.0%
Asset Life -/+ 1yrs -1.1% 1.0%
-15% -10% -5% 0% 5% 10% 15%
Impact of sensitivity on portfolio value
* A P90 10-year downside case assumes the average annual level of electricity generation that has a 90% probability of being exceeded over a 10-year 25
period. A P10 10-year upside case assumes the average annual level of electricity generation that has a 10% probability of being exceeded over a 10-year
period.
trig-ltd.comPortfolio (1) – Constructing a balanced portfolio
Understanding the range of revenue types available
▲ FiT & CFD contracts (France, Ireland,
Germany and UK) typically have subsidy
revenues of 15-20 years then market
revenues for the balance of a project’s life
o Least revenue risk (early on), scope for
highest gearing, lower equity return
▲ ROC projects (UK) have a mix of subsidy
and market revenues for the first 20 years
of a project’s life
o Medium revenue risk, moderately
geared, average returns
▲ Unsubsidised projects without subsidies
(may have hedging or PPAs which mitigate
power price exposure). Equity returns
correlate with revenue risk, with safer
capital structure
o Highest revenue risk (long term),
least/no gearing, higher equity returns
1. Fixed revenues includes subsidies, hedges and fixed price PPAs 26
trig-ltd.comPortfolio (2) – Revenue profile
Medium-term project-level revenues mainly fixed and indexed
Project revenue by type
PPA Market Revenue
15% Indexed Fixed PPAs
& FiTs
PPA Market Revenue 52%
at Floor 5%
ROC Recycle
and Other 3%
Next 12
Months1
Indexed ROC Buyout
25%
1. Project revenue expected for 12 months from 1 July 2020 to 30 June 2021 27
trig-ltd.comRenewables deployment
Renewables continuing to increase as a percentage of overall generation
Forecast wind and solar generation proportion Forecast low-carbon generation proportion
GB 27% 52% 54% GB 62% 75% 80%
RoI & NI 35% 57% 68% RoI & NI 42% 65% 74%
France* 10% 22% 39% France 91% 96%
96%
Germany 31% 48% 59% Germany 51% 60% 71%
Nordics* 19% 26% 34% Nordics 95% 99%
97%
2020 2030 2040 2020 2030 2040
▲ Low carbon power includes Nuclear, Biomass and Energy from Waste as well as Renewables
▲ Renewables includes Hydro, Wind and Solar
▲ Forecasters assume significant build out of renewables over medium to long term as base load fossil fuel retires
▲ Some geographies are forecast to reach 100% low carbon by 2050, others 70-100%
28
trig-ltd.comThe Team
Experienced Management
Independent Board
Helen Mahy CBE
(Chair)
Investment Manager Operations Manager
Key roles: Key roles:
Shelagh Mason Overall responsibility for day-to-day Providing operational management
(SID) management services for the portfolio
Sourcing and approving new investments Implementing the strategy for electricity
Advising the Board on investment sales, insurance and other areas
Jonathan Bridel strategy and dividend policy requiring portfolio level decisions
(Audit Chair) Maintaining operating risk management
Advising on capital raising
Risk management and financial policies and compliance
administration Appoints senior individuals to the
Investor relations and investor reporting Advisory Committee alongside InfraRed
Klaus Hammer
to advise TRIG on operational and
Appoints all members of the investment
strategic matters
committee
TRIG benefits from a right of first offer on
RES’ pipeline of assets
Tove Feld1
1. Tove Feld joined the board on 1 March 2020 29
trig-ltd.comInfraRed Capital Partners – Investment Manager
Over 25 years’ pedigree in infrastructure
Key statistics across infrastructure and real estate
London 25 year $12bn 17
(Infrastructure & track record equity funds
Real Estate) Seoul managed raised
New York (Investors)
(Infrastructure)
Hong Kong
Mexico (Real Estate)
(Infrastructure)
190+ 20+ 450+
employees languages transactions
spoken
Sydney
(Infrastructure)
4. European
Infrastructure Infrastructure Environmental Infrastructure
3. The Infrastructure
Advised the Fund I Fund II Infrastructure Fund III
Renewables Infrastructure Income Fund 4*
UK First (£125m) (£300m) 1. HICL Fund (USD1.2bn)
Infrastructure Fund V (First close: €295.4m)
government investment Infrastructure (€235m) 2. Infrastructure
on PFI in Company Ltd Yield Fund Group (TRIG) (USD1.2bn)
programme infrastructure (£2.8bn) (£490m) (£2.0bn)
199019941994 1997
1997 1998 1999
2002 2001 2005 2003 2004
2006 2006 2010
2007 2008 2009
2011 2010
2012 2011 2013
2012 2013
2017 2014 2015
2020 2016
Dates in timeline relate to launch date of each infrastructure fund. Timeline excludes InfraRed’s real estate funds. Numbers in brackets indicate size of total commitments to each of the funds in local 30
currencies, except for HICL and TRIG where numbers in brackets indicate the net asset value as at latest reporting date, 31 March 2020 for HICL and 30 June 2020 for TRIG. Fund III size net of
cancellation of c.$200m of commitments in March 2016.
Business statistics and HR statistics as at 30 September 2020. Fund size and EUM rounded to the nearest billion. Number of employees includes Hong Kong JV. trig-ltd.com
* First close of EUR 295.4m achieved on 15 October 2020. In Fund raising as of November 2020.RES – Operations Manager
38+ years experience in renewables
38 years 270+
track record projects delivered worldwide
2500+ 18GW
employees developed and/or constructed
6GW 300MW
Operational assets energy storage projects
supported
World’s largest independent renewable energy company
Operating across 10 countries globally
Complete support from inception to repowering Site services In-house technical Contracts & Commitment
& works expertise commercial to health
Class- leading Asset Management and Wind and Solar
O&M Services
& safety
31
trig-ltd.comApproach to gearing
Disciplined approach
Term Project Debt
Gearing1 TRIG’s portfolio at 30 June 2020
▲ Limited to 50% of portfolio enterprise value Project Category
typically
(Younger =Portfolio construction: power price sensitivity maintained
Incorporating subsidy free projects without increasing portfolio sensitivity
▲ Projects comprise a range of Fit, CfD and unsubsidised projects, Impact on equity return of change in power price1
with different gearing levels, across the UK, Sweden, France, -1.5% -1.0% -0.5% 0.0% 0.5% 1.0% 1.5%
Ireland & Germany
-1.1%
-1.1% Portfolio at 31 December 2018 1.1%
-1.1%
▲ Project additions shown in light blue. Power price sensitivity
varies with:
• revenue type
• gearing
• age of project
▲ Portfolio level sensitivity to power prices (shown in dark blue)
maintained demonstrating portfolio effect
-1.0%
-1.0% Portfolio at 31 December 2019 1.0%
▲ Enables a wider range of investment opportunities to be
considered, and optimisation of risk adjusted returns. NB supply
of UK ROC projects is slowing (but demand remains high)
-0.9% Portfolio at 30 June 2020 0.9%
Impact on equity return of change in power price¹
= project addition = project disposal
1. Measured as the change in IRR at year 1 for a 10% “parallel” shift in the power price forecast 33
trig-ltd.comShort-run marginal cost supply curve (merit order)
Key elements of the power price: natural gas and
Gas-fired power tends to set the marginal price carbon prices
£/MWh £/MWh
Min. Average Max.
100 Demand Demand Demand 70
60
Peaking
80
plant
50
Power price
60 40
Gas
Coal 30
40 Biomass &
20
Interconnectors
10
20
Nuclear
0
Renewables
0
-10
0 10 20 30 40 50 60 70 80
Scarcity uplift Transmission
Cumulative Capacity (GW)
Carbon price Lower marginal cost production impact
Impact of gas price
Note: Schematic only for illustration 34
trig-ltd.comKey facts
Fund Structure ▲ Guernsey-domiciled closed-end investment company Performance ▲ Dividends to date paid as targeted for each period
▲ NAV per share at 30 June 2020 of 113.0p
Issue / Listing ▲ Premium listing of ordinary shares on the Main Market of
▲ Market Capitalisation c. £2.2bn at 30 June 2020
the London Stock Exchange (with stock ticker code TRIG)
▲ Annualised shareholder return1,4 9.3% since IPO
▲ FTSE-250 index member
▲ Launched in July 2013
Key Elements ▲ Geographic focus on UK, Ireland, France and Scandinavia, plus
Return Targets1 ▲ Quarterly dividends with a target aggregate dividend of of Investment selectively other European countries where there is a stable
6.76p per share for the year to 31 December 2020 Policy / Limits renewable energy framework
▲ Attractive long term IRR2 ▲ Investment limits (by % of Portfolio Value at time of acquisition)
o 65%: assets outside the UK
Governance / ▲ Independent board of 5 directors
Management o 20%: any single asset
▲ Investment Manager (IM):
InfraRed Capital Partners Limited (authorised and o 20%: technologies outside wind and solar PV
regulated by the Financial Conduct Authority)
o 15%: assets under development / construction
▲ Operations Manager (OM):
Renewable Energy Systems Limited
▲ Management fees: 1.0% per annum of the Adjusted Gearing / ▲ Non-recourse project finance debt secured on individual assets or
Portfolio Value³ of the investments up to £1.0bn (with 0.2% Hedging groups of assets of up to 50% of Gross Portfolio Value at time of
of this paid in shares), falling to (with no further elements acquisition
paid in shares) 0.8% per annum for the Adjusted Portfolio
Value above £1.0bn, 0.75% per annum for the Adjusted ▲ Gearing at fund level limited to an acquisition facility (to secure
Portfolio Value above £2.0bn and 0.7% per annum the assets and be replaced by equity raisings) up to 30% of Portfolio
Adjusted Portfolio Value above £3.0bn; fees split 65:35 Value and normally repaid within 1 year
between IM and OM ▲ To adopt an appropriate hedging policy in relation to currency,
▲ No performance or acquisition fees interest rates and power prices
▲ Procedures to manage any conflicts that may arise on
acquisition of assets from funds managed by InfraRed
1. Past performance is no guarantee of future returns. There can be no assurance that targets will be met or that the Company will make 35
any distributions, or that investors will receive any return on their capital. Capital at risk.
2. The weighted average portfolio discount rate (7.0% at 30 June 2020) adjusted for fund level costs gives an implied level of return to investors from a theoretical
trig-ltd.com
investment in the Company made at NAV per share. 3. As defined in the Annual Report. 4 Total shareholder return on a share price plus dividends basis.Contacts
Investment Manager Other Advisers
InfraRed Capital Partners Limited Administrator / Company Secretary Registrar
Level 7, One Bartholomew Close,
Barts Square, Aztec Financial Services (Guernsey) Ltd Link Asset Services (Guernsey) Ltd
London, EC1A 7BL East Wing Mont Crevelt House
Trafalgar Court Bulwer Avenue
+44 (0)20 7484 1800
Les Banques St. Sampson
Key Contacts: Guernsey Guernsey
Richard Crawford (Fund Manager) richard.crawford@ircp.com GY1 3PP GY1 1WD
Phil George (Portfolio Director) phil.george@ircp.com
Email Contact: Helpline:
triginfo@ircp.com www.ircp.com Chris Copperwaite 0871 664 0300
+44 (0) 1481 748831 or +44 20 8639 3399
Laura Dunning
+44 (0) 1481 748866
Operations Manager
Renewable Energy Systems Limited Joint Corporate Broker Joint Corporate Broker
Beaufort Court
Egg Farm Lane Investec Bank plc Liberum Capital Limited
Kings Langley 30 Gresham Street Ropemaker Place
Hertfordshire WD4 8LR London EC2V 7QP 25 Ropemaker Street
London EC2Y 9LY
+44 (0)1923 299200
Contact: Contact:
Key Contacts: Lucy Lewis Chris Clarke
Jaz Bains jaz.bains@res-group.com +44 (0)20 7597 5661 +44 (0)20 3100 2224
Chris Sweetman chris.sweetman@res-group.com
www.res-group.com
36
trig-ltd.comYou can also read