2020 Interim Result Market Briefing - 10 August 2020 - Bell Direct
←
→
Page content transcription
If your browser does not render page correctly, please read the page content below
2020
Interim
Result

Market Briefing
10 August 2020

The GPT Group
           acknowledges the Traditional
            Custodians of the lands on
              which our business and
               assets operate, and
             recognises their ongoing
            connection to land, waters
                 and community.

            We pay our respects to First
            Nations Elders past, present
                  and emerging.

Artwork created by Molly Wallace
Agenda
                      Half Year Review | Bob Johnston                              4

                      Financial Summary & Capital Management | Anastasia Clarke    9

                      Office & Logistics | Matthew Faddy                          13

                      Retail | Chris Barnett                                      30

                      Funds Management, Sustainability & Outlook | Bob Johnston   36

Interim Result 2020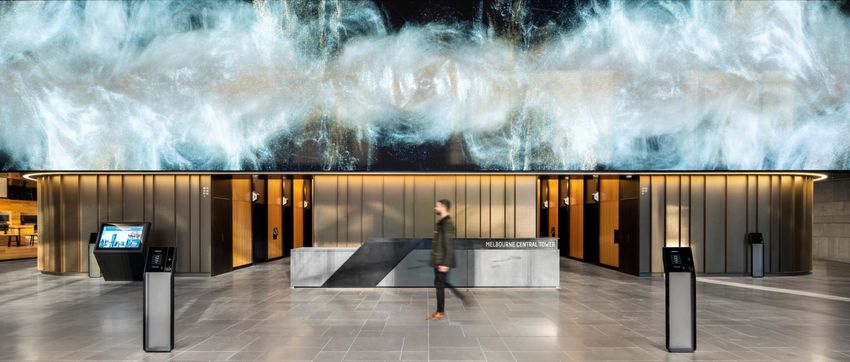
Well          January & February 2020
                  GPT maintained the strong momentum from 2019
    Placed        +   Guidance for FFO per security (FFOps) & Distribution per security (DPS) growth of 3.5%
    to manage     +   High quality diversified portfolio with capital allocation focused on growing our logistics
                      portfolio and development pipeline expected to enhance returns and growth
    through the   +   Strong capital position and liquidity to fund growth initiatives
    pandemic
                  From March 2020
                  The operating environment became significantly more challenging
                  +   Guidance was withdrawn for FFOps and DPS growth
                  +   Health and safety of our people, our customers and our communities was paramount
                      Increased safety measures to specifically address COVID-19
                  +   Amended distribution policy to align with free cash flow, targeting a payout ratio of 95 to
                      105 per cent
                  +   Prudent capital management and strong liquidity position further reinforced with deferral of
                      development projects and non-essential capital expenditure
                  +   Implemented initiatives to reduce on-going operating costs
                  +   Engaged with industry bodies and the Government on the commercial tenancy
                      ‘Code of Conduct’ and proactively engaged with tenants to begin negotiations

                  While we are dealing with the COVID-19 pandemic we are simultaneously preparing
                  for the recovery and focused on the future
                  +   Our high quality diversified portfolio, integrated management platform and optimal capital structure
                      positions us well for the future
                  +   Remain focused on growing our logistics portfolio
                  +   Pipeline of attractive development opportunities when market conditions improve

4                                                                                                     The GPT Group 2020 Interim Result | 10 August 2020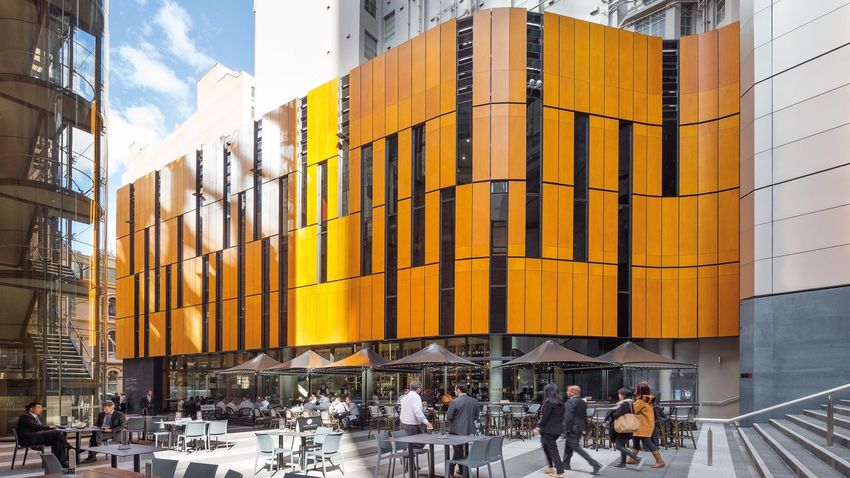
2020 Interim Result

       Financial Summary

         12.55CPS 9.30CPS                                                                                              $5.52                  (0.1)%
                       FFO                                                DISTRIBUTION                                       NTA                 TOTAL
                  PER SECURITY                                            PER SECURITY                                  PER SECURITY            RETURN1

              Investment Portfolio
                     Portfolio
                                                                         98.1%                                         Assets Under          $24.5B
                     occupancy                                                                                         Management

                     Weighted Average                                                                                  Weighted Average
                     Lease Expiry                                   4.9 YRS                                            Capitalisation Rate   5.00%
         1.   Total Return is defined as the change in Net Tangible Assets (NTA) per security plus distributions per
              security declared over the year, divided by the NTA per security at the beginning of the year.
                                                                                                                                                                           50 Old Wallgrove Road, Eastern Creek

5                                                                                                                                                    The GPT Group 2020 Interim Result | 10 August 2020 5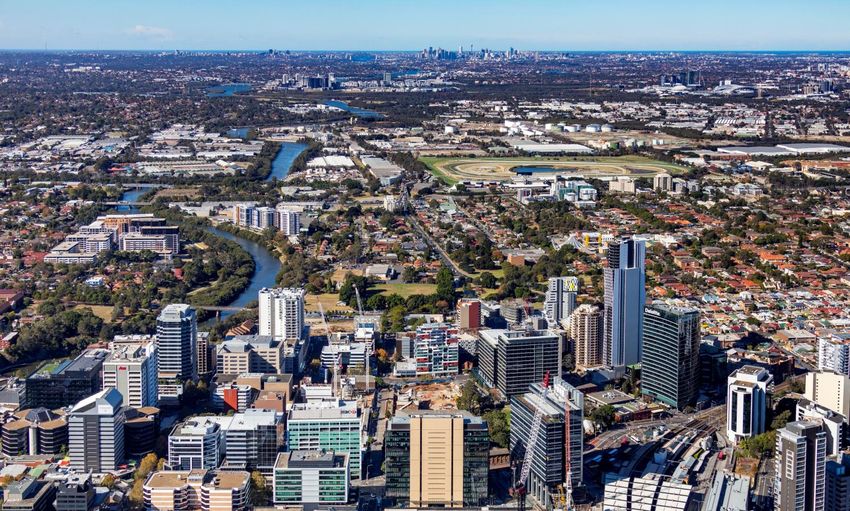
Reviewing the Half Year

                                   Office                                        Logistics                                             Retail
    1 January   +   Positive fundamentals with low vacancy       +   Occupancy at 98.6% and 38,500sqm of        +   Positive retail sales momentum with Total
                    rates and manageable supply outlook              leasing completed                              Centre sales growth of 3.0% and
    to          +   Occupancy at 97.5% and 27,600sqm of          +   Growing through acquisitions and               Combined Specialty sales growth of 3.9%
    mid-March       leasing completed                                development, completing 3 new facilities       in the first two months of 2020
                +   Slowing in market rental growth rates            and acquiring 2 new assets                 +   Specialty sales of $11,489psqm as at
                    anticipated                                  +   Low market vacancy rates and strong            February 2020
                +   Good progress on 32 Smith Street                 demand from occupiers and investors        +   Centre foot traffic in-line with prior year in
                                                                                                                    January and February

    Mid-March   +   Attendance rates declined significantly as   +   Occupancy increased to 99.8% at 30 June    +   Measures to contain the spread of COVID-
                    tenants implemented                          +   Progressing development pipeline with 2        19 resulted in lower levels of foot traffic and
    to              work-from-home arrangements                      projects underway                              a reduced number of stores trading
    30 June     +   Increase in sub-lease space and tenant       +   Early re-zoning of Kemps Creek precinct    +   Developments at Rouse Hill and Melbourne
                    leasing decisions being delayed              +   Investment demand remains competitive          Central deferred
                +   32 Smith Street remains on-track                                                            +   Significant reduction in cashflow while
                +   Deferred 300 Lonsdale Street development                                                        negotiations underway
                                                                                                                +   91% of stores open in June

6                                                                                                                        The GPT Group 2020 Interim Result | 10 August 2020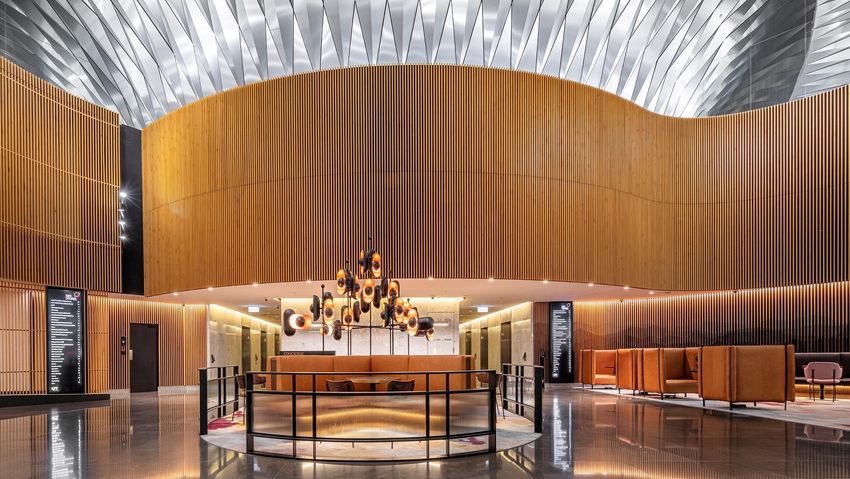
COVID-19 Tenant Negotiations
    +    Commercial tenancies Code of Conduct was legislated in each state and territory requiring landlords to provide rent relief
         to qualifying tenants impacted by COVID-19 for a period of up to six months
    +    Relief has also been provided to certain tenants not eligible for assistance under the Code of Conduct materially impacted
         by COVID-19
    +    Rent collection rates for Q2 averaged 67% with retail the most impacted with collections of 36%
              -    July collection rate of 81%
    +    Tenant negotiations advanced – all deals are bespoke and on a case-by-case basis
    +    Prudent approach taken on assumptions for rent waivers and provisioning for completed deals and deals yet to be finalised

     Rent
                                 Office                   Logistics                    Retail                     Total
     Collection
                                                                                                                           $539m

     Quarter 1                     99%                      100%                        90%                        95%

     Quarter 2                     94%                       98%                        36%                        67%

     1H 2020                       97%                       99%                        63%                        81%

                                                                                   Provisions for
                                   Deals                   Tenant rent                                             Total
     Sector                                                                         receivables
                                  agreed1                 waivers ($M)2                                            ($M)
                                                                                       ($M)3
                                                                                                                                             $101m        ($52m)
     Office                         50%                         $8.0                      $1.6                     $9.6
                                                                                                                                   ($438m)                               ($35m)
     Logistics                      77%                         $0.8                      $0.7                     $1.5                                                                  $13m

     Retail                         26%                        $42.8                     $32.7                     $75.5                                            2             3

     Total                          32%                        $51.6                     $35.0                     $86.6

    1.   As at 3 August for the managed portfolio
7   2.   Total rent waivers include agreed deals and estimates for deals yet to be completed for the 6 months to 30 June                             The GPT Group 2020 Interim Result | 10 August 2020
    3.   Provisions relate to uncollected rent not waived for the 6 months to 30 June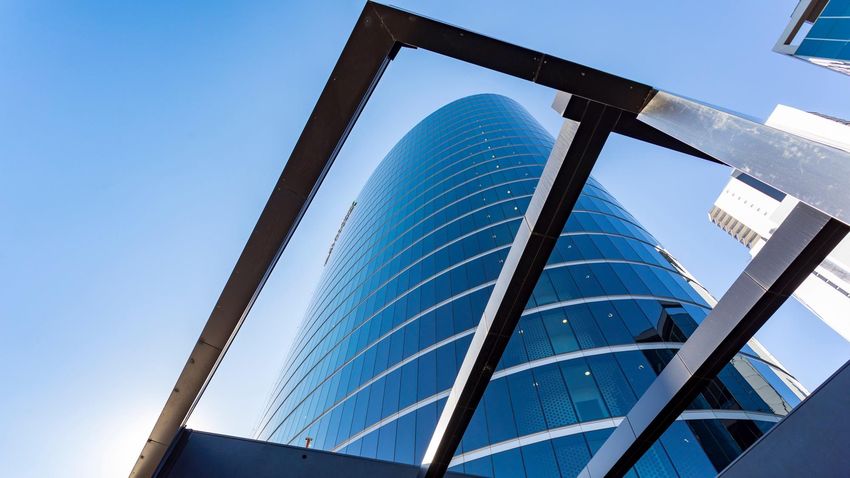
Valuations & COVID-19 Impact

                                                                     Office                                                                                Logistics                                            Retail
    Valuation
    change                                                           -1.7%1                                                                                 +2.3%                                             -10.5%1

    Cap rates                        +    Unchanged at 4.85%                                                                  +    Firmed by 11 basis points to 5.29%                   +   Softened by 15 basis points to 5.04%

    Discount rates                   +    Firmed by 9 basis points to 6.32%                                                   +    Firmed by 22 basis points to 6.39%                   +   Firmed by 27 basis points to 6.35%

    Market rents &                   +    Market rents unchanged                                                              +    Market rents unchanged                               +   Market rents lowered by 130 basis points
                                     +    10-year average market rent growth reduced 40                                       +    10-year average market rent growth remains largely   +   10-year average market rent growth reduced 58
    growth rates                          basis points to 3.3%                                                                     unchanged at 3.0%                                        basis points to 2.74%

                                     +    Average incentive on current vacancy increased by
    Leasing
                                          400 basis points                                                                    +    Allowances have been increased to account for        +   Equivalent incentive increased by 600 basis points
                                     +    Average downtime on current vacancy increased by                                         short term leasing risk                              +   Equivalent downtime increased by 2.2 months
                                          3.4 months

    COVID-19
                                     +    0.2% of portfolio value                                                             +    0.1% of portfolio value                              +   1.7% of portfolio value
    allowance

          1. Reflects change in value of directly owned assets plus the change in equity value of the Group’s investment in the relevant wholesale fund.
8                                                                                                                                                                                                The GPT Group 2020 Interim Result | 10 August 2020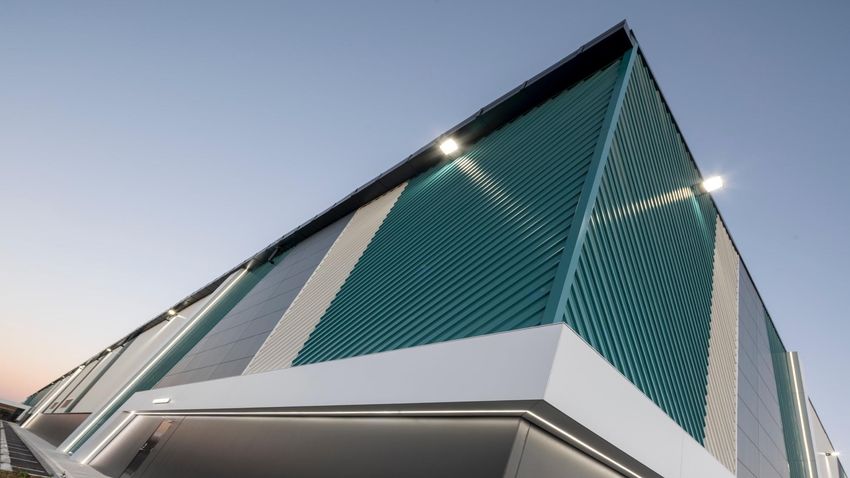
Finance &
Treasury

Interim Result 2020
Financial Summary

     6 Months to 30 June ($ million)               2020     2019     Change

     Funds From Operations (FFO)                   244.5    295.9    (17.4%)

       Valuation (decreases)/increases            (711.3)   130.8
                                                                               $519.1M
                                                                               STATUTORY NET LOSS
                                                                               AFTER TAX
       Treasury instruments marked to market       (51.5)   (82.3)

       Other items                                  (0.8)     8.2

     Net (Loss) / Profit After Tax                (519.1)   352.6              9.3 CENTS
                                                                               DISTRIBUTION PER
     Funds From Operations (cents per security)    12.55    16.36    (23.3%)   SECURITY

     Operating Cash Flow                           204.1    272.0    (25.0%)
                                                                               99.6%
                                                                               OF FREE CASH FLOW
     Free Cash Flow                                182.0    205.9    (11.6%)
       `

     Distribution (cents per security)              9.30    13.11    (29.1%)

10                                                                                 The GPT Group 2020 Interim Result | 10 August 2020
Segment Result & Free Cash Flow
6 Months to 30 June
2020 2019 Change Comments
($ million)
Income & fees reduced 37%; property cost savings 13%; COVID rent impact
Retail 79.2 157.3 (49.7%) of $75.5m
Contribution from acquisition of Darling Park; offset by dilution in GPT’s co-
Office 139.9 138.7 0.9% ownership stake in GWOF; COVID rent impact of $9.6m
Logistics 64.4 57.1 12.8% Contribution from acquisitions and developments fully leased on completion
Growth from GWOF acquisitions and developments partially offset by
Funds Management 24.2 22.7 6.6% devaluations in GWSCF
Finance Costs (49.1) (59.5) (17.5%) Cost of debt 3.1%, saving 70bps on comparable 1H19
Bonus schemes cancelled, discretionary cost savings and JobKeeper
Corporate (14.1) (20.4) (30.9%) received
Funds From Operations 244.5 295.9 (17.4%)
Maintenance capex (18.5) (30.8) (39.9%) Reduction and deferral of discretionary capex
Lease incentives (28.9) (23.0) 25.7% Increase due to successful leasing in Office and Logistics portfolio
Adjusted Funds From Operations 197.1 242.1 (18.6%)
11 The GPT Group 2020 Interim Result | 10 August 2020Capital Management Domestic
CPI bank
Bonds debt Foreign
+ Modest gearing of 25.1% Sources of
2% 2% bank
debt
+ Liquidity in excess of $1.2 billion which fully funds all
Drawn
17%
current commitments until 2023 Secured
bank debt
+ In February, issued $300 million 12-year debt in the Debt USPP
41% Bank Debt 2%
domestic MTN market at margin of 160 basis points As at 30 June 2020 21% Commercial
+ Prior to COVID-19, extended $1.2 billion of bank Debt Capital Paper
4%
facilities by an average of 1.5 years Markets
79%
+ Hedging at 86% over the next 12 months
+ S&P A (stable) and Moody’s A2 (stable) credit ratings Domestic
MTNs
Foreign MTNs 25%
7%
Key Statistics Jun 2020 Dec 2019
Debt 600
$1.2b
Net tangible assets per security $5.52 $5.80 Maturity 500
liquidity
Net gearing 25.1% 22.1% Profile 400
$ millions
As at 30 June 2020
Weighted average cost of debt 3.1% 3.6% 300
Weighted average term to maturity 7.8 years 7.7 years 200
Interest cover ratio 6.0x 6.7x 100
Credit ratings (S&P / Moody’s) A / A2 A / A2 0
1H 2H 1H 2H 1H 2H 1H 2H 1H 2H 1H 2H 1H 2H 1H 2H 1H 2H 1H 2H 1H 2H 1H 2H 1H 2H 1H 2H 1H 2H
2020 2021 2022 2023 2024 2025 2026 2027 2028 2029 2030 2031 2032 2033 2034
CPI Bonds US Private Placements Medium Term Notes Drawn Bank Facilities Undrawn Bank Facilities
12 The GPT Group 2020 Interim Result | 10 August 2020Office & Logistics Interim Result 2020
Office Highlights
Portfolio Size &
Geographic Exposure
1.2%
OPERATIONS
97%
RENT COLLECTED
5.2years
OFFICE WALE
NET INCOME 1H 2020 (BY INCOME)
GROWTH
Office Retail
$5.7bn
$6.1bn
Key Highlights Sydney 59%
Melbourne 32%
Brisbane 9%
+ Operations Net Income of $139.4 million, with fixed rent increases and portfolio
composition changes partially offset by lower occupancy and COVID-19 rental assistance
and provisions
+ Office occupancy of 94.4%¹ and Office WALE of 5.2 years¹
+ Collection rates remain high, reflecting diversity and quality of customer base Logistics
+ Office valuations moderated by 1.7%, WACR of 4.85% $2.6bn
+ High quality, modern portfolio of new or recently refurbished assets, well placed to
respond to evolving trends
1. Excludes Queen & Collins (undergoing redevelopment), 32 Flinders Street (currently configured as a carpark) and
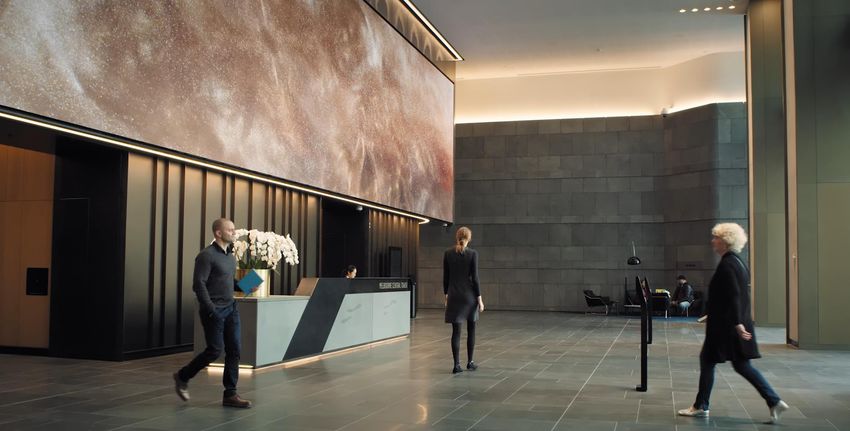
87-91 George Street (held for development) Melbourne Central Tower
14 The GPT Group 2020 Interim Result | 10 August 2020Office Return to Workplace
+ Office assets remained open throughout the period,
with some shared facilities within our assets closed in
accordance with government directives
+ A range of measures have been employed across the
COMMON AREA
CLEANING
LIFT MONITORING
& MANAGEMENT
ENTRY/EXIT
MANAGEMENT
HAND SANITISER
STATIONS
business and asset operations to support our tenants in
returning to the office, including:
- Increased cleaning frequency
- Air-conditioning systems maximising fresh air
volumes
TENANCY CONCIERGE SOCIALLY END OF TRIP
- Monitoring and management of lift capacities CLEANING SUPPORT &
ASSISTANCE
DISTANCED
SEATING
HYGIENE
& MANAGEMENT
- Wayfinding and introduction of social distancing
signage
+ Working with customers to conclude temporary rental
relief arrangements related to COVID-19
LOBBY & VISITOR PARKING COVID-19 SUPPORTING
MANAGEMENT AVAILABILITY CASE SIGNAGE
MANAGEMENT & MATERIALS
15 The GPT Group 2020 Interim Result | 10 August 2020Office Leasing & Market Update
Office Leasing Market Update
1H 2020 Leasing: + Increased vacancy with softer demand and new supply
+ Signed leases totalling 37,800sqm concluded with an additional 19,600sqm of resulted in back-fill vacancy and increased levels of sublease
Heads of Agreement (HoA) space
+ Renewals concluded with McMillan Shakespeare, ShineWing and Salesforce Prime Vacancy 2Q 2020 10 year Average
Sydney CBD 7.0% 8.1%
2H 2020 Leasing:
+ Conversion of 1H 2020 heads of agreement to signed leases of 15,600sqm
Melbourne CBD 7.5% 6.2%
+ Heads of agreement of 27,100sqm in July 2020 Brisbane CBD
Source: JLL Research
11.0% 9.3%
Vacancy by Area As at June 2020 Including July 2020 HoA¹ + Recovery in job ads a forward indicator of demand
Uncommitted Vacancy² 5.6% 4.2% Daily SEEK Job Ads - Australia
Lease Expiry by Income As at June 2020 Including July 2020 HoA¹
2020 2% 1%
2021² 10% 8%
Leasing Strategy:
+ Virtual marketing to showcase space without the need for physical inspection,
including virtual reality
+ Increased engagement with customers across the portfolio
+ Occupant user surveys to understand return to the office plans
+ Proactively focused on securing renewals, minimising downtime
1. Includes heads of agreement post balance date
2. Excludes expected development completions of 32 Smith Street, Parramatta and Queen & Collins, Melbourne
16 The GPT Group 2020 Interim Result | 10 August 2020 16Office Customer Update
+ Diverse and high quality tenant base proving resilient, with strong rent collection rate of 97% for 1H 2020
+ Well managed, prime grade assets are best placed to support the safety, health and wellbeing of occupants with adaptable technology, building
management and monitoring capabilities and experienced on-site teams
Office Income by Industry¹ Lift Movements²
(5 February 2020 = 100)
Banking, 20% Information and
Communications Technology,
14% Index Sydney CBD (5 assets)
100 Melbourne CBD (4 assets)
90 Brisbane CBD (1 asset)
Insurance, 14%
80
Co-working/Serviced
offices, 3% 70
Mining & Energy,
3% 60
50
Other, 7%
40
30
Legal, 12%
Government, 7% 20
10
Other Business Services, 9% Accounting & Finance, 10% 0
18 Mar
1 Apr
15 Apr
29 Apr
5 Feb
19 Feb
4 Mar
27 May
13 May
8 Jul
10 Jun
24 Jun
22 Jul
1. Reflective of office tenants, including signed leases commencing after the balance date
2. Lift calls each Wednesday during period across 10 assets. Reduced lift car capacities implemented in mid-June
17 The GPT Group 2020 Interim Result | 10 August 2020 17Evolution of Office
+ High quality, adaptive workplaces will remain a relevant and important part of high performing businesses
+ Culture and collaboration are best fostered face-to-face in communal spaces
+ Office space design and agile working practices are likely to evolve with the need for physical distancing
Corporate Culture 89% believe office will remain a necessity for Workspace Configuration
Fostered & enhanced corporate organisations Potential for space & usage changes
together in shared spaces – Savills Office FiT Survey with need for physical distancing
3:1 people in favour of the office for personal growth Business Building & Innovation 84% miss the social connection and face-to-
18-24 year olds are likely to Creative & collaborative activities face interaction they get from
prefer working in the office to help to learn, be seen, most effective & productive in face- their colleagues in the office
network and collaborate – Bates Smart, Remote Working Survey
– Savills Office FiT Survey
to-face in groups
“Even with a highly distributed workforce, we’ll need a
place to come together.”
Flexibility & Hub/Spoke
Education & Learning
“Now we can design this space especially for these Increased work from home, use of on-
Opportunities to gain knowledge, new ways of working.”
demand space & potential for
working with & near colleagues - Scott Farquhar, Atlassian, in relation to new Sydney
headquarters (AFR 25 June 2020) “distributed workforce”
18 The GPT Group 2020 Interim Result | 10 August 2020 18Sydney Metropolitan Office Update
+ Greater Western Sydney has the third largest economy in Australia and is forecast to grow to 3 million people by 2036 1
+ Sydney Metropolitan Office markets are expected to benefit from occupiers considering hub/spoke model post COVID-19
+ Office portfolio is ~10%2 weighted to Sydney Metropolitan markets, to be increased through development pipeline
87-91 GEORGE STREET 4 MURRAY ROSE AVENUE
Development site acquired, SYDNEY
funded through GWOF CBD Occupancy of 97.1%
Potential for 30,000 – 75% occupied by NSW
75,000sqm tower Government entities
60 STATION STREET
Acquired in 2018
Blue chip occupiers
including Deloitte & NSW
32 SMITH STREET
Government
26,400sqm tower due for PARRAMATTA
completion in January CBD Occupancy of 100%
2021
64% leased including
terms agreed
1. Western Sydney University (https://www.westernsydney.edu.au/rcegws/rcegws/About/about_greater_western_sydney)
2. Inclusive of 32 Smith Street underway
19 The GPT Group 2020 Interim Result | 10 August 2020 19Office Development Pipeline
+ 32 Smith Street is progressing well and is due for completion in January
Artists impression
2021
+ Pipeline of development opportunities within the existing portfolio,
progressing planning and approval processes
+ Expected end value of pipeline projects in excess of $3.5 billion¹
Ownership Status Comment²
32 Smith Street 64% leased including terms agreed, QBE anchoring with
100% GPT Underway
Parramatta, NSW 51% of tower
Queen & Collins Refurbishment including restoration of heritage aspects
100% GWOF Underway
Melbourne, VIC and creation of a distinctive ground floor plane
Cockle Bay Park, Sydney 32 Smith Street, Parramatta
87-91 George Street Site acquired in 1H 2020, with potential for ~30,000 –
100% GWOF Pipeline
Parramatta, NSW ~75,000sqm tower
Cockle Bay Park 25% GPT / Office comprising ~63,000sqm plus ~10,000sqm
Pipeline
Sydney, NSW 50% GWOF retail/entertainment precinct
Cnr of George & Bathurst Adjacent to 580 George Street, potential for ~6,500sqm
100% GWOF Pipeline
Sydney, NSW office extension above existing retail
300 Lonsdale Street Above Melbourne Central, potential for ~20,000sqm of
100% GPT Pipeline
Melbourne, VIC office space
51 Flinders Lane Adjacent to 8 Exhibition Street, potential for ~29,000sqm
100% GWOF Pipeline
Melbourne, VIC tower
Skygarden Adjacent to Riverside Centre, potential for ~25,000sqm Artists impression Artists impression Artists impression
100% GWOF Pipeline
Brisbane, QLD tower Queen & Collins, Melbourne 87-91 George Street, Parramatta 300 Lonsdale Street, Melbourne
1. Includes both GPT direct and Fund opportunities
2. NLAs are subject to authority approvals.
20 The GPT Group 2020 Interim Result | 10 August 2020 20Office Portfolio Resilience
5.2years 100%
OFFICE WALE PRIME ASSETS¹
(BY INCOME)
+ GPT’s portfolio is made up of prime assets attractive to high-quality
customers
+ Prime grade assets have benefited from lower vacancy and higher
rates of net absorption over the long term
+ Office WALE >5 years, with a diverse customer base including
Government, major Banks and Insurance companies, and global
business such as Amazon
+ New and recently upgraded assets with modern technology, air-
conditioning and lifting capacity well placed to respond to evolving
customer requirements
+ The benefits of a dynamic office environment cannot be fully
replicated in a work from home setting
+ Skilled workforce attracted to companies with collaborative, vibrant
and engaging environments to facilitate growth, mentoring and
creativity
+ Continuing to progress activities to unlock development pipeline
Melbourne Central Tower, Melbourne
1. Prime includes Premium and A Grade assets. Excludes 32 Flinders Street (configured as a carpark) and 87-91 George Street (development site)
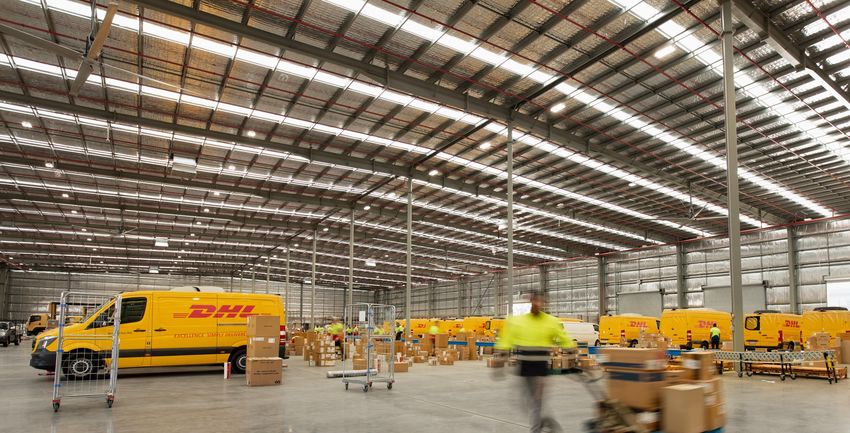
21 The GPT Group 2020 Interim Result | 10 August 2020 21Logistics Highlights
Portfolio Size &
Geographic Exposure
99.8% $55.7m 39,800sqm
PORTFOLIO VALUATION DEVELOPMENT
Office Retail
OCCUPANCY UPLIFT COMPLETIONS
$6.1bn $5.7bn
Sydney 64%
Key Highlights Melbourne 25%
Brisbane 11%
+ Operations Net Income of $64.7 million, up 13.7% on comparable period
+ High rent collection rate of 99% for 1H 2020
+ Continued portfolio growth with three developments completed and two assets acquired
growing portfolio to 1,083,100sqm Logistics
+ WALE of 6.9 years and lease expiry to December 2021 of 5.6%
$2.6bn
+ Logistics valuations uplift of 2.3% with WACR firming to 5.29%
+ Development land at Mamre Road, Kemps Creek achieved re-zoning
+ Pipeline of development projects with an expected end value of ~$1billion¹
1. Inclusive of projects underway 2 Ironbark Close, Berrinba
22 The GPT Group 2020 Interim Result | 10 August 2020Logistics Customer & Leasing
+ Occupancy increased Transport, Postal & Trade (Retail &
99.8%
PORTFOLIO
with let up of vacancies
together with addition of
fully let development
Warehousing
Toll
Wholesale)
Coles
completions and
OCCUPANCY acquisitions Rand Transport Australian
+ Completed 118,300sqm TNT 30% 35%
Pharmaceutical
Industries
of signed leases with an DHL
Unilever
additional 8,700sqm at
>70% Portfolio
Linfox
terms agreed Super Retail Group
Schenker
+ Introduction of new Income Woolworths
ASX LISTED / tenants into the portfolio by Industry Wesfarmers
GLOBAL ENTITIES including DHL & JB Hi-Fi JB Hi-Fi
Other 12% Manufacturing
6.9years
WALE (BY INCOME)
Vodafone Hutchison
QBE
23%
IVE Group
Pact Group
Computershare Goodman Fielder
Infrabuild
23 The GPT Group 2020 Interim Result | 10 August 2020Evolution of Logistics
+ Acceleration in e-commerce and parcel delivery volumes, with potential for increased inventory to be held locally to provide resilience
+ Pipeline of infrastructure projects and government stimulus expected to drive economic recovery post COVID-19
+ Lower population growth in the near term, however growth expected over longer term with Australia expected to remain a destination of choice
e-commerce Australia Post reported parcel
Acceleration in e-commerce deliveries in April averaging almost
Last Mile
Consumer desire for speed
penetration with evolving consumer 2 million parcels and convenience
behaviour per day, up by 90% compared to last year1
Online accounts for US research estimates that an incremental US$1bn
Infrastructure Investment growth in e-commerce sales requires an additional
~10.7% of total retail trade Governments focused on shovel ready
in Australia, growing ~23.1% ~115,000sqm
compared to 12 months prior projects that create jobs and drive of distribution space to support this growth
investment
NAB Online Retail Sales Index, June 2020 Forrester Research, CBRE Research, 2018
In June 2020 the Federal Government committed
Supply Chain Scrutiny $1.5 billion to immediately commence “Just in Time” to “Just in Case”
Scrutiny beyond Tier 1 suppliers to work on priority infrastructure projects; with joint assessment
teams working on
Potential for increased inventory to
assess/manage exposure to risk accelerating projects worth more than provide resilience
$72 billion in public and private investment 2
1. Australia Post (https://newsroom.auspost.com.au/article/expanding-operations-and-casual-hires-to-manage-parcel-demand)
24 2. Speech to CEDA by the Hon Scott Morrison, sourced from SBS (https://www.sbs.com.au/news/scott-morrison-announces-additional-1-5-billion-towards- The GPT Group 2020 Interim Result | 10 August 2020 24
shovel-ready-projects)Logistics Portfolio Growth
$ 42.2M
$
2.6B
PORTFOLIO VALUE
8.4%
1H 2020 PORTFOLIO GROWTH
PURCHASE PRICE
23,800sqm
GLA
+ Acquired two facilities totalling $75 million and completed three 9.9years
developments totalling $89 million WALE BY INCOME
+ Valuation uplift of 2.3% with WACR firming by 11 basis points to 5.29%
1 Botero Place, Truganina 4.8%
INITIAL YIELD
+ Strong investor demand for prime logistics facilities, with volume transacted
in Q2 2020 being the second strongest on record¹
National NSW VIC QLD $ 32.4M
PURCHASE PRICE
Number of assets 40 26 9 5
Investment Portfolio² $2.4b $1.5b $0.6b $0.3b
7,200sqm
GLA
WACR 5.29% 5.17% 5.46% 5.52%
5.5years
WALE BY INCOME
Portfolio Occupancy 99.8% 100.0% 99.3% 100.0%
WALE by Income 6.9 years 7.5 years 5.1 years 7.6 years 21-23 Wirraway Drive, Port Melbourne 4.9%
INITIAL YIELD
1. Cushman & Wakefield, Marketbeat Q2 2020
2. Inclusive of assets held for sale of $103.0m; exclusive of land and assets under development of $196.3m
25 The GPT Group 2020 Interim Result | 10 August 2020 25Logistics Development Completions
39,800sqm
1H 2020 COMPLETIONS (GLA)
$89.1m
1H 2020 COMPLETIONS - VALUE
2 Ironbark Close, Berrinba, QLD 30 Ironbark Close, Berrinba, QLD 38A Pine Road, Yennora, NSW
$48.5m 5.25% $27.6m 5.63% $13.0m 5.00%
FAIR VALUE (30 JUNE 2020) CAP RATE (30 JUNE 2020) FAIR VALUE (30 JUNE 2020) CAP RATE (30 JUNE 2020) FAIR VALUE (30 JUNE 2020) CAP RATE (30 JUNE 2020)
20,600sqm 6.1% 14,400sqm 6.5% 4,800sqm 5.8%
GLA YIELD ON COST GLA YIELD ON COST GLA YIELD ON COST
4.7years Westcon (pre-lease)
9.7years DHL (pre-lease)
TENANT
5.0years JB Hi-Fi & Windoware TENANT
WALE BY INCOME WALE BY INCOME TENANT WALE BY INCOME
26 The GPT Group 2020 Interim Result | 10 August 2020 26Logistics Developments Underway
$85m
67,200sqm
UNDERWAY PROJECTS - GLA
FORECAST END VALUE
50,100sqm
GLA
2H 2020
$129m
UNDERWAY PROJECTS – EXPECTED
128 Andrews Road, Penrith, NSW
FORECAST COMPLETION
END VALUE ON COMPLETION
Artists impression
$44m
FORECAST END VALUE
+ Two projects underway in Western Sydney
+ Penrith is due for completion in 2H 2020 and is 17,100sqm
pre-leased for a 10 year term GLA
+ Glendenning is being developed on a
speculative basis, with positive leasing enquiry 1H 2021
and limited competing stock FORECAST COMPLETION
42 Cox Place, Glendenning, NSW
27 The GPT Group 2020 Interim Result | 10 August 2020 27Logistics Development Pipeline | Kemps Creek Update
+ The Mamre Road precinct achieved rezoning in June 2020
33.4ha ~$445m - Designated a warehousing industrial hub providing ~17,000 new jobs in
Western Sydney
SITE AREA EXPECTED END VALUE
ON COMPLETION - The precinct is located within the Western Sydney Employment Area and
includes site of a potential Western Sydney freight intermodal terminal
+ GPT’s 33.4ha site was acquired in 2019 on delayed settlement terms
- Land settling October 2020 - April 2021
- Expected to support approximately 160,000sqm of prime logistics space
when complete, subject to authority approvals
- Flexible configuration options with warehouses of ~19,000sqm to
~47,000sqm expected to be constructed
~10km Close proximity toLogistics Development Pipeline
~$1.0b
PIPELINE EXPECTED END VALUE¹
>500,000sqm
PIPELINE CAPACITY¹
Estimated Estimated Estimated
State Comment
Area GLA¹ End Value Delivery
Wembley Business Park, Berrinba QLD 38,200sqm $75m 2021-2022 Stage 1 & 2 delivered in 1H 2020 with 2 stages remaining
Gateway Logistics Hub, Truganina VIC 115,400sqm $169m 2021-2023 First facility delivered in 2H 2019 with 5 stages remaining
Boundary Road, Truganina VIC 128,200sqm $205m 2023+ To be delivered in multiple stages following buildout of Gateway Logistics Hub
Mamre Road, Kemps Creek NSW ~160,000sqm $445m 2022+ Located in close proximity to the future Western Sydney Airport
1. Expected end value on completion. Net of stages already delivered and inclusive of projects underway at Penrith and Glendenning (expected end value of $129 million and expected GLA of 67,200sqm). GLA subject to authority approvals.
29 The GPT Group 2020 Interim Result | 10 August 2020 29Retail Interim Result 2020
Retail Highlights

                                                                                               Portfolio Size &
                                                                                             Geographic Exposure
     98%                        91%                           $  9,910
     PORTFOLIO                   STORES OPEN                   SPECIALTY SALES
     OCCUPANCY                   AT 30 JUNE                    PRODUCTIVITY PER SQUARE    Office
                                                               METRE                      $6.1bn                                   Retail
                                                                                                                                   $5.7bn
     Key Overview                                                                                     NSW 40%
                                                                                                       VIC 45%
                                                                                                      QLD 10%
      +   Retail Segment FFO contribution of $79.2 million for 6 months to June 2020                    NT 4%
          impacted by:
            +   Lower property income due to rental assistance and provisions offset by
                savings in property expenses
            +   Reduction in fees from property income and deferment of development
                                                                                                      Logistics
                projects
                                                                                                       $2.6bn
      +   Valuation decline of 10.5% for 6 months to June 2020, and a WACR of 5.04%

                                                                                                                           Melbourne Central, Melbourne

31                                                                                                 The GPT Group 2020 Interim Result | 10 August 202031
COVID-19 Update
Portfolio Traffic and Stores Open Retailer Assistance Marketing and Communications
Update Outside of retail assets in Victoria, + Across managed portfolio, + Focused on signage and messaging to
managed portfolio demonstrating signs completed 26% of expected deals encourage shopper adherence to
of recovery: with retailers required by Code of government restrictions
As at
31 July 2020 + 95% of stores now open and trading Conduct + Targeted shopper communications via
+ Customer visitation returning with + In majority of cases preferred online platforms
traffic at 85% of 2019 levels position by retailers is not to defer + Supporting retailers with marketing
rent beyond Dec 2020 initiatives (such as Retailer Runner)
to assist driving sales
Victoria + Victoria based assets have 62% stores open with traffic numbers at 73% of 2019 levels (excluding Melbourne Central)
+ Melbourne Central impacted given reliance on CBD workers, tourists and students, with traffic averaging 15-20% of its normal
Update levels and only 37% of the stores open
As at + Finalisation of discussions with retailers regarding rental assistance may take longer given uncertainty of impacts from recent
restrictions
31 July 2020
+ Focus on providing safe environments promoting adherence to government guidelines
32 The GPT Group 2020 Interim Result | 10 August 2020Portfolio Performance
10%
Retail Sales and Traffic 0%
-10%
+ Heavily impacted from mid March through to May with government -20%
-30%
restrictions introduced -40%
+ Recovery evident from May in line with relaxation of restrictions -50%
-60%
MAT at 30 June 2020: -70%
+ Centre Sales down 10% and Total Specialty Sales down 11% -80%
Jan-20 Feb-20 Mar-20
Mar-20 Apr-20
Apr-20 May-20 Jun-20
Categories that have performed well despite conditions:
+ Supermarkets up 1.2%; Discount Department Stores up 0.3% Government
measures
Peak
COVID-19
+ Technology, Food Retail and General Retail, on average down 2.7% implemented related impacts
Categories impacted by government restrictions include: Centre Sales growth (%) Spec/Mini Majors growth (%) Traffic growth (%) Traffic growth - ex Melb Central (%)
+ Cinemas, Dining and Retail Services, average decline of 16.9% Data: Based on weighted portfolio
25% 12%
Market Share (Physical vs Online) 10%
20%
+ Government restrictions led to significant store closures and a 15%
8%
corresponding shift to online retail purchasing 6%
+ Omni-channel retailers benefited most from this shift 10%
4%
+ The result was a loss in market share across the portfolio, with sales 5% 2%
diverting to online and smaller local centres out-performing as 0% 0%
shoppers sought to limit travel movements Jan-20 Feb-20 Mar-20 Apr-20 May-20 Jun-20
+ Since late April, there has been a rebound as shoppers begin to Portfolio online leakage (%) - LHS Portfolio market share (%) - RHS
return to established shopping behaviours
Source: Quantium
33 The GPT Group 2020 Interim Result | 10 August 2020Portfolio Performance
Retail Leasing Retail Valuations
+ Whilst leasing deals have slowed over last 3 months, 173 deals + 100% of retail portfolio independently valued as at 30 June 2020
have been completed for the 6 months to June + GPT retail portfolio outcomes in line with market update in May 2020
+ Occupancy remains strong at 98.0% + WACR expanded 15 basis points, now at 5.04%
+ In conjunction with COVID-19 discussions we are addressing + Valuers have considered the Code of Conduct through short term
holdovers and imminent lease expiries rental assistance assumptions in addition to adjustments to forecast
+ New leasing deals are consistent with pre-COVID-19 conditions and growth rates, vacancy downtime and market rents
include base rent, fixed increases and structured lease terms
JUNE 2020 FAIR VALUE
CAP RATE
ASSET VALUATION ADJUSTMENT CHANGE
MOVEMENT
Portfolio Leasing Statistics ($M) ($M)
Melbourne Central $1,595.5 ($36.6) (2.3%) -
JUN 2020
Rouse Hill Town Centre $635.2 ($48.5) (7.1%) -
Portfolio Occupancy 98.0%
Sunshine Plaza (50%) $617.5 ($69.6) (10.2%) +25bps
Retention Rate 66%
Westfield Penrith (50%) $655.5 ($80.0) (10.9%) +25bps
Avg. Annual Fixed Increase1,2 4.7%
Highpoint (16.67%) $358.3 ($57.0) (13.8%) +25bps
Avg. Lease Term1,2 4.5 years
Charlestown Square $865.0 ($140.0) (14.0%) +25bps
Leasing Spread1,2 (5.2%)
Casuarina Square (50%) $207.8 ($41.6) (16.8%) +25bps
Holdovers as a % of Base Rent2 9.8%
GPT ASSETS $4,934.8 ($473.3) (8.8%)
Specialty Occupancy Cost2 19.7%
GWSCF Equity Interest (28.5%) $767.2 ($188.7) (19.9%)
TOTAL $5,702.0 ($662.0) (10.5%)
1. New leases
2. SpecialtiesPortfolio Strategy
Responding to Changing Customer Preferences GPT Portfolio Quality
+ Customers now demand convenience and during COVID have Portfolio of Leading Retail Assets
increased consumption of home delivery and online services + Melbourne Central ranked #1 with highest centre sales
+ GPT’s “Retail Runner” responds to this customer demand which also productivity 1
supports retailers to maximise sales during and post-COVID + 70% of GPT’s retail portfolio (by value) is ranked in the Top 20 in
Australia based on specialty sales productivity1
Online + GPT retail assets have an average annual sales turnover of
~$550 million
ordering
platform
Located in Quality Markets
+ Pickup from + GPT retail assets located in top 35% of Australia’s markets with
retailer or from exposure to strong population growth markets in NSW & VIC 2
a designated
“Click and
Collect” location Investment in Assets to Meet Customer Expectations
at Centre Ensuring our retail assets have responded to customer needs
+ Initially focused across retailer offer, amenity and experience
on food + 76% of portfolio has had refresh capital invested in last 5 years
retailers, with
intention to
+ Re-mixed to growth categories with over 530 new retailers
introduced to portfolio over last 5 years
expand to other
retail categories
1. Source: Shopping Centre Industry Big Guns – March 2020
2. The quality of the market is evaluated across 320 different “SA3” market regions, weighted across
35 Population Growth, Household Income, Retail Expenditure and Retail Supply
The GPT Group 2020 Interim Result | 10 August 2020Funds Management Interim Result 2020
Funds Management
                                                                                                    Funds Management
                                                                                                    Financial Summary ($M)
     $   12.8B 6.6%
     ASSETS UNDER                     EARNINGS
                                                                    $  289M
                                                                    NEW EQUITY                     Segment                   2020            2019          CHANGE
     MANAGEMENT                       GROWTH                        RAISED IN GWOF                 Result
                                                                                                                           24.2            22.7             6.6%

                        GPT Wholesale Office Fund                                               GPT Wholesale Shopping Centre Fund

     +   Well positioned with a high quality portfolio and 14.6% net gearing         +   Performance impacted by portfolio devaluations
     +   Raised $289 million of new equity with five new investors participating     +   Near-term focus on pandemic response and positioning for
     +   Expanded development pipeline to an estimated end value of                      subsequent recovery
         approximately $3 billion with the George Street, Parramatta,                +   High quality portfolio of assets with mixed use opportunities over the
         acquisition                                                                     longer term
     +   Over $1 billion of debt capacity to fund organic development pipeline       +   Prudent capital management
         or new acquisition opportunities                                                    - Net gearing 28.4%
     +   On-track to achieve Carbon Neutral certification for the portfolio in               - Next maturity in September 2022
         2020                                                                                - Distribution payout ratio reduced
     +   Next investor liquidity event in July 2026
                                                                                     +   Next investor liquidity event in March 2027

37                                                                                                                                  The GPT Group 2020 Interim Result | 10 August 202037
Sustainability
+ GPT is bringing forward its Carbon Neutral portfolio commitment to 2024 (previously 2030)
- GWOF remains on-track to achieve its carbon neutral target by the end of 2020
+ The Group’s target covers all GPT managed assets
+ Launched our inaugural Climate Disclosure Statement in February and our new Sustainability Report
in May 2020
- These reports demonstrate GPT’s commitment to embedding sustainability and governance
principles in our day-to-day operations
38 The GPT Group 2020 Interim Result | 10 August 2020Responding near-term | Long-term growth
Well positioned for forecast economic conditions
+ Near-term economic and community conditions present challenges
+ Strong balance sheet with low gearing and high level of liquidity
+ High quality diversified portfolio with a focus on growing our Logistics exposure
Attractive pipeline of development opportunities in key sectors
+ 32 Smith Street progressing well and on track for completion
+ Logistics development pipeline a key source of growth with an estimated end value of ~$1 billion
+ Progressing Cockle Bay Park detailed planning
Clear strategic priorities
+ Progress delivery of Logistics development pipeline
+ Complete COVID-19 tenant negotiations
+ Strong focus on leasing and asset management
+ Leading the way with Carbon Neutral 2024 commitment
39 The GPT Group 2020 Interim Result | 10 August 2020Thank you for joining us Questions
Disclaimer

     The information provided in this presentation has been prepared by The GPT Group comprising GPT RE Limited (ACN 107 426 504) AFSL (286511), as
     responsible entity of the General Property Trust, and GPT Management Holdings Limited (ACN 113 510 188).
     The information provided in this presentation is for general information only. It is not intended to be investment, legal or other advice and should not be relied
     upon as such. You should make your own assessment of, or obtain professional advice about, the information in this presentation to determine whether it is
     appropriate for you.
     You should note that returns from all investments may fluctuate and that past performance is not necessarily a guide to future performance. While every
     effort is made to provide accurate and complete information, The GPT Group does not represent or warrant that the information in this presentation is free
     from errors or omissions, is complete or is suitable for your intended use. In particular, no representation or warranty is given as to the accuracy, likelihood of
     achievement or reasonableness of any forecasts, prospects or returns contained in this presentation - such material is, by its nature, subject to significant
     uncertainties and contingencies. To the maximum extent permitted by law, The GPT Group, its related companies, officers, employees and agents will not be
     liable to you in any way for any loss, damage, cost or expense (whether direct or indirect) howsoever arising in connection with the contents of, or any errors
     or omissions in, this presentation.
     Information is stated as at 30 June 2020 unless otherwise indicated.
     All values are expressed in Australian currency unless otherwise indicated.
     Funds from Operations (FFO) is reported in the Segment Note disclosures which are included in the financial report of The GPT Group for the 6 months
     ended 30 June 2020. FFO is a financial measure that represents The GPT Group’s underlying and recurring earnings from its operations. This is determined
     by adjusting statutory net profit after tax under Australian Accounting Standards for certain items which are non-cash, unrealised or capital in nature. FFO
     has been determined based on guidelines established by the Property Council of Australia. A reconciliation of FFO to Statutory Profit is included in this
     presentation. Key statistics for the Retail and Office divisions include GPT Group’s weighted interest in the GPT Wholesale Shopping Centre Fund (GWSCF)
     and the GPT Wholesale Office Fund (GWOF) respectively.

41                                                                                                                                         The GPT Group 2020 Interim Result | 10 August 2020
You can also read