BAJA SAE - University of Colorado Boulder 2020-2021
←
→
Page content transcription
If your browser does not render page correctly, please read the page content below
BAJA SAE

University of Colorado Boulder
           2020-2021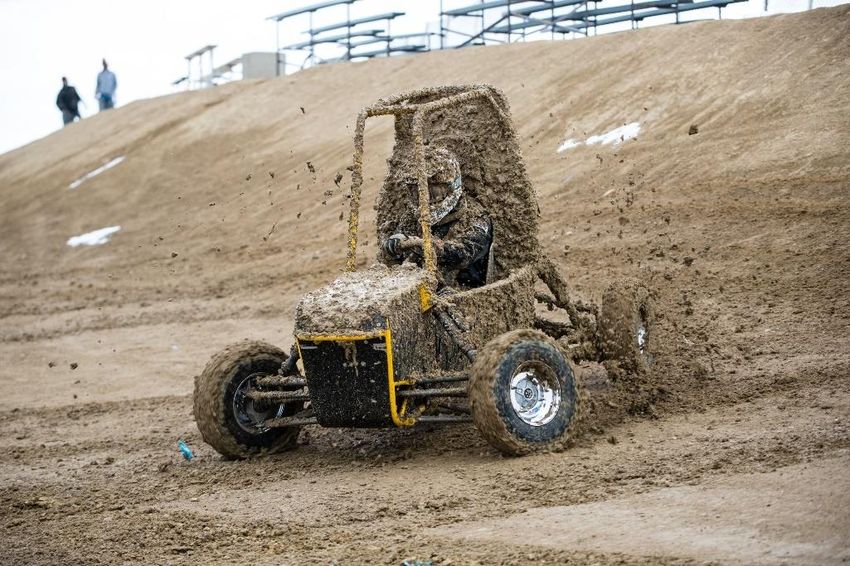
1

Table of Contents
Introduction .............................................................................................................................. 2
Chassis ...................................................................................................................................... 2
   Introduction .......................................................................................................................... 2
   Testing ................................................................................................................................... 2
   FEA Analysis on Chassis ........................................................................................................ 3
   Redesign ............................................................................................................................... 3
Controls .................................................................................................................................... 4
   Introduction .......................................................................................................................... 4
   Electrical System................................................................................................................... 4
   Pedals.................................................................................................................................... 5
   Brakes .................................................................................................................................... 5
   Manufacturing & Assembly ................................................................................................. 6
Drivetrain .................................................................................................................................. 6
   Introduction .......................................................................................................................... 6
   Testing ................................................................................................................................... 7
   Transfer Case and Differentials ........................................................................................... 8
Suspension ................................................................................................................................ 9
   Background .......................................................................................................................... 9
   Front Suspension ................................................................................................................... 9
   Rear Suspension ................................................................................................................... 9
   Testing ................................................................................................................................... 9
   Manufacturing.....................................................................................................................12
Conclusion ..............................................................................................................................13
Contact Information...............................................................................................................14
Additional Photos ...................................................................................................................15
2

Introduction                                             Chassis
Baja SAE is an international competition organized       Introduction
by the Society of Automotive Engineers (SAE)             The chassis sub team focused primarily on ensuring
where collegiate teams design, build, and race           the vehicle would pass technical inspection during
single-seat off-road vehicles. The CU Boulder team       competition in the physical validation event. This
consists of 14 mechanical engineering seniors who        included manufacturing any required components
are driven by their passion for automotive               that were left out of the 2019 - 2020 prototype and
engineering and their desire for a technically           adjusting existing components to meet required SAE
challenging, capstone design project.                    specifications. They also improved the overall
With critical University resources limited due to the    aesthetics of vehicle exterior and maintained optimal
COVID-19 virus, this year’s Baja SAE team opted to       system integration with the chassis.
test and optimize an already-manufactured four-          The chassis team also conducted finite element
wheel drive vehicle completed by last year’s team.       analysis (FEA) on load bearing chassis members to
This was a completely new design challenge to the        validate studies completed by last year’s team. This
CU Boulder Baja program this year and allowed our        was meant to address the need for additional
team to complete a comprehensive testing and             chassis members in areas of high loading from the
analysis program on all subsystems. The program          suspension and to reduce bending in those
aimed to gather information on areas of lost             members.
performance to inform our redesigns of critical
subsystems, while conforming to the regulations and      Testing
constraints set by the Baja SAE rulebook.                The chassis sub team carried out testing using strain
                                                         gauges to measure the amount of force experienced
Overall, the goal of the year was to prepare the
                                                         by the suspension mounting members in the vehicle
vehicle for competition in the in-person SAE
                                                         frame. These members were chosen for testing
Validation event held in Tucson, Arizona where our
                                                         because they mainly experienced bending loads
team would race head-to-head against other
                                                         from the suspension, with the member supporting
collegiate Baja SAE programs. The vehicle must be
                                                         the front suspension being of particular concern as it
able to excel in a variety of dynamic events such as
                                                         was entirely in bending from the front shock.
a suspension challenge, maneuverability course, hill
climb/sled pull, and a 4-hour endurance race. In
tandem with the validation event, our team
competed in the virtual SAE Knowledge events.
While these events were held on-site at the
validation event in years past, these online events
tested our team’s overall knowledge of the
engineering and design of the vehicle, quality of cost
reports for each vehicle subsystem, and the viability
of a pro-forma business plan for an off-road racing
series.
Our team was divided into four sub teams
corresponding to critical subsystems of the vehicle:
chassis, controls, drivetrain, and suspension. Each
of these sub teams confronted unique challenges
that were addressed to improve the overall
performance and reliability of the vehicle.
                                                           Figure 1: Bare Chassis with high-load members
                                                            (orange) and direction of external forces from
                                                                         shocks (red arrow)
3

Identifying the forces going into these members
allowed the team to run updated FEA studies to
determine whether extra support would be needed,
as well as validate approximated FEA run by the
2019-2020 team.
To capture data, 350Ω Type-B Strain gauges and
Elecrow Strain Gauge modules were used,
connected to a custom Arduino data acquisition
(DAQ) Unit. These modules were incredibly helpful
as they were easy to use and eliminated the need
for complicated circuits in the DAQ unit. Calibration
was completed using known resultant shock forces
based on shock compression (see Suspension Sub
Team Testing Section). The shocks were
compressed in increments of 0.5” and the
corresponding Arduino output was recorded. This
provided the known external loads to critical chassis
members given certain Arduino measurements.                   Figure 3: FEA analysis on rear section of
                                                                           vehicle frame
FEA Analysis on Chassis
FEA studies were run using a combination of results      Redesign
from the suspension maximum shock force and              Firewall
strain gauge testing on front suspension control         The firewall is an extremely important component of
arms and rear suspension toe links. Examples of          the vehicle, shielding the driver from any danger rear
these studies, showing FOS distributions, are shown      of the rear roll hoop. To accomplish this, no gaps
in Figure 2 for the front and rear chassis               may exist between pieces of the firewall, and cutouts
respectively. Within these studies, it was possible to   should only exist where necessary such as for the
isolate single members and calculate the axial           shoulder harness and wiring that runs through the
loading within those specific members. These             cockpit. A two-piece design was chosen to facilitate
calculated values were used in comparison to the         installation and removal. The firewall was made of
measured loads from strain gauge testing.                0.025” 6061 Aluminum as it was the thinnest and
                                                         lightest material that would satisfy the rules set by
                                                         SAE.
                                                         Body Panels
                                                         While a design for the body panels was completed
                                                         by the 2019-2020 team, it was decided to redesign
                                                         the panels to improve ease of access and decrease
                                                         overall weight. Both goals were achieved by
                                                         reducing the total number of panels from 10 to 6,
                                                         reducing the amount of required hardware, and
                                                         changing the material from 0.125” polycarbonate to
                                                         0.060” haircell ABS. Additionally, the design moved
                                                         away from requiring removal of suspension
                                                         components to disassemble and reassemble the
                                                         body panels from the vehicle. Thus, making it
                                                         possible to quickly remove individual panels for
 Figure 2: FEA Study on Chassis Front of Rear Roll       maintenance or technical inspection.
                      Hoop
4

                                                           this rule violation, an additional member, shown in
                                                           Figure 6 in magenta, was added connecting the FAB
                                                           Low member to the rear roll hoop within the specified
                                                           tolerance of 2” between centerlines of tubes.

   Figure 4: Bare Chassis with Redesigned Body
                     Panels
Driveshaft Protection
Last year’s 4WD design incorporated a driveshaft
that runs directly under the seat, and through the
cockpit of the vehicle. To keep the driver’s               Figure 6: The chassis modified with an additional
extremities from getting caught in the rotating shaft,     member between FAB Low and the rear roll hoop.
a 3” ID ABS tube was placed over the driveshaft this         Viewed from above the rear left quarter panel.
year. The tube was held in place by two .125” thick
Aluminum driveshaft hoops, that were bent around
the tube and bolted to the chassis at the under-seat
member. These hoops served to both ensure the
                                                           Controls
tube did not interfere with the driveshaft, as well as     Introduction
protect the driver in the case of driveshaft failure. In   The controls sub team was responsible for the
addition to these pieces, the false floor was              brakes, electrical system, safety equipment, and
redesigned to add more room in cockpit while               cockpit ergonomics. At the beginning of the year,
protecting the driver from steering linkage failures.      many of the SAE required controls specifications
                                                           were missing from the vehicle and needed to be
                                                           addressed to pass technical inspection in Arizona.
                                                           The controls team also wanted to address the
                                                           unnecessary weight and unacceptable ergonomics
                                                           from the 2019 – 2020 pedal assembly. Thus, the
                                                           team redesigned most of the controls interface
                                                           including the differential switches, brake light, safety
                                                           harness, and the pedal box. These components and
                                                           equipment were designed to optimize functionality
                                                           for the driver, ensuring controls interfaces were easy
                                                           and comfortable to use for long driving sessions as
  Figure 5: Driveshaft Protection Redesign with            would be experienced during the endurance event at
Lower Firewall (left), Driveshaft Cover (Center) and       competition.
                False Floor (Right)
                                                           Electrical System
Point A Tubes                                              The electrical system includes two separate circuits.
The primary issue discovered with the 2019-2020
                                                           The first circuit includes the engine, and both kill
chassis during a mock technical inspection involved
                                                           switches. This circuit remains entirely separate from
the joining of critical chassis members too far apart
                                                           the main vehicle harness as the brake lights must
at a lower node of the rear roll hoop. To overcome
                                                           work regardless if the engine is powered or not. This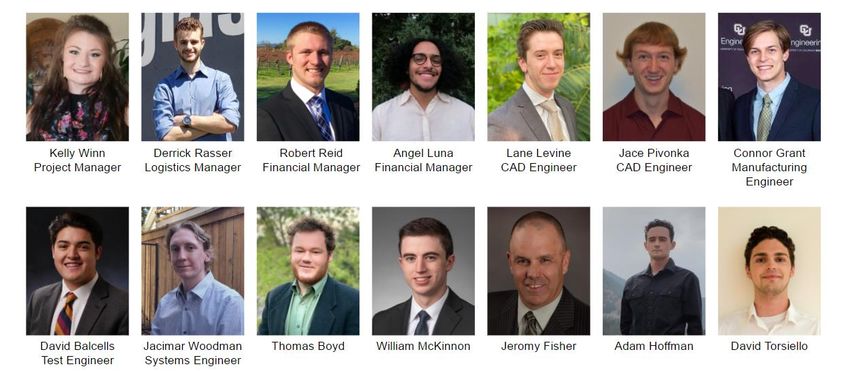
5

meant that the switches must be wired in parallel so       which replaced the horizontally mounted 0.75”
that pressing either one completes the circuit and         Wilwood master cylinders with fixed reservoirs. The
kills the engine. The main wiring harness includes         smaller master cylinders contributed to decreasing
the battery, differentials, differential switches, brake   the force required to lock the brakes, making it easier
pressure sensors, and a brake light. There are two         for the driver to press the pedal and reduce driver
hydraulic brake pressure sensors that are routed in-       fatigue over the course of operation. The remote
line with the front and rear braking circuits. Each        reservoirs allowed the team to use a new 7075
differential is controlled by an SPST switch, which        aluminum base plate as pedal restraints, which also
allows the driver to operate the vehicle in FWD,           helped shed weight. Longer brake pedals, a lower
RWD, or 4WD. The differentials and kill switch are         profile throttle endstop, and an extended throttle
connected to the engine with automotive grade              pedal below the pedal box were incorporated into the
Deutsch connectors. This makes it easy to remove           split brake pedal design to increase driver comfort
the wiring harnesses to diagnose any issues and            when operating for extended periods of time. The
keeps the connections at these points sealed from          extended brake pedals increased the pedal ratio
dust, dirt, and water ingress.                             from 4 to 4.5, decreasing the brake locking force
                                                           making the system more comfortable for the driver.
                                                           The new pedal box also has a fewer number of
                                                           overall parts and hardware which attributed
                                                           decrease weight from 10.4 lbs to 6.5 lbs.

   Figure 7: Wiring diagram for the differentials,
             brakes, and kill switches.

Pedals
The original pedal box design from last year was
tested under various driving conditions at the
beginning of the year and it was determined that the
brake pedal force to lock the wheels, the long throttle
pedal throw, and heavy components were not
acceptable for our design. The controls team
designed a new pedal box that could decrease the
max braking force, decrease the throttle travel,
reduce weight. The new design also incorporated a
cutting brake that independently actuates the front
and rear braking circuit. This was desirable as the
driver could lock the rear brakes and improve the
turning radius of the vehicle which would assist in         Figure 8: Original pedal design (Top), New pedal
the completing maneuverability challenge.                        design with split brake pedal (Bottom).

Other key changes implemented in the new pedal             Brakes
box design included vertically mounting 0.625” Tilton      In the first few testing sessions at the beginning of
master cylinders accompanied by remote reservoirs          the year, the controls team noticed the current
6

braking system does not lock all four wheels on dirt     generated by the caliper of 925lbs. This force was
and pavement. This ability is required for               calculated from the driver applying a 250lb force to
competition in Arizona and needed to be addressed.       a ⅝” master cylinder via a 5.5:1 pedal ratio. FEA
                                                         studies were run with this load case to test new
The brake rotors were mounted inboard by the 2019
                                                         caliper designs and test the factor of safety with a
– 2020 team to reduce unsprung weight and improve
                                                         hard braking scenario. The new caliper mount
upright packaging with the four-wheel drive system.
                                                         design reduced the component weight by 28% and
This was desirable for improved suspension               made the calipers much easier to install and bleed.
performance in steering and in harsh terrain and was
kept for the design this year.                           Manufacturing & Assembly
The 2019–2020 rear brake circuit included a              Much of the manufacturing was undertaken by the
                                                         Idea Forge machine shop, as well as the ITLL
Wilwood brake proportioning valve, which allowed
the driver to adjust the braking ratio and reduce        machine shop. The caliper mounts and some steel
brake pressure in the rear circuit by 57%. This was      components for the pedal box were cut on the
                                                         abrasive waterjet at the workplace of a team
kept in the design so the driver could adjust front to
                                                         member. The remaining machine work for the pedal
back brake ratio while driving and improve the
                                                         box was done at the ITLL using a CNC mill and lathe.
braking performance based on terrain. The team
also switched the front and rear calipers since the
original configuration held the larger piston diameter
in the rear. This resulted in the rear wheels locking    Drivetrain
while the fronts continued to rotate in hard braking     Introduction
which was unacceptable for the design                    The 2019 – 2020 drivetrain system was designed
requirements. A combination of downsized master          around the 10 horsepower, Briggs & Stratton
cylinders and rotated calipers reduced the front         Vanguard 19 engine. Given the upcoming
brake locking force from 250lbs to less than 150lbs      competition requirement next year of vehicles
required by the driver.                                  requiring 4WD capability, last year’s team opted to
                                                         design a selectable drive system that toggles front,
The controls subteam also identified an accessibility
                                                         rear, and four-wheel drive. This year, the drivetrain
issue with the old caliper mounts which prevented
                                                         sub team aimed to test and improve this system’s
the team from installing and bleeding the brakes
                                                         efficiency and reliability.
efficiently. The team decided to adjust the brake
caliper mounts to improve the accessibility of the       Most of the testing for the drivetrain team
calipers and to make it easier to remove the entire      surrounded tuning the Continuously Variable
                                                         Transmission (CVT) and selecting the correct chain
                                                         drive gear ratios for either higher top end speed or
                                                         improved acceleration. The team noticed a
                                                         significant difference in top speed between the 2019
                                                         – 2020 theoretical max of 29mph and the vehicle’s
                                                         actual top speed of 19mph. Thus, the team set out
                                                         to tune the drivetrain to help increase the
                                                         performance and efficiency before competition.

   Figure 9: FEA Analysis of Redesigned Brake
                 Caliper Mount
front differential assembly from the vehicle. The new
caliper mounts, shown in Figure 9, were designed
around a maximum frictional braking force
7

                                                            magnet passes by and can be converted to RPM
                                                            using the time interval between impulses.

    Figure 10: Exploded View of 2021 Drivetrain
                     System

                                                            Figure 12: Arduino setup with SD card shield and
                                                             crankshaft position sensors (Top), Primary CVT
                                                                pulley sensor placement (Left), Secondary
                                                                    Jackshaft sensor placement (Right)
                                                           CVT (Continuously Variable Transmission)
                                                           A Continuously Variable Transmission is a system
                                                           of two pulleys that are connected by a belt. The
                                                           primary pulley is connected to the output of the
                                                           engine and the secondary was connected to the
 Figure 11: Flowchart outlining the power transfer         chain drive via a jackshaft. As the engine speed
              from engine to wheels.                       changes, a mechanical system of springs, ramps,
                                                           and flyweights engage to change the diameter of the
Testing                                                    pulleys. This changes the gear ratio of the system
Testing was performed by collecting RPM of the             and, in turn, acts the same as changing gears in the
primary and secondary pulley of the CVT. The team          transmission of a car.
identified the CVT as the main source for efficiency
loss due to its high variability with spring preload and   The testing setup in Figure 11 allows for the ability
belt tension. It was also relatively easier to change      to plot primary RPM, secondary RPM, and the gear
out springs compared to replacing an entire                ratio as a function of time. For ease of analysis the
differential or transfer case with better gear             secondary speed was converted into wheel speed
reductions. RPM data was gathered using hall effect        through a calculation of the overall ratio throughout
crankshaft position sensors mounted to the primary         the rest of the drivetrain. Overlaying primary vs.
CVT pulley and the jackshaft (CVT secondary                secondary data allowed the team to find the
output). These sensors generate a high impulse             engagement and shift RPM for each CVT setup in
signal when a                                              relation to the target values. This provided the team
                                                           with a method of evaluating different CVT setups to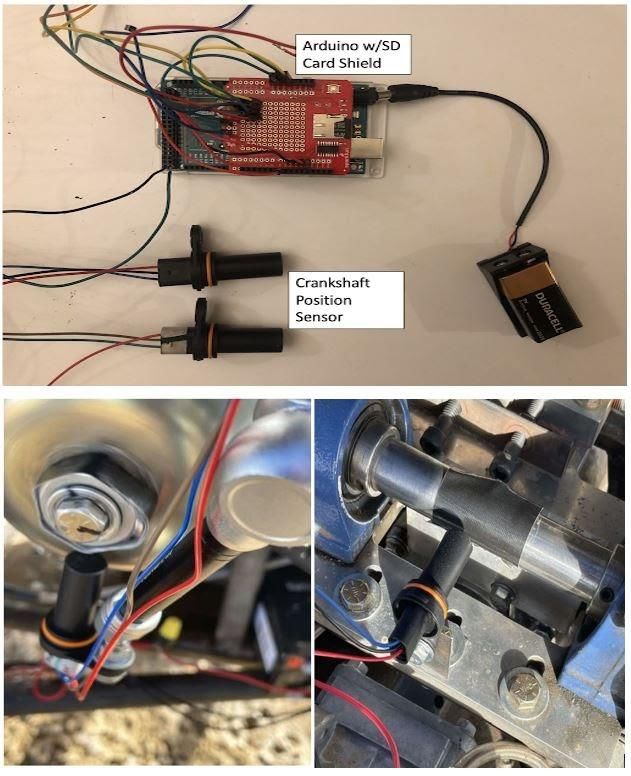
8

identify the most optimal gear ratio to achieve better   Chain Drive
acceleration and top speed closer to the theoretical     The chain drive consists of two sprockets that
maximum calculated by the 2019 – 2020 team. All of       connect the secondary pulley of the CVT via the
which are required to place well in the SAE              jackshaft to the transfer case. A chain connects the
Validation events. With the combination of chain         two sprockets and transfers power to the rest of the
drive primary sprockets, the CVT was tuned to            system. To tune the chain drive, the sprocket sizes
achieve a maximum top speed of 23 mph which is           can be changed to find the optimal gear reduction in
an improvement based on the system at the                the system. A value judgement was made to
beginning of the year.                                   continue using smaller diameter driving sprockets,
                                                         as the larger sprockets tested drastically decreased
                                                         the acceleration of the car. Ten, twelve, and
                                                         eighteen tooth primary sprockets were tested for
                                                         different CVT primary spring setups to gauge the
                                                         acceleration and top speed of each sprocket. Both
                                                         the ten and twelve tooth primary sprockets were
                                                         considered for use at competition as they provided
                                                         the highest top end and fastest acceleration while
                                                         fitting within the current chain drive covers.

                                                         Transfer Case and Differentials

 Figure 13: Primary versus secondary CVT RPM
values from testing (Shown in Magenta and cyan).
  Spikes in Primary vs Secondary Data occurred
  during acceleration runs from a complete stop.
 Corresponding gear ratios over the same testing
             interval are shown in red.
The heat plot in Figure 13 was used to identify and
predict the performance of third-party springs             Figure 15: Polaris Sportsman Front Differential
suitable for the targets that fit the dimensional
                                                         Polaris Sportsman front differentials were used as
requirements of primary pulley.
                                                         both as a transfer case and traditional differentials in
                                                         the vehicle. These were chosen by the 2019 – 2020
                                                         team for their ability to be electronically controlled by
                                                         the driver. Power is transferred via the secondary
                                                         sprocket of the chain drive into the transfer case,
                                                         which distributes the power through the front and
                                                         rear driveshafts to the differentials. The differentials
                                                         and transfer case were not adjusted from last year’s
                                                         design as implementing other off-the-shelf
                                                         components into the drivetrain would cause a
                                                         cascade of manufacturing adjustments which was
                                                         not possible given the lack of resources available to
                                                         the team this year.
Figure 14: Heat plot of predicted CVT engagement
    RPM based on modeling and spring force
calculations. Our target is between 2600 and 2700
                       RPM.
9

                                                          point of the trailing arm allows for adjustment of the
Suspension                                                camber and toe of the rear wheels. Integrated into
Background                                                the trailing arms were the aluminum uprights which
The suspension sub team was responsible for the           house the wheel bearings. This design was
front suspension system, which consists of the            introduced last year and was not changed for the
control arms, tie rods, steering uprights, front          vehicle this year.
shocks, and CV axles, and rear suspension system,
consisting of the trailing arm, rear toe links, rear
uprights, rear shocks, and CV axles.
This year, the suspension sub team performed
several tests on the 2019-2020 CU Boulder Baja
front suspension system and used the data collected
to inform a full redesign of the front suspension
system.

Front Suspension
The Front Suspension system for the 2020 – 2021
vehicle is a Double A-Arm system comprised of two           Figure 17: Overview Rear Suspension System
control arms to articulate the wheel through 10” of
travel. These being the Upper Control Arm (UCA)           Testing
and Lower Control Arm (LCA). To provide ample             Testing for the Suspension sub team was primarily
clearance for the new CV axles in the 4WD system,         focused on the front suspension components. After
the front shocks were mounted to the UCA.                 the first few track days, poor kinematics in the
                                                          system were identified by observing unacceptable
Both the UCA and LCA connect to the Steering
                                                          maneuverability and handling characteristics.
Upright. The Tie Rods connect the upright to the
                                                          Manufacturing errors were also identified with this
Steering Rack and control the steering of the vehicle.
                                                          system from incorrect interference between
                                                          components and errors in weld fixturing. If not
                                                          remedied, the vehicle would not complete the
                                                          maneuverability challenge at competition. In addition
                                                          to fixing the poor performance, the suspension team
                                                          wanted to validate external loading conditions that
                                                          had been hand derived from previous Baja teams.
                                                          Ensuring that the suspension dynamics and FEA
                                                          models were accurate to the actual driving
                                                          conditions of the vehicle. This helped make more
                                                          informed design decisions and achieve the goal of
                                                          improving suspension performance in corning and
                                                          over rough terrain.
Figure 16: Overview of Front Suspension System            The team also designed a new remote Data
                                                          Acquisition System with an Arduino Uno and a
Rear Suspension                                           microSD card shield so to complete data logging
The Rear Suspension system features a linked              without the need for bulky equipment. All the sensors
trailing arm design where the Trailing Arm attaches       used during the testing phase of the project were
to the rear of the chassis via two Toe Links per          modular and connected to the centralized DAQ unit
side. By configuring the support of the trailing arm      at the front of the cockpit via CAT5 cables. A
in this manner, the system was more resistant to          modular DAQ unit provided the ability to complete
lateral impacts. The implementation of adjustable         multiple testing setups without significant change in
length toe links and a heim joint at the front mounting   the hardware or code. Data was synced with live
10
video of the testing runs using RaceRender loading of our suspension members to further
Software. This software was used to identify exactly characterize the external loading on the system in
what the loading conditions created specific features certain terrain features. This data helped identify
in the data. more appropriate external loading conditions to use
for FEA and Hand-Derived loading models during
Maximum Shock Force Testing
redesign. Additionally, this test was unique as no
The first suspension test utilized Sharp Low Range
previous CU Baja team has been able to implement
Infrared Proximity sensors to measure the shock
strain gauges successfully into their testing
displacement versus time in a full bump or “bottom
programs.
out” scenario. This would help in identifying the
factor of safety of the 2019-2020 components and Force versus time data was gathered on the control
help evaluate if any parts were overbuilt based on arms, tie rods, and toe links. Calibration was
incorrect loading conditions. completed on the gauges using a physical
calibration method where axial loads were applied
The 2017 - 2018 Suspension sub team completed
directly to suspension members and measured
an Instron test on the shocks to create a plot of
using a Load Cell. Arduino counts were collected
shock displacement vs external loading at various
from the gauges and associated with an applied
shock pressure setups. Using this calibration curve,
axial load. This method worked well for simply
the team could characterize the spring force from the
supported members like the tie rods and toe links but
amount of displacement in the shocks at certain
proved to be much more difficult for the control arms.
shock pressures. The damping force was then
The suspension team identified areas of high stress
derived by finding the shock speed from the
concentrations from the 2019 - 2020 FEA studies
displacement data. Shock speed was compared to a
and placed strain gauges in those locations. After
set of curves given by Fox Factory which correlated
completion of the test, loading data from the strain
shock speed with damping force at certain pressure
gauges was used to isolate axial versus bending
setups. Summing both forces, a total external load
loads. This was cross referenced with RaceRender
being applied to the shocks and the suspension
video overlay to confirm the tensile versus
system could be found.
compressive trends for certain suspension members
After completion of testing, the team found that the was accurate.
shocks observed a maximum of 850lbf spring force
Since the strain gauge system was calibrated to
and 150lbf damping force with a total resultant force
measure force, strain had to be derived from the
of 1000lbf. However, looking at the displacement
force output. This was important because the
data, the team found that they did not bottom out the
suspension team could derive the maximum strain
shocks entirely and were about 1” away from full
during testing runs, see where the event occurred,
bump. If full bump was achieved, the maximum
and compare the derived strain to outputs of FEA
shock force observed would be 1600lbf. This value
models. The team could then validate FEA results
is significant as it was the maximum derived load
and initial boundary conditions to ensure that the
calculated by the 2015-2016 team. Observing this
models created were accurate to actual testing
value in actual testing conditions compared to
conditions. Using more accurate models sped up the
simplified hand calculations meant that the team
iterative design process and allowed new
could validate the work done by previous
suspension designs to be tested with simulated
suspension teams. This meant that this force was
driving conditions close to what would be
appropriate to use when deriving maximum loading
experienced out at the track.
cases for redesign analysis.
Roll Rate Testing
Strain Gauge Testing
The suspension team’s final test used a combination
The second set of tests used 350Ω Type-B Strain
of a +/- 3g, 3-axis accelerometer and IR Proximity
Gauges and Elecrow Arduino Strain Gauge Modules
sensors to measure the amount of acceleration per
to measure the internal strain and forces during
degree of body roll or roll rate. This data helped us
various driving conditions and terrain. The
understand the maximum amount of body roll the car
suspension team wanted to identify the internal
experiences at certain shock setups in a steady state11
turn which was important for developing an accurate control during both steering input and body roll, the
Lotus SHARK Suspension Dynamics Model. The need to minimize the scrub radius to reduce steering
Lotus model was then used to create an ideal forces, and increasing steering articulation to the
geometry to base the Front Suspension redesign limit of the CV Axle Joints. All of these would help
from. improve the vehicle’s handling characteristics over
variable terrain while reducing turning radius in
For this test, the DAQ microprocessor was upgraded steady state cornering. Ultimately, this would
to an Arduino Mega; allowing up to six analog inputs increase performance in the suspension challenge
(six different sensors) to be read at once. and maneuverability events.
Additionally, it ultimately maintained the read/write
speed from the sensors to the microSD Card which
was important for ensuring data was not clipped from
the DAQ. This setup will be used during the final
testing suite and passed down to future teams for
more remote data logging with a proven system.
After reviewing the first set of data from this test, the
data was found to be incredibly noisy. It was
determined that the accelerometer was too sensitive
and picked up engine vibrations as the test was
conducted. To filter out this noise, the team used a
Savitzky-Golay Filter which uses convolution with a
high-order polynomial to filter out noise. This method
was deemed acceptable for filtering noise in the
lateral acceleration data sets after comparison to an
ideal acceleration calculation. However, it was not
acceptable for all longitudinal acceleration during the Figure 18. Full 3-D Lotus SHARK model used for
test. It was discovered that the filter worked only for kinematic simulation.
isolated braking scenarios thus, the team only used
the filtered longitudinal data immediately
surrounding braking events. Regardless, the lateral
acceleration data was appropriate to calculate our
roll rate.
The test yielded a maximum lateral acceleration of
the vehicle of 0.58G, maximum braking deceleration
of 0.89G, and a maximum Roll Rate of 6.26 deg/G.
In conjunction with the Center of Gravity test
completed by the controls sub team, the suspension
sub team added these results to the Lotus SHARK
Suspension Dynamics Model.
Redesign - FEA and Lotus
Redesign efforts sought to make use of the data
acquired in testing to inform a fully revised front
suspension package. The system was designed
using a top-down approach, beginning with the
constraints the frame placed on the inboard
geometry and the hubs placed on the outboard
components, a new geometry was developed using
Lotus to perform three dimensional kinematic Figure 19. CAD assembly of redesigned
simulations and quickly iterate through viable suspension overlaid with top level geometry derived
options. Particular emphasis was placed on camber from kinematic simulations.12
Strain gauge data allowed for the validation of Manufacturing
suspension load cases and improved FEA studies Due to the restrictions brought on by the pandemic
that were previously based on rough the team outsourced most of the parts to be
estimates. Refined FEA studies were run on the fabricated. The tubes for the redesigned front
control arms, tie rods, and uprights, and the stress suspension were cut and coped in the Idea Forge
concentrations identified were compared to strain before being welded together by a member of last
gauge data collected during analogous suspension year’s Baja team. The geometry of the front
loads. This allowed for a reduction of unsprung suspension members needed to be very accurate to
mass in all parts of the front suspension, while being achieve the suspension characteristics the team had
confident in the minimum factor of safety of 1.2. designed for, so fixtures were laser cut out of a piece
Reducing the unsprung mass reduces the steering of medium density fiberboard (MDF). Using these
forces felt by the driver and allows them to maintain fixtures, the coped members of the control arms
better control of the vehicle through harsh terrain were properly aligned and held in place while tack
which is very desirable when trying to race for long welded together. Similar methods were used to
periods of time. create the tie rod and UCA mounts for the front
uprights.
Figure 21. UCA fixtured in place during welding.
The uprights themselves were milled using a three-
axis CNC milling machine in the ITLL. The uprights
were designed for this method of machining to
reduce machine time by minimizing tool changes
and the number of times the billet needed to be
reoriented. After the uprights were milled, the
bearing housing needed to be bored out and a
groove for a c-clip was cut using a lathe. Since the
space between the wheel and upright was very tight,
the UCA mounting bracket could not be fastened in
place with a typical nut and bolt. To counter this, the
through holes were tapped so that no extra nut or
exposed threads could impact the wheel.
Figure 20. Lower Control Arm FEA in the Front
Impact Study (Top) and Front Upright Assembly
FEA using remote tire loads derived from impact
data13
racing with other Baja SAE programs. As we get the
vehicle ready for competition, we are continuing to
assess the physical performance gains of each
redesign to ensure its aptitude for use in competition.
Overall, this project has been incredibly valuable to
all our members and has given us an immense
amount of knowledge towards completing a
successful design project with a large team of
dedicated engineers. We will be taking this
experience with us into our careers and the rest of
our lives.
Figure 22. Redesigned Steering Uprights after CNC
Milling Operations
The tabs of the shock mounts and the bearing plate
inserts for the UCA water jet out of sheet metal. For
the bearing plates further machining was needed to
create the partial hole that the spherical bearing was
later press fit into.
Figure 23. Redesigned Front suspension
components including UCA, LCA, Steering
Uprights, and Tie Rods
Conclusion
As the project comes to a close this spring, our team
is eager for the opportunity to represent the
University in the SAE Collegiate Design Series.
SAE International has decided to move forward with
the in-person validation event this year in Tucson,
Arizona and we will be travelling to test our technical
knowledge and engineering designs in head-to-head14
Drivetrain Sub Team
Contact Information Angel Luna Drivetrain Sub Team Lead/ Financial
If you have any questions about the project or the Manager
CU Boulder Baja program, please contact us!
Angel.Luna@Colorado.EDU
Connor Cedzich-Grant Manufacturing Engineer
Peter Himpsel Faculty Director Connor.D.Grant@Colorado.EDU
himpselp@gmail.com Adam Hoffman
Kelly Winn Project Manager Adam.D.Hoffman@Colorado.EDU
Kelly.A.Winn@Colorado.EDU Jeromy Fisher
Jeromy.Fisher@Colorado.EDU
Chassis Sub Team
Thomas Boyd Chassis Sub Team Lead Suspension Sub Team
Thomas.P.Boyd@Colorado.EDU Robert Reid Suspension Sub Team Lead/Financial
Jace Pivonka CAD Engineer Manager
Robert.ReidIii@Colorado.EDU
Jace.Pivonka@Colorado.EDU
Lane Levine CAD Engineer
Controls Sub Team Lane.Levine@Colorado.EDU
Will McKinnon Controls Sub Team Lead Derrick Rasser Logistics Manager
William.Mckinnon@Colorado.EDU Derrick.Rasser@Colorado.EDU
David Balcells Test Engineer Jacimar Woodman Systems Engineer
David.Balcells@Colorado.EDU Jacimar.Woodman@Colorado.EDU
David Torsiello
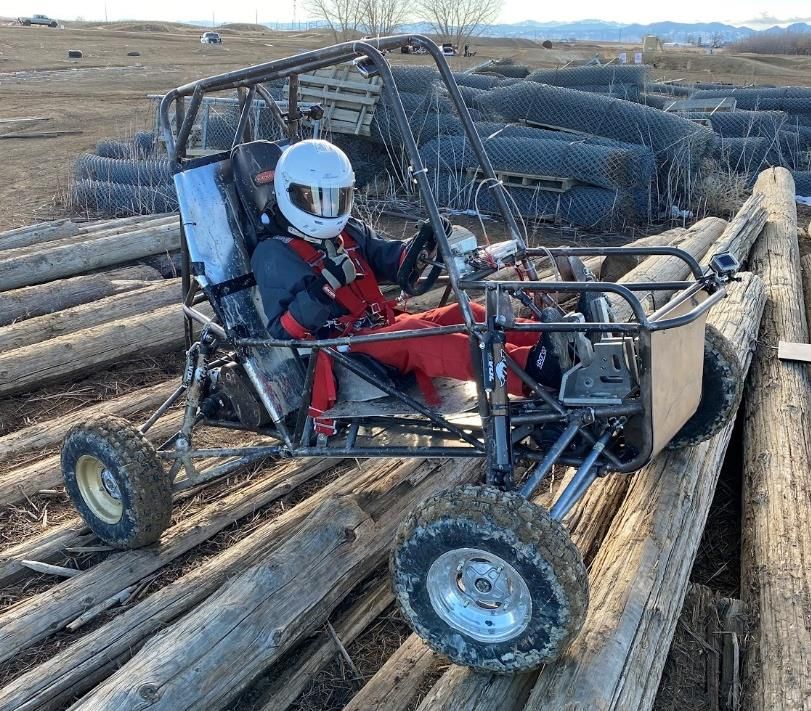
David.Torsiello@Colorado.EDU15 Additional Photos
16
You can also read