SNOW IN THE MCMURDO DRY VALLEYS, ANTARCTICA
←
→
Page content transcription
If your browser does not render page correctly, please read the page content below
INTERNATIONAL JOURNAL OF CLIMATOLOGY
Int. J. Climatol. (2009)
Published online in Wiley InterScience
(www.interscience.wiley.com) DOI: 10.1002/joc.1933
Snow in the McMurdo Dry Valleys, Antarctica
Andrew G. Fountain,a* Thomas H. Nylen,a† Andrew Monaghan,b Hassan J. Basagica
and David Bromwichc
a Department of Geology, Portland State University, Portland, OR 97201, USA
b National Center of Atmospheric Research, Boulder, CO, USA
c Byrd Polar Research Center, The Ohio State University, Columbus, OH, USA
ABSTRACT: Snowfall was measured at 11 sites in the McMurdo Dry Valleys to determine its magnitude, its temporal
changes, and spatial patterns. Annual values ranged from 3 to 50 mm water equivalent with the highest values nearest the
coast and decreasing inland. A particularly strong spatial gradient exists in Taylor Valley, probably resulting from local
uplift conditions at the coastal margin and valley topography that limits migration inland. More snow occurs in winter
near the coast, whereas inland no seasonal pattern is discernable. This may be due, again, to local uplift conditions, which
are common in winter. We find no influence of the distance to the sea ice edge. Katabatic winds play an important role
in transporting snow to the valley bottoms and essentially double the precipitation. That much of the snow accumulation
sublimates prior to making a hydrologic contribution underscores the notion that the McMurdo Dry Valleys are indeed an
extreme polar desert. Copyright 2009 Royal Meteorological Society
KEY WORDS Antarctica; Dry Valleys; snow; katabatic; polar desert; precipitation
Received 30 October 2008; Revised 18 March 2009; Accepted 21 March 2009
1. Introduction and are thought to be remnants from the last ice age
>6000 years (Stuiver et al., 1981; Denton and Marchant,
The McMurdo Dry Valleys (MDV) are a polar desert
2000). These massive ice deposits and other unknown
with annual temperatures averaging −18 ° C (Doran et al.,
deposits play a role in the current hydrology of the Dry
2002). Essentially, all precipitation is snow and can occur
Valleys when they melt during decadal warming events
at any time of the year. Rainfall does occur occasionally,
(Harris et al., 2007). While they contribute little water
but only rarely reaches the valley floor and only then as
flux compared to that from the surrounding glaciers, they
a few drops (Keys, 1980). Despite roughly 40+ years of
supply concentrated salts from the melting ice itself or
scientific investigation, little is known about the magni-
dissolved from salt accumulations in the otherwise dry
tude and spatial distribution of snowfall in the valleys.
soils to the streams and lakes in the valleys affecting the
While snow on the valley floors has been correctly dis-
biogeochemistry of the soils, streams, and lakes.
missed for being of little direct hydrologic importance
Snow is important to maintaining the glaciers in
(Chinn, 1981), this lack of interest had pervaded associ-
the valleys, and snow accumulation measurements are
ated disciplines. We now realize that snow is a critical
taken on several glaciers (Fountain et al., 2006). Summer
moisture source to the microbially dominated ecosystems
snowfall on the glaciers is critically important to the
in the soils of the Dry Valleys (Wall and Virginia, 1999).
hydrology of the valleys. Snow increases the albedo of
And snowfall patterns are important to the spatial pat-
the ice surface and changes the energy balance conditions
terning of dry and ice-cemented permafrost (Hagedorn
such that little energy is available for melting (Fountain
et al., 2007). Coastal areas tend to have more snow-
et al., 1999b). A snow accumulation of only a few
fall than inland areas (Bull, 1966; Keys, 1980) where
centimeters largely eliminates glacial melt, and runoff
coastal areas have more ice-cemented permafrost than from the glaciers slows to a trickle. To improve our
drier inland areas (Bockheim, 2002). Snowfall is probably understanding of the magnitude of snowfall and its
critical to the survival of massive subsurface ice deposits. spatial and temporal patterns, we report the results of
Some of these ice deposits may be of great age, >106 our measurements from the past 12 years. Our study is
years (Sugden et al., 1995), yet how they are maintained focused on Taylor Valley, and we include results from
over this time is unclear. Also, ice-cemented permafrost several sites in two other valleys.
and massive ice are commonly observed close to the coast
* Correspondence to: Andrew G. Fountain, Department of Geology, 2. Site Description
Portland State University, Portland, OR 97201 USA.
E-mail: andrew@pdx.edu The MDV is located on the coastal edge of the Antarc-
† Present address: UNAVCO, Boulder, CO, USA. tic continent (77.5 ° S, 163 ° E) in Southern Victoria Land
Copyright 2009 Royal Meteorological SocietyA. G. FOUNTAIN ET AL.
(Figure 1). Only 2% of the Antarctic is ice free (Drew- to the MDV (Keys, 1980; Bromley, 1985), acting like a
ery et al., 1982) and the MDV is the largest ice-free precipitation event.
region on the continent with about 2000 km2 of snow- Little information exists on the snowfall of the MDV.
free area (Chinn, 1988). The TransAntarctic Mountains The most comprehensive effort was conducted at Vanda
block the ice flow from the East Antarctic Ice Sheet, Station in Wright Valley in the late 1960s and 1970s by
which would otherwise cover the valleys. In places, out- the New Zealand Antarctic Program (Keys, 1980; Brom-
let glaciers from the ice sheet flow into the valleys but ley, 1985). During this period, Vanda Station was con-
terminate well before reaching the coast. In addition, tinuously occupied for 3 years, providing a year-round
numerous small alpine glaciers form in the mountains record of the meteorological environment including pre-
and flow to the valley floor. The valleys are character- cipitation. They recorded snowfall in every month of
ized by a rocky–sandy soil devoid of vascular vegetation. the year, except for one year when eight months had
The biology of the MDV is limited to microbial forms no snowfall (Bromley, 1985). The density of snowfall is
with spectacularly low biodiversity and short food chains quite low with a minimum value of 60 kg m−3 water
(Wall and Virginia, 1999; Priscu et al., 1999). Ephemeral equivalent (weq) and an average value of 100 kg m−3
streams, originating as glacial meltwater, supply peren- (Keys, 1980). To our knowledge, since these earlier stud-
nially ice-covered lakes in the valleys (McKnight et al., ies, no other precipitation measurements have been pub-
1999). The polar climate of the region experiences con- lished until this present study. Spatial patterns of precip-
tinual darkness in midwinter and continual sunlight in itation have been inferred from snow accumulation mea-
midsummer. Air temperatures average about −17 ° C with surements on the glaciers (Fountain et al., 1999a), and
the winter minimum about −40 ° C and the summer max- temporal patterns were inferred from snow pits (With-
imum a few degrees above freezing (Clow et al., 1988; erow et al., 2006; Bertler et al., 2004). However, snow
Doran et al., 2002). In Wright Valley, annual values of accumulation results from mass gain due to snowfall and
snowfall have ranged 7–11 mm water equivalent (Keys, mass loss from ablation; consequently, accumulation pro-
1980; Bromley, 1985), most of which is lost to sublima- vides only a rough proxy for precipitation.
tion (Chinn, 1993). Katabatic winds are a typical feature
of the regional climate, and commonly occur in winter
and with less frequency in summer (Nylen et al., 2004). 3. Methods
These density-driven winds sweep down the polar plateau All precipitation gauges were deployed near pre-existing
into the MDV with speeds up to 37 m s−1 , and their meteorological stations in the valleys to make use of the
adiabatic warming can increase local air temperatures solid-state data loggers and to use the other meteoro-
by 30 ° C in less than a few hours. Snow can be trans- logical variables in interpreting the precipitation record.
ported, via the katabatic winds, from the Polar Plateau The gauges were of three types: weighing bucket and
Figure 1. Landsat-7 satellite image of the McMurdo Dry Valleys. The image was acquired on December 19, 1999. The width of the image covers
about 85 km. The triangles are locations of the meteorological stations.
Copyright 2009 Royal Meteorological Society Int. J. Climatol. (2009)
DOI: 10.1002/jocSNOW IN THE MCMURDO DRY VALLEYS, ANTARCTICA
tipping bucket, both providing a water equivalent mea- the rangers was 10 mm and the distance was recorded
sure of snowfall, and a sonic ranger that provided a hourly. To estimate water equivalent values, we episod-
distance measure to the surface, yielding a snow depth. ically made manual measurements of snow depth and
The weighing bucket gauges (Belfort Instruments, Balti- density.
more, MD) consisted of a bucket on a digital weighing The records for all gauges were examined to remove
scale (manufacturer’s accuracy 2.5 mm weq, precision artifacts induced by instrument performance (see Results
of 0.5 mm) contained in a metal housing with an orifice section). To minimize noise, owing to the low precipita-
about 1 m above the ground. A Nipher Shield (Goodison tion compared to instrumental sensitivity, we calculated
et al., 1983; Yang et al., 1999) was mounted over the daily averages for each site. If the difference between
orifice to increase gauge efficiency. The lip of the shield consecutive days exceeded a threshold of 0.5 mm weq
was about 1.6 m from the ground. The gauge housing and for weighing buckets and 5 mm for the sonic ranger, the
Nipher Shield were staked to the ground (Figure 2). As difference was added to a monthly sum. The thresholds
the precipitation accumulated in the bucket, the increased are below the stated accuracy of the ranger because under
weight was recorded at hourly intervals. The bucket was most conditions they reliably detected smaller changes
initially partly filled with antifreeze to melt the captured and our averages damped the noise (wind and electronic).
snow, preventing it from being blown away. Also, a To be sure that the noise was not inducing artifacts, the
thin layer of silicone oil was added to the surface of standard deviation of each daily average was calculated
the antifreeze to reduce evaporation. The contents of the and, if unusually large, the record for that day was reex-
bucket were emptied every 2–3 years and replaced with amined. No special handling of the tipping bucket data
new antifreeze and silicone oil. We eventually replaced was required other than examination for artifacts.
the weighing bucket at Lake Hoare station with a tipping
bucket (Texas Electronics, Model: TE525MM); manufac-
turer’s accuracy 0.1 mm weq. Snowfall is captured and 4. Results
melted in a reservoir containing an antifreeze mixture
with a thin layer of silicone oil. The added mass over- 4.1. Instrument Performance
flows the reservoir into a tipping mechanism. The tipping Three weighing buckets were initially deployed; how-
gauge was placed within the housing of the weight gauge ever, early records, particularly in winter, were use-
to make use of the Nipher Shield and the data recorded less owing to the shaking of the instruments by kata-
every 15 min. batic winds. We attempted to secure the instruments
Because of the expense and logistics required to pur- with mixed success because of the lack of exposed
chase, install, and maintain the weighing bucket gauges, bedrock. Finally, the gauge at Lake Bonney was suffi-
we deployed ultrasonic distance rangers (Campbell Sci- ciently secured to provide good records. Yearly cleaning
entific, Inc, model SR50; Judd Communications Ultra- of the instrument was required to prevent the accumu-
sonic Depth Sensor) to expand our spatial coverage. The lation of fine sediment from interfering with the gauge
rangers measure a distance to a surface using the travel operation. Once we achieved reliable data from Lake
time of an acoustic pulse. The rangers were installed on Bonney, we noticed two interfering factors. First, the
an arm extending from the station, 0.5–1 m above the more severe katabatic events transport sand into the buck-
surface (Figure 2). The manufacturers stated accuracy of ets, mimicking precipitation events. These severe events
Figure 2. Photographs of meteorological stations in the McMurdo Dry Valleys. Photograph A is the station at Lake Bonney. The large black
‘trumpet’ is a Nipher Shield over a Belfort gauge. Photograph B is the station at Lake Fryxell with a sonic ranger suspended from a horizontal
arm and pointing to the ground on the right side of the station.
Copyright 2009 Royal Meteorological Society Int. J. Climatol. (2009)
DOI: 10.1002/jocA. G. FOUNTAIN ET AL.
typically occur only a few times a winter. Second, diurnal of the remaining sites collecting for 4 years (Table I).
changes in air temperature and solar heating of the gauge Annual snow accumulation in Taylor Valley did not
housing apparently caused expansion and contraction of exceed 100 mm water equivalent (weq) with minimum
the weighing mechanism, yielding apparent snow events. values as low as 3 mm. Close examination of the record
The apparent events were certainly small, ≤0.5 mm shows that, in addition to precipitation, katabatic events
weq, occurring mostly in the summer months (Novem- may convey snow to the valley bottom, presumably from
ber–January) when temperatures range from −10 ° C to the snow-covered Antarctic Plateau to the west and from
4 ° C. In winter, apparent precipitation events coincided the local glaciers and snow-covered parts of the adja-
with katabatic winds that can warm the air by 30 ° C cent mountains. We presume that precipitation does not
in a few hours (Nylen et al., 2004), yielding an appar- occur during katabatic events because the meteorologi-
ent precipitation of 1.5 mm weq. However, unlike the cal conditions that trigger such events are not favorable
real event that permanently increased the weight of the for precipitation. Therefore, we recognize two kinds of
bucket, these events temporarily increased the appar- snow events, wind drift and direct precipitation, and we
ent weight and returned to pre-event levels as the air refer to the sum as ‘accumulation’ of which a fraction
cooled. is ‘precipitation’. We defined katabatic events following
The tipping bucket gauge at Lake Hoare did not Nylen et al. (2004), having wind speeds >5 m s−1 and
adequately record the timing of snow events because coming from the ice sheet (westerly). Snow accumula-
the light, low-density snow tended to collect in the tion during these events was considered wind drift. With
gauge orifice bridging the cup of the tipping mecha- katabatic events removed, annual precipitation at each
nism. With sufficient snow, the bridge was broken and site varied from 36 to 80% of the annual accumulation
the snow accumulated in the cup causing it to tip. As with an overall average of about 50%. The maximum
a result, we use the data to record snowfall amounts value of annual snow accumulation was 98 mm weq in
and not the exact (hours) timing of the snowfall. The 2004 at the Explorers Cove site of which precipitation
tipping bucket was also sensitive to the high winds. accounted for only 52 mm weq (53%). For the two sites
Proper operation of this tipping bucket gauge required with relatively long records, Explorers Cove (5 years),
the reservoir to be filled to overflow capacity, making and Lake Bonney (12 years), the fraction of direct snow-
it quite sensitive to vibrations. Katabatic winds caused fall at each site was 50 and 43% respectively. The more
the antifreeze reservoir to overflow, tipping the bucket severe katabatic events transport sediment as well, which
creating a false snowfall event and subsequently missing was also captured by the weighing bucket gauges, as
future events owing to a lowered reservoir until refill- explained. Comparing the weighing bucket to the sonic
ing by more snow. The gauge could never be secured ranger at Lake Bonney over the 2 years of overlapping
sufficiently to eliminate the katabatic-induced vibrations, data shows that, according to the bucket, 39–45% of the
therefore the data recorded had to be handled care- snow accumulation is precipitation, whereas the sonic
fully. ranger indicated 80–100%. We have no way of filter-
The ultrasonic rangers generally worked well and were ing the data to remove the effect of the sediment on the
reliable; however, the acoustic transducer could fail any bucket weight, so the magnitude of snow accumulation at
time after 2 years and, until we established a routine these two sites is probably overestimated and the fraction
replacement schedule, the record from the network of of that as precipitation is underestimated.
rangers was subject to numerous data gaps. The stated Monthly values of snow accumulation show little con-
operational conditions of the rangers included temper- sistent seasonality at Lake Bonney, near the head of
atures down to −40 ° C but the records became noisy Taylor Valley (Figure 3). But at Explorers Cove, near the
at about −35 ° C and were considered unreliable. Again, coast, snow is greatest in winter from March through
because we were measuring precipitation events that September. In contrast, the nearby McMurdo Station
often resulted in thin accumulations of snow ≤10 mm, (∼60 km away) exhibits much more snow but no sea-
we were operating at the resolution of the instrument, sonality. For Taylor Valley, given the very low accumu-
whereas larger accumulations would have improved the lation/precipitation values, any one storm can shift the
signal-to-noise ratio. Fortunately, these cold tempera- seasonal or monthly balance of snow accumulation, and
tures commonly occurred during inversions (clear skies). our records are too short to make any statistically signif-
Because surface detection of the ranger is based on the icant statements of seasonal trends in snowfall. Longer-
speed of an acoustic pulse, the signal also becomes noisy term trends over the 12 years of record at Lake Bonney
in high winds (>18 m s−1 ) again obscuring the true (Figure 4) suggest increasing snow with time. However,
signal (Brazenec and Doesken, 2005). On rare occa- the trend is not significant because the greatest snowfall
sions, low-density snow events cause erroneous values occurs in the last 3 years of record, and because of the
and appear as spikes in the data. They are obvious and measurement uncertainty associated with the extremely
easily removed. low values.
A strong spatial gradient exists for Taylor and Wright
4.2. Data Valleys with more snow closer to the coast and less
The longest records of snow accumulation are Lake Bon- snow inland (Figure 5). In Taylor Valley, the gradient
ney (12 years) and Explorers Cove (5 years), with most of snow accumulation is −2.6 mm weq km−1 from the
Copyright 2009 Royal Meteorological Society Int. J. Climatol. (2009)
DOI: 10.1002/jocSNOW IN THE MCMURDO DRY VALLEYS, ANTARCTICA
Table I. Accumulation data (mm water equivalent) in the McMurdo Dry Valleys. The first eight sites are in Taylor Valley; the
first site is closest to the coast and the last site is further away. Lakes Brownworth and Vanda are in Wright Valley and Lake
Vida is in Victoria Valley. Common. Gl stands for Commonwealth Glacier. G, gauge type; U, ultrasonic; W, weighing bucket;
T, tipping bucket. The numbers in bold are accumulation values and italic is precipitation, that is, accumulation with snow drift
from katabatic events removed. The specific location of the meteorological stations can be found in Doran et al. (2002) and
Nylen et al. (2004).
Station G 1995 1996 1997 1998 1999 2000 2001 2002 2003 2004 2005 2006
Explorers Cove W 42 66 89 66 98
17 24 47 42 52
Common. Gl U 43 47 39 93
36 37 35 75
L. Fryxell U 34 34 21 46
34 32 20 37
Howard Gl U 20 29 87
2 28 74
Canada Gl U 16 17 13
8 14 13
L. Hoare T 13 13 20 19
3 6 2 19
L. Bonney W 3 6 6 14 6 14 5 10 11 46 22 23
2 3 3 6 1 3 4 8 5 18 8 10
U 3 5
3 4
Taylor Gl U 6 6 13 14
6 6 9 12
L. Brownworth U 26 51
13 20
L. Vanda U 18 32
10 30
L. Vida U 35 22 45
33 22 45
coast to the Nussbaum Riegel, an 800-m-tall hill in in summer. At Lake Vida, Victoria Valley, snow persists
the center of the valley. The gradient up valley from all winter, whereas it persists only a few days to a week
the Riegel is −0.3 mm weq km−1 , very similar to that at Lake Bonney in Taylor Valley (Figure 6). Of course,
in the adjacent Wright Valley (−0.4 mm weq km−1 ). persistence is related to snowpack thickness and ablation
These gradients are nearly identical to snow accumulation rate (sublimation, melting, and wind erosion). Generally
measurements collected on the glaciers as part of the speaking, winter snowpacks are maintained for a month
glacier mass balance program (Fountain et al., 2006). or so and summer snow lasts for a few days to a week
Snow accumulation on the glaciers between elevations at most.
of 200–300 m decreased at a rate of −2.6 mm weq
km−1 from the coast to the Nussbaum Riegel; further up
valley, the gradient decreased to −0.6 mm weq km−1 . 5. Analysis
In addition to an inland gradient, a north–south gradient
may also exist, with more snow accumulation toward the We compare the spatial characteristics of the precipita-
north. tion measurements against those predicted by a numeri-
cal atmospheric model to determine whether our sparse
measurements agree with theoretical expectations. The
4.3. Persistence model fields are also used to infer the broader precipi-
In addition to snow accumulation and precipitation in tation distribution across the MDV. Model results were
the MDV, the persistence of snow on the valley floor is derived from the Antarctic Mesoscale Prediction System
important for biological processes in soils as a source of (AMPS), an experimental weather prediction program
moisture (Gooseff et al., 2003; Wall and Virginia, 1999) that supports the daily operations of the US Antarctic
and light penetration into lakes (Howard-Williams et al., Program (Powers et al., 2003). The AMPS simulations
1998). Snow is also a moisture source for maintenance used for this analysis employed a version of the fifth-
of ice-cemented permafrost against sublimation losses generation Pennsylvania State University/National Center
(Hagedorn et al., 2007). The sonic rangers provide a for Atmospheric Research Mesoscale Model adapted for
measure of the snow cover persistence in the valleys. As polar conditions – Polar MM5 (Bromwich et al., 2001
one would expect, persistence is longer in winter than #6981). AMPS ingests observations from surface stations,
Copyright 2009 Royal Meteorological Society Int. J. Climatol. (2009)
DOI: 10.1002/jocA. G. FOUNTAIN ET AL.
16 limit us to a year. Monthly, seasonal, and annual precip-
itation fields were compiled from hourly AMPS output
14 Lake Bonney
by assembling the 13- to 36-hour forecasts from the 0000
12 UTC AMPS simulation initialized on each day of the
10 year. A previous comparison of AMPS results to observa-
tions for a similar model configuration indicates that the
8
model fields are suitable for climatological applications
6 (Monaghan et al., 2005).
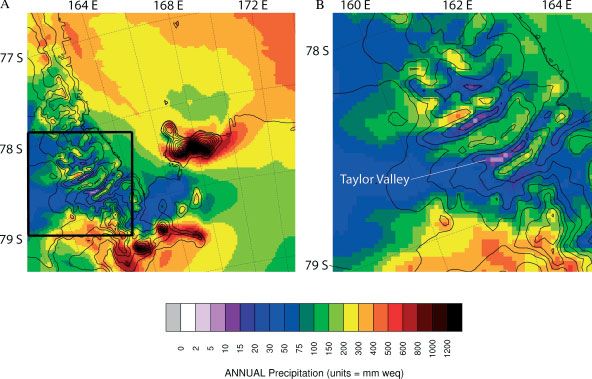
4 The model shows a precipitation shadow to the
north of Mount Discovery (Figure 7), resulting from
2
the precipitation-bearing synoptic systems that pass to
0 the north and east of Ross Island (Simmonds et al.,
J F M A M J J A S O N D 2003). The precipitation shadow diminishes to the north
16 of Victoria Valley. Within the valleys, the precipitation
Snow Accumulation (mm weq)
Explorers Cove increases with elevation and decreases from the coast
14
inland. A local precipitation maxima at the mouth of Tay-
12
lor Valley is probably due to the convergence of south-
10 westerly katabatic flow during winter as it slows down
8 upon reaching the mouth of Taylor Valley (Monaghan
et al., 2005). The uplift here may be further enhanced by
6
southeasterly winds that commonly flow from the Ross
4 Ice Shelf and into McMurdo Sound region. Unlike the
2 valleys to the north (Wright, Victoria), Taylor Valley is
open to the ocean without significant elevation to increase
0
J F M A M J J A S O N D precipitation through forced uplift. Each valley has a pre-
cipitation minimum. For Victoria and Wright Valleys, the
200
McMurdo Station minima are associated with the lowest elevation land-
scape of the valley. The minimum in Taylor Valley is
150 found inland of the Nussbaum Riegel, the 800-m-high
hill in the center of the valley, which may contribute
to a localized precipitation shadow on its upslope side
100 (i.e. Figure 5). The model data shown in Figure 7 agree
qualitatively with the spatial distribution of precipitation
inferred from the ground measurements in the valleys.
50
Modeled evaporation (not shown) is much larger than
precipitation in the valley bottoms, consistent with the
0 observations (Figure 6), which indicate that snow does
J F M A M J J A S O N D not persist for long.
To more closely examine the details of the spatial
Figure 3. Average monthly snow accumulation and precipitation, Lake
changes, we compare the modeled precipitation with that
Bonney over the period, 1995–2006; Explorers Cove 2000–2004; and
McMurdo Station 1973–1998. The gray bars are snow accumulation measured in Taylor Valley where we have the highest
and the black bars are the precipitation (katabatic events removed).
Snow accumulation at McMurdo Station is included for comparison; 100
note the difference in scale.
90
Snow Accumulation (mm weq)
80
radiosondes, satellite-derived cloud track winds, and sea 70
ice data. Because AMPS has relatively high spatial res- 60
olution over the Ross Island vicinity where the hub of 50
US logistical activities is, it is a useful tool for study- 40
ing the regional climatology in detail (Monaghan et al., 30
2005). Here we use 2.2-km spatial-resolution AMPS pre- 20
cipitation fields to assess MDV precipitation for a 1- 10
year period spanning September 2006–August 2007. This
0
period was chosen because it occurs shortly after AMPS 1995 1996 1997 1998 1999 2000 2001 2002 2003 2004 2005 2006
was upgraded from 3.3-km to 2.2-km resolution over the
MDV, which is sufficient to resolve the large topographic Figure 4. Snow accumulation at Lake Bonney. Gray bars represent
the total snow accumulation for that year and black bars are the
variation characteristic of the region. While employing precipitation (katabatic events removed). Error bars are based on
more than one year of data would be ideal for a clima- accuracy of instrument (2.5 mm) and the number of days with events
tological study, constraints due to the size of the dataset recorded.
Copyright 2009 Royal Meteorological Society Int. J. Climatol. (2009)
DOI: 10.1002/jocSNOW IN THE MCMURDO DRY VALLEYS, ANTARCTICA
100
Snow accumulation (WEQ mm)
Taylor Valley
80 Wright Valley
Victoria Valley y = -2.7 mm weq km-1
60
y = -0.3 mm weq km-1
40
20
Wright Valley Taylor Valley
y = -0.4 mm weq km-1
0
60 50 40 30 20 10 0
Distance from ocean (km)
N
Taylor Lake Explorers
Glacier Bonney Cove
Figure 5. Spatial gradient of snow accumulation in Taylor and Wright Valleys for 2004. The Landsat image of Taylor Valley depicts the same
horizontal scale as that of the graph. The white dots on the image show the locations of the meteorological stations and N indicates the location
of the Nussbaum Riegel.
Figure 6. Duration of snow cover at all the stations with sonic rangers from November 2002 to November 2006. The vertical gray bars indicate
the summer season from November through January. The period of record for each sonic ranger is indicated by a horizontal line and the boxes
indicate the presence of snow thicknesses >10 mm for at least one day.
density of precipitation gauges. Results show that the 6. Discussion
modeled precipitation is greater than the observed mean
precipitation (Figure 8). The overestimated precipitation Given the extreme winter conditions and long unat-
is probably due in part to the model’s topographic tended operation of the instruments, we found that using
representation, which is somewhat smoother than the both weighing bucket and sonic gauges worked well
observed topography of Taylor Valley, especially near together. Each instrument has its own operational issues
the Nussbaum Riegel. However, the observed error bars but together they provided a fairly complete depiction
indicate that some of the difference is due to the limited of snowfall and accumulation. Annual total snow accu-
model sample size (1 year); the maximum observed mulations are low, as expected from previous studies
values overlap the model values at several stations. (Keys, 1980; Bromley, 1985; Witherow et al., 2006;
Despite the model bias, Figure 8 indicates that the Bull, 1966; Fountain et al., 1999a; Fountain et al., 2006)
model is able to capture the general trend of decreasing and are due to the precipitation shadow created by the
precipitation inland from the coast within the narrow TransAntarctic Mountains (Monaghan et al., 2005). The
walls of Taylor Valley. largest annual accumulation, 98 mm weq, was measured
Copyright 2009 Royal Meteorological Society Int. J. Climatol. (2009)
DOI: 10.1002/jocA. G. FOUNTAIN ET AL.
Figure 7. A: Simulated annual total precipitation for the McMurdo Sound region using the AMPS 2.2 km Polar MM5 (Powers et al., 2003).
Ross Island is near the center of the image, and Mount Discovery is to the right of the lower right-hand corner of the box. The precipitation
shadow caused by Mount Discovery and adjacent topographic features is the dark blue patch north of Discovery and south of Ross Island. B:
Inset with enlargement of the Dry Valleys region (location of inset is indicated by black box in left panel, A). This figure is available in colour
online at www.interscience.wiley.com/ijoc
near the coast, Explorer’s Cove, in 2004, but most values
Annual precipitation (mm y-1weq)
120
were 10–50 mm weq. Modeling shows increased precip- 100 AMPS Transect
itation with elevation and with proximity to the coast. Observations
80
At the mouth of Taylor Valley, where elevation does not
play a role, we infer that increased precipitation is due to 60
enhanced atmospheric ascent. Local uplift is caused by 40
converging air flow at the mouth of Taylor Valley as it
20
decelerates and ‘piles up’, and perhaps is augmented by
an onshore component from near surface wind that blows 0
40 35 30 25 20 15 10 5 0
from the Ross Ice Shelf. The low-level precipitation-
Distance from coast (km)
bearing clouds that result may migrate up valley owing
to an upper-level return flow but are blocked by the Figure 8. Measured versus modeled precipitation for Taylor Valley.
Nussbaum Riegel, preventing further movement inland. The largest precipitation values are closest to the coast and the least
In Wright and Victoria Valleys, modeling suggests that are furthest from the coast.
precipitation minima are coincident with the lowest ele-
vations. At Lake Vanda, our snow accumulation values that transports snow from the Antarctic Plateau to the
are 18 and 30 mm weq, almost an order of magnitude western end of Wright Valley. These events may indeed
higher than that measured in the late 1960s–1970s of take place, but do not appear to be a common source of
3–4 mm weq (Keys, 1980; Bromley, 1985). As described snow to the valleys.
below, snow accumulation has increased in recent years Seasonality of snowfall depends on location in the val-
and our larger values at Lake Vanda probably reflect this leys. No seasonality is apparent at Lake Bonney and
increase. a distinct winter maximum appears at Explorers Cove,
Katabatic winds apparently contribute about half of when katabatic winds are strongest and most frequent
the accumulated snow, indicating that precipitation does (Nylen et al., 2004). Year-round observations for 3 years
not exceed about 50 mm weq in the valley bottom. We at Lake Vanda showed more frequent snowfall events
infer that katabatic winds must transport local snow from in summer but the monthly magnitude was no differ-
the nearby valley walls onto neighboring valley bottoms ent from winter months (Keys, 1980; Bromley, 1985).
because the ratio of precipitation to accumulation is about Our mass balance measurements on the glaciers (made
the same at all sites, ∼50%. If the snow was transported twice a year) show that either winter or summer can accu-
from the Antarctic Plateau, then the wind drift snow mulate the most snow. Because snow accumulation and
should be greater inland, closer to the ice sheet (e.g. precipitation are low, any one snow storm can shift max-
Lake Bonney), and diminish toward the coast. Keys imum accumulation between seasons as reflected in the
(1980) argues for the occasional severe katabatic event seasonal results on the glaciers (Fountain et al., 2006).
Copyright 2009 Royal Meteorological Society Int. J. Climatol. (2009)
DOI: 10.1002/jocSNOW IN THE MCMURDO DRY VALLEYS, ANTARCTICA
Regional moisture and precipitation in this region results 7. Conclusions
from low-pressure systems migrating from the northern
The MDV is in a precipitation shadow of the
latitudes (Bromwich and Wang, 2008; Carrasco et al.,
TransAntarctic Mountains, blocking precipitation bearing
2003; Bromley, 1985). We had hypothesized that more cyclonic storms that migrate southward over the Ross
snow is received when the edge of the sea ice is closer, Sea. Our measurements show that the MDV is, indeed,
providing a local moisture source; however, we did not a polar desert, with annual precipitation not exceeding
find any significant correlations. The sea ice edge is clos- 50 mm weq. However, a precipitation maximum is
est to the valley in early March and rapidly advances limited to the coastal margin of Taylor Valley and is
northward in April (Kimura, 2007), yet maximum pre- caused by the winter convergence of local wind regimes
cipitation at Explorers Cove occurs in June. that produce localized uplift. The minimum recorded
Annual snow accumulation decreases inland from the value of snow accumulation is 3 mm weq at Lake
coast; the accumulation gradient is more steep, −2.7 mm Bonney of which we estimate two-thirds is precipitation
km−1 , near the coast and less steep inland, −0.3 mm and the remaining one-third is snow drift. Snow
km−1 . The change in gradient is associated with a large accumulation decreases inland and a particularly strong
800-m-tall hill, the Nussbaum Riegel, which occupies gradient exists in Taylor Valley, probably controlled by
the center of the valley. The abrupt decrease in snow local meteorological conditions that produce uplift and
accumulation inland (west) of the Nussbaum Riegel has increased snowfall at the coastal end of the valley.
been frequently observed in the field and is reflected in Wind drift snow is an important contribution to the
the abrupt rise of the glacier equilibrium line altitude total snow accumulation on the valley floors. Katabatic
(where snow accumulation equals ablation resulting in winds transport snow from the valley walls and glaciers,
no mass change) (Fountain et al., 1999a). The change and occasionally from the Antarctic Plateau, that roughly
in precipitation gradient probably reflects the enhanced doubles the snow accumulation on the valley floor. The
snowfall at the valley mouth, described previously, and persistence of snow on the valley floors is greater in
the barrier formed by the Nussbaum Riegel that blocks winter than in summer, as one might expect, but is
the low clouds from migrating up valley. We commonly subject to large spatial variability. Winter snow lasts the
observe clouds on the coastal (eastern) side of the Riegel, longest at Lake Vida where it persists nearly all winter,
whereas the inland (western) side is cloud free. The lower but it rarely lasts more than a week at Lake Bonney.
accumulation gradient beyond the Nussbaum Riegel The difference is probably due to the mass of snow
(−0.3 mm km−1 ) is very close to that observed in Wright accumulated at each site and the frequency of katabatic
events that erode and sublimate the snow cover.
Valley (−0.4 mm km−1 ) and may represent accumulation
from those few large snow storms that override the barrier
imposed by the TransAntarctic Mountains and penetrate Acknowledgements
the deeper portions of the valleys, as well as snow blown
The work by Fountain, Nylen, and Basagic was supported
to the valley bottom by the katabatic winds.
by NSF grants OPP 0096250 and ANT-0423595. The
Modeling shows that in the valley bottom sublimation AMPS analysis by Monaghan and Bromwich was funded
(not shown) far exceeds precipitation, consistent with by the National Science Foundation with grants ANT-
the limited duration of snow cover shown in Figure 6. 0636523 and ATM-0404790. We also wish to acknowl-
The persistence of winter snow is greatest at Lake Vida edge the efforts of many individuals at Raytheon Support
in Victoria Valley, nearly all winter, and least at Lake Services, the pilots and crew of PHI who facilitated the
Bonney in Taylor Valley, a few days to a week. This completion of this project in many ways. We would like
difference is probably due to greater snowfall at Lake to specifically thank Rae Spain and Rob Edwards.
Vida and due to the large local inversions that protect the
snow from erosion and sublimation by winter katabatic
References
winds. Nylen et al. (2004) showed that Lake Bonney
Bertler NAN, Mayewski PA, Barrett PJ, Sneed SB, Handley MJ,
had the most frequent katabatic events and Lake Vida Kreutz KJ. 2004. Monsoonal circulation of the McMurdo Dry
had fewest, and hypothesized that strong inversions over Valleys. Annals of Glaciology 39: 139–145.
Lake Vida resisted erosion by all but the strongest events. Bockheim JG. 2002. Landform and soil development in the McMurdo
Dry Valleys, Antarctica: a regional synthesis. Arctic, Antarctic, and
Most likely, the combination of snow depth and katabatic Alpine Research 44: 308–317.
winds controls the persistence of snow-covered ground Brazenec WA, Doesken NJ. 2005. An evaluation of two ultrasonic
elsewhere in the valleys. How much of the moisture snow depth sensors for potential use at automated surface weather
observing sites, 13th Symposium on Meteorological Observations and
from the snow enters the ground is unclear because much Instrumentation, American Meteorological Society, Savannah, GA.
of it sublimates prior to melting (Chinn, 1981). Indeed, Bromley AM. 1985. Weather Observations Wright Valley, Antarctica.
New Zealand Meteorological Service: Wellington, New Zealand; 25.
snow patches that persist well into summer (December) Bromwich DH, Cassano JJ, Klein T, Heinemann G, Hines KM,
largely sublimate rather than melt (Gooseff et al., 2003). Steffen K, Box JE. 2001. Mesoscale modeling of katabatic winds
Therefore, these values of precipitation can only be used over Greenland with the Polar MM5. Monthly Weather Review 129:
2290–2309.
as a maximum upper bound on moisture recharge to the Bromwich DH, Wang S-H. 2008. A review of the temporal and spatial
soils. variability of Arctic and Antarctic atmospheric circulations based
Copyright 2009 Royal Meteorological Society Int. J. Climatol. (2009)
DOI: 10.1002/jocA. G. FOUNTAIN ET AL.
upon ERA-40. Dynamics of Atmospheres and Oceans 44: 213–243, from Victoria Valley, Antarctica. Journal Geophysical Research 112:
DOI: 10.1016/j.dynatmoce.2007.09.001. F03017, doi:10.1029/2006JF000580.
Bull C. 1966. Climatological observations in ice-free areas of Southern Harris KJ, Carey AE, Lyons WB, Welch KA, Fountain AG. 2007.
Victoria Land, Antarctica. Antarctic Research Series 9: 177–194. Solute isotope geochemistry of subsurface ice melt seeps in Taylor
Carrasco JE, Bromwich DH, Monaghan AJ. 2003. Distribution and Valley, Antarctica. GSA Bulletin 119: 548–555.
characteristics of mesoscale cyclones in the Antarctic: Ross Sea Howard-Williams C, Schwarz A, Hawes I, Priscu JC. 1998. Ecosystem
eastward to the Weddell Sea. Monthly Weather Review 131: Dyanmics in a Polar Desert, Vol. 72, Priscu JC (ed). American
289–301. Geophysical Union: Washington; 189–203.
Chinn TJ. 1981. Hydrology and climate in the Ross Sea area. Journal Keys JR 1980. Air Temperature, Wind, Precipitation and Atmospheric
of the Royal Society of New Zealand 11: 373–386. Humidity in the McMurdo Region, Victoria, Antarctic Data Series.
Chinn TJ. 1988. Satellite Image Atlas of the World, Antarctica Victoria University: Wellington; 25.
(Richard S, Williams J and Ferrigno JG) US Geological Survey: Kimura N. 2007. Mechanisms controlling the temporal variation of the
Professional Paper 1386-B; B39–B54. sea ice edge in the Southern Ocean. Journal of Oceanography 63:
Chinn TJH. 1993. Physical and Biogeochemical Processes in 685–694.
Antarctic Lakes, Vol. 59, Green WJ, Friedmann EI (eds). American McKnight DM, Niyogi DK, Alger AS, Bomblies A, Conovitz PA,
Geophysical Union: Washington; 1–52. Tate CM. 1999. Dry valley streams in Antarctica: Ecosystems
Clow GD, McKay CP, Simmons GAJ, Wharton RAJ. 1988. Climato- waiting for water. Bioscience 49: 985–995.
logical observations and predicted sublimation rates at Lake Hoare, Monaghan AJ, Bromwich DH, Powers JG, Manning KW. 2005. The
Antarctica. Journal of Climatology 1: 715–728. climate of the McMurdo, Antarctica, region as represented by one
Denton GH, Marchant DR. 2000. The geologic basis for a year of forecasts from the Antarctic Mesoscale Prediction System.
reconstruction of a grounded ice sheet in McMurdo Sound, Journal of Climate 18: 1174–1189.
Antarctica, at the last glacial maximum. Geografiska Annaler Series Nylen TH, Fountain AG, Doran P. 2004. Climatology of Katabatic
A-Physical Geography 82A: 167–211. Winds in the McMurdo Dry Valleys, southern Victoria Land,
Doran PT, McKay CP, Clow GD, Dana GL, Fountain AG, Nylen TH, Antarctica. Journal of Geophysical Research 109: D03114.
Lyons WB. 2002. Climate Observations from the McMurdo Powers JG, Monaghan AJ, Cayette AM, Bromwich DH, Kuo YH,
Dry Valleys, Antarctica, 1986–2000. Journal of Geophysical Manning KW. 2003. Real-time mesoscale modeling over Antarctica:
Research–Atmospheres 107: 1–12. The Antarctic Mesoscale Prediction System (AMPS). Bulletin of the
Drewery DJ, Jordan SR, Jankowski E. 1982. Measured properties of American Meteorological Society 84: 1533–1545.
the Antarctic ice sheet: surface configuration, ice thickness, volume Priscu JC, Wolf CF, Takacs CD, Fritsen CH, Laybourn-Parry J,
and bedrock characteristics. Annals of Glaciology 3: 83–91. Roberts EC, Sattler B, Lyons WB. 1999. Carbon transformations in
Fountain AG, Lewis KJ, Doran PT. 1999a. Spatial climatic variation a perennially ice-covered Antarctic lake. Bioscience 49: 997–1008.
and its control on glacier equilibrium line altitude in Taylor Valley, Simmonds I, Keay K, Lim EP. 2003. Synoptic activity in the seas
Antarctica. Global and Planetary Change 22: 1–10. around Antarctica. Monthly Weather Review 131: 272–288.
Fountain AG, Lyons WB, Burkins MB, Dana GL, Doran PT, Lewis Stuiver M, Yang IC, Denton GH, Kellog TB 1981. Antarctic Research
KJ, McKnight DM, Moorhead DL, Parsons AN, Priscu JC, Wall Series: Dry Valley Drilling Project, McGinnis LD (ed) American
DH, Wharton RA, Virginia RA. 1999b. Physical controls on the Geophysical Union: Washington, DC; 131–139.
Taylor Valley ecosystem, Antarctica. Bioscience 49: 961–971. Sugden DE, Marchant DR, Potter N, Souchez RA, Denton GH,
Fountain AG, Nylen TH, MacClune KJ, Dana GL. 2006. Glacier Swisher CC, Tison JL. 1995. Preservation of Miocene Glacier Ice
mass balances (1993–2001) Taylor Valley, McMurdo Dry Valleys, in East Antarctica. Nature 376: 412–414.
Antarctica. Journal of Glaciology 52: 451–465. Wall DH, Virginia RA. 1999. Controls on soil biodiversity: insights
Goodison BE, Turner BR and Metcalfe JR. 1983. A Nipher-type from extreme environments. Applied Soil Ecology 13: 137–150.
shield for recording precipitation gauges, The 5th Conference Witherow RA, Lyons WB, Bertler NAN, Welch KA, Mayewski PA,
on Meterological Observations and Instrumentation, American Sneed SB, Nylen T, Handley MJ, Fountain A. 2006. The aeolian
Meteorological Society, Boston, 21–26. flux of calcium, chloride, and nitrate to the McMurdo Dry Valleys
Gooseff MN, Barrett JE, Doran PT, Fountain AG, Lyons WB, Par- landscape: evidence from snow pit analysis. Antarctic Science 18:
sons AN, Porazinska DL, Virginia RA, Wall DH. 2003. Snow-patch 497–505.
influence on soil biogeochemical processes and invertebrate distri- Yang D, Goodison BE, Metcalfe JR, Louie P, Leavesley G, Emer-
bution in the McMurdo Dry Valleys, Antarctica. Arctic, Antarctic, son D, Hanson CL, Golubev VS, Elomaa E, Gunther T, Pang-
and Alpine Research 35: 91–99. burn T, Kang E, Milkovic J. 1999. Quantification of precipitation
Hagedorn B, Sletten RS, Hallet B. 2007. Sublimation and ice measurement discontinuity induced by wind shields on national
condensation in hyperarid soils: modeling results using field data gauges. Water Resources Research 35: 491–508.
Copyright 2009 Royal Meteorological Society Int. J. Climatol. (2009)
DOI: 10.1002/jocYou can also read