Kegel Exercises, Biofeedback, Electrostimulation, and Peripheral Neuromodulation Improve Clinical Symptoms of Fecal Incontinence and Affect ...

Page created by Teresa Herrera
 
CONTINUE READING
Kegel Exercises, Biofeedback, Electrostimulation, and Peripheral Neuromodulation Improve Clinical Symptoms of Fecal Incontinence and Affect ...
JNM
                             J Neurogastroenterol Motil, Vol. 27 No. 1 January, 2021
                             pISSN: 2093-0879 eISSN: 2093-0887
                             https://doi.org/10.5056/jnm20013
                             Journal of Neurogastroenterology and Motility                                          Original Article

 Kegel Exercises, Biofeedback, Electrostimulation,
 and Peripheral Neuromodulation Improve Clinical
 Symptoms of Fecal Incontinence and Affect
 Specific Physiological Targets: An Randomized
 Controlled Trial

      Lluís Mundet,1,2* Laia Rofes,1,2,3 Omar Ortega,1,2 Christopher Cabib,1 and Pere Clavé1,2
      1
       Gastrointestinal Physiology Laboratory, Department of Surgery, Hospital de Mataró, Universitat Autònoma de Barcelona, Mataró, Spain;
      2
       Centro de Investigación Biomédica en Red de enfermedades hepáticas y digestivas (CIBERehd), Instituto de Salud Carlos III, Barcelona, Spain;
      and 3Neos Surgery, Parc Tecnològic del Vallès, Cerdanyola del Vallès, Barcelona, Spain (Current address)

  Background/Aims
  Fecal incontinence (FI) is a prevalent condition among community-dwelling women, and has a major impact on quality of life (QoL).
  Research on treatments commonly used in clinical practice—Kegel exercises, biofeedback, electrostimulation, and transcutaneous
  neuromodulation—give discordant results and some lack methodological rigor, making scientific evidence weak. The aim is to assess
  the clinical efficacy of these 4 treatments on community-dwelling women with FI and their impact on severity, QoL and anorectal
  physiology.
  Methods
  A randomized controlled trial was conducted on 150 females with FI assessed with anorectal manometry and endoanal
  ultrasonography, and pudendal nerve terminal motor latency, anal/rectal sensory-evoked-potentials, clinical severity, and QoL were
  determined. Patients were randomly assigned to one of the following groups: Kegel (control), biofeedback + Kegel, electrostimulation
  + Kegel, and neuromodulation + Kegel, treated for 3 months and re-evaluated, then followed up after 6 months.
  Results
  Mean age was 61.09 ± 12.17. Severity of FI and QoL was significantly improved in a similar way after all treatments. The effect on
  physiology was treatment-specific: Kegel and electrostimulation + Kegel, increased resting pressure (P < 0.05). Squeeze pressures
  strongly augmented with biofeedback + Kegel, electrostimulation + Kegel and neuromodulation + Kegel (P < 0.01). Endurance of
  squeeze increased in biofeedback + Kegel and electrostimulation + Kegel (P < 0.01). Rectal perception threshold was reduced in the
  biofeedback + Kegel, electrostimulation + Kegel, and neuromodulation + Kegel (P < 0.05); anal sensory-evoked-potentials latency
  shortened in patients with electrostimulation + Kegel (P < 0.05).
  Conclusions
  The treatments for FI assessed have a strong and similar efficacy on severity and QoL but affect specific pathophysiological
  mechanisms. This therapeutic specificity can help to develop more efficient multimodal algorithm treatments for FI based on
  pathophysiological phenotypes.
  (J Neurogastroenterol Motil 2021;27:108-118)

  Key Words
  Biofeedback; Electric stimulation; Fecal incontinence; Pelvic floor disorders; Transcutaneous electric nerve stimulation

                                                ⓒ 2021 The Korean Society of Neurogastroenterology and Motility

108                                          J Neurogastroenterol Motil, Vol. 27 No. 1 January, 2021
                                                               www.jnmjournal.org
RCT of 4 Treatments for Fecal Incontinence

  Received: January 29, 2020 Revised: April 16, 2020 Accepted: July 3, 2020
    This is an Open Access article distributed under the terms of the Creative Commons Attribution Non-Commercial License (http://creativecommons.
     org/licenses/by-nc/4.0) which permits unrestricted non-commercial use, distribution, and reproduction in any medium, provided the original work
     is properly cited.
  *Correspondence: Lluís Mundet, PhD, RN
                      Gastrointestinal Physiology Laboratory, Hospital de Mataró, Carretera de Cirera, 230, Mataró 08304, Barcelona, Spain
                      Tel: +34-937-417-700, E-mail: lluismundetp@gmail.com

                                                                              no advantage of BF over K.11 Regarding ES, significant differences
                                                                              vs controls have not been found, but a recent study12 claimed that
Introduction                                                                  a combination of BF + ES was more effective than monotherapy;
     Fecal incontinence (FI) is a common condition affecting up to            overall however, there is not enough evidence to judge the efficacy
15% of community-dwellers.1 It is socially disabling, and although            of ES or to select the right patients for this treatment.13 Regarding
clinical severity correlates with impaired QoL,2 it has recently been         peripheral NM, 2 systematic reviews concluded that NM can be
illustrated that the most important independent factor impacting              an effective therapy for FI,14 but a recent multi-center study showed
QoL is gender.3                                                               discouraging results.15 Overall there is a high degree of variability
     FI occurs when one or more structures and functions involved             in study design and results, and furthermore, there is considerable
in continence are disrupted, and when the remaining mechanisms                heterogeneity in the translation of these results into clinical practice.
are unable to compensate. Anal sphincter weakness––due to direct                   Additionally, the effect of these treatments on anorectal physiol-
muscular damage or neuropathic injury, rectal sensitivity impair-             ogy is even less clearly understood. K and BF focus on the mechan-
ment, and loose fecal consistency4 are some of the most common                ical action of the pelvic floor muscles, but a classic study16 found no
factors involved, and these frequently overlap. In a recent study we          changes in mean resting pressure (MRP) or squeeze pressure (SP)
confirmed that, besides mechanical external anal sphincter (EAS)              in patients treated with BF; according to others, BF can indeed
and internal anal sphincter dysfunctions due mainly to obstetric              improve MRP,17 SP,18-20 as well as endurance of SP (ESP), recto-
factors, previously unexplored impaired and delayed conduction                anal coordination, and rectal perception.18 With regard to ES, it has
through sensory anorectal pathways and secondary reduced corti-               been suggested that it has an effect not only on slow and fast-twitch
cal activation in response to electrical stimulation are very prevalent       fibers of the muscle, but also on the very same neural pathways.13,21
pathophysiological factors associated with FI in women.5 In effect            Regarding NM, the action mechanism is little known, but it has
the proportion of patients with FI with an afferent/sensory dys-              been strongly suggested that it affects both motor and sensorial
function was much higher than in the case of those with peripheral            functions.22 Overall, the efficacy of the treatments is probably highly
pudendal motor conduction impairments, which is a well-known                  dependent on the pathophysiology underlying FI, hence the discor-
pathophysiological mechanism for FI.5                                         dant results, so it is key on one hand to understand the pathophysi-
     FI treatment remains a clinical challenge. Surgical procedures           ology, and on the other, to understand the action mechanisms of the
have quite unpredictable long-term results in the long-term, and              treatments.
therefore conservative rehabilitation treatments are recommended                   The main aim is to compare the clinical efficacy of 4 rehabilita-
as a first line treatment. These include Kegel exercises (K), bio-            tion techniques (K, BF, ES, and tNM) in reducing the severity of
feedback (BF), endoanal or endovaginal electrostimulation (ES),               FI symptoms in community-dwelling women and to explore their
or tibial nerve neuromodulation (NM) through percutaneous or                  influence on anorectal physiology at a biomechanical and, second-
transcutaneous electrodes (tNM). Although their use is common,                arily at a neurophysiological level. We hypothesize that BF, ES, and
there is a lack of evidence about their clinical efficacy, and the physi-     tNM are superior treatments for FI compared to K, and that they
ological targets they affect are not fully understood, often resulting        affect specific aspects of impaired anorectal physiology.
in an empirical choice of treatment.6,7 Pelvic floor exercises or K, al-
though a commonly recommended treatment for FI patients, have
demonstrated their utility as a coadjutant treatment only, and not
                                                                              Materials and Methods
as a stand-alone one.8 Regarding BF therapy, this is considered a                Patients attending the gastrointestinal physiology unit from
first-line treatment.9 However, studies which have tried to assess its        February 2013 to March 2017 with a history of more than 6
efficacy do not show consistent results,10 and at least 1 study showed        months of FI symptoms were consecutively screened. Patients with

                                                        Vol. 27, No. 1 January, 2021 (108-118)                                                      109
Lluís Mundet, et al

mild FI (Cleveland < 4), under 18 years of age, and those unable                                 sultation on Incontinence Questionnaire (ICIQ) score.25 FI-related
to follow the treatment properly were excluded. The study was con-                               QoL and general health-related QoL were assessed using Fecal
ducted according to the principles laid down in the Declaration of                               Incontinence Quality of Life (FIQL) score2 and EQ-5D,26 respec-
Helsinki, and obtained Ethics Committee approval (code: 67/12).                                  tively.
Written informed consent was obtained from the participants.
     This is a randomized controlled trial (RCT) with a parallel                                 Anal sphincter structure
design (TrialsGov: NCT03394794) with 4 treatment arms: K (base                                       A Hitachi ultrasound (endoanal ultrasonography [EUS]) with
treatment, control group), BF + K, ES + K, and tNM + K, with                                     an endoanal 10-MHz transducer (Hitachi Medical Corporation,
a calculated sample of 45 patients in each group. Sample size was                                Tokyo, Japan) was used to assess internal/external sphincters and
calculated to assess changes in severity (primary endpoint) of an                                puborectalis anatomic integrity.5
active treatment compared to control (K) with Granmo software
version 7.12 (IMIM, Barcelona, Spain) assuming an alpha risk of                                  Anorectal manometry
0.05 and a beta risk of 0.20, a SD of 3.2 (for Cleveland score) and a                                 Anorectal function was studied using conventional anorectal
minimum expected difference of 2. A simple randomization method                                  manometry to measure MRP, SP, and ESP. To assess ESP, 4 com-
was performed using QuickCalcs (GraphPad Software, San Diego,                                    mon pressure profiles were identified when patients held SP for 10
USA). The study had 2 stages: an initial 3-month stage with the                                  seconds.5 Cough reflex, sensory thresholds, and rectoanal inhibitory
patients receiving the assigned treatment to assess its efficacy (ef-                            reflex (RAIR) were also assessed. Data was acquired using a Poly-
fect on clinical severity and QoL) and its effect on physiology, and                             graph ID (Medtronic, Minneapolis, MN, USA). All these proce-
a second 3-month stage, continuing only with K as a maintenance                                  dures are fully described previously,5 and are those recommended
treatment to evaluate the persistence of the effects of the treatment                            by the Spanish Motility Group.
(clinical severity and QoL) (Fig. 1).
     Primary endpoint was the change before and after treatments in                              Pudendal nerve terminal motor latency
the severity score (Cleveland score); secondary outcomes were the                                     In a randomized subsample of 10 patients from each thera-
effects on the anorectal physiology and neurophysiology.                                         peutic group, the terminal efferent pathway was also studied with
                                                                                                 pudendal nerve terminal motor latency (PNTML) (Neuromodule,
Diagnostic and Therapeutic Methods                                                               MMS, Enschede, the Netherlands) on both sides.5 Metrics re-
     Demographics and complete medical histories, comorbidities,                                 corded and analyzed were latency of the compound muscle action
risk factors, and medications were collected on Visit 1.                                         potential (CMAP), amplitude, duration, and area under the curve
                                                                                                 of the CMAP.27
Clinical severity and quality of life assessment
    FI clinical severity was assessed using the Cleveland Inconti-                               Event-related long-latency anorectal sensory evoked
nence Score,23 fecal consistency with the Bristol Stool Chart,24 and                             potentials and sensory thresholds
severity of urinary incontinence (UI) with the International Con-                                      In a second randomized subsample of 10 patients from each

      Baseline        Active treatment (K, BF + K, ES + K, NM + K)                             Maintenance (K)

         V1                   V2    1st month     V3       2nd month     V4   3rd month     V5       3-month     V6

 Medical history        Randomization           Severity               Severity       Physiology               Severity
    Physiology           Explanation of          QoL                    QoL               Severity              QoL                         Figure 1. Study design. Baseline, active
                                                                                                                             End of study

 Pathophysiology
                           treatment
                                                                                           QoL                                              treatment period, and follow-up period.
      Etiology
                       Start of treatment                                                                                                   K, Kegel exercises; BF, biofeedback; ES,
                                                                                  End of treatment
                                                                                                                                            electrostimulation; tNM, transcutane-
      Severity
                                                                                                                                            ousneuromodulation; ARM, anorectal
        QoL
                                                                                                                                            manometry; EUS, endoanal ultrasonog-
  Pre-treatment
   assessment
                                                                                   Post-treatment
                                                                                    assessment
                                                                                                                                            raphy; PNTML, pudendal nerve termi-
                                                                                                                                            nal motor latency; SEP, sensory evoked
                                                                                       Effect               Persistence
                                                                                  of the treatment        of the treatment                  potentials.

110                                                              Journal of Neurogastroenterology and Motility
RCT of 4 Treatments for Fecal Incontinence

therapeutic group, sensory evoked potential (SEP) to anal (ASEP)            ramp-up, 5 seconds on, 0.5-second ramp-down, and 5 seconds off.
and rectal (RSEP) electrical stimulation were studied. Anal and             Patients were told to increase intensity until reaching their tolerance
rectal mucosa were stimulated using a customized probe. Electro-            threshold.29
encephalographic signals were analyzed and SEP obtained in Cz (at                Group 4. tNM + K: In addition to K, patients were instructed
the vertex scalp) for being the cortical site of maximal representation     on the home use of a neuromodulation unit (Elpha 3000 Conti;
after anorectal stimulation. Latencies of the peaks p1, n1, p2, and         Danmeter A/S) provided with self-adhesive transcutaneous elec-
n2 were analyzed, as well as amplitudes of p1-n1, n1-p2, and p2-            trodes (one above tibial malleolus and 2 cm from the medial line,
n2.5                                                                        and a second one below the malleolus), and used for 30 minutes a
                                                                            day, 5 days a week; at 20 Hz with a pulse width of 200 microsec-
Treatments                                                                  onds. Stimulation was increased until a motor response of the first
     Group 1. K (control): Patients were given oral and written in-         toe was observed, this being the therapeutic intensity for the pa-
structions on how to perform K at home. They had to exercise for            tient.30
10 minutes 3 times a day for a 3-month period. The exercises in-
cluded maximal fast and sustained squeeze exercises (Supplementary          Statistical Methods
Fig. 1).                                                                        Continuous variables were expressed as means (SD) and com-
     Group 2. BF + K: In addition to K, patients received six               pared with t tests or non-parametric tests when appropriate. ANO-
45-minute BF sessions administered by a specialist nurse (Supple-           VA was used to compare more than 2 groups. Categorical variables
mentary Fig. 2). BF training was focused on the strengthening of            were compared with chi-square/Fisher’s exact tests. Normal range
the EAS muscle28 and the coordination of EAS contraction with               limits were calculated from our own laboratory data gathered in
rectal distention. Sensory training was not performed. Patients laid        healthy volunteers.5 To assess the differences in the cortical localiza-
down looking at a monitor that mirrored the tracings of a mano-             tion of the SEP before-after treatments, the sLORETA software
metric BF unit. The type of exercises was the same as K.                    (KEY Foundation for Brain-Mind Research, Zurich, Switzerland)
     Group 3. ES + K: In addition to K, patients were instructed            was used.5,31 P -values < 0.05 were considered statistically signifi-
on the home use of an electric stimulation unit (Elpha 3000 Conti;          cant.
Danmeter A/S, Odense, Denmark) with a “Periform+” endovagi-                     Patients were divided into responders and non-responders to
nal probe (Neen Healthcare, Dereham, UK). The stimulator was                the treatments, the first being those where severity changed from
to be used for 30 minutes a day, 5 days a week, set at a frequency of       Cleveland ≥ 9 to < 9 post treatment (those with Cleveland < 9
35 Hz, pulse-width of 300 microseconds with cycles of 0.5-second            prior to treatment were not taken into account). The reason for this

                                Assesed for elegibility (N = 224)

                                                           Excluded (n = 44)
                                                             Not meeting inclusion criteria (n = 19)
                                                              Declined to participate (n = 25)

                                     Randomized (n = 180)

 K (n = 45)               BF + K (n = 45)          ES + K (n = 45)        tNM + K (n = 45)
    25 ARM + EUS            25 ARM + EUS             25 ARM + EUS           25 ARM + EUS
    10 + PNTML              10 + PNTML               10 + PNTML             10 + PNTML                    Figure 2. Flow diagram of patients’ re-
    10 + SEP                10 + SEP                 10 + SEP               10 + SEP                      cruitment and drop outs, with final par-
                                                                                                          ticipants in each arm. K, Kegel exercises;
 Dropped out (n = 8)      Dropped out (n = 9)      Dropped out (n = 6)    Dropped out (n = 3)             BF, biofeedback; ES, electrostimulation;
 Withdrawn (n = 1)        Withdrawn (n = 0)        Withdrawn (n = 0)      Withdrawn (n = 2)               tNM, transcutaneous neuromodulation;
                                                                                                          ARM, anorectal manometry; EUS,
 36 Completed             36 Completed             39 Completed           40 Completed                    endoanal ultrasonography; PNTML,
  (21 general study,       (21 general study,       (19 general study,     (24 general study,             pudendal nerve terminal motor latency;
  6 PNTML, 9 SEP)          8 PNTML, 7 SEP)          10 PNTML, 10 SEP)      6 PNTML, 10 SEP)               SEP, sensory evoked potentials.

                                                      Vol. 27, No. 1 January, 2021 (108-118)                                                      111
Lluís Mundet, et al

cut-off point for the assessment of the response to treatment de-

                                                                                                                                                                                                     10.92 ± 4.14 7.46 ± 4.42 < 0.001 12.08 ± 3.27 7.08 ± 5.39 < 0.001 11.54 ± 3.70 5.85 ± 4.71 < 0.001 12.35 ± 3.96 6.73 ± 4.41 < 0.001

                                                                                                                                                                                                                                                                                                                                                                 < 0.001
                                                                                                                                                                                                                                                                                                                                                                 < 0.001
                                                                                                                                                                                                                                                                                                                                                                 < 0.001
                                                                                                                                                                                                                                                                                                                                                                 < 0.001
                                                                                                                                                                                          P -value
                                                                                                                                                         Transcutaneous neuromodulation

                                                                                                                                                                                                                                                                                                                                                                   NS
rives from previous studies that demonstrated that in patients with
Cleveland < 9 the impact on QoL was very low, compared with

                                                                                                                                                                                                                                                                                                                                                                 3.39 ± 0.70
                                                                                                                                                                                                                                                                                                                                                                 3.32 ± 0.60
                                                                                                                                                                                                                                                                                                                                                                 3.00 ± 0.84
                                                                                                                                                                                                                                                                                                                                                                 3.39 ± 0.70
                                                                                                                                                                                                                                                                                                                                                                 0.67 ± 0.30
patients with Cleveland ≥ 9.2,32 To facilitate comparison with results

                                                                                                                                                                                                                                                                                                                                           –45.51%
                                                                                                                                                                                                                                                                                                                                            56.3%

                                                                                                                                                                                                                                                                                                                                                        47.5%
                                                                                                                                                                                          Post
                                                                                                                                                                    + Kegel
from other studies, we also analyzed the results by considering as
responders those patients with a reduction of ≥ 50% in the clinical
severity of FI (Table).

                                                                                                                                                                                                                                                                                                                                                                 2.99 ± 0.89
                                                                                                                                                                                                                                                                                                                                                                 2.89 ± 0.71
                                                                                                                                                                                                                                                                                                                                                                 2.34 ± 0.89
                                                                                                                                                                                                                                                                                                                                                                 2.99 ± 0.89
                                                                                                                                                                                                                                                                                                                                                                 0.69 ± 0.25
                                                                                                                                                                                          Pre
Results

                                                                                                                                                                                                                                                                                                                                                                 < 0.001
                                                                                                                                                                                                                                                                                                                                                                 < 0.001
                                                                                                                                                                                                                                                                                                                                                                 < 0.001
                                                                                                                                                                                                                                                                                                                                                                 < 0.001
                                                                                                                                                                                                                                                                                                                                                                   0.008
                                                                                                                                                                                          P -value
     One hundred and eighty patients were included in the study
and randomly assigned to one of the treatment groups (Fig. 2). The

                                                                                                                                                                                                                                                                                                                                           (vs K, P = 0.039)
mean age was 61.09 ± 12.17 years. Complettion of the study was

                                                                                                                                                         Electrostimulation

                                                                                                                                                                                                                                                                                                                                                                 3.53 ± 0.67
                                                                                                                                                                                                                                                                                                                                                                 3.36 ± 0.62
                                                                                                                                                                                                                                                                                                                                                                 2.99 ± 0.83
                                                                                                                                                                                                                                                                                                                                                                 3.20 ± 0.77
                                                                                                                                                                                                                                                                                                                                                                 0.80 ± 0.22
                                                                                                                                                                                                                                                                                                                                                –49.31%
                                                                                                                                                                                                                                                                                                                                                  65.6%

                                                                                                                                                                                                                                                                                                                                                  46.2%
36 patients in the K, 36 in the BF + K, 39 in the ES + K, and 40

                                                                                                                                                                                          Post
                                                                                                                                                              + Kegel
in the tNM + K group. Drop out was due to discomfort, an inabil-
ity to self-administer the treatments, or the fact that patients simply

                                                                                                                                                                                                                                                                                                                                                                 3.14 ± 0.76
                                                                                                                                                                                                                                                                                                                                                                 2.88 ± 0.76
                                                                                                                                                                                                                                                                                                                                                                 2.22 ± 0.78
                                                                                                                                                                                                                                                                                                                                                                 2.41 ± 0.74
                                                                                                                                                                                                                                                                                                                                                                 0.67 ± 0.22
did not return despite being sent reminders.

                                                                                                                                                                                          Pre
Baseline Parameters
     The full clinical characteristics and pathophysiology of FI in

                                                                                                                                                                                                                                                                                                                                                                 < 0.001
                                                                                                                                                                                                                                                                                                                                                                 < 0.001
                                                                                                                                                                                                                                                                                                                                                                 < 0.001
                                                                                                                                                                                                                                                                                                                                                                 < 0.001
                                                                                                                                                                                                                                                                                                                                                                   0.035
                                                                                                                                                                                          P -value
these patients have been previously published (Supplementary
Tables 1 and 2).5 Most patients had a history of obstetric risk fac-

                                                                                                                                                                                                                                                                                                                                                                 3.46 ± 0.69
                                                                                                                                                                                                                                                                                                                                                                 3.20 ± 0.78
                                                                                                                                                                                                                                                                                                                                                                 2.91 ± 0.57
                                                                                                                                                                                                                                                                                                                                                                 3.05 ± 0.78
                                                                                                                                                                                                                                                                                                                                                                 0.68 ± 0.30
tors, and pathophysiology was mainly associated with mechanical
                                                                                                                                                                                                                                                                                                                                           –41.39%
                                                                                                                                                         Biofeedback

                                                                                                                                                                                                                                                                                                                                            46.7%

                                                                                                                                                                                                                                                                                                                                                        41.7%
                                                                                                                                                                                          Post
                                                                                                                                                          + Kegel

sphincter dysfunctions, most showing urge FI (83.1%; from these,
44.7% also with passive FI), mainly due to EAS weakness because
of muscular sphincteric damage and, to a lesser degree, to sphincter
                                                                                                                                                                                                                                                                                                                                                                               0.020 3.04 ± 0.78
                                                                                                                                                                                                                                                                                                                                                                 3.18 ± 0.67 < 0.001 2.76 ± 0.63
                                                                                                                                                                                                                                                                                                                                                                 2.78 ± 0.76 < 0.001 2.23 ± 0.78
                                                                                                                                                                                                                                                                                                                                                                 3.12 ± 0.84 < 0.001 2.41 ± 0.76
                                                                                                                                                                                                                                                                                                                                                                 0.61 ± 0.26 NS 0.59 ± 0.26
denervation. Passive FI alone was present in 17%. On the sensorial
                                                                                                                                                                                          Pre

side, more than a quarter had rectal sensitivity impairments (mainly
                                                                             Table. Effects of the Treatments on Clinical Severity and Quality of Life

                                                                                                                                                                                                                                                                                                                                                                                                   QoL, quality of life; FIQL, fecal incontinence quality of life; NS, not significant.
hyposensitivity), and moreover, impaired conduction through affer-
ent anorectal pathways was also very prevalent. Clinical severity was
                                                                                                                                                                                          P -value

moderate to severe (Cleveland 11.55 ± 3.80).

                                                                                                                                                                                                                                                                                                                                                                                                   Cleveland, FIQL, and EQ5D scores are expressed as mean ± SD.
                                                                                                                                                                                                                                                                                                                                                                 3.38 ± 0.62
                                                                                                                                                                                                                                                                                                                                           –31.68%

Effect of the Treatments on Clinical Severity and
                                                                                                                                                                                                                                                                                                                                            38.8%

                                                                                                                                                                                                                                                                                                                                                        33.3%
                                                                                                                                                                                          Post
                                                                                                                                                                Kegel

Quality of Life
     Cleveland score showed a significant reduction in clinical sever-
                                                                                                                                                                                                                                                                                                                                                                                   3.02 ± 0.65
                                                                                                                                                                                                                                                                                                                                                                                   2.85 ± 0.75
                                                                                                                                                                                                                                                                                                                                                                                   2.20 ± 0.78
                                                                                                                                                                                                                                                                                                                                                                                   2.42 ± 0.79
                                                                                                                                                                                                                                                                                                                                                                                   0.66 ± 0.23

ity of 31.68% in the K group, and more than 40.00% in the BF +
                                                                                                                                                                                          Pre

K (41.70%), ES + K (46.20%), and tNM + K (47.50%) groups,
                                                                                                                                                                                                                                                                                                                                                        (reduction > 50% Cleveland score)

although there was no statistical difference between them. Data is
shown in Table. The FIQL score showed that QoL improved sig-
                                                                                                                                                                                                                                                                                                                                                        index (health-related QoL)

nificantly in all 4 dimensions (life style, coping, embarrassment, and
                                                                                                                                                                                                     (Cleveland ≥ 9 to < 9)

                                                                                                                                                                                                                                                                                                                                                        EQ5D score summary

depression) for patients from all treatment groups. There were no
                                                                                                                                                                            Outcomes

                                                                                                                                                                                                      Severity decrease

                                                                                                                                                                                                                                                                                                                                                         Embarrassment
                                                                                                                                                                                                     (clinical severity)

statistical differences between the groups. Regarding general health-
                                                                                                                                                                                                     Cleveland score

                                                                                                                                                                                                                                                                                                                                                         Depression

related QoL, EQ5D showed no differences in any of the score
                                                                                                                                                                                                                                                                                                                                                        FIQL score
                                                                                                                                                                                                     Responders

                                                                                                                                                                                                                                                                                                                                                         Life style

                                                                                                                                                                                                                                                                                                                                                         Coping

categories after any particular treatment. Transforming qualitative
data from the questionnaire into a summary index (0-1), the health

112                                                 Journal of Neurogastroenterology and Motility
RCT of 4 Treatments for Fecal Incontinence

status of patients in the BF + K and ES + K groups improved                                                                                 cases; BF + K patients further improved their symptoms. Regard-
significantly (Table).                                                                                                                      ing QoL, post-treatment effects were also steadily maintained dur-
                                                                                                                                            ing the entire follow-up phase (Fig. 3).
Factors Associated With Response to the Treatments
     According to our definition of responders as those achieving                                                                           Effect of the Treatments on Anorectal Physiology
a Cleveland score < 9, the response rate was 38.50%, 46.70%,
65.60%, and 56.30% for, K, BF + K, ES + K, and NM + K,                                                                                      Biomechanical effects
respectively (difference between K and ES is significant, P = 0.039).                                                                            Sphincter function. The effect of treatments on MRP was
We also analyzed factors associated with a negative response to a                                                                           minimal but statistically significant after K and ES + K treatments.
treatment: rectal hypersensitivity (OR, 5.08; 95% CI, 1.03-25.10),                                                                          In contrast, SP significantly increased to a much higher degree fol-
passive FI (OR, 4.8; 95% CI, 1.32-17.44), and feces with Bristol                                                                            lowing all treatments except for K (Fig. 4 and Supplementary Table
> 5 (OR, 3.52; 95% CI, 1.05-11.80). The multivariate analysis                                                                               3). The percentage of patients with effective ESP profiles after
confirmed passive FI as an independent factor associated to a nega-                                                                         treatment also increased significantly in those treated with BF + K
tive response to any treatment (OR, 11.37; 95% CI, 2.02-63.97).                                                                             and ES + K (Fig. 5 and Supplementary Table 3).
Being younger was a positive response factor (OR, 0.88; 95% CI,                                                                                  Responses to rectal distention. Patients treated with
0.79-0.97).                                                                                                                                 tNM + K required a lower volume of distension post-treatment
                                                                                                                                            to elicit RAIR (19.41 ± 6.48 mL—16.67 ± 5.95 mL, before—
Persistence of Treatment Effects                                                                                                            after treatment, respectively; P < 0.05). Regarding sensitivity in
     In the 3-month follow-up period after the treatments in which                                                                          response to rectal distention, the threshold for the first perception
all patients continued to perform Kegel exercises only, the observed                                                                        in patients in the BF + K and ES + K groups was significantly
positive effect of treatments on clinical severity was sustained in all                                                                     reduced after treatment (P < 0.05) (differences in the tNM + K
                                                                                                                                            group near statistical significance). Other data regarding sensory
                                                                                                                                            changes are shown in Supplementary Table 4.
                                                                             Severity                               QoL
                                                                                           K                                                Neurophysiological effects
                                                                                         BF + K
                                                                                         ES + K                                                 Motor pathways . Baseline PNTML was homogeneous
                                                                                        tNM + K                                             between groups. No statistically significant difference was found in
                            13                                                                                            4
                            12
Severity, Cleveland score

                            11                                                                                            3.5                                                            SP             Pre-treatment               Post-treatment
                            10                                                                                                                                                           MRP            Pre-treatment               Post-treatment
                                                                             ***                                                                                        100
                                                                                                                                QoL, FlQL

                                                                             ***                                                                                                                                       **
                             9                                               ***
                                                                             ***                                                                                                  NS               ***                                     ***
                                                                                                                          3                                              90
                                                                                                                                            Sphincter pressure (mmHg)

                             8                                                                                                                                           80
                                                                             ***                                                                                                     30.55
                                                                                                                                                                                                                           39.09
                                                                                                                                                                                                                           +25.93             37.11
                             7                                               ***                                                                                         70   27.69 +18.82
                                                                                                                                                                                                        38.99     29.83                27.53 +24.46
                                                                             ***
                                                                                                   Post-3-month K

                                                                                                                                                                                                        +18.95
                                                            Post-treatment

                                                                                                                                                                                                                  +21.55               +20.69
                                 Pre-treatment

                                                                                                                                                                              +22.71           26.93
                             6                                                                                            2.5                                            60       **                                   *                   NS
                                                                             ***                                                                                                               +15.46
                                                                                                                                                                                                   NS
                             5                                                                **                                                                         50

                             4                                                                                            2                                              40
                                                 3 months                          3 months                                                                              30          56.75
                                                                                                                                                                              50.91 +23.94                        52.73 56.32          55.01 53.64
                                                                                                                                                                                               47.88 50.24        +24.46 +26.05        +24.07 +20.51
                                                                                                                                                                              +20.88           +21.24 +21.29
                                                                                                                                                                         20
Figure 3. Effect of all 4 treatments on clinical severity (Cleveland
                                                                                                                                                                         10
score) and on quality of life (QoL) (Fecal Incontinence Quality of
Life [FIQL] score). Differences between V1 and V5 (active treat-                                                                                                         0
                                                                                                                                                                                  K             BF + K             ES + K              tNM + K
ment) were all significant (***P < 0.001). Differences between the
end of the treatment (V5) and the end of the final 3-month follow-                                                                          Figure 4. Comparison of mean resting pressure (MRP) and squeeze
up (V6) were significant for the Cleveland score in the biofeedback                                                                         pressure (SP) in mmHg before and after the treatments (*P < 0.05,
(BF) + Kegel exercises (K) group (**P < 0.01). Note that, in order                                                                          **P < 0.01, and ***P < 0.001, respectively). K, Kegel exercises; BF,
to avoid cluttering, FIQL values are means of the 4 subscales values.                                                                       biofeedback; ES, electrostimulation; tNM, transcutaneous neuro-
ES, electrostimulation; tNM, transcutaneous neuromodulation.                                                                                modulation; NS, not significant.

                                                                                                         Vol. 27, No. 1 January, 2021 (108-118)                                                                                                    113
Lluís Mundet, et al

                   Patients with effective pressure profiles pre-treatment                terms of latency, amplitude, duration, and area under the curve of
                   Patients with effective pressure profiles post-treatment
                                                                                          CMAP after any of the treatments (Supplementary Table 3).
                                                         **
             100                         **
                                                             94.4%                             Sensorial pathways . For the ASEP, we found significantly
              90                            90.3%
                                                                                          shorter latencies of peak p1 after ES + K, (81.14 ± 12.21 mil-
              80                                                              78.1%
                                                                      70.3%
                                                                                          liseconds—70.86 ± 11.65 milliseconds, before—after treatment,
              70            64.7%   64.5%            63.9%                                respectively; P = 0.046). No changes were found in RSEP latency
Percentage

              60
                    52.9%                                                                 after treatment in any group.
              50
              40
                                                                                               Cortical sensory evoked potential source localization.
              30
                                                                                          We compared the anal representation in brain cortex activation be-
              20                                                                          fore and after treatments. We found increased activation of the cin-
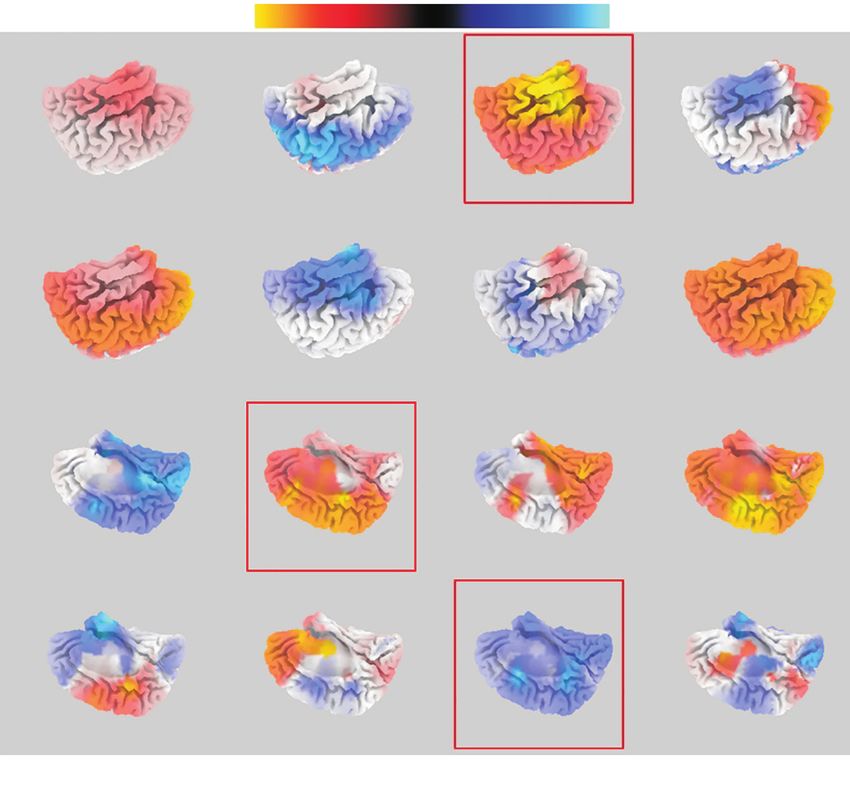
              10                                                                          gulate gyrus area (corresponding to Broadmann area [BA] 32) in
              0                                                                           patients treated with ES + K for p1, and a decrease in the superior
                         K          BF + K           ES + K           tNM + K             temporal gyrus (corresponding to BA22) for n2. Also, after treat-
Figure 5. Percentage of patients with effective pressure profiles                         ment with BF + K, a decrease in the activation in the cingulate area
(adequate endurance of squeeze pressure [ESP]) before and after                           (BA31) was observed for n1 (all differences statistically significant)
treatments. ESP was assessed according to the pressure profile when
                                                                                          (Fig. 6). Regarding the areas of rectal representation, no differences
holding voluntary contraction for 10 seconds (**P < 0.01). K, Kegel
exercises; BF, biofeedback; ES, electrostimulation; tNM, transcutane-                     were found in any of the treatments.
ous neuromodulation.
                                                                                          Other Effects of the Treatments
                                                                                               There was a statistically significant decrease in the ICIQ score

                     K                              BF                            ES                     tNM

    p1

    n1

    p2                                                                                                                 Figure 6. Mean group differences
                                                                                                                       in sLORETA source activity for p1,
                                                                                                                       n1, p2, and n2 (grand average) after
                                                                                                                       anal stimulation (anal sensory evoked
                                                                                                                       potentials [ASEP]) comparing before
                                                                                                                       and after treatment activation. Colored
                                                                                                                       voxels represent areas of significant dif-
    n2
                                                                                                                       ference (blue, increase; red, decrease).
                                                                                                                       Red squared projections indicate where
                                                                                                                       differences before and after treatments
                                                                                                                       were statistically significant. K, Kegel
                                                                                                                       exercises; BF, biofeedback; ES, elec-
                                                                                                                       trostimulation; tNM, transcutaneous
                             Decreased                                                   Increased                     neuromodulation.

114                                                              Journal of Neurogastroenterology and Motility
RCT of 4 Treatments for Fecal Incontinence

at 3 months post-treatment in patients with UI treated with K, ES                associated with EAI impairment. The small increments in MRP
+ K and tNM + K (Supplementary Table 5). These results were                      observed may be attributable to an improvement in EAS tonic
maintained at the 3-month follow-up stage.                                       contraction and their modest contribution to the anal canal resting
     Fecal consistency was evaluated before, during, and after the               pressure. In contrast, the effect of BF, ES, and tNM on the vol-
treatment period. We observed that the percentage of patients in the             untary squeeze (striated muscle) was of much greater magnitude
tNM + K group with very loose stools (Bristol 6 and 7) dimin-                    allowing patients to delay defecation for longer, and minimize urge-
ished after the 3-month active treatment, that is, fecal consistency             FI symptoms. K exercises only did not cause the expected changes
changed to Bristol ≤ 5 (32.7% pre-treatment and 7.5% post-                       in EAS contractility, probably because patients may not have been
treatment; P = 0.016).                                                           fully aware of which muscle group they were exercising, hence the
                                                                                 importance of monitoring with BF. The ineffective ESP profiles
                                                                                 prior to treatment changed to a much better sustained pressure in a
Discussion                                                                       significant percentage of patients treated with BF and with ES, sug-
     The rehabilitation treatments assessed in this study for FI in              gesting that both treatments are able to increase slow-twitch fiber
community-dwelling women (K, BF + K, ES + K, and tNM +                           contractility.
K) showed strong and similar therapeutic efficacy in terms of clini-                  The improvements in SP observed in patients treated using
cal severity and QoL. However, they affect specific and distinct                 tNM cannot be attributed to a direct effect on sphincters, but to
pathophysiological mechanisms. Previous studies have tried to as-                an effect outside the anorectal region37; patients treated with tNM
sess the therapeutic efficacy of individual treatments compared to               showed a tendency to shorter PNTML, suggesting that a higher
control groups,8,10,11,13,15,19,20,33 with varying results, but to our knowl-    proportion of muscle fibers in the EAS is activated after a potential
edge no study has compared the efficacy of these 4 therapies and                 re-innervation. On the other hand, through the stimulation of af-
their effects on so many different aspects of anorectal physiology.              ferent pathways,38 tNM may be able to induce changes that occur
                                                                                 in CNS and, in turn, improve motor control of the pelvic muscles.
Effect on Clinical Severity and Quality of Life                                  To sum up, BF and ES would be useful techniques to help patients
     All the treatments for FI strongly improved clinical severity,              with EAS insufficiency and intact efferent pathways, while tNM
especially in the ES + K and tNM + K groups compared to con-                     seems a reasonable treatment for those with pudendal motor nerve
trol group (K), achieving a decrease of almost 50% in the Cleveland              impairment, although more research needs to be carried out.
score. This data is similar to that obtained by Healy et al34 using
ES, and Boyle et al35 using NM (percutaneous); there are few stud-               Effect on Sensory Responses
ies of tNM, and one30 showed almost no improvement. Regarding                         Sensorial perception in the rectum and anal canal is decisive in
BF, the improvement in our patients was more pronounced than in                  preserving continence. BF and ES improved the first rectal percep-
most other studies.8,11,36 QoL improved for all patients regardless of           tion threshold, the most objective sensorial landmark measured with
the treatment applied; FI-related QoL is associated not only with                anorectal manometry.39 While BF promotes immediate sensorial
the severity of FI, but also with previous mood disorders, age and               learning generated by the motor task, direct activation of sensory
gender,3 which implies that in the management of FI consideration                axons by ES21,34 probably induces more complex central learning
of the patient’s individual characteristics must be included. The                mechanisms leading to proprioception. Patients treated with tNM
3-month follow-up post-treatment using only K in all groups shows                also showed improvement in the first perception (near to statistical
that both the improvement in clinical severity and the recovery                  significance), the results being in line with those obtained in previ-
of QoL achieved during each treatment were maintained. So, al-                   ous studies with SNS,40 changes that must also be linked to neuro-
though K proved to be less effective during the treatment period, it             plasticity phenomena.
would appear reasonable to recommend it as a maintenance therapy                      From the neurophysiological perspective, after treatment with
during follow up.                                                                ES, patients exhibited a shortening of the latency of p1 of the
                                                                                 ASEP; this finding suggests an influence of ES on afferent path-
Effects on Motor Responses                                                       ways, probably resulting in better integration of sensory inputs and
   In patients treated with K and ES + K, MRP increased                          control of the pelvic floor muscles.
minimally, probably insufficient to counterbalance FI symptoms

                                                           Vol. 27, No. 1 January, 2021 (108-118)                                                     115
Lluís Mundet, et al

                                                                              positioning—although contact with mucosa was confirmed—in
Other Effects of the Treatments                                               order to ensure the repeatability of the procedures. In addition, we
     In the tNM group the percentage of patients with loose stools            could not include the FI episodes as a primary outcome, because
(Bristol > 5) diminished very significantly post-treatment, suggest-          data was not strictly reliable.
ing that tNM can modulate colonic activity41 and that the change                   To conclude, our research highlights the strong therapeutic
in fecal consistency could explain in part the improvement in many            effect of the therapies studied in those patients that complete the
patients with FI. Likewise, is also remarkable that patients after            protocol treatment, and their distinct pathophysiological targets.
treatment with tNM required smaller volumes of distension to initi-           This will help us to define a multimodal algorithm for treatment
ate RAIR suggesting an influence on the mechanisms that regulate              with distinct pathophysiological phenotypes of patients with FI that
rectal compliance.                                                            need a specific treatment and approach, and should begin with the
     As expected, patients also suffering from UI and treated with            treatment of diarrhea, if present. Future studies should assess the
K, ES + K, and tNM + K experienced a significant improvement                  clinical therapeutic efficacy of multimodal treatment algorithms to
in the severity of the clinical symptoms of UI. It is noteworthy that         further improve patients’ symptoms, and help them to regain QoL
patients treated solely with K improved UI symptoms but not FI,               and return to their normal way of life.
which reinforces the argument that some treated with this therapy
for FI probably focus on the contractile activity on urogenital mus-
cles other than the EAS and the puborectalis.
                                                                              Supplementary Materials
                                                                                  Note: To access the supplementary tables and figures men-
Responders                                                                    tioned in this article, visit the online version of Journal of Neurogas-
     In order to identify which patients responded to a particular            troenterology and Motility at http://www.jnmjournal.org/, and at
treatment, the rule of a decrease in symptoms of more than 50%                https://doi.org/10.5056/jnm20013.
is commonly used. This criterion, in our opinion, implies the ac-
ceptance of decreases in symptoms after a treatment that may be no            Acknowledgements: All authors thank Dr Mateu Serra and
                                                                              Elisabet Palomera for their statistical support; Jane Perkins for as-
more than marginal. Changes from grave clinical severity before
                                                                              sistance with English; Daniel Alvarez for his help with some of
treatment (Cleveland ≥ 9) to mild or moderate severity (Cleveland
                                                                              the images; and Jordi Roig from DPM for his support on Elpha
< 9) as a positive response seems to us more reasonable as the im-
                                                                              stimulators.
pact on QoL in one range or another is highly significant.2 In these
terms, the percentage of responders was higher for ES + K (65.5%)             Financial support: Part of this research was funded through
and tNM + K (56.3%) than for the other 2 treatments.                          2 PERIS grants from the Catalonian Health Department
     Regardless of the treatment assigned, only a small percentage of         (SLT002/16/00214 and SLT008/18/00168). CIBERehd is funded
patients with rectal hypersensitivity (20.0%), loose stools (26.7%),          by Instituto de Salud Carlos III, Barcelona, Spain.
or passive FI (29.4%) responded to treatment. The latter was an
independent factor associated with a negative response to the treat-          Conflicts of interest: None.
ment. Rectal hypersensitivity and passive FI are challenging condi-
                                                                              Author contributions: Study conception and design: Lluís
tions that require further research, as no current treatment appears
                                                                              Mundet, Pere Clavé, and Laia Rofes; data collection and analysis:
to really mitigate the symptoms. On the other hand, the influence
                                                                              Lluís Mundet, Omar Ortega, Christopher Cabib and Laia Rofes;
of fecal consistency in response of the treatment is critical,4 being es-
                                                                              writing of the manuscript: Lluís Mundet, Christopher Cabib, and
sential to treat diarrhea before attempting any rehabilitation.
                                                                              Pere Clavé; and final approval: Pere Clavé. All authors approved
     Our study has some limitations. One is the absence of a sham
                                                                              the final version of the article, including authorship list.
control groups. Kegel was intended to act as control but it does not
omit the therapeutic element of the research, and bias remain pos-
sible because of the unblinded design. Another is the limited sample          References
of patients in each group, which has prevented the clarification of             1. Ng KS, Sivakumaran Y, Nassar N, Gladman MA. Fecal incontinence:
certain aspects, especially those regarding the study of neurophysiol-             community prevalence and associated factors--a systematic review. Dis
ogy. In RSEP recording, it was difficult to ensure intrarectal probe               Colon Rectum 2015;58:1194-1209.

116                                                  Journal of Neurogastroenterology and Motility
RCT of 4 Treatments for Fecal Incontinence

 2. Minguez M, Garrigues V, Soria MJ, Andreu M, Mearin F, Clave P.                     rectal function in fecal incontinence? Am J Gastroenterol 1996;91:2360-
    Adaptation to Spanish language and validation of the fecal incontinence            2366.
    quality of life scale. Dis Colon Rectum 2006;49:490-499.                       19. Ozturk R, Niazi S, Stessman M, Rao SS. Long-term outcome and ob-
 3. Mundet L, Ribas Y, Arco S, Clavé P. Quality of life differences in female          jective changes of anorectal function after biofeedback therapy for faecal
    and male patients with fecal incontinence. J Neurogastroenterol Motil              incontinence. Aliment Pharmacol Ther 2004;20:667-674.
    2016;22:94-101.                                                                20. Heymen S, Scarlett Y, Jones K, Ringel Y, Drossman D, Whitehead WE.
 4. Bharucha AE, Zinsmeister AR, Schleck CD, Melton LJ 3rd. Bowel                      Randomized controlled trial shows biofeedback to be superior to pelvic
    disturbances are the most important risk factors for late onset fecal incon-       floor exercises for fecal incontinence. Dis Colon Rectum 2009;52:1730-
    tinence: a population-based case-control study in women. Gastroenterol-            1737.
    ogy 2010;139:1559-1566.                                                        21. Swash M. Electrophysiological investigation of the posterior pelvic floor
 5. Mundet L, Cabib C, Ortega O, et al. Defective conduction of anorectal              musculature. The pelvic floor. London: WB Saunders 2002:213-236.
    afferents is a very prevalent pathophysiological factor associated to fecal    22. Knowles CH. Human studies of anorectal sensory function. Ir J Med
    incontinence in women. J Neurogastroenterol Motil 2019;25:423-435.                 Sci 2018;187:1143-1147.
 6. Lal N, Simillis C, Slesser A, et al. A systematic review of the literature     23. Jorge JM, Wexner SD. Etiology and management of fecal incontinence.
    reporting on randomised controlled trials comparing treatments for faecal          Dis Colon Rectum 1993;36:77-97.
    incontinence in adults. Acta Chir Belg 2019;119:1-15.                          24. Lewis SJ, Heaton KW. Stool form scale as a useful guide to intestinal
 7. Meyer I, Richter HE. Evidence-based update on treatments of fecal in-              transit time. Scand J Gastroenterol 1997;32:920-924.
    continence in women. Obstet Gynecol Clin North Am 2016;43:93-119.              25. Avery K, Donovan J, Peters TJ, Shaw C, Gotoh M, Abrams P. ICIQ:
 8. Solomon MJ, Pager CK, Rex J, Roberts R, Manning J. Randomized,                     a brief and robust measure for evaluating the symptoms and impact of
    controlled trial of biofeedback with anal manometry, transanal ultrasound,         urinary incontinence. Neurourol Urodyn 2004;23:322-330.
    or pelvic floor retraining with digital guidance alone in the treatment of     26. Badia X, Roset M, Montserrat S, Herdman M, Segura A. [The Span-
    mild to moderate fecal incontinence. Dis Colon Rectum 2003;46:703-                 ish version of EuroQol: a description and its applications. European qual-
    710.                                                                               ity of life scale.] Med Clin (Barc) 1999;112(suppl 1):79-85.[Spanish]
 9. Lee BH, Kim N, Kang SB, et al. The long-term clinical efficacy of bio-         27. Nockolds CL, Hosker GL, Kiff ES. Compound muscle action potential
    feedback therapy for patients with constipation or fecal incontinence. J           of the external anal sphincter. Colorectal Dis 2013;15:1289-1294.
    Neurogastroenterol Motil 2010;16:177-185.                                      28. Markland AD, Jelovsek JE, Whitehead WE, et al. Improving biofeed-
10. Norton C, Cody JD. Biofeedback and/or sphincter exercises for the                  back for the treatment of fecal incontinence in women: implementation of
    treatment of faecal incontinence in adults. Cochrane Database Syst Rev             a standardized multi-site manometric biofeedback protocol. Neurogastro-
    2012:CD002111.                                                                     enterol Motil 2017;29:e12906.
11. Norton C, Chelvanayagam S, Wilson-Barnett J, Redfern S, Kamm MA.               29. Norton C, Gibbs A, Kamm MA. Randomized, controlled trial of
    Randomized controlled trial of biofeedback for fecal incontinence. Gas-            anal electrical stimulation for fecal incontinence. Dis Colon Rectum
    troenterology 2003;125:1320-1329.                                                  2006;49:190-196.
12. Vonthein R, Heimerl T, Schwandner T, Ziegler A. Electrical stimulation         30. Eléouet M, Siproudhis L, Guillou N, Le Couedic J, Bouguen G,
    and biofeedback for the treatment of fecal incontinence: a systematic re-          Bretagne JF. Chronic posterior tibial nerve transcutaneous electrical nerve
    view. Int J Colorectal Dis 2013;28:1567-1577.                                      stimulation (TENS) to treat fecal incontinence (FI). Int J Colorectal Dis
13. Hosker G, Cody JD, Norton CC. Electrical stimulation for faecal incon-             2010;25:1127-1132.
    tinence in adults. Cochrane Database Syst Rev 2007:CD001310.                   31. Pascual-Marqui RD, Michel CM, Lehmann D. Low resolution elec-
14. Horrocks EJ, Thin N, Thaha MA, Taylor SJ, Norton C, Knowles CH.                    tromagnetic tomography: a new method for localizing electrical activity in
    Systematic review of tibial nerve stimulation to treat faecal incontinence.        the brain. Int J Psychophysiol 1994;18:49-65.
    Br J Surg 2014;101:457-468.                                                    32. Rothbarth J, Bemelman WA, Meijerink WJ, et al. What is the impact of
15. Horrocks EJ, Bremner SA, Stevens N, et al. Double-blind randomised                 fecal incontinence on quality of life? Dis Colon Rectum 2001;44:67-71.
    controlled trial of percutaneous tibial nerve stimulation versus sham elec-    33. Findlay JM, Yeung JM, Robinson R, Greaves H, Maxwell-Armstrong
    trical stimulation in the treatment of faecal incontinence: CONtrol of Fae-        C. Peripheral neuromodulation via posterior tibial nerve stimulation -
    cal Incontinence using Distal NeuromodulaTion (the CONFIDeNT                       a potential treatment for faecal incontinence? Ann R Coll Surg Engl
    trial). Health Technol Assess 2015;19:1-164.                                       2010;92:385-390.
16. Loening-Baucke V. Efficacy of biofeedback training in improving fae-           34. Healy CF, Brannigan AE, Connolly EM, et al. The effects of low-fre-
    cal incontinence and anorectal physiologic function. Gut 1990;31:1395-             quency endo-anal electrical stimulation on faecal incontinence: a prospec-
    1402.                                                                              tive study. Int J Colorectal Dis 2006;21:802-806.
17. Davis KJ, Kumar D, Poloniecki J. Adjuvant biofeedback following                35. Boyle DJ, Prosser K, Allison ME, Williams NS, Chan CL. Percutane-
    anal sphincter repair: a randomized study. Aliment Pharmacol Ther                  ous tibial nerve stimulation for the treatment of urge fecal incontinence.
    2004;20:539-549.                                                                   Dis Colon Rectum 2010;53:432-437.
18. Rao SS, Welcher KD, Happel J. Can biofeedback therapy improve ano-             36. Byrne CM, Solomon MJ, Young JM, Rex J, Merlino CL. Biofeedback

                                                             Vol. 27, No. 1 January, 2021 (108-118)                                                          117
Lluís Mundet, et al

    for fecal incontinence: short-term outcomes of 513 consecutive patients        39. Rao SS, Azpiroz F, Diamant N, Enck P, Tougas G, Wald A. Minimum
    and predictors of successful treatment. Dis Colon Rectum 2007;50:417-              standards of anorectal manometry. Neurogastroenterol Motil 2002;14:553-
    427.                                                                               559.
37. Amend B, Matzel KE, Abrams P, de Groat WC, Sievert KD. How does                40. Uludag O, Morren GL, Dejong CH, Baeten CG. Effect of sacral neu-
    neuromodulation work. Neurourol Urodyn 2011;30:762-765.                            romodulation on the rectum. Br J Surg 2005;92:1017-1023.
38. Fowler CJ, Swinn MJ, Goodwin RJ, Oliver S, Craggs M. Studies of                41. Patton V, Wiklendt L, Arkwright JW, Lubowski DZ, Dinning PG. The
    the latency of pelvic floor contraction during peripheral nerve evaluation         effect of sacral nerve stimulation on distal colonic motility in patients with
    show that the muscle response is reflexly mediated. J Urol 2000;163:881-           faecal incontinence. Br J Surg 2013;100:959-968.
    883.

118                                                      Journal of Neurogastroenterology and Motility
You can also read