PediTools Electronic Growth Chart Calculators: Applications in Clinical Care, Research, and Quality Improvement
←
→
Page content transcription
If your browser does not render page correctly, please read the page content below
JOURNAL OF MEDICAL INTERNET RESEARCH                                                                                                     Chou et al

     Original Paper

     PediTools Electronic Growth Chart Calculators: Applications in
     Clinical Care, Research, and Quality Improvement

     Joseph H Chou1,2, MD, PhD; Sergei Roumiantsev1,2, MD, PhD; Rachana Singh3,4, MD, MS
     1
      Massachusetts General Hospital, Boston, MA, United States
     2
      Harvard Medical School, Boston, MA, United States
     3
      Baystate Children's Hospital, Springfield, MA, United States
     4
      University of Massachusetts Medical School, Springfield, MA, United States

     Corresponding Author:
     Joseph H Chou, MD, PhD
     Massachusetts General Hospital
     55 Fruit Street, Founders 526E
     Boston, MA, 02114-2696
     United States
     Phone: 1 6177249040
     Fax: 1 6177249346
     Email: jchou2@mgh.harvard.edu

     Abstract
     Background: Parameterization of pediatric growth charts allows precise quantitation of growth metrics that would be difficult
     or impossible with traditional paper charts. However, limited availability of growth chart calculators for use by clinicians and
     clinical researchers currently restricts broader application.
     Objective: The aim of this study was to assess the deployment of electronic calculators for growth charts using the
     lambda-mu-sigma (LMS) parameterization method, with examples of their utilization for patient care delivery, clinical research,
     and quality improvement projects.
     Methods: The publicly accessible PediTools website of clinical calculators was developed to allow LMS-based calculations
     on anthropometric measurements of individual patients. Similar calculations were applied in a retrospective study of a population
     of patients from 7 Massachusetts neonatal intensive care units (NICUs) to compare interhospital growth outcomes (change in
     weight Z-score from birth to discharge [∆Z weight]) and their association with gestational age at birth. At 1 hospital, a bundle of
     quality improvement interventions targeting improved growth was implemented, and the outcomes were assessed prospectively
     via monitoring of ∆Z weight pre- and postintervention.
     Results: The PediTools website was launched in January 2012, and as of June 2019, it received over 500,000 page views per
     month, with users from over 21 countries. A retrospective analysis of 7975 patients at 7 Massachusetts NICUs, born between
     2006 and 2011, at 23 to 34 completed weeks gestation identified an overall ∆Z weight from birth to discharge of –0.81 (P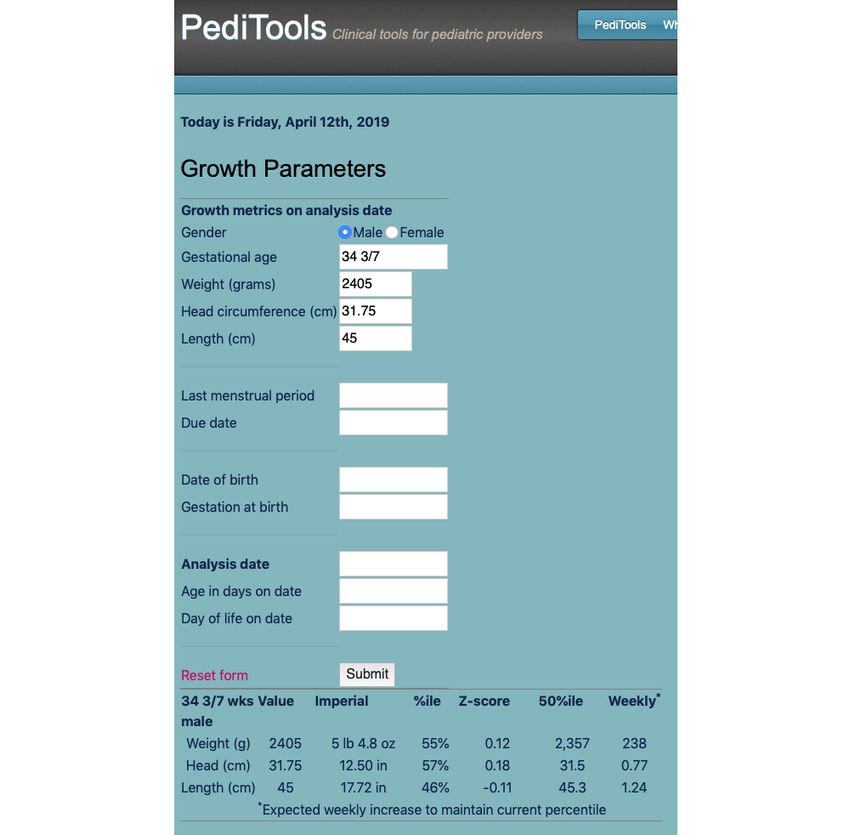
JOURNAL OF MEDICAL INTERNET RESEARCH                                                                                                      Chou et al

                                                                            measurement Z-scores from individual patients to a large
     Introduction                                                           population of patients might yield insight into how populations
     Background                                                             of preterm infants grow during their birth hospitalization.
                                                                            Similarly, we hypothesized that assessing the efficacy of quality
     Failure to thrive secondary to inadequate nutrition in the             improvement initiatives targeting improved growth might benefit
     pediatric population may result in lifelong negative impact on         from an unambiguous quantitative metric based on
     physical and mental health outcomes [1,2]. This is especially          anthropometric Z-scores.
     critical for infants and children with known risk factors, such
     as preterm birth, acute and chronic illnesses, and social risk         Objectives
     factors [3-7].                                                         In this paper, we describe the deployment of the publicly
     Anthropometric measurements commonly used in pediatric                 accessible PediTools website, which implements a suite of
     populations to assess nutritional status include weight, length,       calculators supporting LMS-based growth charts. We
     stature, head circumference, and midarm circumference. Using           hypothesized that a simple metric to assess growth
     appropriate growth chart references, a single measurement alone        outcomes—the change in weight Z-score from birth to discharge
     indicates growth status for age at a single time point and may         (∆Z weight)—might yield insight into growth outcome
     provide indications for closer monitoring. With multiple               variations. We retrospectively compared outcomes at 7
     measurements, growth velocity over time can be evaluated and           Massachusetts neonatal intensive care units (NICUs) and further
     deviation from normal growth pattern may be suggestive of              utilized this metric to assess the efficacy of a nutrition-based
     suboptimal nutrition or chronic illnesses, including metabolic         quality improvement project at one of the NICUs. In addition,
     disorders or congenital syndromes, although suboptimal                 we also announce the release of open-source software, which
     monitoring itself may impact efficacy [8].                             will allow others to perform large-scale LMS-based calculations
                                                                            more easily.
     Before more widespread availability of electronic health records,
     paper growth charts were commonly used, but they had                   Methods
     limitations, including infrequent updating, restricted accessibility
     for multiple care providers, and the inability to exactly determine    Lambda-Mu-Sigma Method of Describing Growth
     percentiles numerically between the limited discrete percentile        References
     lines displayed on the printed charts.
                                                                            The LMS method allows a parametric definition of growth
     The development of the lambda-mu-sigma (LMS) method for                references and generation of smoothed centile curves accounting
     describing growth charts allows a quantitative description of          for skewness of the distribution of an anthropometric
     growth charts based on tables of parameters [9]. In these tables,      measurement [9]. The parameters lambda (L, skewness
     parameters for anthropometric measurements of interest relate          normalization via power in the Box-Cox transformation), mu
     a measurement at a given age to a precisely calculated Z-score         (M, mean), and sigma (S, coefficient of variation) describe the
     (number of SDs from the mean) and percentile. Similarly, the           distribution of the measurement (eg, weight, length, or head
     expected anthropometric measurement at a particular Z-score            circumference) at a given age, and the set of LMS parameters
     and age can also be calculated. The availability of the LMS            across multiple ages parameterizes the entire growth chart. This
     method and parameters for an increasing number of growth               allows convenient calculation of exact Z scores (SDs from the
     charts provides an opportunity to both improve clinical care of        mean) and generation of any centile curve.
     individual patients and allow large-scale analysis of datasets,
                                                                            Obtaining Lambda-Mu-Sigma Parameters
     which would be difficult or impossible if using paper growth
     charts.                                                                LMS parameters for growth charts were obtained either from
                                                                            the original publications, Web-based electronic supplements to
     Postnatal growth failure is common in preterm infants and is           the publications, and internet archives or by licensing agreement
     known to be associated with long-term neurodevelopmental               with the publication authors (references and sources listed in
     impairment [10-18]. Extending the calculation of anthropometric        Table 1).

     https://www.jmir.org/2020/1/e16204                                                              J Med Internet Res 2020 | vol. 22 | iss. 1 | e16204 | p. 2
                                                                                                                   (page number not for citation purposes)
XSL• FO
RenderX
JOURNAL OF MEDICAL INTERNET RESEARCH                                                                                                           Chou et al

     Table 1. Anthropometric growth calculators implemented on PediTools and sources of lambda-mu-sigma parameters.
         Chart                                      Age range                        Measures
         Fenton 2003 preterm [19,20]                22-50 weeks gestation            Weight, head circumference, and length
         Fenton 2013 preterm [21]                   22-50 weeks gestation            Weight, head circumference, and length

         CDCa infant [22,23]                        0-36 months                      Weight, head circumference, and length

         CDC pediatric [22,23]                      24-240 months                    Weight, height, and BMI

         WHOb infant [24]                           0-24 months                      Weight, head circumference, and length

         Olsen preterm [25]                         23-41 weeks gestation            Weight, head circumference, and length
         WHO [26]                                   3-60 months                      Arm circumference and triceps and subscapular skinfolds
         CDC [27]                                   2-20 years                       triceps and subscapular skinfolds
         Olsen preterm BMI [28]                     24-41 weeks gestation            BMI
         Down syndrome infant [29,30]               0-36 months                      Weight, length, and head circumference
         Down syndrome pediatric [29,30]            2-20 years                       Weight, height, head circumference, and BMI
         CDC arm circumference [31]                 2-222 months                     Arm circumference
         Mramba arm circumference [32]              60-228 months                    Arm circumference

     a
         CDC: Centers for Disease Control and Prevention.
     b
         WHO: World Health Organization.

                                                                              values obtained for the Fenton 2013 preterm charts have values
     Interpolation of Lambda-Mu-Sigma Values                                  defined for each day of gestation; therefore, interpolation is not
     For each growth chart described via the LMS method, the L,               required [21].
     M, and S curves are smoothed over ages, which permits
     interpolation of appropriate LMS values for intermediate values          Calculations via the Lambda-Mu-Sigma Method
     among the available discrete ages. In the PediTools calculators,         Calculations of a Z score from LMS parameters and a given
     simple linear interpolation was performed to obtain LMS values           anthropometric measurement or an anthropometric measurement
     for intermediate ages. Different charts provide different degrees        at a given Z score and LMS parameters at a particular age were
     of age granularity. The Centers for Disease Control and                  performed as previously described (Figure 1) [9,22]. In the
     Prevention (CDC) infant charts provide LMS parameters for                PediTools Web-based calculators, the percentile corresponding
     ages in 1-month intervals, centered at the half-month point for          to a Z score was calculated by a numerical estimation of the
     the entire month [22], whereas the Fenton 2003 preterm charts            cumulative density function of the standard normal distribution
     provide parameters for completed weeks of gestation, centered            (equation 26.2.17 in the reference by Abramowitz et al) [33].
     midweek, for example, 30 weeks of completed gestation is                 For the peditools R package, the same functionality is provided
     centered around 30 3/7 weeks [19,20]. In contrast, the LMS               in the standard R function pnorm().
     Figure 1. Equations for LMS-based growth metric calculations for Z score (a and b) and for an anthropometric measurement X (c and d).

     https://www.jmir.org/2020/1/e16204                                                                   J Med Internet Res 2020 | vol. 22 | iss. 1 | e16204 | p. 3
                                                                                                                        (page number not for citation purposes)
XSL• FO
RenderX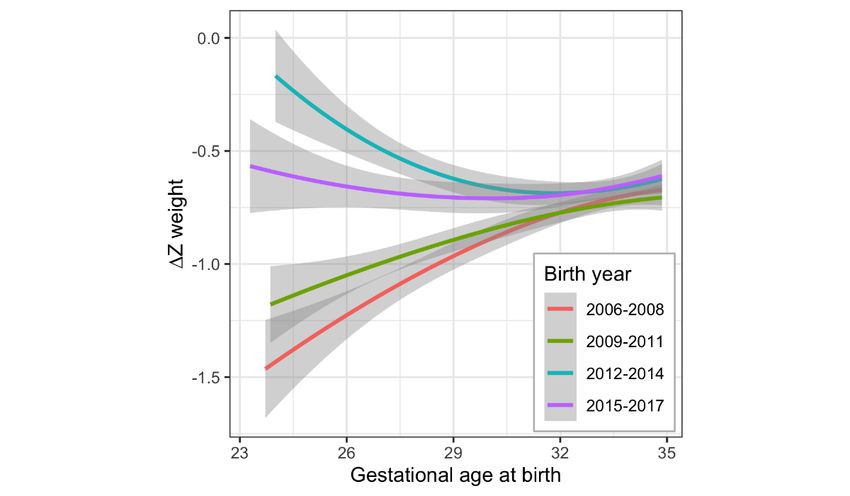
JOURNAL OF MEDICAL INTERNET RESEARCH                                                                                                    Chou et al

     PediTools Website                                                    instructions are all available on the VON website. At each
     The PediTools Web calculators [34] were developed in PHP, a          hospital, individual patient-level data for that hospital were
     general-purpose scripting language well suited to Web                exported from eNICQ as a CSV file, with 1 row per patient and
     development [35]. The website was generated using                    1 column per data field. (As of 2019, eNICQ data exports are
     RapidWeaver version 7.5.7 (Realmac Software) [36]. Web               now in XML or JSON format, but they contain identical
     hosting is currently provided by Bluehost Inc [37], under a          information.) The data columns abstracted for each hospital in
     shared hosting environment. Access statistics are tracked via        this study included the following: birth year (BYEAR), initial
     Google Analytics. The PediTools Web server is configured to          gestational age (GAWEEKS, GADAYS), birth weight (BWGT),
     require the use of Secure Sockets Layer to encrypt traffic to and    length of stay (LOS1), and discharge weight (DWGT).
     from the Web server. No data entered as inputs for the medical       Additional information obtained included source of admission
     calculators are saved or analyzed.                                   (inborn or outborn, LOCATE), day of life of admission
                                                                          (DAYADMISS), discharge disposition (home, transfer to
     For the PediTools Electronic Growth Chart, a Microsoft Excel         another facility, or death, FDISP), and congenital malformations
     spreadsheet template was designed to allow users to enter            (CMAL). Gender was not obtained, as at the time the study was
     protected health information locally, but it would calculate the     originally conceived, the only preterm growth chart with LMS
     nonprotected health information values needed to generate a          parameters available (Fenton 2003) was not gender specific
     growth chart. Specifically, the date of birth, gender, gestational   [19]. Outcomes obtained but not reported here included the
     age at birth, and specific dates and measurements are entered,       following: birth (BHEADCIR) and discharge (DHEADCIR)
     but only the gender and calculated postmenstrual ages and            head circumference, early (EBSEPS) or late (LBPATH) bacterial
     anthropometric measures are submitted to the PediTools               infection, oxygen requirement at 36 weeks postmenstrual age
     electronic growth chart site, avoiding transmission of any           (OX36), necrotizing enterocolitis (NEC, NECSURG), and
     specific dates.                                                      retinopathy of prematurity (ISTAGE, ROPSURG).
     For the PediTools electronic growth chart, LMS-based                 Analysis was performed using R, free software for statistical
     calculations were performed as above for all the measurements        computing [39], using the free version of the RStudio integrated
     submitted. In addition, for sequential measurements, rate of         development environment [40]. For data visualizations,
     weight change in grams per week, both observed and expected          smoothed conditional mean curves were generated by the R
     (to maintain the previous growth centile), were displayed.           ggplot [41] package via generalized additive model and cubic
     As a visual aid to recognize excessive loss of weight Z-score        splines [42]. When present, the bands surrounding the smoothed
     between sequential measurements, after the first 10 days of life,    curves represent the 95% CI around the mean.
     the change in weight Z-score (∆Z) was color coded to display         Comparisons among hospitals were performed by 2-tailed t test,
     as red if the Z-score decreased by more than 0.06 SDs per week;      analysis of variance, Wilcoxon rank-sum, and Kruskal-Wallis
     yellow for decrease by more than 0.03 SD per week; and green         test, as appropriate. Multihospital ∆Z analysis was performed
     otherwise. These thresholds were chosen somewhat arbitrarily,        by fitting a linear model of ∆Z versus gestational age, with
     but over the course of a 14-week admission, each color would         interaction terms for both slope and intercept for each hospital.
     indicate an overall ∆Z weight of −0.84, −0.42, or less negative      When multiple pairwise comparisons were performed, multiple
     than −0.42 SDs, respectively.                                        testing adjustment was performed by the Tukey honestly
                                                                          significant difference method. The study was approved by the
     Multisite Comparison of Growth Outcomes
                                                                          Institutional Review Boards at each of the hospitals that
     The Vermont Oxford Network (VON) is a nonprofit voluntary            contributed data.
     collaboration of neonatal health care professionals representing
     more than 1200 hospitals around the world [38]. Deidentified         Single-Site Growth Outcomes Quality Improvement
     data were obtained from 7 level 3 NICUs in Massachusetts,            Project
     which participate in the VON registry. Eligibility criteria          Multiple bundled growth and nutrition quality improvement
     included birth year from 2006 to 2011; gestational age between       interventions were essentially simultaneously implemented at
     23 0/7 and 34 6/7 weeks; no severe congenital malformations;         NICU C, starting in late 2011. These bundled changes included
     and survival to discharge. Availability of birth weight, discharge   the following: (1) raised awareness of baseline growth failure
     weight, and length of stay were required to calculate the weight     by educational presentations to clinicians, showing how growth
     Z-score at birth and discharge. Infants were excluded if birth       outcomes differed between NICU C and NICU F; (2)
     or discharge weight Z-scores were less than −4 or greater than       development of an electronic growth chart, as described in the
     4, as values beyond these extremes often reflected data entry        PediTools Web tool; (3) systematic weekly growth metric
     error. The calculated outcome metric was the ∆Z weight from          collection in a form compatible with the electronic growth chart
     birth to discharge. For NICU C, data for neonates born between       tool; (4) formal review of all NICU patients and their interval
     2012 and 2017 were also obtained for postintervention quality        growth at weekly multidisciplinary rounds with pediatric
     improvement outcomes analysis.                                       dieticians; (5) earlier and broader initiation of parenteral
     The VON registry provides a manual of operations with data           nutrition with increased protein content and more rapid
     definitions and eNICQ software, which allows for the collection,     advancement; (6) revision of enteral feeding advancement
     error checking, and submission of infant data. These manuals,        protocols, including earlier initiation of gut priming (trophic
     data collection forms, and electronic data submission                feeds).

     https://www.jmir.org/2020/1/e16204                                                            J Med Internet Res 2020 | vol. 22 | iss. 1 | e16204 | p. 4
                                                                                                                 (page number not for citation purposes)
XSL• FO
RenderX
JOURNAL OF MEDICAL INTERNET RESEARCH Chou et al
Assessment of the effect of the bundled interventions was Although accessible to the general public, the target audience
performed similar to the analysis of growth outcomes described and purpose of the PediTools website are pediatric clinical
above: ∆Z weight from admission to discharge was calculated providers’ bedside use. PediTools is agnostic to which growth
for each patient and the results were analyzed over different charts are made available and does not provide recommendations
birth year epochs. as to which charts are appropriate for which populations. The
users of the website are expected to exercise their own
Dissemination of Methods for Large-Scale Analysis professional clinical judgment to determine suitability for their
The R code used for the calculation of anthropometric measure purposes.
Z scores from LMS parameters was bundled [43] into the R
peditools package, and this will be hosted on GitHub [44] and Additional growth chart calculators have subsequently been
shared under the Massachusetts Institute of Technology (MIT) added to PediTools, including support for the Fenton 2013
License. The peditools package can be installed using the preterm chart [21], CDC infant and pediatric [22,23], World
devtools package [45], with the command Health Organization (WHO) infant [24], Olsen 2010 preterm
install_github(“jhchou/peditools”). [25], WHO arm circumference and triceps and subscapular
skinfold [26], CDC triceps and subscapular skinfold [27], Olsen
All growth charts described in this work are supported by the 2015 BMI for preterm [28], Zemel 2015 Down syndrome
R peditools package, with the exception of the Fenton 2013 [29,30], Abdel-Rahman 2017 midupper arm circumference [31],
growth chart [21], for which the LMS parameters are available and Mramba 2017 midupper arm circumference [32].
from the author by license only. If the Fenton 2013 parameters
become publicly available in the future, they will be added to As PediTools Web calculators were intended to be used by
the peditools R package. In the meantime, the Olsen 2010 [25] clinicians at the point of care, features in addition to reporting
or gender nonspecific Fenton 2003 [19] charts can be used to percentiles and Z-scores were integrated to promote ease of use
analyze preterm growth. and clinical relevance. For example, with the preterm
calculators, a gestational age calculator was integrated to allow
Results entry of either the postmenstrual gestational age of interest or
any combination of last menstrual period, due date, delivery
PediTools Website date, or chronologic age. For assessment of obesity, the CDC
pediatric growth calculator includes both the Z score for BMI
The first PediTools Web calculator was developed in 2011 as
and updated categorization of extreme obesity, defined as
an in-house tool to improve documentation of anthropometric
measurements of premature newborns cared for at hospital C BMI≥120% of the 95th percentile or ≥35 kg/m2 [46]. Both
by allowing calculation of Z-scores and percentiles, using the international and imperial units are supported. For infant
Fenton 2003 preterm growth chart [19], for which LMS calculators, calculations at both chronologic age and age
parameters were published in 2007 [20]. The webpage was corrected for prematurity can be reported, which is beneficial
moved to public hosting in January of 2012. A screenshot of a when assessing for timely attainment of developmental
representative Web-based PediTools growth calculator is shown milestones. To help set goals for future growth, the calculators
in Figure 2. report the expected amount that anthropometric measures should
increase over time to maintain the current Z-score (ie, equivalent
to growing along the current percentile curve).
https://www.jmir.org/2020/1/e16204 J Med Internet Res 2020 | vol. 22 | iss. 1 | e16204 | p. 5
(page number not for citation purposes)
XSL• FO
RenderXJOURNAL OF MEDICAL INTERNET RESEARCH Chou et al
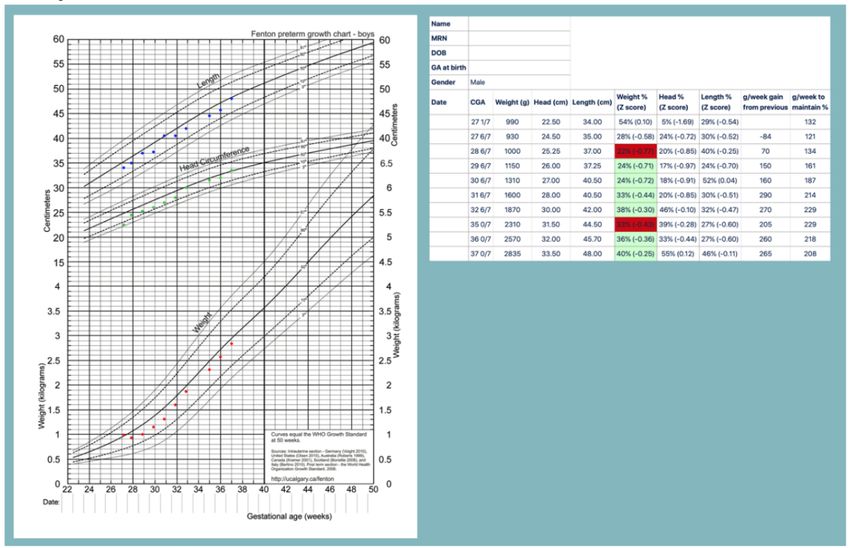
Figure 2. Screenshot of a representative PediTools web-based growth calculator (Fenton 2013 for preterm infants). The upper section demonstrates
flexible support for multiple methods of input data entry. Data entry can include age as either gestational age or specific dates; measurements can be
entered in metric or imperial units (grams or pounds and ounces; centimeters or inches); and even if no measurement is entered, the expected median
(50th percentile) values will be displayed. The lower section displays the results of the LMS-based calculations, including the anthropometric measures
in both metric and imperial units, percentile, Z-score, expected median measurement for age, and weekly growth required to maintain the current
percentile.
0.68%). Access was primarily from desktop devices
PediTools Website Utilization (307,326/518,796; 59.23%), followed by mobile devices
The PediTools Web calculators have been well received by the (201,970/518,796; 38.93%) and tablets (9500/518,796; 1.83%).
clinical community. Since its public launch in January 2012,
website access has increased to more than 500,000 page views PediTools also includes several aids not related to
per month. Figure 3 documents the increasing monthly page anthropometric measurements, including a bilirubin tool, which
views over time; Table 2 shows page views by calculator for assists in the management of neonatal hyperbilirubinemia per
the year ending June 2019. Users were primarily from the United the American Academy of Pediatrics 2004 guidelines [47,48]
States (433,438/520,450; 83.28% users), but there were at least and a stand-alone version of the gestational age calculator, which
1000 users from each of another 21 countries, with over 3000 is also incorporated in the preterm growth calculators. They
users from Canada (17,169/520,450; 3.30%), India will not be further discussed here, but they are mentioned as
(5619/520,450; 1.08%), Australia (5096/520,450; 0.98%), they receive the 4th and 6th largest number of page views,
Mexico (4066/520,450; 0.78%), and Brazil (3546/520,450; respectively.
https://www.jmir.org/2020/1/e16204 J Med Internet Res 2020 | vol. 22 | iss. 1 | e16204 | p. 6
(page number not for citation purposes)
XSL• FO
RenderXJOURNAL OF MEDICAL INTERNET RESEARCH Chou et al
Figure 3. PediTools (https://peditools.org/) website overall monthly pageviews over time from public launch in January 2012 through June 2019.
Table 2. PediTools page views by calculator for year ending June 2019.
Web page views Value (N=5,192,170), n (%)
Fenton 2013 preterm 1,438,367 (27.54)
CDCa pediatric 1,338,920 (25.64)
WHOb infant 954,634 (18.28)
Bilirubin tool 411,897 (7.89)
CDC infant 360,440 (6.94)
Gestational age tool 257,201 (4.92)
Olsen 2010 preterm 126,486 (2.42)
CDC mid-upper arm circ 79,654 (1.53)
Electronic growth chart 79,051 (1.51)
Down syndrome, infant 46,163 (0.88)
Olsen BMI preterm 35,396 (0.68)
Down syndrome, pediatric 28,214 (0.54)
WHO arm and skinfold 21,185 (0.41)
Fenton 2003 preterm 14,562 (0.28)
a
CDC: Centers for Disease Control and Prevention.
b
WHO: World Health Organization.
https://www.jmir.org/2020/1/e16204 J Med Internet Res 2020 | vol. 22 | iss. 1 | e16204 | p. 7
(page number not for citation purposes)
XSL• FO
RenderXJOURNAL OF MEDICAL INTERNET RESEARCH Chou et al
Electronic Growth Chart dates and measures could be entered, but only deidentified data
The growth chart Web calculators on the PediTools website are would be copied and pasted for secure submission via a webpage
limited in that only a single measurement can be analyzed at a form. The output graphic was based on the original published
time, whereas growth reflects how measurements change over chart [21] but with all the points plotted and supplemented with
time. For the Fenton 2013 preterm growth chart, an additional a table of percentiles, Z-scores, expected versus observed
tool was developed to allow monitoring growth over time. As growth, and clinical decision support provided by color coding
a public access website, care needs to be taken to not encourage significant changes in Z-score between measurements (Figure
sending protected health information over the internet. A 4). This tool was also used as part of a quality improvement
Microsoft Excel spreadsheet was developed, in which specific project for longitudinal growth outcome monitoring (see below).
Figure 4. Electronic Fenton 2013 preterm growth chart. De-identified demographic and anthropometric data is copied into a webpage form from a
specifically designed Microsoft Excel™ spreadsheet. The upper panel shows each anthropometric measurement plotted automatically onto the traditional
paper-based chart. The lower panel displays calculated percentiles, Z-scores, and weekly weight change, both the actual observed change as well as the
expected weekly change needed to maintain the previous percentile. Clinical decision support is provided by color-coding based on the weekly weight
Z-score change.
who survived to discharge, were analyzed for growth outcomes
Multisite Comparison of Growth Outcomes analysis (Table 3). Weight Z-scores at birth and discharge and
Variation in Overall Growth Outcomes at Different the change in Z-score from birth to discharge were calculated
Hospitals for each individual patient.
Our first aim was to demonstrate the feasibility of using ∆Z to As shown in Table 3, the mean ∆Z from birth to discharge
assess growth outcomes of premature newborns and to compare differed significantly by site (PJOURNAL OF MEDICAL INTERNET RESEARCH Chou et al
Table 3. Study population of 7975 premature newborns born between 23 and 34 weeks of completed weeks gestation in 7 Massachusetts newborn
intensive care units (A-G).
Metric All NICUsa A (n=461) B (n=1586) Cb (n=1068) D (n=418) E (n=598) F (n=1081) G (n=2763) P
combined val-
(n=7975) ue
Gestational age 32 (29.29- 29 (27.14- 33 (30.43- 32.86 31.86 (29- 29.14 31 (28.57- 32.57JOURNAL OF MEDICAL INTERNET RESEARCH Chou et al
Figure 5. Change in weight Z-score from birth to discharge versus gestational age at birth, demonstrating inferior growth with increasing prematurity
for all seven NICUs combined. The dark blue line is for all years 2006 - 2011 combined with the gray band representing the 95% confidence interval;
the thin lines show the grouped birth years 2006 - 2008 versus 2009 - 2011.
differed by hospital (Figure 6), with significant interhospital
Interhospital Variation Between Growth Outcomes and variation in both the degree of growth failure and the interaction
Gestational Age at Birth with gestational age at birth. Some hospitals show much inferior
It was possible that this inverse relationship between growth growth at lower gestational ages at birth (eg, hospital E),
failure and gestational age at birth was intrinsic to prematurity whereas other hospitals show better growth overall and absence
and was therefore universal among the hospitals. To test this of inferior growth at lower gestational age (eg, hospital F).
hypothesis, we next analyzed whether different hospitals might Patterns of growth at individual hospitals remained stable across
have different growth outcome characteristics. We found that different birth year epochs (data not shown), suggesting
the relationship between ∆Z weight and gestation at birth reliability for use as a quality improvement metric.
Figure 6. Inter-hospital variation in change in weight Z-score from birth to discharge, as related to gestational age at birth, (A) separately for each of
seven different hospital NICUs in Massachusetts, and (B) for hospitals C and F overlaid on the same plot to better demonstrate inter-hospital differences.
https://www.jmir.org/2020/1/e16204 J Med Internet Res 2020 | vol. 22 | iss. 1 | e16204 | p. 10
(page number not for citation purposes)
XSL• FO
RenderXJOURNAL OF MEDICAL INTERNET RESEARCH Chou et al
The differences can be seen clearly when choosing hospital F born the most preterm, NICU C embarked on a multifocal
as the baseline hospital and comparing pairwise with every other quality improvement project to reduce the loss in weight Z-score
hospital (eg, Figure 6). Fitting a linear model of ∆Z versus from birth to discharge. Bundled interventions introduced in
gestational age, with interaction terms for both slope and 2011 targeting factors potentially contributing to poor growth
intercept for each hospital, demonstrated statistically significant included the following:
differences between hospitals A-E and G compared with hospital
• Utilized baseline data to raise awareness of poor growth,
F as baseline. Hospital F did not show a relationship between
for example, in comparison with NICU F
gestational age at birth and ∆Z weight (slope=−0.001, P=.85,
• Implemented system of weekly growth metric collection
95% CI −0.010 to 0.009), and at 29 0/7 weeks, the mean ∆Z
• Formal weekly multidisciplinary (including pediatric
was −0.553 (PJOURNAL OF MEDICAL INTERNET RESEARCH Chou et al
approach was adopted. The subsequent growth target was a ∆Z medical. In addition, most email communications to PediTools
from birth to discharge of roughly −0.6 for all gestations, support have been from dieticians, with some from physicians.
resulting in the more flattened curve of epoch 2015 to 2017
Other than documenting website access statistics, it is difficult
(Figure 7).
to gauge the degree of clinical and research impact of the
Dissemination of Methods for Large-Scale Analysis PediTools website, as before this publication, no citable
The PediTools website has met a need for clinicians wishing to reference or digital object identifier has been available to allow
analyze data for an individual patient at a time. In contrast, the citation tracking. However, in a nonexhaustive internet search,
multisite comparison of growth outcomes of thousands of the PediTools website itself is cited in a number of publications,
patients at 7 NICUs yielded additional insight into growth reviews, and clinical guidelines related to topics such as
patterns of preterm newborns and prompted a successful quality identifying neonatal and pediatric malnutrition,
improvement project at 1 NICU. Here, we describe the release neurodevelopmental outcomes of preterm newborns, bariatric
of open-source computer code to permit others to conveniently surgery guidelines, nutrition delivery in chronic disease, and
do similar analysis, which should be useful for both clinical monitoring of postnatal growth in late-preterm newborns
research and quality improvement monitoring. [2,49-56]. The combination of website access statistics and
citations suggests that the suite of PediTools calculators provides
The peditools R package will be made available on GitHub and a useful service to practicing clinicians.
provide functions to work with LMS-based anthropometric
charts, including all LMS parameters possible [44]. All growth PediTools is primarily accessed by users in the United States.
charts available on the PediTools website (listed in Table 1), It is unclear whether clinicians in other countries use other tools,
with the exception of the Fenton 2013 preterm growth chart, perhaps localized to their specific populations [57,58].
are included. At this time, the Fenton 2013 chart LMS Alternatively, there may be lack of awareness of the tools’
parameters are available by license only and are restricted from availability. Dissemination of PediTools has thus far been
being shared. As additional charts are added to the PediTools entirely by word of mouth, and its development has thus far
website, the peditools R package will also be updated to include neither been formally presented at conferences nor previously
the new charts. The peditools R package will be released under published.
the relatively permissive MIT License, which allows for A limitation is that the calculations performed by PediTools are
commercial use, modification, redistribution, and sublicensing. all done server side; therefore, in areas with limited internet
The primary package tool is the peditools::x_to_z() function, availability, the tools are inaccessible. Work is in progress to
which takes as inputs a vector of anthropometric measurements, develop a number of the tools as mobile device apps that do not
a vector of ages, a vector of genders, and a uniquely specified require internet connectivity, with some preliminary work on
chart and measure, and which outputs a vector of Z-scores. In iOS now released [59,60].
addition, helper functions peditools::recode_von() and Another limitation of the PediTools website is that, currently,
peditools::recode_von_xml() are included to easily import VON only charts with LMS-based parameterizations are offered. In
datasets (exported as a CSV or XML file) into the R some instances, LMS parameterization has been done, but the
environment for analysis. parameters are not published [61]. Alternative methods of
parameterization have also been utilized [62], for example,
Discussion quantile regression for nomogram generation [63] or fitting a
skew t-distribution [64]. The PediTools calculators were
In this work, we discuss the benefits of developing software implemented in PHP, which works well as a general-purpose
tools to perform calculations on LMS-based growth charts and scripting language, but it does not generally support more
present examples of their utilization in patient care delivery, complex statistical calculations. For example, the skew
clinical research, and quality improvement projects. t-distribution does not have a closed form solution, but
Principal Findings and Limitations specialized software in other languages (eg, the GAMLSS
package in R) [65] would allow calculation of exact Z-scores,
PediTools Website given the model’s 4 parameters (mu, sigma, nu, and tau). A
The publicly accessible PediTools website [34] makes possible future extension of the PediTools R package could incorporate
the calculation of exact Z-scores and percentiles for 13 distinct calculations for charts utilizing different parameterizations.
growth charts. Despite the availability of published paper forms
Multisite Comparison of Growth Outcomes in Preterm
of these charts and many of the LMS parameters, there appears
to have been an unmet need for publicly available calculators,
Infants
as demonstrated by PediTools page views increasing to over The PediTools website analyzes a single patient at a time, as
500,000 per month. Most visitors (433,438/520,450; 83.28%) might be appropriate for management of individual patients.
are from the United States, but 21 countries had at least 3000 Upon applying LMS-based calculations to a large cohort of
distinct users in the previous year. It is likely that most visitors infants from 7 hospitals in Massachusetts, we were able to
are health care providers, as inspection of the 100 service characterize the ∆Z weight. Across the overall population,
provider networks with the largest number of PediTools access findings included a significant decrease in weight Z-score and
sessions in the past year revealed that 52 of the network names an association with larger decreases in Z-score at lower
contained one of the words health, health care, hospital, or gestational ages. When each of the 7 hospitals was analyzed
https://www.jmir.org/2020/1/e16204 J Med Internet Res 2020 | vol. 22 | iss. 1 | e16204 | p. 12
(page number not for citation purposes)
XSL• FO
RenderXJOURNAL OF MEDICAL INTERNET RESEARCH Chou et al
separately and compared, we found significant interhospital Identified indicators of malnutrition include the following: ∆Z
variation in decreases in Z-score and in the degree of association over time (with goal ∆Z weight not more negative than −0.8,
with gestational age. The findings remained similar across roughly matching hospital C’s goal after 2014 of ∆Z
different birth year epochs (Figure 5 and data not shown). This weight=−0.6), weight gain velocity, actual nutrient intake, days
observation of growth outcomes is potentially concerning, as to regain birth weight, length growth velocity, and ∆Z of length
growth failure in this vulnerable population is associated with for age. A major purpose of the PediTools LMS-based
poor neurodevelopmental outcomes, and we show here that the calculators was to make these data easy for clinicians to analyze,
infants at highest risk of poor neurodevelopmental track, and understand.
outcome—those born the most preterm—are also at greatest
risk of poor growth.
Comparison With Previous Work
Previous work has analyzed growth of large populations of
For a number of reasons, the interhospital variations should be preterm newborns. Horbar et al [66] drew on data obtained from
taken as a proof of concept and feasibility demonstration of the the full Vermont Oxford Registry on 362,833 newborns born
approach rather than a rigorous comparative analysis of the 7 between 2000 and 2013, with birth weight from 501 to 1500
hospitals. The patient populations of the hospitals differed grams. In this large, aggregate population, they reported
significantly (Table 3). Although all 7 hospitals participated in improvements of growth velocity and a decrease in discharge
the VON registry, which served as the source of the data, with growth failure and severe growth failure (defined as
participation varied among hospitals, with the Very Low Birth discharge at less than the 10th and 3rd percentiles), across the
Weight database (401-1500 grams birth weight or 22-29 weeks time period from 2000 to 2013. Similarly, Griffin et al [67]
completed gestation), the Expanded database (all infants reported on 25,899 infants born in California, with birth weight
admitted to a NICU within 28 days of birth), or even changing from 500 to 1500 grams or gestational age from 22 to 32 weeks,
participation during the time period of this study. In addition, born between 2005 and 2012. They demonstrated a reduction
the discharge disposition varied from 6.4% to 70% transfer to in fall in weight Z-score between birth and discharge over the
another hospital, versus discharge home. No effort was made time period, as well as a reduction in the proportion of infants
to document differences in nutritional practices at each discharged home below the 10th percentile for weight or ∆Z
institution. That being said, reanalysis of the dataset restricted weight less than −1. We see similar improvements in less
to either requiring birth weightJOURNAL OF MEDICAL INTERNET RESEARCH Chou et al
environment, the ggplot2 R visualization package [39-41], and the population at the highest risk of poor neurodevelopment
the peditools package described here [44]. outcomes; and that there was significant interhospital variation
in growth outcomes. At 1 site, these tools provided a convenient
Conclusions and reliable outcome measure for a clinical quality improvement
Tools to perform LMS-based growth chart calculations have project targeting growth. With this report, release of open-source
been made available on a public website and are highly utilized code that implements LMS-based calculations will allow other
by clinical caregivers worldwide. Applying these methods to a clinicians and investigators to conveniently perform similar
large population of preterm newborns demonstrated widespread analyses with the promise to improve long-term outcomes in
overall loss in weight Z-score from birth to discharge; that the these high-risk pediatric patients.
magnitude of loss was associated with increasing prematurity,
Acknowledgments
This study was not externally funded. The authors wish to thank Drs Terri Gorman, Munish Gupta, Nneka Nzegwu, Sunita Pereira,
and Alan Picarillo for contributing patient data. The authors also thank the many NICU caregivers for their commitment to
excellent care of newborns and, particularly, dieticians Meghan Klauer and Charna Simon.
Conflicts of Interest
JHC is the owner of PediTools, LLC. As of February 2018, the PediTools website generates revenue from advertisements served
by Google Adsense; Google Adsense has no input on the content presented on PediTools.
References
1. American Academy of Pediatrics, Barness LA. Pediatric Nutrition Handbook. Sixth Edition. Elk Grove Village, IL: American
Academy of Pediatrics; 2009.
2. Green Corkins K, Teague EE. Pediatric nutrition assessment: anthropometrics to zinc. Nutr Clin Pract 2017 Feb;32(1):40-51.
[doi: 10.1177/0884533616679639] [Medline: 30865347]
3. Kerac M, Frison S, Connell N, Page B, McGrath M. Informing the management of acute malnutrition in infants aged under
6 months (MAMI): risk factor analysis using nationally-representative demographic & health survey secondary data. PeerJ
2019;6:e5848 [FREE Full text] [doi: 10.7717/peerj.5848] [Medline: 31024756]
4. Younge NE, Newgard CB, Cotten CM, Goldberg RN, Muehlbauer MJ, Bain JR, et al. Disrupted maturation of the microbiota
and metabolome among extremely preterm infants with postnatal growth failure. Sci Rep 2019 Jun 3;9(1):8167 [FREE Full
text] [doi: 10.1038/s41598-019-44547-y] [Medline: 31160673]
5. Picon MM, Ruiz DM, Colciencias JI, Salcedo F, Colciencias JI, Alvis N. Risk factors of chronic infant malnutrition in
Cartagena, Colombia: a case-control study. Pediatrics 2018 Jan;141:478 [FREE Full text] [doi:
10.1542/peds.141.1_MeetingAbstract.478]
6. Villar J, Giuliani F, Barros F, Roggero P, Zarco IA, Rego MA, et al. Monitoring the postnatal growth of preterm infants:
a paradigm change. Pediatrics 2018 Feb;141(2):pii: e20172467 [FREE Full text] [doi: 10.1542/peds.2017-2467] [Medline:
29301912]
7. Andrews ET, Ashton JJ, Pearson F, Beattie RM, Johnson MJ. Early postnatal growth failure in preterm infants is not
inevitable. Arch Dis Child Fetal Neonatal Ed 2019 May;104(3):F235-F241. [doi: 10.1136/archdischild-2018-315082]
[Medline: 30135111]
8. Scherdel P, Dunkel L, van Dommelen P, Goulet O, Salaün JF, Brauner R, et al. Growth monitoring as an early detection
tool: a systematic review. Lancet Diabetes Endocrinol 2016 May;4(5):447-456. [doi: 10.1016/S2213-8587(15)00392-7]
[Medline: 26777129]
9. Cole TJ. The LMS method for constructing normalized growth standards. Eur J Clin Nutr 1990 Jan;44(1):45-60. [Medline:
2354692]
10. Ramel SE, Demerath EW, Gray HL, Younge N, Boys C, Georgieff MK. The relationship of poor linear growth velocity
with neonatal illness and two-year neurodevelopment in preterm infants. Neonatology 2012;102(1):19-24. [doi:
10.1159/000336127] [Medline: 22441508]
11. Ramel SE, Georgieff MK. Preterm nutrition and the brain. World Rev Nutr Diet 2014;110:190-200. [doi: 10.1159/000358467]
[Medline: 24751630]
12. Ong KK, Kennedy K, Castañeda-Gutiérrez E, Forsyth S, Godfrey KM, Koletzko B, et al. Postnatal growth in preterm
infants and later health outcomes: a systematic review. Acta Paediatr 2015 Oct;104(10):974-986 [FREE Full text] [doi:
10.1111/apa.13128] [Medline: 26179961]
13. Castanys-Muñoz E, Kennedy K, Castañeda-Gutiérrez E, Forsyth S, Godfrey KM, Koletzko B, et al. Systematic review
indicates postnatal growth in term infants born small-for-gestational-age being associated with later neurocognitive and
metabolic outcomes. Acta Paediatr 2017 Aug;106(8):1230-1238 [FREE Full text] [doi: 10.1111/apa.13868] [Medline:
28382722]
https://www.jmir.org/2020/1/e16204 J Med Internet Res 2020 | vol. 22 | iss. 1 | e16204 | p. 14
(page number not for citation purposes)
XSL• FO
RenderXJOURNAL OF MEDICAL INTERNET RESEARCH Chou et al
14. Ehrenkranz RA, Dusick AM, Vohr BR, Wright LL, Wrage LA, Poole WK. Growth in the neonatal intensive care unit
influences neurodevelopmental and growth outcomes of extremely low birth weight infants. Pediatrics 2006
Apr;117(4):1253-1261. [doi: 10.1542/peds.2005-1368] [Medline: 16585322]
15. Shah PS, Wong KY, Merko S, Bishara R, Dunn M, Asztalos E, et al. Postnatal growth failure in preterm infants: ascertainment
and relation to long-term outcome. J Perinat Med 2006;34(6):484-489. [doi: 10.1515/JPM.2006.094] [Medline: 17140299]
16. Franz AR, Pohlandt F, Bode H, Mihatsch WA, Sander S, Kron M, et al. Intrauterine, early neonatal, and postdischarge
growth and neurodevelopmental outcome at 5.4 years in extremely preterm infants after intensive neonatal nutritional
support. Pediatrics 2009 Jan;123(1):e101-e109. [doi: 10.1542/peds.2008-1352] [Medline: 19117831]
17. Sammallahti S, Pyhälä R, Lahti M, Lahti J, Pesonen A, Heinonen K, et al. Infant growth after preterm birth and neurocognitive
abilities in young adulthood. J Pediatr 2014 Dec;165(6):1109-15.e3. [doi: 10.1016/j.jpeds.2014.08.028] [Medline: 25262301]
18. Zozaya C, Díaz C, de Pipaón MS. How should we define postnatal growth restriction in preterm infants? Neonatology
2018;114(2):177-180. [doi: 10.1159/000489388] [Medline: 29920494]
19. Fenton TR. A new growth chart for preterm babies: Babson and Benda's chart updated with recent data and a new format.
BMC Pediatr 2003 Dec 16;3:13 [FREE Full text] [doi: 10.1186/1471-2431-3-13] [Medline: 14678563]
20. Fenton TR, Sauve RS. Using the LMS method to calculate z-scores for the Fenton preterm infant growth chart. Eur J Clin
Nutr 2007 Dec;61(12):1380-1385. [doi: 10.1038/sj.ejcn.1602667] [Medline: 17299469]
21. Fenton TR, Kim JH. A systematic review and meta-analysis to revise the Fenton growth chart for preterm infants. BMC
Pediatr 2013 Apr 20;13:59 [FREE Full text] [doi: 10.1186/1471-2431-13-59] [Medline: 23601190]
22. Centers for Disease Control and Prevention (CDC). 2017. Growth Charts - Percentile Data Files with LMS Values URL:
https://www.cdc.gov/growthcharts/percentile_data_files.htm [accessed 2019-11-28]
23. Flegal KM, Cole TJ. Construction of LMS parameters for the Centers for Disease Control and Prevention 2000 growth
charts. Natl Health Stat Report 2013 Feb 11(63):1-3 [FREE Full text] [Medline: 24992748]
24. Centers for Disease Control and Prevention (CDC). Growth Charts - WHO Child Growth Standards URL: https://www.
cdc.gov/growthcharts/who_charts.htm [accessed 2019-11-28]
25. Olsen IE, Groveman SA, Lawson ML, Clark RH, Zemel BS. New intrauterine growth curves based on United States data.
Pediatrics 2010 Feb;125(2):e214-e224. [doi: 10.1542/peds.2009-0913] [Medline: 20100760]
26. World Health Organization. WHO Child Growth Standards: Head Circumference-for-age, Arm Circumference-for-age,
Triceps Skinfold-for-age and Subscapular Skinfold-for-age: Methods and Development. Geneva: World Health Organization;
2007.
27. Addo OY, Himes JH. Reference curves for triceps and subscapular skinfold thicknesses in US children and adolescents.
Am J Clin Nutr 2010 Mar;91(3):635-642. [doi: 10.3945/ajcn.2009.28385] [Medline: 20053877]
28. Olsen IE, Lawson ML, Ferguson AN, Cantrell R, Grabich SC, Zemel BS, et al. BMI curves for preterm infants. Pediatrics
2015 Mar;135(3):e572-e581 [FREE Full text] [doi: 10.1542/peds.2014-2777] [Medline: 25687149]
29. Zemel BS, Pipan M, Stallings VA, Hall W, Schadt K, Freedman DS, et al. Growth charts for children with down syndrome
in the United States. Pediatrics 2015 Nov;136(5):e1204-e1211 [FREE Full text] [doi: 10.1542/peds.2015-1652] [Medline:
26504127]
30. Centers for Disease Control and Prevention. 2017. Growth Charts for Children with Down Syndrome URL: https://www.
cdc.gov/ncbddd/birthdefects/downsyndrome/growth-charts.html [accessed 2019-11-28]
31. Abdel-Rahman SM, Bi C, Thaete K. Construction of lambda, mu, sigma values for determining mid-upper arm circumference
z scores in US children aged 2 months through 18 years. Nutr Clin Pract 2017 Feb;32(1):68-76. [doi:
10.1177/0884533616676597] [Medline: 27856693]
32. Mramba L, Ngari M, Mwangome M, Muchai L, Bauni E, Walker AS, et al. A growth reference for mid upper arm
circumference for age among school age children and adolescents, and validation for mortality: growth curve construction
and longitudinal cohort study. Br Med J 2017 Aug 3;358:j3423 [FREE Full text] [doi: 10.1136/bmj.j3423] [Medline:
28774873]
33. Abramowitz M, Stegun IA. Handbook of Mathematical Functions: With Formulas, Graphs, and Mathematical Tables. New
York, NY: Dover; 2013.
34. PediTools. URL: https://peditools.org/ [accessed 2019-11-29]
35. PHP: Hypertext Preprocessor. URL: https://www.php.net/ [accessed 2019-11-28]
36. Realmac Software. RapidWeaver URL: https://www.realmacsoftware.com/rapidweaver/ [accessed 2019-11-28]
37. Bluehost. URL: https://www.bluehost.com/ [accessed 2019-11-28]
38. Vermont Oxford Network Registry. URL: https://public.vtoxford.org/ [accessed 2019-11-28]
39. The R Project for Statistical Computing. Vienna, Austria: R Foundation for Statistical Computing; 2018. URL: https://www.
R-project.org/ [accessed 2019-11-28]
40. RStudio. Boston, MA: RStudio, Inc; 2016. URL: http://www.rstudio.com/ [accessed 2019-11-28]
41. Wickham H. Ggplot2: Elegant Graphics for Data Analysis. New York: Springer-Verlag; 2016.
42. Hastie T, Tibshirani R, Friedman JH. The Elements of Statistical Learning: Data Mining, Inference, and Prediction. Second
Edition. New York, NY: Springer; 2009.
43. Wickham H. R Packages. First Edition. Sebastopol, CA: O'Reilly Media; 2015.
https://www.jmir.org/2020/1/e16204 J Med Internet Res 2020 | vol. 22 | iss. 1 | e16204 | p. 15
(page number not for citation purposes)
XSL• FO
RenderXJOURNAL OF MEDICAL INTERNET RESEARCH Chou et al
44. GitHub. URL: https://github.com/jhchou/peditools [accessed 2019-11-29]
45. Wickham H, Hester J, Chang W. Devtools: Tools to Make Developing R Packages Easier. URL: https://devtools.r-lib.org
[accessed 2019-11-28]
46. Styne DM, Arslanian SA, Connor EL, Farooqi IS, Murad MH, Silverstein JH, et al. Pediatric obesity-assessment, treatment,
and prevention: an endocrine society clinical practice guideline. J Clin Endocrinol Metab 2017 Mar 1;102(3):709-757
[FREE Full text] [doi: 10.1210/jc.2016-2573] [Medline: 28359099]
47. Bhutani VK, Johnson L, Sivieri EM. Predictive ability of a predischarge hour-specific serum bilirubin for subsequent
significant hyperbilirubinemia in healthy term and near-term newborns. Pediatrics 1999 Jan;103(1):6-14. [doi:
10.1542/peds.103.1.6] [Medline: 9917432]
48. American Academy of Pediatrics Subcommittee on Hyperbilirubinemia. Management of hyperbilirubinemia in the newborn
infant 35 or more weeks of gestation. Pediatrics 2004 Jul;114(1):297-316. [doi: 10.1542/peds.114.1.297] [Medline: 15231951]
49. Goldberg DL, Becker PJ, Brigham K, Carlson S, Fleck L, Gollins L, et al. Identifying malnutrition in preterm and neonatal
populations: recommended indicators. J Acad Nutr Diet 2018 Sep;118(9):1571-1582. [doi: 10.1016/j.jand.2017.10.006]
[Medline: 29398569]
50. Ramdin T, Ballot D, Rakotsoane D, Madzudzo L, Brown N, Chirwa T, et al. Neurodevelopmental outcome of late preterm
infants in Johannesburg, South Africa. BMC Pediatr 2018 Oct 15;18(1):326 [FREE Full text] [doi:
10.1186/s12887-018-1296-3] [Medline: 30322374]
51. Pratt JS, Browne A, Browne NT, Bruzoni M, Cohen M, Desai A, et al. ASMBS pediatric metabolic and bariatric surgery
guidelines, 2018. Surg Obes Relat Dis 2018 Jul;14(7):882-901 [FREE Full text] [doi: 10.1016/j.soard.2018.03.019] [Medline:
30077361]
52. Ekvall S, Ekvall VK. Pediatric Nutrition in Chronic Diseases and Developmental Disorders: Prevention, Assessment, and
Treatment. Third Edition. Oxford: Oxford University Press; 2016.
53. Becker P, Carney LN, Corkins MR, Monczka J, Smith E, Smith SE, Academy of Nutrition and Dietetics, American Society
for Parenteral and Enteral Nutrition. Consensus statement of the Academy of Nutrition and Dietetics/American Society for
Parenteral and Enteral Nutrition: indicators recommended for the identification and documentation of pediatric malnutrition
(undernutrition). Nutr Clin Pract 2015 Feb;30(1):147-161. [doi: 10.1177/0884533614557642] [Medline: 25422273]
54. Pridham KF, Limbo RK, Schroeder MM. Guided Participation in Pediatric Nursing Practice: Relationship-Based Teaching
and Learning With Parents, Children, and Adolescents. New York: Springer; 2018.
55. Australian Pediatric Endocrine Group. Growth & Growth Charts URL: https://apeg.org.au/clinical-resources-links/
growth-growth-charts/ [accessed 2019-11-28]
56. Iacobelli S, Viaud M, Lapillonne A, Robillard P, Gouyon J, Bonsante F, NUTRIQUAL Group. Nutrition practice, compliance
to guidelines and postnatal growth in moderately premature babies: the NUTRIQUAL French survey. BMC Pediatr 2015
Sep 3;15:110 [FREE Full text] [doi: 10.1186/s12887-015-0426-4] [Medline: 26337814]
57. Itabashi K, Miura F, Uehara R, Nakamura Y. New Japanese neonatal anthropometric charts for gestational age at birth.
Pediatr Int 2014 Oct;56(5):702-708. [doi: 10.1111/ped.12331] [Medline: 24617834]
58. Li H, Capital Institute of Pediatrics‚ Coordinating Study Group of Nine Cities on the Physical Growth and Development
of Children. [Growth standardized values and curves based on weight, length/height and head circumference for Chinese
children under 7 years of age]. Zhonghua Er Ke Za Zhi 2009 Mar;47(3):173-178. [Medline: 19573429]
59. Apple App Store. PediTools: Fenton 2013 URL: https://apps.apple.com/us/app/peditools-fenton-2013/id1457464960
[accessed 2019-11-28]
60. Apple App Store. PediTools: GA Calc URL: https://apps.apple.com/us/app/peditools-ga-calc/id1474552213 [accessed
2019-11-28]
61. Gauld LM, Kappers J, Carlin JB, Robertson CF. Height prediction from ulna length. Dev Med Child Neurol 2004
Jul;46(7):475-480 [FREE Full text] [doi: 10.1017/s0012162204000787] [Medline: 15230461]
62. Ohuma EO, Altman DG, International Fetal and Newborn Growth Consortium for the 21st Century (INTERGROWTH-21st
Project). Statistical methodology for constructing gestational age-related charts using cross-sectional and longitudinal data:
The INTERGROWTH-21 project as a case study. Stat Med 2019 Aug 30;38(19):3507-3526 [FREE Full text] [doi:
10.1002/sim.8018] [Medline: 30488491]
63. Flaherman VJ, Schaefer EW, Kuzniewicz MW, Li SX, Walsh EM, Paul IM. Early weight loss nomograms for exclusively
breastfed newborns. Pediatrics 2015 Jan;135(1):e16-e23 [FREE Full text] [doi: 10.1542/peds.2014-1532] [Medline:
25554815]
64. Villar J, Ismail LC, Victora CG, Ohuma EO, Bertino E, Altman DG, International Fetal and Newborn Growth Consortium
for the 21st Century (INTERGROWTH-21st). International standards for newborn weight, length, and head circumference
by gestational age and sex: the Newborn Cross-Sectional Study of the INTERGROWTH-21st Project. Lancet 2014 Sep
6;384(9946):857-868. [doi: 10.1016/S0140-6736(14)60932-6] [Medline: 25209487]
65. Rigby RA, Stasinopoulos DM. Generalized additive models for location, scale and shape (with discussion). J R Stat Soc
Ser C Appl Stat 2005 Jun;54(3):507-554 [FREE Full text] [doi: 10.1111/j.1467-9876.2005.00510.x]
https://www.jmir.org/2020/1/e16204 J Med Internet Res 2020 | vol. 22 | iss. 1 | e16204 | p. 16
(page number not for citation purposes)
XSL• FO
RenderXJOURNAL OF MEDICAL INTERNET RESEARCH Chou et al
66. Horbar JD, Ehrenkranz RA, Badger GJ, Edwards EM, Morrow KA, Soll RF, et al. Weight growth velocity and postnatal
growth failure in infants 501 to 1500 grams: 2000-2013. Pediatrics 2015 Jul;136(1):e84-e92 [FREE Full text] [doi:
10.1542/peds.2015-0129] [Medline: 26101360]
67. Griffin IJ, Tancredi DJ, Bertino E, Lee HC, Profit J. Postnatal growth failure in very low birthweight infants born between
2005 and 2012. Arch Dis Child Fetal Neonatal Ed 2016 Jan;101(1):F50-F55. [doi: 10.1136/archdischild-2014-308095]
[Medline: 26201534]
Abbreviations
CDC: Centers for Disease Control and Prevention
LMS: lambda-mu-sigma
MIT: Massachusetts Institute of Technology
NICU: neonatal intensive care unit
VON: Vermont Oxford Network
WHO: World Health Organization
∆Z: change in weight Z-score
∆Z weight: change in weight Z-score from birth to discharge
Edited by G Eysenbach; submitted 12.09.19; peer-reviewed by P Becker, D Goldberg, T Fenton; comments to author 22.10.19; revised
version received 30.10.19; accepted 13.11.19; published 30.01.20
Please cite as:
Chou JH, Roumiantsev S, Singh R
PediTools Electronic Growth Chart Calculators: Applications in Clinical Care, Research, and Quality Improvement
J Med Internet Res 2020;22(1):e16204
URL: https://www.jmir.org/2020/1/e16204
doi: 10.2196/16204
PMID:
©Joseph H H Chou, Sergei Roumiantsev, Rachana Singh. Originally published in the Journal of Medical Internet Research
(http://www.jmir.org), 30.01.2020. This is an open-access article distributed under the terms of the Creative Commons Attribution
License (https://creativecommons.org/licenses/by/4.0/), which permits unrestricted use, distribution, and reproduction in any
medium, provided the original work, first published in the Journal of Medical Internet Research, is properly cited. The complete
bibliographic information, a link to the original publication on http://www.jmir.org/, as well as this copyright and license information
must be included.
https://www.jmir.org/2020/1/e16204 J Med Internet Res 2020 | vol. 22 | iss. 1 | e16204 | p. 17
(page number not for citation purposes)
XSL• FO
RenderXYou can also read