Occupation-Based Life Expectancy - Actuarial Fairness in Determining Statutory Retirement Age - Netspar
←
→
Page content transcription
If your browser does not render page correctly, please read the page content below
Occupation-Based Life Expectancy

Actuarial Fairness in Determining
Statutory Retirement Age

Dorly Deeg, Wouter De Tavernier, Sascha de Breij

                      DP 08/2021-018
ORIGINAL RESEARCH
                                                                                                                                             published: 23 August 2021
                                                                                                                                        doi: 10.3389/fsoc.2021.675618

                                               Occupation-Based Life Expectancy:
                                               Actuarial Fairness in Determining
                                               Statutory Retirement Age
                                               Dorly J.H. Deeg 1*, Wouter De Tavernier 2 and Sascha de Breij 1
                                               1
                                                 Department of Epidemiology and Data Science, Amsterdam University Medical Centers, Vrije Universiteit Amsterdam,
                                               Amsterdam, Netherlands, 2Centre for Comparative Welfare Studies, Aalborg University, Aalborg, Denmark

                                               This study examines occupation-based differences in life expectancy and the extent to
                                               which health accounts for these differences. Twentyseven-year survival follow-up data
                                               were used from the Dutch population-based Longitudinal Aging Study Amsterdam (n
                                               2,531), initial ages 55–85 years. Occupation was based on longest-held job. Results show
                                               that the non-skilled general, technical and transport domains had an up to 3.5-year shorter
                                               life expectancy than the academic professions, accounting for the compositional
                                               characteristics age and gender. Statutory retirement age could be made to vary
                                               accordingly, by allowing a proportionally greater pension build-up in the shorter-lived
                                               domains. Health accounted for a substantial portion of the longevity difference, ranging
                                               from 20 to 66%, depending on the health indicator. Thus, health differences between
                                               occupational domains today can be used as a means to tailor retirement ages to
                        Edited by:
                       Moritz Hess,
                                               individuals’ risks of longevity. These data provide a proof of principle for the
   Hochschule Niederrhein, Germany             development of an actuarially fair method to determine statutory retirement ages.
                       Reviewed by:
                                               Keywords: retirement age, occupation, longevity, health, longitudinal study
                      Elias Naumann,
    Harvard University, United States
                    Aart-Jan Riekhoff,
   Finnish Centre for Pensions (ETK),          INTRODUCTION
                              Finland
                  *Correspondence:
                                               Actuarial fairness is considered a key aspect of a just pension system (Schokkaert and Van Parijs,
                     Dorly J.H. Deeg           2003; De Tavernier, 2021) and can be understood as “equal treatment for equal risks” (Landes,
          djh.deeg@amsterdamumc.nl             2015, p. 521). For a pension system to be actuarially fair, an individual’s contributions (plus
                                               interests) should equal the individual’s expected benefits. Expected benefits are directly linked to
                   Specialty section:          the expected duration of time during which they will be enjoyed, i.e., the individual’s life
        This article was submitted to          expectancy. It is well-known, however, that life expectancy is strongly socially stratified (Kunst
Work, Employment and Organizations,            and Mackenbach, 1994). Moreover, in European countries the longevity gap between lower and
              a section of the journal         higher socio-economic positions has been shown to be increasing (Unger and Schulze, 2013;
                Frontiers in Sociology
                                               Östergren et al., 2017; Tanaka et al., 2019). Thus, equal treatment through a uniform statutory
          Received: 03 March 2021              retirement age does not do justice to the socially highly unequally distributed life opportunities and
         Accepted: 05 August 2021
                                               is not actuarially fair (Unger and Schulze, 2013). Given a uniform statutory retirement age, Barnay
         Published: 23 August 2021
                                               (2007) showed that executives and the intermediate professions benefit much more from the
                               Citation:       pension system than manual workers. Likewise, several authors concluded that such pension
       Deeg DJH, De Tavernier W and
                                               systems generate a Matthew effect, redistributing means from the less well-off to the better-off
 de Breij S (2021) Occupation-Based
 Life Expectancy: Actuarial Fairness in
                                               (Myles, 2003; Schokkaert and Van Parijs, 2003; Queisser and Whitehouse, 2006; Simonovits,
Determining Statutory Retirement Age.          2015). When contributions and benefits would be adapted to differences in life expectancy,
               Front. Sociol. 6:675618.        redistribution towards an actuarially fair system could take place. This study proposes a
       doi: 10.3389/fsoc.2021.675618           mechanism through which this could be achieved.

Frontiers in Sociology | www.frontiersin.org                                         1                                         August 2021 | Volume 6 | Article 675618
Deeg et al.                                                                                                          Occupation-Based Life Expectancy

    Various policies affect actuarial fairness of pension systems.                Evidence on the impact of employment characteristics other
One way to make pension policies actuarially fair is through early             than job level on mortality comes from studies on working
retirement regulations. Some European countries offer early                    conditions. In a meta-analysis of 17 studies, Amiri and
retirement possibilities for specific categories of workers in                  Behnezhad (2020) reported that in people with job strain,
highly demanding jobs. In their overview, Natali et al. (2016)                 which is a combination of high demands and low control at
find a wide variety of classifications and interpretations of what               work, the risk of mortality is 20% higher than in the reference
constitutes arduous jobs across countries, and note that the                   group. Also physical demands have been shown to be associated
concept is often not clearly delineated. This is the case for the              with increased risk of mortality (Mikkola et al., 2019). In a recent
new Finnish years-of-service pension (Finnish Centre for                       study from our own group, people at age 55 who had physically
Pensions, 2015), for instance, where discretion is given to                    strenuous jobs regarding repetitive movements and use of force
medical doctors to make decisions in individual cases. In other                had a 1.5–2.0 years shorter life expectancy than their counterparts
countries, such as Belgium and the Netherlands, social partners                with less strenuous jobs, and people who had jobs with a low
continue to disagree about which jobs fall in this category,                   variation in activities and low autonomy had a 1.1–2.5 years
illustrating the arbitrary nature of decisions about which jobs                shorter life expectancy than their counterparts with jobs with
are particularly demanding.                                                    high variation and autonomy (de Wind et al., 2020). Working
    This study aims to develop a more objective method to                      conditions may be concentrated in specific occupations, but
determine statutory retirement ages rooted in actuarial fairness               essentially cut across occupations. The findings from studies
by quantifying occupation-based life expectancies. Linking the                 on working conditions are relevant for the management of
resulting life expectancies to pension build-up would improve                  older workers’ balance of work capacity and work demands,
actuarial fairness of pension systems. Thus, workers in                        which is to be achieved mainly in the workplace and at the
occupational domains with a shorter life expectancy should be                  company level. For pension policy, however, it is useful to
facilitated to retire earlier by adjusting their pension build-up. It is       consider a higher aggregate level.
important to note that by taking actuarial fairness as our point of               Studies addressing the impact on mortality of occupation per
departure, the question of whether inequalities in life expectancy             se are scarce, although they have a long tradition (Fox and
are actually caused by occupational exposure differences is not                Adelstein, 1978). Moore and Hayward (1990) showed that in
relevant (indeed, selection into occupations might play an                     the United States between 1966 and 1983, service workers had a
important role, leading to compositional differences, see                      4.5-year shorter life expectancy from age 55 than professionals. In
Ravesteijn et al., 2018). The principle merely requires that                   another US study, Johnson and colleagues (1999) found
pension policies are adjusted to observed differences in                       increasing risks of mortality across the occupational spectrum
longevity: contributions and expected benefits should balance                   from the highly skilled occupations to less-skilled and generally
out–no matter what causes occupation-based differences in life                 more labor-intensive occupations. A more recent South Korean
expectancy.                                                                    study of workers enrolled in a national insurance program
    Earlier evidence shows that numerous factors impact                        showed that workers in elementary occupations had a twice as
longevity, including physical and mental health related factors,               high mortality rate as professionals (Lee et al., 2016). A recent
social conditions, and heredity (e.g., Goldman et al., 2016; Iacob             study in the United Kingdom was based on linkage of census data
et al., 2016; Suemoto et al., 2017). Among these, social                       with 10-year follow-up registry mortality data and distinguished
stratification indicators such as level of education and level of               60 occupations (Katikireddi et al., 2017). It showed that among
occupation play an important role. Many of these studies                       men, the highest mortality rates were in elementary construction,
considered occupation as a proxy for socio-economic position.                  housekeeping and factory workers, whereas health professionals
Indeed, in the United Kingdom occupational class has been used                 had the lowest mortality. Among women, factory workers and
as the standard indicator of social class (Llena-Nozal et al., 2004).          garment trade workers had high, and teachers and business
But also in studies outside the United Kingdom, occupation has                 professionals had low mortality rates.
been used as such, e.g., in Canada (Tjepkema et al., 2013), in                    In this study, we will specifically address differences in
Denmark (Brønnum-Hansen et al., 2020), and in other European                   longevity by broad occupational domains, as they closely
countries (Tanaka et al., 2019). In these studies, the occupational            correspond to industrial sectors. A sector is defined as a group
classification represents a hierarchy of skill level, rather than               of industries with the same main economic activity; the latter is
actual occupations. It may be argued that social class is the main             indicated by the predominant type of occupation (Statistics
factor at work in occupation-related differences in health. Early              Netherlands, 2021). Using sector as a study unit offers a
studies by Moore and Hayward (1990) and Johnson and                            number of advantages from a policy perspective. First, it suits
colleagues (1999), however, showed that important mortality                    the actuarial fairness argument as, in most countries, pension
differences between occupations exist that are not accounted                   entitlements and contributions are linked to employment sector.
for by social status, income, and education. A recent study by                 Second, variations in pension policies can be decided by social
Leinonen et al. (2018) showed evidence of variation in sickness                partners in sector-specific collective bargaining, and occupational
absence between four large industrial sectors despite the fact that            pension schemes often already are sector-specific (De Preter et al.,
these were examined within particular occupational classes.                    2012; Wiß 2015). Third, sector of employment is information that
These studies support the unique contribution of occupation                    is easily accessible for governments and is readily available in
to health outcomes.                                                            many state registers. In Netherlands, the country in which our

Frontiers in Sociology | www.frontiersin.org                               2                                    August 2021 | Volume 6 | Article 675618
Deeg et al. Occupation-Based Life Expectancy
study is based, the focus on sector has direct applicability, as survival time relative to the total population, based on sex and age
negotiations between unions of employees and employers are at baseline (Deeg et al., 1989). As such, the RPD belongs to the
conducted sector-wise, and pension funds, the institutes that family of relative survival measures (Rutherford et al., 2012). We
provide the work-related pension benefits, are organized opt for this individual measure of survival rather than using
within sectors. Hence, we formulate a first research question: commonly used group-based methods to predict survival time,
such as Cox proportional hazards models, for several reasons.
- What are quantitative differences in longevity between First, an individual measure is more accurate than group-based
occupational domains? approaches. Second, it lends itself as the dependent variable in
linear regression models, with the advantage that examination of
We are aware of the issue that in developing occupation-based explanatory factors (our second research question) is
retirement ages, the calculation of occupation-based life expectancy straightforward (Mood, 2010). Third, as the RPD is based on
involves mortality follow-up of individuals over time until enough the age and sex of each individual participant, differences the in
individuals should have deceased in order to construct reliable age-sex composition across occupational domains are accounted
mortality tables. This can only be done on historical data. for. Differences in RPD can be transformed into differences in
However, occupations change over the years in terms of task use number of years of life expectancy.
and demands (Romeu Gordo and Skirbekk, 2013; Cassidy, 2017), so Using life tables based on the total population for subsequent
that occupation-based life expectancies of earlier generations may not years (1992 through 2019) during the study period, the RPD
be generalized to those working in the same occupations today. To compares for each individual of a specific age and sex this
overcome this problem, we test to what extent the relation between person’s survival probability with the overall survival
occupational domain and life expectancy is accounted for by health in probability of the Dutch population of that age and sex, from
the historical data. We are not aware of earlier studies testing the role the starting month of the study through the years up to December
of health. However, if indeed health acts as an explanatory factor of 31, 2019. In formula:
this relationship, we can use health differences between domains today
as a means to tailor statutory retirement ages to individuals’ risks of RPD 1 − d(ai,s)
1 . . . 1 − d(ai,s)
n
longevity, thereby making pension systems more actuarially fair. This
where n is the total number of calendar years during which the
leads to our second research question:
participant is followed up to death or end-of-study, di is the
probability of death according to the life table in calendar year
- To what extent are health indicators explanatory factors in the
i (i 1 . . . n), ai is the age in calendar year i, and s is the sex of the
association between occupational domain and longevity?
participant.
Possible values of the RPD lie between 0 and 1. These values
MATERIALS AND METHODS introduce a rank order among all sample subjects. The reference
population has a mean RPD of 0.50. If the RPD is greater than
Sample 0.50, this means that the subject has lived a relatively short time; if
Data are used from the 1992–93 baseline cycle of the Dutch it is less than 0.50, the subject has lived a relatively long time after
population-based Longitudinal Aging Study Amsterdam (LASA), baseline. For example, the value of a man’s RPD is 0.80 if 80% of
linked to vital status follow-up from municipal registries. LASA is his age and sex peers in the total population are still alive at the
a prospective study of cohorts based in three regions of the time of his death. The name “realized probability of dying” comes
Netherlands that together form a representative sample for the from the notion that the individual has “realized” the probability
Netherlands (Deeg et al., 2002; Hoogendijk et al., 2020). The of death when a certain percentage of the reference population is
baseline sample included 3,107 55–85-year-olds. Older ages and expected to be still alive. The actual amount of survival time
men were oversampled, so that each 5-year age group included needed to reach a particular RPD varies according to the age and
about 250 male and 250 female participants. Among these sex of the individual at baseline, with older people needing less
participants, for 19 the vital status was unkown, 173 time to achieve a lower RPD than younger people, and men
responded to a short version of the interview which did not needing less time than women. For example, a man aged 65 years
include questions about current or past work, 80 missed one or when first participating in LASA in 1993, who dies after 20 years
more of the work questions, and 304 never had a job. Excluding in 2013, has an RPD of 0.39. By comparison, a woman aged
these participants left a study sample size of 2,531. 65 years in 1993 will have the same RPD of 0.39 when she dies
after 24 years, in 2017.
Dependent Variable For those participants still alive at the end of the study period
Vital status is traced periodically through the Municipal Personal (December 31, 2019), i.e. 16.0% of the study sample (n 406), a
Records database which covers all residents in the Netherlands. value of the Realized Probability of Dying is imputed. The RPD
For the current study, mortality ascertainment up to December for these participants is estimated by assuming that their
31, 2019 was used, providing about 27 years of mortality follow- remaining survival time corresponds to the median population
up. At the probing date, 84.0% if the study sample had died. survival time from end-of-follow-up onward. This amounts to
The dependent variable is operationally defined as the Realized multiplying the probability of reaching their age at the end of
Probability of Dying (RPD). The RPD is an individual measure of 2019 by 0.5. For example, a woman aged 65 when examined in
Frontiers in Sociology | www.frontiersin.org 3 August 2021 | Volume 6 | Article 675618Deeg et al. Occupation-Based Life Expectancy
1993, reaches the age of 91 in 2019 with probability 0.30. If she is been proven to be a “best” predictor set for longevity (Suemoto
still alive at the end of 2019, her imputed RPD is 0.15, implying et al., 2017).
that it is expected that she will die when only 15% of her 1993 Sickness days. These were self-reported as the number of days
cohort is still alive. This approach is derived from standard during the past month that participants had been ill to such extent
actuarial methods. that they had to stay in bed, with response categories 1) no days,
If the study sample’s RPD shows a uniform distribution, the 2) 1–3 days, 3) 4–7 days, 4) more than 1 week but less than a
survival distribution of the sample represents that of the total month, 5) all month.
population. In this case, the logit of the RPD (LRPD log(RPD/ Number of medications. The medications which the
(1-RPD))) approaches a normal distribution with mean 0, and participants were using were recorded by the interviewer by
can be used as the dependent variable in analysis of variance and inspecting the medicine containers. The total number of
linear regression analysis. In our study sample, the mean medications used was included in the analyses.
(standard deviation) of the RPD and the LRPD are 0.50 (0.28) Hospital admission was self-reported. In order to avoid recall
and 0.05 (1.66), respectively, and thus its survival is very close to bias, hospital admission was not asked longer back than
that of the total population. 6 months.
Outpatient visits. Contact with a medical specialist or
Independent Variables psychiatrist was self-reported and also pertained to the past
Occupational Domains 6 months.
For baseline participants who currently did paid work, their General practice contact. Contact with the participant’s general
precise job description was recorded. For those who had done practitioner was self-reported and pertained to the past 6 months.
paid work in the past, the job description of their longest-held job Four chronic conditions, i.e., obstructive lung disease,
was recorded. For those participants whose current job was not cardiovascular disease, diabetes, and cancer, were self-reported.
the longest-held job, data on their longest-held job were used, Comparison with general practitioner records showed a
because workers may have moved to less strenuous jobs and for satisfactory agreement (Kriegsman et al., 1996).
them, the association of occupation with longevity may be Disability was self-reported using the Global Activity
underestimated (Moore and Hayward, 1990). Based on the job Limitation Index, which asks about activity limitation that has
characteristics domain (e.g., agricultural, care, teaching), required lasted at least 3 months. It is coded as 1) no limitations, 2) mild
skill level (i.e., elementary through scientific, based on required limitations, 3) severe limitations (Van Oyen et al., 2006).
education, training period, and work experience), and tasks (e.g., Self-rated health was measured using the single, widely used
cattle breeding, nursing, instructing), jobs were classified into 43 question “How is your health in general?,” with codes from 1)
occupational categories according to the Netherlands Standard very good, to 5) poor.
Classification of Occupations 1992 (Statistics Netherlands, 2001; Cognitive impairment was ascertained using the Dutch
Rijs et al., 2014). These categories were condensed into 13 broad translation of the MiniMental State Exam (MMSE, Folstein
occupational domains by collapsing the skill levels within one et al., 1975). On 23 questions and tasks, respondents received
domain. For the current study, seven of the largest domains were one or more points when they gave the correct answer or
selected: the non-skilled general, technical, transport, performed the task correctly. Scores range from (0) all answers
administrative/commercial, care, agriculture, and pedagogical incorrect, to (30) unimpaired.
(teaching) domains. The technical domain includes jobs such
as construction, machine work, electro-technical maintenance. Covariates
The administrative/commercial domain includes jobs such as Other independent variables, for descriptive purposes, include
book keeper, buying clerk, hotel manager. The care domain socio-demographic characteristics: age, gender, education in
includes (para)medical and social care and services jobs. years, and occupational skill level. The latter variable was
Together, these seven domains constitute 91.7% of the sample. coded from 1) elementary to 5) scientific. Work status was
Domains that had less than 90 cases were grouped and served as included in the analyses, because evidence shows that health
the reference category for comparison of survival time. This tends to improve after retirement (Eibich, 2015), and that before
category includes the following domains: natural science, retirement age, people who currently do paid work are in better
juridical/security, cultural/linguistic, social science, and health than people who do not do paid work (Scharn et al., 2019).
management. All had a survival time longer than average Work status was defined using two dummy variables: doing paid
(Supplementary Table A). The mean (standard deviation) of work versus not doing paid work, and being fully retired versus
the LRPD of the reference group was −0.21 (1.61). not fully retired.
Health Statistical Analysis
In order to facilitate implementation in the practice of pension The socio-demographic and health characteristics of the seven
insurance, we selected five health measures that are commonly occupational domains were compared using the chi-square test
retrievable from register data for initial analyses, i.e., sickness for dichotomous variables, and ANOVA’s F-test for continuous
days, number of medications, hospital admission, outpatient variables. Likewise, the distribution of the LRPD across the
visits, and general practitioner contact. For sensitivity domains was examined using ANOVA’s F-test. To provide an
analyses, we selected seven other health measures that have illustration of this distribution, the domain-specific remaining life
Frontiers in Sociology | www.frontiersin.org 4 August 2021 | Volume 6 | Article 675618Deeg et al. Occupation-Based Life Expectancy
TABLE 1 | Socio-demographic characteristics of the occupational domains selected. Source: Longitudinal Aging Study Amsterdam, 1992–93 (n 2,531).
N (%) Gendera (%) Education in yearsb Skill levelc Work statusd (%) LRPDe
Male Female M (sd) M (sd) Paid work AgeDeeg et al. Occupation-Based Life Expectancy
TABLE 2 | Key health characteristics of the occupational domains selected. Source: Longitudinal Aging Study Amsterdam, 1992–93 (n 2,531).
≥1 sick No. of Hospital admissiona Outpatient visita Family physician
days past current medications (%) (%) contacta (%)
month (%) (M, sd)
General 8.1 2.0 (1.8)d 14.0c 48.3 74.6
Technical 10.3c 1.8 (1.8) 11.4 50.4 68.0c
Transport 8.1 1.7 (1.8) 11.9 57.5b 74.6
Administrative 9.4 1.6 (1.8) 8.1 49.6 73.6
Care 6.1b 1.7 (1.8) 9.2 44.7b 69.6
Agriculture 3.1d 1.5 (1.6) 8.4 42.3b 73.1
Teaching 6.5 1.5 (1.7) 10.4 50.5 70.0
Others 8.1 1.6 (1.8) 8.1 51.0 75.2
a
In the past 6 months.
Significance of difference between each domain and the “others” domain:
b
p < 0.10;
c
p < 0.05;
d
p < 0.01.
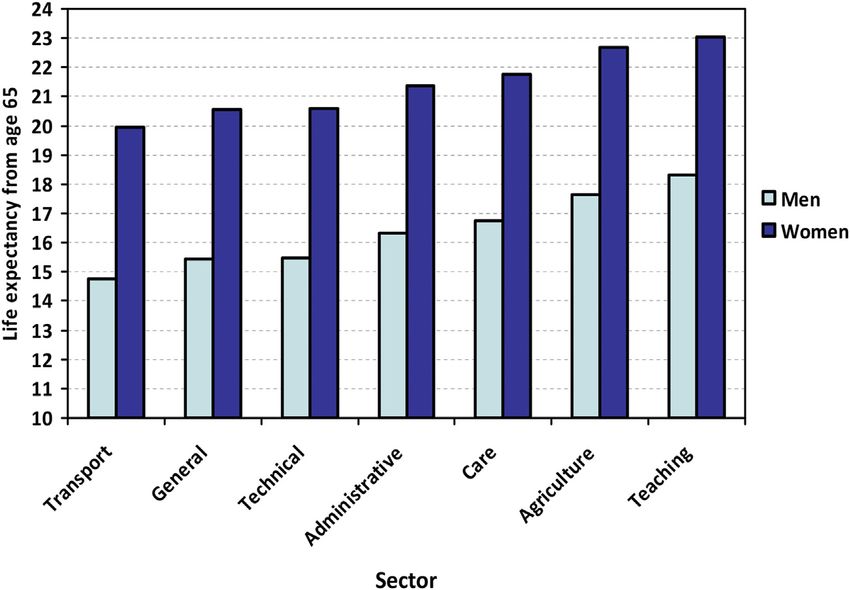
FIGURE 1 | Life expectancy by occupational domain for men (light colors) and women (dark colors) at age 65. Note: The data are based on analysis of domain
specific relative survival using the full sample, the results of which are compared to the population-based sex-specific survival curves at age 65 in order to obtain life
expectancies (Supplementary Figure A). Source: Longitudinal Aging Study Amsterdam, 1992–93 to 2019.
men and women at age 65. The transport domain is characterized These differences would imply that male workers in the transport
by the shortest life expectancy, i.e., 14.7 years for men and domain would be allowed for example a 1 + 1.8/16.5 1.1 greater
20.0 years for women. The teaching domain is characterized pension build-up during their working years, accompanied by a
by the longest life expectancy, i.e., 18.3 years for men and proportionally earlier statutory retirement age than male workers
23.1 years for women. For men, the difference amounts to in a domain with a median life expectancy.
3.6 years; for women, this is 3.1 years. In-between are, in A further test of these differences using linear regression
ascending order, the non-skilled general, technical, analysis (model 1 in Table 3) yields statistically significantly
administrative, care, and agriculture domains. The population higher LRPDs for, in descending order, the transport, the non-
median of the survival time at age 65 is 16.5 years for men and skilled general, the technical, and the administrative domain as
21.5 years for women. Thus, on the lowest end of the spectrum, compared to the other, non-defined domains (Bs ranging from
the transport domain’s life expectancy is 1.8 years below the 0.503 to 0.264; p < 0.05). Adding work status to the regression
population median for men and 1.5 years for women. On the model somewhat decreases the regression coefficients, such that
other end of the spectrum, the survival time advantage of the the coefficient for the administrative section no longer reaches
teaching domain is 1.8 years for men and 1.6 years for women. statistical significance (model 2 in Table 3).
Frontiers in Sociology | www.frontiersin.org 6 August 2021 | Volume 6 | Article 675618Deeg et al. Occupation-Based Life Expectancy
TABLE 3 | Linear regression models of LRPD on occupational domain1, adjusted for age (model 1), and adjusted for age and work status (model 2). Source: Longitudinal
Aging Study Amsterdam (N 2,531).
Model 1 Model 2
Regression coefficient B Confidence interval Significance Regression coefficient B Confidence interval Significance
(p-value) (p-value)
General 0.422 0.112; 0.732 0.008 0.388 (0.158) 0.078; 0.698 0.014
Technical 0.405 0.150; 0.660 0.002 0.395 (0.130) 0.140; 0.650 0.002
Transport 0.503 0.111; 0.895 0.012 0.499 (0.200) 0.107; 0.891 0.013
Administrative 0.264 0.007; 0.521 0.045 0.243 (0.132) −0.014; 0.500 0.066
Care 0.204 −0.070; 0.478 0.146 0.175 (0.141) −0.101; 0.451 0.213
Agriculture 0.065 −0.254; 0.384 0.690 0.060 (0.163) −0.259; 0.379 0.712
Teaching −0.022 −0.404; 0.360 0.910 −0.024 (0.195) −0.406; 0.358 0.903
Paid work - - - −0.282 (0.114) −0.505; −0.059 0.014
(Early) retired - - - −0.275 (0.122) −0.514; −0.036 0.024
a
Each domain is compared to the “others” domain.
TABLE 4 | Linear regression models of LRPD on occupational domain1, adjusted for age and work status (model 1), and additionally adjusted for five health variables (models
2). Imputed data (n 2,531)2. Source: Longitudinal Aging Study Amsterdam, 1992–93 to 2019.
Model 1 Model 2
Regression coefficient B Confidence interval Significance Regression coefficient B Confidence interval Significance
(p-value) (p-value)
General 0.344 0.032; 0.656 0.030 0.273 −0.029; 0.575 0.076
Technical 0.383 0.128; 0.638 0.003 0.308 0.061; 0.555 0.015
Transport 0.484 0.092; 0.876 0.016 0.392 0.010; 0.774 0.044
Administrative 0.244 −0.015; 0.503 0.090 0.193 −0.058; 0.444 0.130
Care 0.155 −0.121; 0.431 0.272 0.122 −0.147; 0.391 0.372
Agriculture 0.047 −0.274; 0.368 0.773 0.113 −0.199; 0.425 0.475
Teaching −0.038 −0.420; 0.344 0.845 −0.040 −0.410; 0.330 0.832
≤1 sick days < all montha - - - 0.187 −0.044; 0.418 0.111
Sick all montha - - - 1.960 0.900; 3.020Deeg et al. Occupation-Based Life Expectancy
domain to mortality (e.g., Moore and Hayward, 1990; Johnson an extra analysis of our own dataset, we have added the lifestyle
et al., 1999, Katikireddi et al., 2017, Lee et al., 2016). Furthermore, factors smoking, heavy alcohol consumption, obesity, and
we found for four of our five health indicators which are minutes spent on physical activity (walking, doing a sport) as
presumably retrievable from registries, that they explained a confounders to our basic analytic model (i.e., model 2 in Table 3).
substantial portion of the association of domain with Interestingly, these factors acted as suppressors, i.e., the
longevity. The joint contribution of these health variables was regression coefficients for the general, technical and transport
about 20% for the domains with the shortest life expectancy. The domains became stronger. This was due to the fact that the
contribution of a “best” predictor set of health indicators ranged domain “other” included substantially more current smokers and
from 66.5 to 20.2%, with the largest percentage in the domain heavy alcohol consumers than the specified domains, while this
with the shortest life expectancy. These findings suggest that category had a relatively long survival time. In our study,
health differentiates among occupational domains in a similar therefore, unhealthy behaviour does not explain the
way as life expectancy. association between domains and longevity. These findings
Comparison of the differences in life expectancy found in our once again support the relevance of occupational domain for
study with the pertinent scientific literature is not pension policy.
straightforward. In reports from the few studies addressing the From the identification of health indicators as explanatory
association of occupation or occupational domain with mortality, factors, two kinds of implications can be noted. One is, in line
the findings are commonly expressed as risk ratios or percentages with our second research question, to differentiate between
excess mortality. Therefore, differences in life expectancy occupational domains in determining pensionable ages. The
expressed in years, such as our study reports, are not directly other one is to improve health in the workplace. Numerous
comparable. The only study reporting between-domain observational studies on work and health have noted the latter
differences in life expectancy in years, to our knowledge, implication. However, health intervention studies in the
showed a maximum difference of 4.5 years at age 55 (Moore workplace so far do not show very promising results, i.e. effect
and Hayward, 1990). Considering the mean life expectancy at age sizes are small, if any (e.g., Hazelzet et al., 2019; Söderbacka et al.,
55 is larger than at age 65, this difference is comparable to the one 2020). Until effective interventions are designed, differentiation
we found at age 65. Our earlier study on work conditions and life of pension policies based on health differences between
expectancy at age 55 showed a maximum difference between occupational domains is recommendable to reach greater
unfavorable and favorable work conditions of 2.6 years for men actuarial fairness.
and 2.3 for women (de Wind et al., 2020). The latter are smaller
than the domain differences found in the current study. A Strengths and Limitations
German study in 16–65-year-olds of the effect of working We emphasize that our findings should be considered as
conditions on self-rated health found a 16-months “ageing preliminary. Nevertheless, we can already state some strengths
effect” of high physical strain, and a 6-months effect of low and limitations. The sample used is representative for the older
control (Ravesteijn et al., 2018). Although the use of a different Dutch population in 1992–93. Our analyses use occupational
health measure and different occupational characteristics do not domain as the basis, because domains closely correspond to
allow a close comparison with our own study, these effects are industrial sectors, and in the Netherlands pension policies are
also smaller than the domain-effects on survival time in our negotiated by social partners in sector-specific collective
current study. Thus, occupational domain is certainly a relevant bargaining and occupational pension funds are organized by
criterion to differentiate shorter from longer life expectancies. sector. Thus, implementation of our model is facilitated. The
It may be argued that health behaviors are a major factor at measure of survival time used is sensitive to inter-individual
work in occupation-related differences in health, because differences, because it is based on age and gender, and is
unhealthy behaviors are shared within occupations (Fox and prospective. Furthermore, our exposure variable was longest-
Adelstein, 1978; Johnson et al., 1999). The implication would held job rather than current job, so that health selection
be that differences in longevity by occupational domain arise through transition to less strenuous jobs was precluded
from behavior that is independent from employment and thus (Moore and Hayward, 1990).
should not be accounted for in pension policy. One study of In addition to these strengths, there are some weaknesses.
workers in the construction sector compared the variance First, the sample is relatively small when it comes to studying
explained in work ability by health conditions and health occupational domains more comprehensively. We selected the
behaviors on the one hand and work-related factors on the seven largest domains, based on a rule of thumb that their sample
other hand (Alavinia et al., 2007). Health behaviors, including size is not smaller than 90. This makes it difficult to compare our
obesity, physical activity, and smoking, explained less than 1% findings to studies that had much larger sample sizes available
over and above age and occupational status. In contrast, the and were able to make finer distinctions (e.g., Katikireddi et al.,
explanatory value of the work-related factors, including both 2017). Also, the reference category consisted of the non-selected
physical and psychosocial demands, was 22%. Several other domains, in which a variety of smaller domains was collapsed,
studies on work ability adjusted for health behaviors and although they generally consisted of professional occupations,
provide evidence that occupational factors impact health with concomitant greater survival times. With a larger sample
outcomes independently of health behavior (Lund and size, we might have been able to observe clearer survival
Csonka, 2003; Andersen et al., 2016; Schram et al., 2021). In differences between domains. Furthermore, as there are gender
Frontiers in Sociology | www.frontiersin.org 8 August 2021 | Volume 6 | Article 675618Deeg et al. Occupation-Based Life Expectancy differences in lifetime careers, even within a domain (Cambois As a final point, it must be acknowledged that working et al., 2017; Riekhoff and Järnefelt 2017; Amiri and Behnezhad, conditions within an occupational domain may vary 2020) and women tend to live longer than men, gender-specific substantially, which may result in substantial differences in life analyses would have been preferable, but were not possible due to expectancy. Translated to industrial sectors, thus, unfairness the relatively small sample size. However, as the survival measure within sectors may remain when applying sector-based LRPD is based on sex and age, gender differences in longevity pension rules. This may have implications for public were accounted for. acceptance of such rules, and may reduce predictability of A second issue is that our sample has a broad age range pension benefits and timing. (55–85 years). This implies that survival effects were examined of To apply research findings in practice, the uncertainty that working in occupational domains, the exposure to which may surrounds estimates and that is inherent in survey research have taken place decades earlier. Possibly, the effects of this should be minimized. As a further step, therefore, we exposure have weakened over the years. Regardless, we still recommend that the same research questions are addressed find substantial survival time differences between domains. using national data from countries that have long-standing The long-lasting effect of working conditions on health is population-wide registry data available. Using such data supported by studies of post-retirement health that showed would solve the sample size related limitations of our study. that the health effects of poor working conditions lasted as Due to somewhat different occupational distributions and long as 15 years post-retirement (Gueorguieva et al., 2009; de prevalence of part-time work, however, the effects of having Breij et al., 2019). a certain occupation on health and life expectancy might vary A third limitation is that we were not able to incorporate the across countries and time periods. Hence, the comparison fact that individuals do not remain in the same occupation would also act as a “robustness check” of the proposed throughout their full careers (Kreiner et al., 2018). However, mechanism, to see if its performance is dependent on we did include the job that the participants had held during the certain circumstances. For the current study, however, we longest time. Moreover, for participants currently working, their started with Dutch data with a long survival follow-up in longest-held job was used if their current job was not the same as order to provide a proof of principle. their longest-held job. Unfortunately, we did not have information on the duration of working in each occupational domain. In future research, using such information, work CONCLUSION histories may be constructed for those participants who changed domain during their working career. Then, “weights” In this study, we aimed to provide a proof of principle of a could be assigned to career years depending on domain. For mechanism to reach greater actuarial fairness by linking example, 1 year working in non-skilled general occupations could retirement ages to occupation-based life expectancies. We be counted as 1.1 years in pension build-up. showed that the non-skilled general, technical, and transport A fourth issue may be that we initially selected health domains have a shorter life expectancy than the professional measures that could be retrieved relatively easily from domains, amounting to 3.5 years for a man, and 3.1 years for registers available to pension funds. Although four of the a woman aged 65 years. Statutory retirement age could be five measures proved to be strongly associated with survival made to vary accordingly, by allowing a proportionally time, together they explained only 20%, a substantial yet greater pension build-up in the shorter-lived domains. relatively small portion of the association of occupational Also, we were able to show that health accounted for a domain and survival time. In a sensitivity analysis, more substantial portion of the association between direct health measures that have been shown to be strong occupational domain and longevity. Thus, health and consistent predictors of longevity (Suemoto et al., 2017), differences between domains today can be used as a including diseases and impairments, explained much greater means to tailor retirement ages to individuals’ risks of portions, with a maximum of 66% for non-skilled general longevity. This method provides a basis for pension occupations. Although these measures are less likely to be policies of greater actuarial fairness, by linking pension available in registers, they confirm that for the longevity of build-up and statutory retirement ages to occupation- non-skilled and skilled manual occupational domains, health based life expectancies, instead of holding on to a one- is a strong explanatory factor. size-fits-all statutory retirement age. Fifth, it may be argued that we included only a few covariates. Again, this choice was motivated by the likely availability of covariates in registers available to pension funds. We would like DATA AVAILABILITY STATEMENT to stress, meanwhile, that we were primarily interested in longevity differences between occupational domains per se, A publicly available dataset was analyzed in this study. This because of their applicability in practice. Thus, we did not dataset can be found here: https://lasa-vu.nl/en/request-data/. pursue a study of the unique predictive ability of domain for Data from the Longitudinal Aging Study Amsterdam are survival time given other individual and work-related available for use for specific research questions provided that characteristics. an agreement is made up. Frontiers in Sociology | www.frontiersin.org 9 August 2021 | Volume 6 | Article 675618
Deeg et al.                                                                                                                                       Occupation-Based Life Expectancy

ETHICS STATEMENT                                                                               FUNDING
The studies involving human participants were reviewed                                         The Longitudinal Aging Study Amsterdam is supported by a
and approved by the Medical Ethics Committee, VU                                               grant from the Netherlands Ministry of Health, Welfare and
University Medical Center, archive number 92/138. The                                          Sport, Directorate of Long-Term Care. This study was funded by
participants provided their informed consent to participate in                                 the Network for Studies on Pensions, Aging and Retirement,
this study.                                                                                    grant number CRG 2018.02.

AUTHOR CONTRIBUTIONS                                                                           SUPPLEMENTARY MATERIAL
Conceptualization, WT and DD; methodology, DD and SB;                                          The Supplementary Material for this article can be found online at:
writing - original draft preparation, DD and WT; writing -                                     https://www.frontiersin.org/articles/10.3389/fsoc.2021.675618/
revision and editing, DD, SB, and WT.                                                          full#supplementary-material

                                                                                                  Side Studies. J. Clin. Epidemiol. 55, 319–328. doi:10.1016/S0895-4356(01)
REFERENCES                                                                                        00475-9
                                                                                               Eibich, P. (2015). Understanding the Effect of Retirement on Health: Mechanisms
Alavinia, S. M., van Duivenbooden, C., and Burdorf, A. (2007). Influence of Work-                  and Heterogeneity. J. Health Econ. 43, 1–12. doi:10.1016/j.jhealeco.2015.05.001
   Related Factors and Individual Characteristics on Work Ability Among Dutch                  Finnish Centre for Pensions (2015). Years-of-service Pension: Rare Arrangement
   Construction Workers. Scand. J. Work Environ. Health 33 (5), 351–357.                          in Europe. Online available at: http://www.etk.fi/en/uutinen/years-of-service-
   doi:10.5271/sjweh.1151                                                                         pension-rare-arrangement-in-europe/. (retrieved 03 06, 2017).
Amiri, S., and Behnezhad, S. (2020). Job Strain and Mortality Ratio: a Systematic              Folstein, M. F., Folstein, S. E., and McHugh, P. R. (1975). Mini-Mental State: a
   Review and Meta-Analysis of Cohort Studies. Public Health 181, 24–33.                          Practical Method for the Clinician. J. Psychiatr. Res. 12, 190–198. doi:10.1016/
   doi:10.1016/j.puhe.2019.10.030                                                                 j.jhealeco.2015.05.001
Andersen, L. L., Fallentin, N., Thorsen, S. V., and Holtermann, A. (2016). Physical            Fox, A. J., and Adelstein, A. M. (1978). Occupational Mortality: Work or Way of
   Workload and Risk of Long-Term Sickness Absence in the General Working                         Life? J. Epidemiol. Community Health 32, 73–78. doi:10.1136/jech.32.2.73
   Population and Among Blue-Collar Workers: Prospective Cohort Study with                     Goldman, N., Glei, D. A., and Weinstein, M. (2016). What Matters Most for
   Register Follow-Up. Occup. Environ. Med. 73 (4), 246–253. doi:10.1136/oemed-                   Predicting Survival? A Multinational Population-Based Cohort Study. PloS
   2015-103314                                                                                    ONE 11 (7), e0159273. doi:10.1371/journal.pone.0159273
Barnay, T. (2007). Redistributive Impact of Differential Mortality in the French               Gueorguieva, R., Sindelar, J. L., Falba, T. A., Fletcher, J. M., Keenan, P., Wu, R., et al.
   Pay-As-You-Go System. Geneva Pap. Risk Insur Issues Pract. 32 (4), 570–582.                    (2009). The Impact of Occupation on Self-Rated Health: Cross-Sectional and
   doi:10.1057/palgrave.gpp.2510145                                                               Longitudinal Evidence from the Health and Retirement Survey. J. Gerontol. B
Brønnum-Hansen, H., Foverskov, E., and Andersen, I. (2020). Occupational                          Psychol. Sci. Soc. Sci. 64 (1), 118–124. doi:10.1093/geronb/gmb00610.1093/
   Inequality in Health Expectancy in Denmark. Scand. J. Public Health 48,                        geronb/gbn006
   338–345. doi:10.1177/1403494819882138                                                       Hazelzet, E., Picco, E., Houkes, I., Bosma, H., and de Rijk, A. (2019). Effectiveness
Cambois, E., Garrouste, C., and Pailhé, A. (2017). Gender Career divide and                       of Interventions to Promote Sustainable Employability: A Systematic Review.
   Women’s Disadvantage in Depressive Symptoms and Physical Limitations in                        Int. J. Environ. Res. Public Health 16, 1985. doi:10.3390/ijerph16111985
   France. SSM Popul. Health 3, 81–88. doi:10.1016/j.ssmph.2016.12.008                         Hoogendijk, E. O., Deeg, D. J. H., de Breij, S., Klokgieters, S. S., Kok, A. A. L.,
Cassidy, H. (2017). Task Variation within Occupations. Ind. Relat. 56 (3), 393–410.               Stringa, N., et al. (2020). The Longitudinal Aging Study Amsterdam: Cohort
   doi:10.1111/irel.12179                                                                         Update 2019 and Additional Data Collections. Eur. J. Epidemiol. 35 (1), 61–74.
de Breij, S., Qvist, J. Y., Holman, D., Mäcken, J., Seitsamo, J., Huisman, M., et al.             doi:10.1007/s10654-019-00541-2
   (2019). Educational Inequalities in Health after Work Exit: the Role of Work                Iacob, S., Hersant, B., Mezi, M. S., and Meningaud, J. P. (2016). Factors that May
   Characteristics. BMC Public Health 19 (1), 1515. doi:10.1186/s12889-019-                       Enhance Longevity: A Literature Review and a Comprehensive Update for
   7872-0                                                                                         Aesthetic Surgeons. Aesthet. Plast Surg. 40, 625–631. doi:10.1007/s00266-016-
De Preter, H., Mortelmans, D., and Van Looy, D. (2012). Retirement Timing in                      0648-3
   Europe: Does Sector Make a Difference? Ind. Relat. J. 43 (6), 511–526.                      Johnson, N. J., Sorlie, P. D., and Backlund, E. (1999). The Impact of Specific
   doi:10.1111/j.1468-2338.2012.00699.x                                                           Occupation on Mortality in the U.S. National Longitudinal Mortality Study.
De Tavernier, W. (2020). “Indexing the Retirement Age to Life Expectancy,” in Alte                Demography 36 (3), 355–367. doi:10.2307/2648058
   und neue sociale Ungleichheiten bei Berufsaugabe und Rentenübergang.                        Katikireddi, S. V., Leyland, A. H., McKee, M., Ralston, K., and Stuckler, D. (2017).
   Ergebnisse des EXTEND-Projektes [Old and new social inequalities in                            Patterns of Mortality by Occupation in the UK, 1991-2011: a Comparative
   working life and retirement. Results from the EXTEND-project]. Editors                         Analysis of Linked Census and Mortality Records. Lancet Public Health 2,
   G. Naegele and M. Hess (Wiesbaden: Springer VS), 133–138. doi:10.1007/                         e501–512. doi:10.1016/S2468-2667(17)30193-7
   978-3-658-31663-1_6                                                                         Kreiner, C. T., Nielsen, T. H., and Serena, B. L. (2018). Role of Income Mobility for
de Wind, A., Sewdas, R., Hoogendijk, E. O., van der Beek, A. J., Deeg, D. J. H., and              the Measurement of Inequality in Life Expectancy. Proc. Natl. Acad. Sci. U S A.
   Boot, C. R. L. (2020). Occupational Exposures Associated with Life Expectancy                  115 (46), 11754–11759. doi:10.1073/pnas.1811455115
   without and with Disability. Int. J. Environ. Res. Public Health 17 (17), E6377.            Kriegsman, D. M., Penninx, B. W., van Eijk, J. T., Boeke, A. J., and Deeg, D. J.
   doi:10.3390/ijerph17176377                                                                     (1996). Self-reports and General Practitioner Information on the Presence of
Deeg, D. J., van Oortmarssen, G. J., Habbema, J. D., and van der Maas, P. J.                      Chronic Diseases in Community Dwelling Elderly. A Study on the Accuracy of
   (1989). A Measure of Survival Time for Long-Term Follow-Up Studies of                          Patients’ Self-Reports and on Determinants of Inaccuracy. J. Clin. Epidemiol.
   the Elderly. J. Clin. Epidemiol. 42 (6), 541–549. doi:10.1016/0895-                            49, 1407–1417. doi:10.1016/S0895-4356(96)00274-0
   4356(89)90150-9                                                                             Kunst, A. E., and Mackenbach, J. P. (1994). The Size of Mortality Differences
Deeg, D. J., van Tilburg, T., Smit, J. H., and de Leeuw, E. D. (2002). Attrition in the           Associated with Educational Level in Nine Industrialized Countries. Am.
   Longitudinal Aging Study Amsterdam. The Effect of Differential Inclusion in                    J. Public Health 84, 932–937. doi:10.2105/AJPH.84.6.932

Frontiers in Sociology | www.frontiersin.org                                              10                                                August 2021 | Volume 6 | Article 675618
Deeg et al. Occupation-Based Life Expectancy
Landes, X. (2015). How Fair Is Actuarial Fairness?. J. Bus. Ethics 128 (3), 519–533. Schram, J. L., Oude Groeniger, J., Schuring, M., Proper, K. I., van Oostrom, S. H.,
doi:10.1007/s10551-014-2120-0 Robroek, S. J., et al. (2021). Working Conditions and Health Behavior as Causes
Lee, H.-E., Kim, H.-R., Chung, Y. K., Kang, S.-K., and Kim, E.-A. (2016). Mortality of Educational Inequalities in Self-Rated Health: an Inverse Odds Weighting
Rates by Occupation in Korea: A Nationwide, 13-year Follow-up Study. Occup. Approach. Scand. J. Work Environ. Health 47 (2), 127–135. doi:10.5271/
Environ. Med. 73, 329–335. sjweh.3918
Leinonen, T., Viikari-Juntura, E., Husgafvel-Pursiainen, K., and Solovieva, S. Simonovits, A. (2015). Benefit-Retirement Age Schedules and Redistribution in
(2018). Cause-specific Sickness Absence Trends by Occupational Class and Public Pension Systems. Czech J. Econ. Finance 65 (5), 362–376.
Industrial Sector in the Context of Recent Labour Market Changes: a Söderbacka, T., Nyholm, L., and Fagerström, L. (2020). Workplace Interventions
Finnish Panel Data Study. BMJ Open 8, e019822. doi:10.1136/bmjopen- that Support Older Employees’ Health and Work Ability - a Scoping Review.
2017-019822 BMC Health Serv. Res. 20, 472. doi:10.1186/s12913-020-05323-1
Llena-Nozal, A., Lindeboom, M., and Portrait, F. (2004). The Effect of Work on Statistics Netherlands (2001). Standaard Beroepenclassificatie 1992 [Netherlands
Mental Health: Does Occupation Matter?. Health Econ. 13, 1045–1062. Standard Classification of Occupations 1992]. Edition 2001. Heerlen,
doi:10.1002/hec.929 Netherlands: Statistics Netherlands. [In Dutch].
Lund, T., and Csonka, A. (2003). Risk Factors in Health, Work Environment, Statistics Netherlands. (2021). Standaard Bedrijfsindeling 2008; Toelichting
Smoking Status, and Organizational Context for Work Disability. Am. J. Ind. [Standard Classification of Industries 2008; Explanation]. [In Dutch].
Med. 44, 492–501. doi:10.1002/ajim.10298 Available at: https://opendata.cbs.nl/statline#/CBS/nl/dataset/83583NED/
Mikkola, T. M., von Bonsdorff, M. B., Salonen, M. K., Kautiainen, H., Ala-Mursula, table?ts1625662947369. (Accessed July 7, 2021).
L., Solovieva, S., et al. (2019). Physical Heaviness of Work and Sitting at Work as Suemoto, C. K., Ueda, P., Beltrán-Sánchez, H., Lebrão, M. L., Duarte, Y. A., Wong,
Predictors of Mortality: A 26-Year Follow-Up of the Helsinki Birth Cohort R., et al. (2017). Development and Validation of a 10-year Mortality Prediction
Study. BMJ Open 9, e026280. doi:10.1136/bmjopen-2018-026280 Model: Meta-Analysis of Individual Participant Data from Five Cohorts of
Mood, C. (2010). Logistic Regression: Why We Cannot Do what We Think We Older Adults in Developed and Developing Countries. J. Gerontol. A. Biol. Sci.
Can Do, and what We Can Do about it. Eur. Sociol. Rev. 26 (1), 67–82. Med. Sci. 72 (3), 410–416. doi:10.1093/gerona/glw166
doi:10.1093/esr/jcp006 Tanaka, H., Nusselder, W. J., Bopp, M., Brønnum-Hansen, H., Kalediene, R., Lee,
Moore, D. E., and Hayward, M. D. (1990). Occupational Careers and Mortality of J. S., et al. (2019). Mortality Inequalities by Occupational Class Among Men in
Elderly Men. Demography 27 (1), 31–53. doi:10.2307/2061551 Japan, South Korea and Eight European Countries: a National Register-Based
Myles, J. (2003). What justice Requires: Pension Reform in Ageing Societies. J. Eur. Study, 1990-2015. J. Epidemiol. Community Health 73, 750–758. doi:10.1136/
Soc. Pol. 13 (3), 264–269. doi:10.1177/09589287030133004 jech-2018-211715
Natali, D., Spasova, S., and Vanhercke, B. (2016). Retirement Regimes for Workers Tjepkema, M., Wilkins, R., and Long, A. (2013). Cause-specific Mortality by
in Arduous or Hazardous Jobs in Europe: A Study of National Policies. Brussels: Occupational Skill Level in Canada: a 16-year Follow-Up Study. Chronic Dis.
European Commission. Inj. Can. 33 (4), 195–203. doi:10.24095/hpcdp.33.4.01
Östergren, O., Lundberg, O., Artnik, B., Bopp, M., Borrell, C., Kalediene, R., et al. Unger, R., and Schulze, A. (2013). Can We Really (All) Work Longer? Trends in
(2017). Educational Expansion and Inequalities in Mortality—A Fixed-Effects Healthy Life Expectancy According to Social Stratum in Germany.
Analysis Using Longitudinal Data from 18 European Populations. PLoS ONE Comparative Pop. Stud. – Z. Bevölkerungswissenschaft 38 (3), 562–582.
12 (8), e0182526. doi:10.1371/journal.pone.0182526 doi:10.4232/10.CPoS-2013-03en10.12765/cpos-2013-03
Queisser, M., and Whitehouse, E. R. (2006). Neutral or Fair? Actuarial Concepts Van Oyen, H., Van der Heyden, J., Perenboom, R., and Jagger, C. (2006).
and Pension-System Design. OECD Social, Employment and Migration Monitoring Population Disability: Evaluation of a New Global Activity
Working Papers. No. 40. (Paris: OECD Publishing). doi:10.1787/1815199X Limitation Indicator (GALI). Soz. Praventivmed. 51, 153–161. doi:10.1007/
Ravesteijn, B., Kippersluis, H. V., and Doorslaer, E. V. (2018). The Wear and Tear s00038-006-0035-y
on Health: What Is the Role of Occupation? Health Econ. 27 (2), e69–e86. Wiß, T. (2015). From Welfare States to Welfare Sectors: Explaining Sectoral
doi:10.1002/hec.3563 Differences in Occupational Pensions with Economic and Political Power of
Riekhoff, A.-J., and Järnefelt, N. (2017). Gender Differences in Retirement in a Employees. J. Eur. Soc. Pol. 25 (5), 489–504. doi:10.1177/0958928715611006
Welfare State with High Female Labour Market Participation and Competing
Exit Pathways. Eur. Sociol. Rev. 33 (6), 791–807. doi:10.1093/esr/jcx077 Conflict of Interest: The authors declare that the research was conducted in the
Rijs, K. J., van der Pas, S., Geuskens, G. A., Cozijnsen, R., Koppes, L. L., van der absence of any commercial or financial relationships that could be construed as a
Beek, A. J., et al. (2014). Development and Validation of a Physical and potential conflict of interest.
Psychosocial Job-Exposure Matrix in Older and Retired Workers. Ann.
Occup. Hyg. 58 (2), 152–170. doi:10.1093/annhyg/met052 Publisher’s Note: All claims expressed in this article are solely those of the authors
Romeu, G. L., and Skirbekk, V. (2013). Skill Demand and the Comparative and do not necessarily represent those of their affiliated organizations, or those of
Advantage of Age: Jobs Tasks and Earnings from the 1980s to the 2000s in the publisher, the editors and the reviewers. Any product that may be evaluated in
Germany. Labour Econ. 22, 61–69. doi:10.1016/j.labeco.2012.09.003 this article, or claim that may be made by its manufacturer, is not guaranteed or
Rutherford, M. J., Dickman, P. W., and Lambert, P. C. (2012). Comparison of endorsed by the publisher.
Methods for Calculating Relative Survival in Population-Based Studies. Cancer
Epidemiol. 36, 16–21. doi:10.1016/j.canep.2011.05.010 Copyright © 2021 Deeg, De Tavernier and de Breij. This is an open-access article
Scharn, M., van der Beek, A. J., Suanet, B., Huisman, M., and Boot, C. R. L. (2019). distributed under the terms of the Creative Commons Attribution License (CC BY).
Societal Participation of Individuals Aged 55-64 Years with and without The use, distribution or reproduction in other forums is permitted, provided the
Chronic Disease. Eur. J. Public Health 29 (1), 93–98. doi:10.1093/eurpub/ original author(s) and the copyright owner(s) are credited and that the original
cky122 publication in this journal is cited, in accordance with accepted academic practice.
Schokkaert, E., and Van Parijs, P. (2003). Debate on Social justice and Pension No use, distribution or reproduction is permitted which does not comply with
Reform. J. Eur. Soc. Pol. 13 (3), 245–263. doi:10.1177/09589287030133003 these terms.
Frontiers in Sociology | www.frontiersin.org 11 August 2021 | Volume 6 | Article 675618You can also read