Goldilocks conditions required for earthquakes to trigger basaltic eruptions: Evidence from the 2015 Ambrym eruption - Science Journals ...
←
→
Page content transcription
If your browser does not render page correctly, please read the page content below
SCIENCE ADVANCES | RESEARCH ARTICLE
GEOLOGY Copyright © 2020
The Authors, some
Goldilocks conditions required for earthquakes rights reserved;
exclusive licensee
to trigger basaltic eruptions: Evidence from the American Association
for the Advancement
2015 Ambrym eruption of Science. No claim to
original U.S. Government
Works. Distributed
I. J. Hamling1* and G. Kilgour2 under a Creative
Commons Attribution
Observations indicate a strong correlation between the occurrence of volcanic eruptions and earthquakes. While NonCommercial
increased volcanic activity has been observed following both local and distal earthquakes, some of the largest License 4.0 (CC BY-NC).
recorded earthquakes aren’t known to have triggered an eruption. Here we investigate whether an eruption and
associated dike intrusion at Ambrym volcano was triggered by an Mw 6.4 earthquake which occurred 30 hours
earlier. Modeling suggests that stress changes induced by the earthquake were too small to account for the over-
pressure in the dike without additional bubble growth to pressurize the magma chamber. We find that the magma
must be both H2O-saturated and at lower temperatures than those expected for newly intruded basalts. Too hot
and the stress drop required to grow the bubbles is too large, too cold and the magma can no longer flow. These
observations suggest that partially cooled and crystallized basaltic magmas are more susceptible to triggering
Downloaded from http://advances.sciencemag.org/ on January 17, 2021
from earthquakes.
INTRODUCTION cones, which host episodic lava lakes, continuously degas and are
While the probability of an eruption being triggered by an earthquake cut by multiple past dike and sill intrusions (17). Observations of
is considered low (1), increased numbers of eruptions and unrest gas fluxes (18) and seismic data (19) indicate a reservoir located at
episodes following large magnitude earthquakes support short-term ∼3- to 4-km depth in the vicinity of Marum and Benbow. The latest
triggering at both near-field (tens of kilometers) and far-field (hundreds eruption of Ambrym occurred in late 2018 when a large dike, ~0.7 km3,
of kilometers) distances (1–6). Although the mechanism that ulti- was emplaced along the east rift zone and was accompanied by ~3 m
mately triggers an eruption continues to be debated, perturbations of subsidence within the caldera (20). Modeling of the deformation
to the stress field are thought to be a primary cause. At long distances, suggested multiple sources from within the caldera fed the intrusion
dynamic stress changes due to the passage of seismic waves may at depths of 2 to 5 km (20).
induce the nucleation and growth of bubbles within the magma Before 2018, the last eruption of Ambrym occurred on 20 February 2015
chamber (1, 4) and cause liquefaction of the crystalline mush (7) or (local date, 21 February). Although it was only classed as a minor
the collapse of magmatic bubbles and foams because of the oscillatory eruption, it led to the creation of a new vent within the main caldera
motion within the reservoir (8). Although they decay more rapidly floor, which was reactivated in 2018 (20), and caused the first lava
with distance, static stress changes are permanent, explaining the flow in over a decade. Around 30 hours before the eruption, an Mw
time delay in triggering some eruptions (9, 10). Static stressing in- 6.4 earthquake occurred at a shallow depth of ∼10 km south of the
volves the volumetric expansion of magma chambers (11), promoting volcano. Moment tensors (Fig. 1) suggest a shallow thrust event lo-
the growth of bubbles, the squeezing of magma stored within shallow cated on a fault striking ∼N-S, consistent with the geometry of the
chambers causing its upward migration and eruption (4), and back-arc thrust belt (Fig. 1).
can also control the location of intrusions (11, 12). While numerous
mechanisms have been suggested, for typical stress changes induced
by earthquakes, it is thought that the overpressure within the magma RESULTS
body must be close to critical for an eruption to initiate (1). Here, InSAR data and deformation modeling
we investigate the possible triggering of a dike intrusion by a local Using ascending ALOS-2 synthetic aperture radar (SAR) data
moment magnitude (Mw) 6.4 earthquake, which occurred at Ambrym acquired on 24 January and 4 March, we form an interferogram
Volcano, Vanuatu, Southwest Pacific, in 2015. (see Materials and Methods and Fig. 2) spanning the eruption on
Ambyrm lies within the Vanuatu volcanic archipelago, an intra- 21 February. Deformation is concentrated along a northwest-southeast
oceanic volcanic arc associated with the eastward subduction of the trending zone running from the main vents down the southern flank.
Indo-Australian plate beneath the Pacific plate (Fig. 1) (13, 14). The The asymmetric deformation pattern, consistent with the intrusion
island is a 35 km × 50 km wide, predominantly basaltic, shield vol- of a dike, shows line-of-sight (LOS) displacements of up to 1.5-m
cano. A 12-km-wide caldera, located at its summit (Fig. 1), devel- south of the main active vents extending along an ~4- to 5-km-long
oped ∼2 ka ago (15) during major collapses and explosive events region (Fig. 2). An area of incoherence in the interferometric
(16, 17) and is now the locus of current activity (18). Over the last SAR (InSAR) data along the center of the dike is associated with
century, eruptive activity has been focused around two large cones, new lava flows (fig S1). Peak displacements are observed ~2 km
Marum and Benbow, located within the caldera (Fig. 1) (16). The south of Marum and 3 km east of Benbow, in the vicinity of the new
eruption site. Although the dike rotates toward the rim of the
1
GNS Science, Lower Hutt, New Zealand. 2GNS Science, Wairakei, New Zealand. western vent (Benbow), there is no clear evidence of deflation at
*Corresponding author. Email: i.hamling@gns.cri.nz either vent site.
Hamling and Kilgour, Sci. Adv. 2020; 6 : eaaz5261 3 April 2020 1 of 9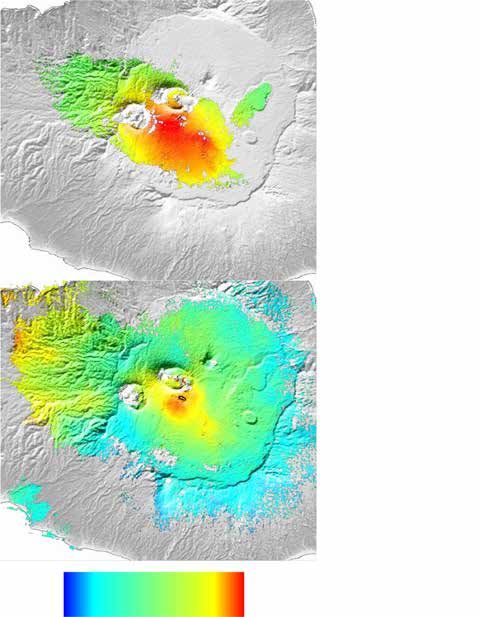
SCIENCE ADVANCES | RESEARCH ARTICLE

                                                                                                              165°                      170°
                                                                                                                                     −13°
                          −16°06′                                                                                                   BATB
                                                                                                                  DER

                                                                                                                                   Ambrym
                                                                                                                          AUS
                                                                                                                                      PAC
                                                                                                                  85 mm/yr

                          −16°12′
                                                                                                                  −20°

                                                                                             Marum

                                                                                              Niri Taten
                                                            West rift zone
                                                                                    Benbow

                                                                                                                                                                           Downloaded from http://advances.sciencemag.org/ on January 17, 2021
                          −16°18′

                                                                                                                  East rift zone

                                                     Mw 6.4
                                                     19/02/2015
                                                                                                                      10 km
                          −16°24′
                               167°54′                    168°00′                 168°06′                  168°12′                  168°18′
Fig. 1. Shaded relief map of Ambrym Island and its tectonic setting. In the main figure, the orange polygons and associated black lines indicate the location of the
east and west rift zones. The black line shows the location of the caldera rim, and recently active vents Marum, Benbow, and Niri Taten are shown in red. The yellow dot
shows the location of the 19 February 2015 Mw 6.4 earthquake and moment tensor. The map in the top right shows the tectonic setting of Vanuatu and Ambrym (red).
The heavy black line shows the location of the plate boundary between the Pacific (PAC) and Australian (AUS) plates. The dashed line shows the location of the Back-arc
Thrust Belt (BATB), the light gray polygon shows the location of the incoming D’Entrecasteaux Ridge System (DER), and the arrow shows the plate convergence rate (55).

    To model the dike, we first used a Bayesian inversion [Geodetic                  figs. S3 and S4). Two years after the intrusion, both the ascending
Bayesian Inversion Software (GBIS) (21); see Materials and Methods                   and descending data indicate a broad region of subsidence of up
and fig. S2] to invert for the position, dip, strike, depth extent,                  ~10 cm/year over a ~30-km2 area. Two areas of localized subsidence
and opening of the dike based on the formulations of Okada (22)                      of up to 20 cm are observed in the first 3 months after the intrusion.
(see Materials and Methods). After fixing the geometry, we discretized               The locations are associated with new lava flows near Niri Taten
the dike into ~1 km–by–1 km patches and solved for the best-fitting                  (fig. S4) and an area of 2 km to the southeast (fig. S4) and is likely
distributed opening. The model indicates that the dike had a maximum                 the result of their cooling and contraction (23). Using the post-eruption
opening of 3.5 m extending from the surface to ~3.5-km depth                         InSAR data, we estimated the best-fitting displacement rate (see
(Fig. 2 and fig. S2). Less opening is predicted at the northern end of               Materials and Methods) and used the same Bayesian inversion to
the intrusion where a maximum of 2 m of opening is predicted be-                     solve for the best-fitting source based on a horizontal dislocation to
tween 1- and 2.5-km depth. In addition to the dike, a small offset in                represent a contracting sill (Fig. 3). The best-fit model suggests a
the phase data extending south from Benbow crater is consistent                      source at ~3.1-km depth consistent with independent estimates from
with shallow slip of 0.5 m on a normal fault. The model explains                     gas chemistry and seismic observations of the magma storage area
96% of the data variance and predicts a total intruded volume of                     (18, 19). The model suggests up to 0.5 m/year of contraction cen-
0.045 km3 and, assuming an average 1-m-thick lava flow with an area                  tered in the region of maximum dike opening, south of Benbow
of 1.27 km2 based on the amplitude imagery (fig. S1), an additional                  (Fig. 3), with lesser amounts of contraction following the trend of
0.0013 km3 extruded on the surface.                                                  the dike intrusion above. The observed post-intrusion subsidence
    The region of maximum opening along the dike is offset by                        may be related to continued drainage of magma into the dike or
~2 km from Marum and Benbow vents, and neither shows evidence                        cooling and contraction of the residual material left in the sill after
of shallow deflation, suggesting that the magma was fed from below.                  feeding the dike. Alternative mechanisms, such as viscoelastic relax-
However, unlike the 2018 eruption, which showed widespread sub-                      ation or magma degassing, could also play a role (24). Regardless of
sidence from across the caldera and at both cones (20), we do not                    the cause, the coincidence between the location of the inferred sill
see any indication of deeper deflation feeding the intrusion. To look                and base of the modeled dike supports the conclusion that the dike was
for the potential source for the dike, we use postdyking deformation                 fed from the same shallow reservoir. Because of the large deformation
derived from ascending Sentinel-1 and descending ALOS-2 data ac-                     associated with the shallow dike, it is likely that the shallow intrusion
quired since early 2015 (see Materials and Methods, Fig. 3, and                      masks the deflation of the deeper magma body. Discrepancies between

Hamling and Kilgour, Sci. Adv. 2020; 6 : eaaz5261   3 April 2020                                                                                                  2 of 9
SCIENCE ADVANCES | RESEARCH ARTICLE

                            A                               Data                               Model                             Residual

                                                                                                       Eruption site                      3.5

                                                                                                                                                Opening/slip (m)
                              0      5    10                                 Marum     Niri Taten
                            LOS displacement (cm)

                            B
                                                      0               Benbow
                              Depth (km)

                                                                                                                                          0

                                                                                                                                                                                                   Downloaded from http://advances.sciencemag.org/ on January 17, 2021
                                                      1

                                                      2                                                                                                                   15
                                                                                                                                                                   13
                                                      3
                                                                                                                                               11                   )
                                                                                                                                                                   m
                                                      0                                                                             9                    (k
                                                                −2                                                                               g
                                                                               −4                               North
                                                                                                                             7             stin
                                                                                          −6                                            Ea
                                                                               Northing                 −8
                                                                                        (km)                      −10 5
                            C
                                Average opening (m)

                                                      3 North                                                                                  South

                                                      2

                                                                                                                                                                          Elevation (m)
                                                                                                                                                                    950
                                                      1                                                                                                             850
                                                                                                                                                                    750
                                                      0                                                                                                             650
                                                       0                2               4                 6                 8                                      10
                                                                                               Distance (km)

Fig. 2. ALOS-2 interferogram showing the deformation associated with the dike intrusion on 21 February 2015. (A) Observed, modeled, and residual. The black
lines shows the surface trace of the intrusion, heavy red lines are the location of the main vents (Marum, Benbow, and Niri Taten), and the pink line shows the outline of
the lava flow based on the change in radar coherence. (B) Best-fitting distributed opening model for the intrusion. The heavy black lines indicate the locations of the main
vent sites. (C) Depth-averaged opening along the length of the dike from north to south.

the volume leaving a magma chamber and entering a dike are com-                                     gfz-potsdam.de; Fig. 4) and the U.S. Geological Survey (USGS;
monly observed (25–27). Dike volumes can be more than three times                                   fig. S5). The earthquake is modeled as a rectangular dislocation in
the volume predicted from the deflating source (27). In this case, the                              an elastic half space (22) with uniform slip. The fault’s dimensions
contraction of a sill at 3-km depth by 0.015 km3 (a third of the volume                             (13.8 km) are assumed to be equal and are determined using a global
intruded into the dike) gives a maximum LOS increase of ~20 to                                      magnitude-scaling relationship (28). Assuming a shear modulus of
30 cm, only 10 to 15% of the observed LOS decrease caused by the                                    30 GPa, the slip (~70 cm) is then fixed to conserve magnitude. We
dike. Because of the difference in sign (LOS increase versus decrease),                             test both nodal planes (Fig. 4 and figs. S6 and S7), but based on the
any subsidence from the deeper source will lead to an underestimate                                 tectonic setting (14) and location of the Back arc thrust belt (Fig. 1),
in our inferred dike volume.                                                                        the westward dipping nodal plane seems more likely. To account for
                                                                                                    the uncertainty in hypocenter locations, we systematically move the
Stress interactions                                                                                 location and depth of the hypocenter and assess the stress change at
Thirty hours before the eruption, there was an Mw 6.4 earthquake                                    for each position (Fig. 4 and fig. S5). Considering a horizontal and
~15 to 20 km south of the eruption site at ~10-km depth. To investi-                                vertical location error of ±5 and ± 4 km, respectively, the stress
gate the effect of the earthquake on the shallow magmatic system,                                   models suggest that there was likely an overall drop in the pressure
we calculate the normal stress change along the modeled sill based                                  (increase in normal stress) within the source region rather than a
on the moment tensor estimates from GEOFON (http://geofon.                                          pressure increase with a maximum absolute change in normal stress

Hamling and Kilgour, Sci. Adv. 2020; 6 : eaaz5261                    3 April 2020                                                                                                         3 of 9
SCIENCE ADVANCES | RESEARCH ARTICLE
A Ascending C 2500 m, and a maximum opening of 3.5 m, the final overpressure for
2
the intrusion was ~4 to 11 MPa. To achieve such an overpressure,
Sentinel-1
the excess pressure in a magma chamber is given by (31, 33)
0
0.5 Pe = P 0 − ( r − m)gh − d (2)
Contraction (m/yr)
−2
Northings (km) where Pe is the excess pressure in the magma chamber, r is the
B Descending
−4
density of the host-rock, m is the density of the magma, g is the
ALOS-2
acceleration due to gravity, h is the depth extent of the dike, and d
−6 0
is the differential stress, which is approximately equal to the tensile
strength at the surface (34). For a reasonable range of magma
−8
densities (2650 to 2750 kg/m3), a rock density of 2800 kg/m3, d as
1.25 MPa (34), and 3.0 km for the depth extent of the intrusion, the
−10
excess pressure in the underlying chamber would need to be in ex-
−10 0 10 6 8 10 12 14 16 cess of ~2 MPa to achieve the required overpressure (Fig. 4).
LOS displacement (cm/yr) Eastings (km)
For an eruption to initiate, the excess pressure in the magma
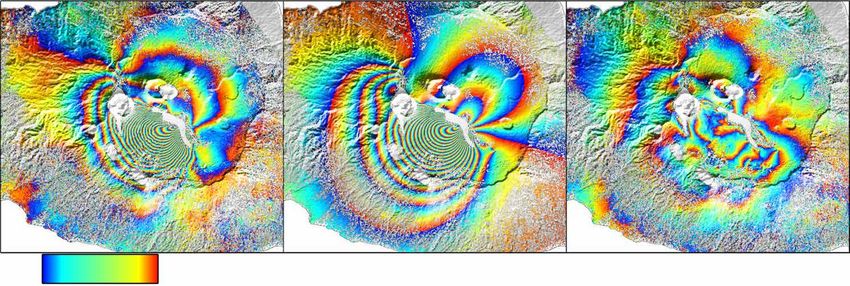
Fig. 3. Deformation between 2015 and 2017 captured by ascending and chamber must be sufficient to rupture the chamber walls. In many
descending InSAR data. (A) Observed ascending displacement rate derived from
cases, this excess pressure is caused by the injection of new material
Downloaded from http://advances.sciencemag.org/ on January 17, 2021
Sentinel-1 data (see Materials and Methods). (B) Observed descending displacement
into the magmatic system with deformation and seismic unrest com-
rate derived from ALOS-2 data. Warm colors indicate motion away from the satellite.
The heavy black line shows the outline of the best-fit sill model, and the thin black
monly observed before eruptions (35). Alternatively, external triggers
lines show the location of the lava flow and main vents. (C) Best-fitting distributed such as local or regional earthquakes (1–6) can generate sufficient
sill model explaining the postdiking deformation. Contraction at the edge of the overpressures to generate an eruption. Unlike the eruption of
model is a result of the inversion fitting noise outside of the subsiding region. The Ambrym in late 2018, where there was a large increase in seismicity
blue dashed line shows the surface trace of the dike intrusion, and the black lines in the buildup to the eruption (20), there was no precursory unrest
are the same as in (A) and (B). before the eruption in 2015 leading the Vanuatu Geohazards Ob-
servatory to downgrade the activity level of the volcano. An inter-
of between 0.03 and 1 MPa (Fig. 4 and fig. S6). Both the USGS and ferogram from November 2014 and January 2015 also indicates that
GEOFON solutions predict similar stress changes (fig. S5), whereas there was no deformation across the caldera floor (fig. S4). Unfortu-
using the eastward dipping nodal plane produces a small reduction nately, due to the available SAR acquisitions, we are unable to resolve
in the normal stress of ~0.01 MPa. whether there was any magma buildup in the month immediately
In addition to static stress changes, the passage of seismic waves preceding the eruption, but the lack of any precursory unrest and
can also generate significant nonpermanent stress changes within the effusive nature of the eruption do not support a rapid influx of
volcanic systems (1, 4). Dynamic stress changes decay less rapidly material into the system. However, if magma were accumulating at
than static stresses (1) and can therefore exceed the static stress change depth, or at low rates over a longer period of time, then it is unlikely
at larger distances. Dynamic stresses can be directly inferred from that we would be able to detect it with the available data. Although
the peak ground velocities (PGVs) and are equal to (PGV/Vs), where petrological data from past eruptions (18) suggest that magma equili-
Vs and are the shear wave velocity and shear modulus, respectively brates at shallow depths before eruption, it is possible that an intru-
(29, 30). As there were no PGV observations associated with the sion of magma deep in system led to the eruption and earthquake
earthquake, we use the PGV predicted by the USGS ShakeMap to south of the island. The stress change resulting from the deep accu-
calculate the magnitude of the dynamic stress change (30). The pre- mulation of magma has been shown to trigger nearby moderately
dicted PGVs in the region of the caldera are 0.09 to 0.15 m/s, and sized earthquakes (36). To test whether the deep accumulation of
assuming a shear modulus of 30 GPa and a shear wave velocity of magma could have triggered the Mw 6.4 event, which preceded the
~3000 m/s, the peak dynamic stress change would then be ~0.9 to eruption, we calculate the Coulomb failure stress (CFS) along the
1.5 MPa (Fig. 4), consistent with estimates from similarly sized inferred fault plane caused by the inflation of a 5 km–by–5 km sill
earthquakes at similar distances (30). and dike by 0.1 km3 at different locations and depths (fig. S8). In
both cases, the general pattern is for the a reduction in the CFS re-
gardless of the emplacement across the region. For the sill, the only
DISCUSSION instances where we see an overall positive stress change is when the
For a dike to breakout from a magma body, the excess pressure must intrusion either intersects or is extremely close to the fault, which
be large enough to overcome the tensile strength of the host rock (31). places any inflation source well away from the main volcanic center.
Once the dike has been injected, the maximum opening, b, along an Similarly, for a dike source, an increase in CFS is only predicted when
elastic mode I crack as a result of internal fluid overpressure, P0, is the intrusion is located adjacent to the fault either at a depth of
given by (32) ~20 km on the hanging wall side or at depths of 2 to 5 km on the
footwall side (fig. S8). While we cannot rule out this deeper influx of
2 P 0(1 − 2)L material from the available observations, based on these analyses, it
b =
─ (1)
E seems unlikely that an intrusion at depth was responsible for trig-
where , E, and L are the Poisson’s ratio, Young’s modulus, and gering of the nearby earthquake.
half-length of the dike, respectively. Assuming a Young’s modulus If we assume no additional magma intruded deep into the system,
in the range of 10 to 30 GPa, a Poisson’s ratio of 0.25, a half-length of then there needs to be an alternate mechanism to generate the excess
Hamling and Kilgour, Sci. Adv. 2020; 6 : eaaz5261 3 April 2020 4 of 9SCIENCE ADVANCES | RESEARCH ARTICLE
Density contrast r r − rm (kg/m 3 )
400 300 200 100 0
A Maximum Ds norm B Dynamic Ds C
10
Excess magma pressure (MPa)
1.3
8 14
Dike overpressure (MPa)
1.5 12
6 10
1.7
8
0.25 1.75 6
4
4
Ds (MPa)
norm
Ds (MPa)
dyn 2 2
0
−0.25 −1.75 0
2400 2500 2600 2700 2800
Magma density (kg/m 3 )
D 55 E 3.5 35
2.5 wt % H2O = solid lines 925°C
50 1.5 wt % H2O = dashed lines 950°C
Downloaded from http://advances.sciencemag.org/ on January 17, 2021
3.0 30
975°C
Inferred total volume km3
45 1000°C
25
Volume increase (%)
2.5 1025°C
Crystal fraction (%)
40
2.0 20
Lock-up
35
1.5 15
30
1.50 wt % H2O
1.0 10
25 1.75 wt % H2O
2.00 wt % H2O 5
20 0.5
2.25 wt % H2O
Eruptible zone
2.50 wt % H2O
15 0 0
920 940 960 980 1000 1020 1040 1060 90 92 94 96 98 100
Temperature (°C) Pressure (MPa)
Fig. 4. Stress changes associated with the Mw 6.4 earthquake and the effects on bubble growth. (A) Maximum change in normal stress changes computed across
the sill for different hypocenter locations at 11-km depth (others depths and moment tensors are shown in figs. S5 to S7). Each pixel shows the maximum stress change
on the sill if the hypocenter was at that at that location. The moment tensor shows the actual location based on the solution from GEOFON and 5-km horizontal uncer-
tainty. (B) Dynamic stress change derived from the USGS ShakeMap peak ground velocity (PGV) values. Contours are at 0.1-MPa intervals. (C) Plot showing the predicted
overpressures in the dike based on Eq. 2 for a range of densities and excess magma pressures. The black dashed box shows the range of reasonable densities/density
contrasts for a basaltic melt. (D) Crystal volume fraction plotted against temperature for an Ambrym magma composition with different bulk H2O contents. The area
between the dashed lines indicates the range of crystal fraction where lock up begins to occur, and the brown box shows the range of temperatures over which the
magma remains mobile enough to erupt. (E) Expected volume increase with decreasing pressure for the 2.5 and 1.5 wt % H2O magmas. The colored lines show the effect
of different temperature melts. The solid black line shows the inferred total source volume for each pressure drop. Note that for 1.5 wt % H2O, the 950° and 975°C lines
plot on top of one another.
pressure to drive the eruption. One possibility is the Mw 6.4 earth- and melt inclusion pressure estimates (18), we start the decompression
quake, which occurred 30 hours before the dike intrusion. However, models at 100 MPa using a range of initial magma temperatures
on the basis of our stress analysis, the magnitude of the expected from 925° to 1025°C with varying water content (see Materials and
stress changes, either static or dynamic, is too small to generate the Methods and Fig. 4). For higher-temperature magmas, (≥1025°C)
inferred excess pressure needed to drive the eruption. Numerical with 2.5 weight % (wt %) water, gas exsolution does not initiate until
simulations of pressure recovery within a magma body show that the pressure has dropped by 5 MPa (Fig. 4). For the same magma
the growth of small bubbles following a pressure drop can cause an with relatively low water contents, the initial pressure drop required
overpressurization of the magma by an order of magnitude (37). To for bubble growth is even larger. At 975°C and 1.5 wt % water, the
explore the possible magmatic conditions for this eruption, we use pressure drop needs to be more than 10 MPa before bubbles would
MELTS (38, 39) to model the effect of isothermal decompression of begin to form. However, if the magma is cooler and H2O saturated,
an Ambrym basalt (18) and examine the bulk volume change due to then small pressure drops (less than 1 MPa) are sufficient to promote
gas exsolution of the magma caused by a decrease in pressure (see bubble growth, causing an increase in the magma volume and pres-
Materials and Methods). On the basis of the estimated source depth surization of the chamber.
Hamling and Kilgour, Sci. Adv. 2020; 6 : eaaz5261 3 April 2020 5 of 9SCIENCE ADVANCES | RESEARCH ARTICLE
50
t=4
t=6
40
t=8
Time of eruption after earthquake
30
Volume (Mm3 )
−t/t
V(t) = V (1-e )
8
20
10
Downloaded from http://advances.sciencemag.org/ on January 17, 2021
00 5 10 15 20 25 30 35 40 45 50
Time (hours)
Fig. 5. Dike volume evolution with time based on Rivalta et al. (45). Each colored line is for a different value of that controls the evolution time scale. The dashed line
shows the time of the eruption after the earthquake, suggesting that after ~30 hours, the dike would have reached its full volume.
As a magma cools, it crystallizes and its ability to flow is reduced 10 hours (45). Assuming the same evolution of volume at Ambrym
(40, 41). Furthermore, the viscosity of magma containing more than and decay times of 4 to 7 hours, it would take 20 to 30 hours for the
~30 to 40% crystals (particularly tabular feldspars, which are common dike to approach its final volume of 0.045 km3 as it intruded toward the
at Ambrym) will rise significantly to a point of mechanical lock up, surface (Fig. 5). This would allow up to 10 hours for bubbles to form
which reduces its potential to erupt (42). For magmas with 2 to and grow within the magma, consistent with both models of bubble
2.5 wt % H2O, this places a lower-bound temperature needed for growth in magmas, which suggest time scales of seconds to hours (46),
mobility of around 970°C, while for those with closer to 1.5 wt % and with the observed time lag between the earthquake and eruption.
H2O, the temperature is closer to 1030°C. However, to get bubbles
to grow in a magma at this temperature would require a ~40-MPa
drop in pressure (see Materials and Methods and tables S1 to S5). CONCLUSIONS
Because of the competing requirements for H2O saturation at low Using evidence from the 2015 eruption at Ambrym, we have pro-
temperature and the rheological constraint, our results indicate that vided a possible mechanism for triggering of eruptions from small
there is a very narrow temperature (~50°C) window where magma stress perturbations. While our analysis is focused on an Ambrym
remains liquid enough to flow and where small pressure drops lead type magma, these results suggest that fresh magmas intruded into
to sufficient bubble formation to pressurize the magma chamber shallow magmatic systems may be too hot to generate significant
(Fig. 4). Furthermore, H2O-saturated magmas can undergo larger bubble growth with low pressure drops. Because partially cooled and
reductions in temperature before locking up, enabling additional crystallized magmas will promote bubble growth and subsequent
bubble growth for small pressure drops (Fig. 4). This may explain pressurization of a magma body following only a small stress per-
why eruptions linked to triggering (3) are typically associated with turbation, they are more susceptible to triggering from earthquakes.
arc volcanism, whose magmas are generally H2O rich (43), rather In addition, these results indicate that Goldilocks temperature
than volcanoes associated with ocean ridge systems or oceanic islands conditions are required, whereby magma remains liquid enough to
whose (mafic) magmas have H2O contents of less than 1% (44). How- flow and where small pressure drops can generate enough bubble
ever, note that there are substantially more large earthquakes near formation to sufficiently pressurize the magma chamber.
arc volcanoes than those in other tectonic settings, making it difficult
to assess whether the lack of H2O is a controlling factor.
Another important constraint on whether the intrusion was trig- MATERIALS AND METHODS
gered is the relative timings of the intrusion and earthquake. The sur- InSAR processing
face eruption was reported ~30 hours after the earthquake. Models for All of the InSAR data were processed using data using the InSAR
the evolution of dike volume indicate that the volume within a dike Scientific Computing Environment software (47). Topographic correc-
varies as V(t) = V∞ (1 − e−/t) (45), where V∞ is the asymptotic volume tions were made using the 30 m SRTM version 3 (48). The inter-
and is the decay time scale. On the basis of observations of intrusions ferograms were filtered by a power-spectrum filter (49), and unwrapped
from Kilauea, Japan, Afar, and Iceland, is typically around 4 to by SNAPHU (50). To generate the time series (fig. S3), we follow a
Hamling and Kilgour, Sci. Adv. 2020; 6 : eaaz5261 3 April 2020 6 of 9SCIENCE ADVANCES | RESEARCH ARTICLE
small baseline approach (51) such that the displacement, at each epoch, tions of which the Ambrym system sits well within (53). The first
is given by stage of our petrological modeling requires a representative whole
rock composition. For this, we use the composition obtained for a
( 2 2)( ) = (d )
G m
scoria sample, AMB30 from Allard et al. (18), which is a sample of
∇ 0 0 the present activity from Benbow Crater (fig. S6). This is similar to
where G is a matrix containing the timespans of each inter- the whole rock composition of an ejected scoria from the 2005 erup-
ferogram, ∇2 is a finite difference approximation of the Laplacian tion (52). We then use published melt inclusion volatile data to con-
smoothing operator, and the factor 2 determines the weight of smooth- strain the volatile component of the modeled 2015 magma. Allard et al.
ing; m is a matrix containing the best fit velocities between each epoch, (18) report a range in H2O content between ~0.8 and 1.4 wt %
which, when multiplied by G, gives the displacements contained from olivine-hosted inclusions, while for the CO2 content of the
within the interferograms d. To derive the displacement rate used phenocryst-hosted melt inclusions, they obtain a range between
in the post-eruptive modeling, we used the displacement time series ~500 and 1000 parts per million (ppm). Because of the low solubility
and solve for the best fitting displacement rate at each pixel assum- of CO2, this range is likely to be an underestimate of the true CO2
ing a constant rate between October 2015 and March 2017 to match content of Ambrym magmas. Nevertheless, CO2 has limited impact
the ALOS-2 interferogram. The inversion is weighted using the data on the phase assemblage of the magma, and without further con-
variance in a ~2 km–by–2 km region around the reference location straints, we chose to use a constant CO2 content of 1000 ppm for
outside of the caldera (P4 in fig. S3). For the ALOS-2 data, where we all our model runs. Magma oxidation state has a significant role in
have only a signal long temporal baseline interferogram, we simply controlling the final phase assemblage, and for this, we constrain
Downloaded from http://advances.sciencemag.org/ on January 17, 2021
divided the interferogram by the total time span. the oxygen fugacity to NNO +1 (1 log unit above the nickel-nickel
oxide buffer) based on the olivine-spinel-pyroxene oxthermometer
Modeling results from Sheehan and Barclay (54). Lastly, the starting pressure
To model the dike intrusion, we used a Bayesian inversion [GBIS V1.0, for all model runs was at 100 MPa, and because we are investigating
http://comet.nerc.ac.uk/gbis/ (21)] to find the posterior probability the effect of very small pressure decreases, we decompressed at
distribution of the source parameters. The data were first translated intervals of 1 MPa down to 90 MPa.
into a local coordinate system and subsampled using a Quadtree Using the above compositional constraints, we then run a series of
algorithm (52). We solved for the position, depth extent, strike, dip, isothermal decompression sequences at a constant bulk composition
and opening that best fit the observed deformation assuming a and CO2 content while systematically varying the H2O content and
Poisson’s ratio of 0.25. the magmatic temperature. It is notable that the modeled liquidus
For the distributed opening model, we used the results of the temperature of our magma is ~1200°C using a constrained fO2 of
Bayesian inversion to help constrain the geometry of the dike at NNO +1. Using this as a starting point, we incrementally decrease
depth. The surface position of the dike was traced from the offset in the magma temperature in 25°C steps to 925°C. For simplicity, we
the phase data and used the location from the Bayesian inversion as only show the results of runs from 1025° to 925°C in Fig. 4.
a guide for the central part of the intrusion where coherence is lost. The results of the model are twofold for our purposes. First, we
With the geometry fixed, we solved for the best-fitting distributed can quantify the exsolved vapor phase and therefore the volume in-
opening model, m crease because of H2O bubble formation. These data are used to con-
strain the amount of overpressure exerted by the decompression
m event. Second, we are able to obtain the mineralogy of the magma at
(∇ 0 0 0)( bc ) (0)
A x y 1 a
2 = d
any given condition, including the volume of the phases (crystals
and melt). These data are converted into a volume percent, which
can then be used to evaluate the physical properties of the magma—
where A is a set of matrices representing Green’s functions for the ability for the magma to flow and ascend rather than stagnate.
the ascending interferogram, which when multiplied by m produce
the model displacements at the observation points, x and y. ∇ is the SUPPLEMENTARY MATERIALS
finite difference approximation of the Laplacian operator, which acts
to smooth the distribution of slip, the relative importance of which Supplementary material for this article is available at http://advances.sciencemag.org/cgi/
is governed by the size of the scalar smoothing factor . a and b are content/full/6/14/eaaz5261/DC1
phase gradients in the x- and y-directions, respectively, and c is an
offsets to account for the unknown zero phase level. d is a vector REFERENCES AND NOTES
containing the observed displacements. We assume a Poisson’s ratio 1. M. Manga, E. Brodsky, Seismic triggering of eruptions in the far field: Volcanoes
of 0.25 and assign a shear modulus of 30 GPa. For the post-eruption and geysers. Annu. Rev. Earth Planet. Sci. 34, 263–291 (2006).
2. A. T. Linde, I. S. Sacks, Triggering of volcanic eruptions. Nature 395, 888–890
sill, we follow the same method detailed above and discretize the sill (1998).
into 300 m–by–300 m patches. 3. T. Nishimura, Triggering of volcanic eruptions by large earthquakes. Geophys. Res. Lett.
44, 7750–7756 (2017).
Petrological modeling 4. D. Hill, F. Pollitz, C. Newhall, Earthquake–volcano interactions. Phys. Today 55,
To constrain both the mineralogy and volatile (predominantly H2O) 41–47 (2002).
5. M. E. Pritchard, J. A. Jay, F. Aron, S. T. Henderson, L. E. Lara, Subsidence at southern Andes
exsolution of the Ambrym magmatic system, we use Rhyolite-MELTS
volcanoes induced by the 2010 Maule, Chile earthquake. Nat. Geosci. 6, 632–636
(38, 39), a thermodynamic model that has been calibrated against (2013).
equilibrium experimental runs. The vast majority of experiments 6. Y. Takada, Y. Fukushima, Volcanic subsidence triggered by the 2011 Tohoku earthquake
used for model calibration have been conducted on basalt composi- in Japan. Nat. Geosci. 6, 637–641 (2013).
Hamling and Kilgour, Sci. Adv. 2020; 6 : eaaz5261 3 April 2020 7 of 9SCIENCE ADVANCES | RESEARCH ARTICLE
7. I. Sumita, M. Manga, Suspension rheology under oscillatory shear and its geophysical 30. D. Maestrelli, M. Bonini, D. D. Donne, M. Manga, L. Piccardi, F. Sani, Dynamic triggering
implications. Earth Planet Sci. Lett. 269, 468–477 (2008). of mud volcano eruptions during the 2016–2017 Central Italy seismic sequence.
8. A. Namiki, E. Rivalta, H. Woith, T. R. Walter, Sloshing of a bubbly magma reservoir J. Geophys. Res. Solid Earth 122, 9149–9165 (2017).
as a mechanism of triggered eruptions. J. Volcanol. Geoth. Res. 320, 156–171 (2016). 31. A. Gudmundsson, Magma chambers: Formation, local stresses, excess pressures,
9. S. F. L. Watt, D. M. Pyle, T. A. Mather, The influence of great earthquakes on volcanic and compartments. J. Volcanol. Geoth. Res. 237–238, 19–41 (2012).
eruption rate along the Chilean subduction zone. Earth Planet Sci. Lett. 277, 399–407 32. I. N. Sneddon, M. Lowengrub, Crack Problems in the Classical Theory of Elasticity
(2009). (Wiley, 1969), p. 221.
10. F. L. Bonali, Earthquake-induced static stress change on magma pathway in promoting 33. J. R. Lister+, R. C. Kerr, Fluid-mechanical models of crack propagation and their
the 2012 Copahue eruption. Tectonophysics 608, 127–137 (2013). application to magma transport in dykes. J. Geophys. Res. Solid Earth 96 (B6),
11. T. R. Walter, F. Amelung, Volcanic eruptions following M ≥ 9 megathrust 10049–10077 (1991).
earthquakes: Implications for the Sumatra-Andaman volcanoes. Geology 35, 539–542 34. S. Jónsson, Tensile rock mass strength estimated using InSAR. Geophys. Res. Lett. 39,
(2007). L21305 (2012).
12. I. J. Hamling, T. J. Wright, E. Calais, L. Bennati, E. Lewi, Stress transfer between thirteen 35. J. Biggs, S. K. Ebmeier, W. P. Aspinall, Z. Lu, M. E. Pritchard, R. S. J. Sparks, T. A. Mather,
successive dyke intrusions in Ethiopia. Nat. Geosci. 3, 713–717 (2010). Global link between deformation and volcanic eruption quantified by satellite imagery.
13. B. Pelletier, S. Calman, R. Pillet, Current tectonics of the Tonga–New Hebrides region. Nat. Commun. 5, 3471 (2014).
Earth Planet Sci. Lett. 164, 263–276 (1998). 36. S. K. Ebmeier, J. R. Elliott, J.-M. Nocquet, J. Biggs, P. Mothes, P. Jarrín, M. Yépez, S. Aguaiza,
14. S. Calmant, B. Pelletier, P. Lebellegard, M. Bevis, F. W. Taylor, D. A. Phillips, New insights P. Lundgren, S. V. Samsonov, Shallow earthquake inhibits unrest near Chiles–Cerro Negro
on the tectonics along the New Hebrides subduction zone based on GPS results. volcanoes, Ecuador–Colombian border. Earth Planet. Sci. Lett. 450, 283–291 (2016).
J. Geophys. Res. 108, 2319 (2003). 37. T. Nishimura, Pressure recovery in magma due to bubble growth. Geophys. Res. Lett. 31,
15. G. J. H. McCall, R. W. Le Maitre, A. Malahoff, G. P. Robinson, P. J. Stephenson, The geology L12613 (2004).
and geophysics of the Ambrym caldera, New Hebrides. Bulletin Volcanologique 34, 38. G. A. R. Gualda, M. S. Ghiorso, R. V. Lemons, T. L. Carley, Rhyolite-MELTS: A modified
681–696 (1970). calibration of MELTS optimized for silica-rich, fluid-bearing magmatic systems. J. Petrol.
Downloaded from http://advances.sciencemag.org/ on January 17, 2021
16. C. Robin, J.-P. Eissen, M. Monzier, Giant tuff cone and 12-km-wide associated caldera at 53, 875–890 (2012).
Ambrym Volcano (Vanuatu, New Hebrides Arc). J. Volcanol. Geoth. Res. 55, 225–238 39. M. S. Ghiorso, G. A. R. Gualda, An H2O–CO2 mixed fluid saturation model compatible
(1993). with rhyolite-MELTS. Contrib. Mineral. Petr. 169, 53 (2015).
17. K. Németh, S. J. Cronin, R. B. Stewart, D. Charley, Intra-and extra-caldera volcanoclastic 40. A. Costa, L. Caricchi, N. Bagdassarov, A model for the rheology of particle-bearing
facies and geomorphic characteristics of a frequently active mafic island–arc volcano, suspensions and partially molten rocks. Geochem. Geophys. Geosyst. 10, Q03010 (2009).
Ambrym Island, Vanuatu. Sediment. Geol. 220, 256–270 (2009). 41. S. Mueller, E. W. Llewellin, H. M. Mader, The rheology of suspensions of solid particles.
18. P. Allard, A. Aiuppa, P. Bani, N. Métrich, A. Bertagnini, P.-J. Gauthier, H. Shinohara, Proc. R. Soc. A 466, 1201–1228 (2009).
G. Sawyer, F. Parello, E. Bagnato, B. Pelletier, E. Garaebiti, Prodigious emission rates 42. D. Picard, L. Arbaret, M. Pichavant, R. Champallier, P. Launeau, Rheology
and magma degassing budget of major, trace and radioactive volatile species from and microstructure of experimentally deformed plagioclase suspensions. Geology 39,
Ambrym basaltic volcano, Vanuatu island Arc. J. Volcanol. Geoth. Res. 322, 119–143 747–750 (2011).
(2016). 43. T. Plank, K. A. Kelley, M. M. Zimmer, E. H. Hauri, P. J. Wallace, Why do mafic arc magmas
19. D. Legrand, D. Rouland, M. Frogneux, R. Carniel, D. Charley, G. Roult, C. Robin, contain∼ 4wt% water on average? Earth Planet. Sci. Lett. 364, 168–179 (2013).
Interpretation of very long period tremors at Ambrym volcano, Vanuatu, as quasi-static 44. R. Poreda, J.-G. Schilling, H. Craig, Helium and hydrogen isotopes in ocean-ridge basalts
displacement field related to two distinct magmatic sources. Geophys. Res. Lett. 32, north and south of Iceland. Earth Planet. Sci. Lett. 78, 1–17 (1986).
L06314 (2005). 45. E. Rivalta, Evidence that coupling to magma chambers controls the volume history
20. I. J. Hamling, S. Cevuard, E. Garaebiti, Large-scale drainage of a complex magmatic system: and velocity of laterally propagating intrusions. J. Geophys. Res. Solid Earth 115 (B7),
Observations from the 2018 eruption of Ambrym Volcano, Vanuatu. Geophys. Res. Lett. B07203 (2010).
46, 4609–4617 (2019). 46. A. A. Prousevitch, D. L. Sahagian, A. T. Anderson, Dynamics of diffusive bubble growth
21. M. Bagnardi, A. Hooper, Inversion of surface deformation data for rapid estimates of in magmas: Isothermal case. J. Geophys. Res. Solid Earth 98 (B12), 22283–22307 (1993).
source parameters and uncertainties: A Bayesian approach. Geochem. Geophys. Geosyst. 47. P. A. Rosen, E. Gurrola, G. F. Sacco, H. Zebker, The InSAR scientific computing
19, 2194–2211 (2018). environment, in Proc. EUSAR (Nuremberg, 2012), 23 to 26 April, pp. 730–733.
22. Y. Okada, Internal deformation due to shear and tensile faults in a half-space. Bull. Seismol. 48. T. G. Farr, P. A. Rosen, E. Caro, R. Crippen, R. Duren, S. Hensley, M. Kobrick, M. Paller,
Soc. Am. 82, 1018–1040 (1992). E. Rodriguez, L. Roth, D. Seal, S. Shaffer, J. Shimada, J. Umland, M. Werner, M. Oskin,
23. W. Wittmann, F. Sigmundsson, S. Dumont, Y. Lavallée, Post-emplacement cooling D. Burbank, D. Alsdorf, The shuttle radar topography mission. Rev. Geophys. 45, RG2004
and contraction of lava flows: InSAR observations and a thermal model for lava fields at (2007).
Hekla volcano, Iceland. J. Geophys. Res. Solid Earth 122, 946–965 (2017). 49. R. M. Goldstein, C. L. Werner, Radar interferogram filtering for geophysical applications.
24. J. Hamlyn, T. Wright, R. Walters, C. Pagli, E. Sansosti, F. Casu, S. Pepe, M. Edmonds, Geophys. Res. Lett. 25, 4035–4038 (1998).
B. McCormick Kilbride, D. Keir, J. Neuberg, C. Oppenheimer, What causes subsidence 50. C. W. Chen, H. A. Zebker, Phase unwrapping for large SAR interferograms: Statistical
following the 2011 eruption at Nabro (Eritrea)? Prog. Earth Planet Sci. 5, 31 (2018). segmentation and generalized network models. IEEE Trans. Geosci. Remote Sens. 40,
25. D. J. Johnson, F. Sigmundsson, P. T. Delaney, Comment on "Volume of magma 1709–1719 (2002).
accumulation or withdrawal estimated from surface uplift or subsidence, with application 51. D. A. Schmidt, R. Bürgmann, Time-dependent land uplift and subsidence in the Santa
to the 1960 collapse of Kīlauea volcano" by P. T. Delaney and D. F. McTigue. Bull. Volcanol. Clara valley, California, from a large interferometric synthetic aperture radar data set.
61, 491–493 (2000). J. Geophys. Res. Solid Earth 108 (B9), 2416 (2003).
26. E. Rivalta, P. Segall, Magma compressibility and the missing source for some dike 52. S. Jónsson, H. Zebker, P. Segall, F. Amelung, Fault slip distribution of the 1999 Mw 7.1
intrusions. Geophys. Res. Lett. 35, L04306 (2008). Hector Mine, California, earthquake, estimated from satellite radar and GPS
27. F. Sigmundsson, M. Parks, R. Pedersen, K. Jónsdóttir, B. G. Ófeigsson, R. Grapenthin, measurements. Bull. Seismol. Soc. Am. 92, 1377–1389 (2002).
S. Dumont, P. Einarsson, V. Drouin, E. R. Heimisson, Á. R. Hjartardóttir, M. Guðmundsson,
53. M. S. Ghiorso, R. O. Sack, Chemical mass transfer in magmatic processes IV. A revised
H. Geirsson, Sigrún Hreinsdóttir, E. Sturkell, A. Hooper, Þ. Högnadóttir, K. Vogfjörð,
and internally consistent thermodynamic model for the interpolation and extrapolation
T. Barnie, M. J. Roberts, Magma movements in volcanic plumbing systems and their
of liquid-solid equilibria in magmatic systems at elevated temperatures and pressures.
associated ground deformation and seismic patterns, in Volcanic and Igneous Plumbing
Contrib. Mineral. Petr. 119, 197–212 (1995).
Systems (Elsevier Inc., 2018), pp. 285–322.
54. F. Sheehan, J. Barclay, Staged storage and magma convection at Ambrym volcano, Vanuatu.
28. D. L. Wells, K. J. Coppersmith, New empirical relationships among magnitude, rupture
J. Volcanol. Geoth. Res. 322, 144–157 (2016).
length, rupture width, rupture area, and surface displacement. Bull. Seismol. Soc. Am. 84,
55. C. De Mets, R. G. Gordon, D. F. Argus, Geologically current plate motions. Geophys. J. Int.
974–1002 (1994).
181, 1–80 (2010).
29. D. P. Hill, P. A. Reasenberg, A. Michael, W. J. Arabaz, G. Beroza, D. Brumbaugh, J. N. Brune,
R. Castro, S. Davis, D. dePolo, W. L. Ellsworth, J. Gomberg, S. Harmsen, L. House,
S. M. Jackson, M. J. S. Johnston, L. Jones, R. Keller, S. Malone, L. Munguia, S. Nava, Acknowledgments: We thank JAXA for access to ALOS-2 data and the EU Copernicus and the
J. C. Pechmann, A. Sanford, R. W. Simpson, R. B. Smith, M. Stark, M. Stickney, A. Vidal, European Space Agency for access to and scheduling of Sentinel-1 data. The ALOS-2 original data
S. Walter, V. Wong, J. Zollweg, Seismicity remotely triggered by the magnitude 7.3 are copyright of Japan Aerospace Exploration Agency (JAXA) and provided under JAXA RA4 PI
Landers, California, earthquake. Science 260, 1617–1623 (1993). Project P1093002. Funding: This work was supported by public research funding from the
Hamling and Kilgour, Sci. Adv. 2020; 6 : eaaz5261 3 April 2020 8 of 9SCIENCE ADVANCES | RESEARCH ARTICLE
Government of New Zealand with additional support the Natural Hazards Research Platform to Submitted 16 September 2019
I.J.H. through contract 2015-GNS-02-NHRP and the ECLIPSE Programme, which is funded by the Accepted 7 January 2020
New Zealand Ministry of Business, Innovation and Employment. Author contributions: I.J.H. Published 3 April 2020
carried out the InSAR processing and elastic modeling and led the writing of the paper with help 10.1126/sciadv.aaz5261
from G.K. who modeled the magma composition and rheology. Competing interests: The authors
declare that they have no competing interests. Data and materials availability: All data needed
to evaluate the conclusions in the paper are present in the paper and/or the Supplementary Citation: I. J. Hamling, G. Kilgour, Goldilocks conditions required for earthquakes to trigger
Materials. Additional data related to this paper may be requested from the authors. basaltic eruptions: Evidence from the 2015 Ambrym eruption. Sci. Adv. 6, eaaz5261 (2020).
Downloaded from http://advances.sciencemag.org/ on January 17, 2021
Hamling and Kilgour, Sci. Adv. 2020; 6 : eaaz5261 3 April 2020 9 of 9Goldilocks conditions required for earthquakes to trigger basaltic eruptions: Evidence from
the 2015 Ambrym eruption
I. J. Hamling and G. Kilgour
Sci Adv 6 (14), eaaz5261.
DOI: 10.1126/sciadv.aaz5261
Downloaded from http://advances.sciencemag.org/ on January 17, 2021
ARTICLE TOOLS http://advances.sciencemag.org/content/6/14/eaaz5261
SUPPLEMENTARY http://advances.sciencemag.org/content/suppl/2020/03/30/6.14.eaaz5261.DC1
MATERIALS
REFERENCES This article cites 52 articles, 6 of which you can access for free
http://advances.sciencemag.org/content/6/14/eaaz5261#BIBL
PERMISSIONS http://www.sciencemag.org/help/reprints-and-permissions
Use of this article is subject to the Terms of Service
Science Advances (ISSN 2375-2548) is published by the American Association for the Advancement of Science, 1200 New
York Avenue NW, Washington, DC 20005. The title Science Advances is a registered trademark of AAAS.
Copyright © 2020 The Authors, some rights reserved; exclusive licensee American Association for the Advancement of
Science. No claim to original U.S. Government Works. Distributed under a Creative Commons Attribution NonCommercial
License 4.0 (CC BY-NC).You can also read