Poromechanical controls on spontaneous imbibition in earth materials
←
→
Page content transcription
If your browser does not render page correctly, please read the page content below
www.nature.com/scientificreports
OPEN Poromechanical controls
on spontaneous imbibition in earth
materials
Amir H. Haghi1*, Richard Chalaturnyk1, Martin J. Blunt2, Kevin Hodder1 & Sebastian Geiger3
Over the last century, the state of stress in the earth’s upper crust has undergone rapid changes
because of human activities associated with fluid withdrawal and injection in subsurface formations.
The stress dependency of multiphase flow mechanisms in earth materials is a substantial challenge
to understand, quantify, and model for many applications in groundwater hydrology, applied
geophysics, CO2 subsurface storage, and the wider geoenergy field (e.g., geothermal energy,
hydrogen storage, hydrocarbon recovery). Here, we conduct core-scale experiments using N2/water
phases to study primary drainage followed by spontaneous imbibition in a carbonate specimen
under increasing isotropic effective stress and isothermal conditions. Using X-ray computed
micro-tomography images of the unconfined specimen, we introduce a novel coupling approach
to reconstruct pore-deformation and simulate multiphase flow inside the deformed pore-space
followed by a semi-analytical calculation of spontaneous imbibition. We show that the irreducible
water saturation increases while the normalized volume of spontaneously imbibed water into the
specimen decreases (46–25%) in response to an increase in effective stress (0–30 MPa), leading to
higher residual gas saturations. Furthermore, the imbibition rate decreases with effective stress,
which is also predicted by a numerical model, due to a decrease in water relative permeability as the
pore-space becomes more confined and tortuous. This fundamental study provides new insights into
the physics of multiphase fluid transport, CO2 storage capacity, and recovery of subsurface resources
incorporating the impact of poromechanics.
An accurate characterization of mechanical pore deformation, multiphase fluid transport, and their physical
interactions (i.e., poromechanical interactions) in earth materials is essential for a diverse range of applications
such as groundwater hydrology in the vadose z one1,2, geological C O2 sequestration3,4, transport of non-aqueous
phase liquid contaminant in a quifers , extraction of geothermal e nergy7, and enhanced oil r ecovery8,9. Recent
5,6
experimental studies have revealed that the multiphase flow properties (e.g., relative permeability and capillary
pressure) of rocks are dependent on effective stress-induced pore deformation10–12. Mechanistically, multiphase
flow mechanisms in porous rocks are expected to be stress-dependent as well, an idea that challenges the sim-
plifying assumption of a static pore structure addressed in numerous studies associated with multiphase flow
in porous m edia13,14. Besides, models to forecast freshwater and hydrocarbon reserves and their recovery from
subsurface formations need to include the complex interactions between poromechanics and multiphase flow15,16.
Every geological formation in the upper part of the earth’s crust is exposed to a state of compressive stress,
which depends on depth, pore pressure, and active geological p rocesses17–19. Geological processes (e.g., plate
tectonics) shape the current state of in-situ stress and alter it slowly over geological t imescales20. However,
human-induced changes in effective stress, driven by excessive fluid production/injection operations in subsur-
face formations, occurs rapidly20. For instance, global overexploitation of groundwater from many giant aquifers,
especially in northern China, India, Pakistan, Iran, and the United States (US), has caused vast land subsidence,
fault reactivation, and induced s eismicity15,21–24. In the US, 45 states with an area of more than 40,000 km2 have
been affected by extensive land subsidence due to the compaction of aquifers and the collapse of cavities in
carbonates25. Similarly, injection/production operations in hydrocarbon fields have led to an 80% loss of wetlands
in Louisiana20. These are all large-scale consequences of significant human-driven changes in effective stress
due to changes in pore pressure. Pore-spaces present within geological formations deform in response to the
nontrivial changes in effective stress. The physical mechanisms controlling stress-dependent pore deformations
1
Department of Civil and Environmental Engineering, University of Alberta, Edmonton T6G 1H9,
Canada. 2Department of Earth Science and Engineering, Imperial College London, London SW7 2AZ, UK. 3Institute
of GeoEnergy Engineering, Heriot-Watt University, Edinburgh EH14 4AS, UK. *email: haghi@ualberta.ca
Scientific Reports | (2021) 11:3328 | https://doi.org/10.1038/s41598-021-82236-x 1
Vol.:(0123456789)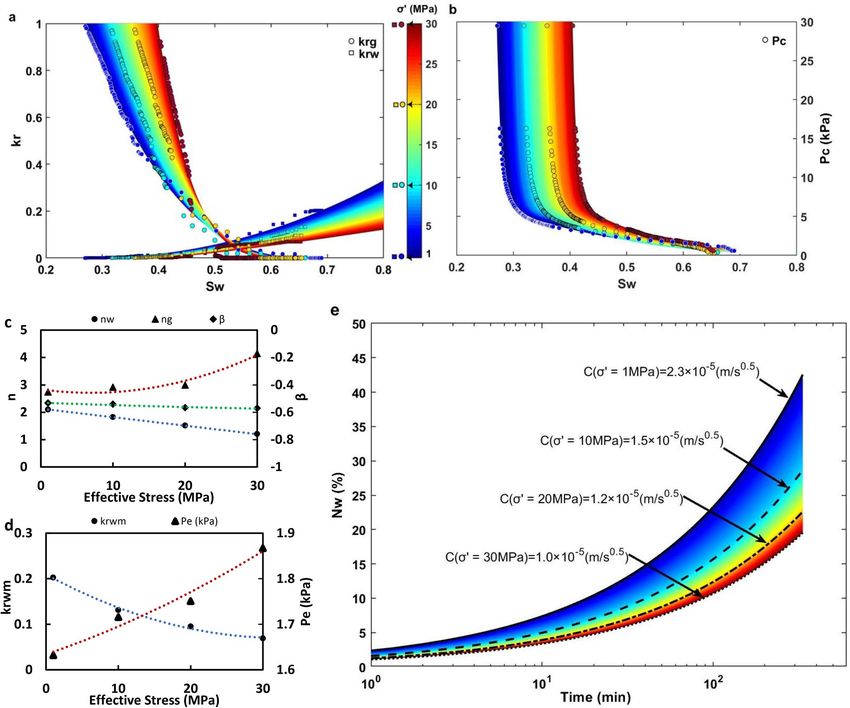
www.nature.com/scientificreports/
are well-understood, both analytically (based on poroelasticity theory26,27), and experimentally28. These porome-
chanical interactions have been shown to have a major impact on single-phase (e.g., absolute permeability) and
multiphase flow properties of porous m edia10–12. Hence, multiphase flow mechanisms including drainage (i.e.,
the wetting phase is displaced by the non-wetting phase) and imbibition (i.e., the non-wetting phase is displaced
by the wetting phase) are also expected to be deformation-dependent in porous media. Primary drainage (PD)
is defined as the first drainage process in a pore-space that is initially 100% saturated with the wetting p hase29.
Spontaneous imbibition (SI) refers to capillary-driven imbibition where the capillary number Ca (i.e., a dimen-
sionless ratio of viscous forces to capillary forces) is typically less than 10−529.
Despite the wealth of studies on the environmental impact of effective stress-induced deformation in subsur-
face formations, the physical influence of pore deformation on PD and SI mechanisms in the unsaturated zones
of aquifers, geological formations that are targets for carbon storage, and geothermal or hydrocarbon reservoirs
remains unclear. Recent experiments using both pore-scale and core-scale a nalyses10–12,30,31 have featured the
stress dependency of relative permeability and capillary pressure in different materials (e.g., carbonates and
sandstones). However, the detrimental impact of effective stress-induced pore deformation on the reserves of
depleted groundwater resources or energy recovery from geothermal and hydrocarbon reservoirs is yet to be
fully explored.
To elucidate the fundamental physical interactions between effective stress-induced deformation and mul-
tiphase flow, we scan a water-wet carbonate core at zero confining stress ( σ ′ = 0MPa ) using X-ray computed
micro-tomography (micro-CT). Then, we conduct a series of stress-dependent core-flooding experiments, PD
and SI, in the same core. We combine conceptual proxy modeling (i.e., which we used to reconstruct a 3D stress-
dependent pore-space model) and pore network modeling (i.e., which we used for pore network extraction and
two-phase flow simulation) techniques to simulate stress-dependent PD and SI at the pore-scale and compare
the results with the core-scale experiments. We find that the irreducible water saturation Swir (i.e., the normalized
volume of the remaining water in the pore-space at the end of PD) increases with effective stress. We reveal that
the deformation of pores and channels, in response to an increase in effective stress, hinders the advance of the
invading gas phase during PD, while the gas injection pressure is fixed. We further observe that stress-dependent
pore deformation induces a boost in the normalized volume (percent of pore volume) of the spontaneously
imbibed water into the pore-space Nw , a decline in water relative permeability krw , and a rightward shift in gas
relative permeability krg during SI. These findings demonstrate the striking control of stress-dependent pore
deformation on irreducible saturation during the PD-SI process in subsurface porous media and its drastic impact
on our estimates of recoverable freshwater and energy resources and CO2 storage capacity in some formations.
Core‑scale experimental observations of stress‑dependent fluid‑fluid displacement. We used
micro-CT to investigate the initial pore structure and distribution of the wetting and non-wetting phases (deion-
ized water and N 2, respectively) of an unconfined carbonate core (i.e., σ ′ = 0MPa) at the end of PD and SI, inde-
pendently. For the confined tests (i.e., σ ′ > 0MPa), we mounted the specimen into a high-pressure, high-tem-
perature triaxial cell to conduct a set of two-phase fluid flow experiments (the PD-SI process) under a wide range
of isotropic effective stresses (1–30 MPa) and isothermal (40 ± 0.1 °C) conditions. The range of applied effective
stress in the experiments was selected to cover the range during land subsidence due to aquifer d epletion25 and
20
compaction of hydrocarbon reservoirs in the US and the North Sea in response to human-induced effective
stress changes �σ ′ ≤ 30MPa. Changes in the applied effective stress on the specimen for each experiment was
implemented by changing the confining pressure inside the cell while the pore pressure was kept constant. At
each effective stress condition, we measured the pore strain and absolute permeability of the fully saturated
specimen initially with deionized water. Effective stress-induced pore deformation drives a certain volume of
water out of the fully-saturated specimen, which provided us with the pore strain εp = (Vp i − �V )/Vp i ; where
Vp i is the initial (i.e., unconfined) pore volume and V is the directly measured volume of extracted water at
each effective stress27. We calculated the absolute permeability, k (m2), by flushing deionized water at five flow
rates Qw (1, 2, 3, 4, and 5 ml/min) through the saturated core. We then inserted the recorded pressure drop across
the core, p, at steady-state condition into Darcy’s law k = Qw µw L/A�p, where µw , L, and A are defined as
the water viscosity, characteristic length, and cross-sectional area of the core, respectively32. The PD-SI process
consists of flushing the water-saturated core with N2 as the non-wetting phase and subsequently reintroducing
water as the wetting phase. We conducted the PD and SI experiments at a constant injection pressure differential
( p) of 500 kPa and 5 kPa, respectively, and atmospheric pore pressure under variable effective stress conditions.
At each effective stress, the cumulative volume of the imbibed water was recorded every 20 s. In this study, we
designed the experiments such that fluid-fluid displacements are capillary-dominant (i.e., spontaneous) imbi-
bition with capillary numbers in the order of Ca = (µw vw )/γ ≈ 10−8, where γ is the interfacial tension, vw is
the interstitial water velocity vw = Qw /(ϕA), and ϕ is the porosity of the r ock33. More details on the core-scale
experiments are outlined in “Materials and Methods” section.
Stress‑dependent pore flow modeling, σPFM. We introduce the σPFM approach, which generates
simultaneous visualizations of both stress-dependent pore structures and two-phase flow mechanisms in porous
media, by coupling conceptual proxy modeling (CPM) and pore network modeling (PNM) techniques to quan-
tify poromechanical impacts on fluid-fluid displacement in porous media (Fig. 1). The CPM technique is an
efficient approach to compact the unconfined 3D pore-space model, which was extracted from the micro-CT
images, and to reconstruct a proxy structure compatible with the pore-space at each effective confining stress
condition (Fig. 1a–c11). Figure 1a shows the pore structure and qualitative distribution of the gas phase (in yel-
low) and the water phase (in blue) inside the unconfined core at the irreducible water saturation from segmented
micro-CT images. To reduce the computational burden, we cropped a cubic sub-volume of the pore-space
Scientific Reports | (2021) 11:3328 | https://doi.org/10.1038/s41598-021-82236-x 2
Vol:.(1234567890)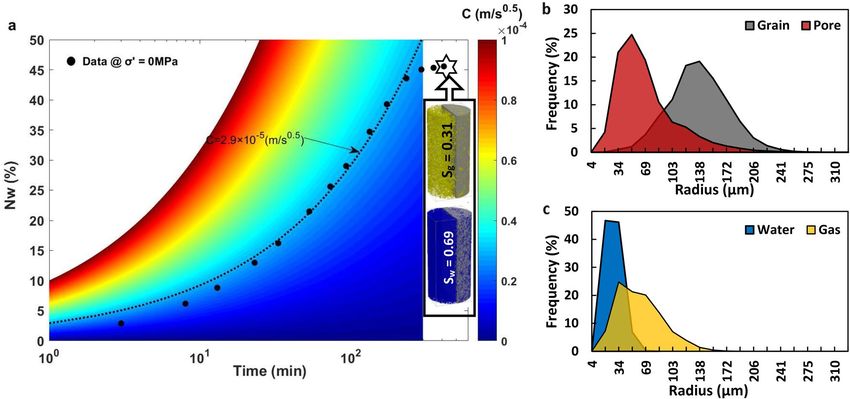
www.nature.com/scientificreports/
Figure 1. Workflow for stress-dependent pore flow modeling, σPFM. This figure shows (a) the 3D model of
phase distribution in the unconfined core, (b) the cubic proxy model, (c) a 2D view of the phase distribution in
the unconfined cube (blue is water and yellow is gas), (d) the stress-dependent extracted pore network model
(PNM), and (e) 2D view of the simulated phase distribution in the cube (blue is water and yellow is gas) at Swir
under increasing effective stress conditions. The conceptual proxy modeling (CPM) workflow consists of image
post-processing, adjusting the grayscale index (GSI), and matching the proxy model’s pore strain (εp model ) with
the experimental pore strain (εp exp) at each effective stress condition.
(Fig. 1b) with a size of 3 × 3 × 3 mm (350 × 350 × 350 voxels) out of the cylindrical core model (Fig. 1a) and used
it in this study to reconstruct stress-dependent pore deformation. This cube reached the Representative Elemen-
tary Volume (REV) by performing REV analysis in Fig. S1 (see Supplementary Information) based on porosity
(i.e., for a sub-volume, the REV has been reached once a plot of its porosity reached a plateau over different sam-
ple sizes). Meanwhile, the core and cube have the same porosity and absolute permeability. Figure 1c presents the
phase distribution inside the unconfined cube at irreducible water saturation Swir (σ ′ = 0MPa) = 0.23. Next, we
extracted a topologically representative network of the 3D deformed pore-space model (Fig. 1d), corresponding
to each effective stress condition, and computed multiphase fluid transport via this network using an in-house
code (Fig. 1e). A more detailed explanation of the σPFM approach is given in Supplementary Note 1.
Analytical investigation of stress‑dependent SI. According to the Lucas-Washburn law34,35, during
SI, the location of the wetting-phase front scales with the square-root of time. Likewise, the normalized volume
(percent of pore volume) of the spontaneously imbibed water, Nw , into the core follows the equation
t
qwm dt 2C √
Nw = 0 = t, (1)
Lϕ Lϕ
√
where qwm (m/s) and t(s) are defined√ as the maximum water invasion rate at the core inlet (qwm = C/ t ) and
36
time, respectively . In Eq. (1), C (m/ s ) is a constant, which indicates the intrinsic potential of a porous media
to imbibe the wetting phase spontaneously37. In this context, the principal governing equation for counter-
current SI is defined as
Scientific Reports | (2021) 11:3328 | https://doi.org/10.1038/s41598-021-82236-x 3
Vol.:(0123456789)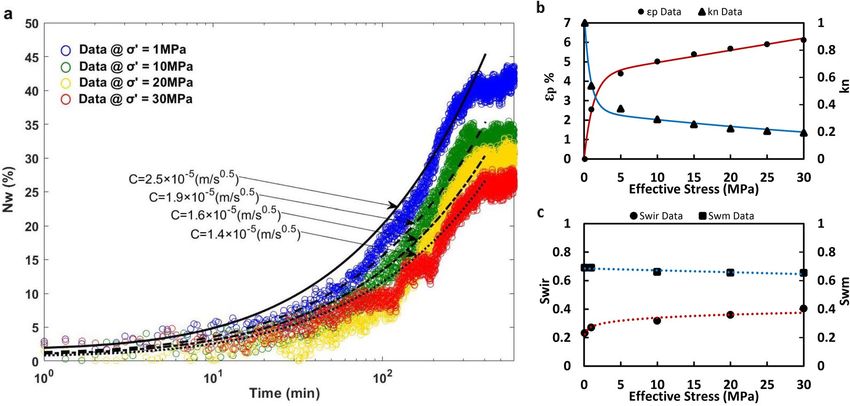
www.nature.com/scientificreports/
Figure 2. Quantitative insight into SI, phase distribution, and pore structure of the unconfined specimen. The
plots show (a) the increment of Nw over time with its corresponding C value and the final saturation of water
and gas phases, (b) the pore and grain size distribution, and (c) the wetting and non-wetting phase clusters size
distribution after SI for the unconfined core.
d 2 Fw ϕD(Sw )
Fw 2
=− , (2)
dSw 2C 2
w g dPc
D(Sw ) = −k (3)
w + g dSw
where Fw, D(Sw ), , and Pc are the capillary-driven fractional flow (Fw = qw /qwm), capillary dispersion coefficient
with the unit of (m2 /s), mobility ( = kr /µ), and capillary pressure, respectively36. To solve Eq. (2), first, krw ,
krg , and Pc as a function of Sw and k should be defined for the porous medium at each effective stress condition.
Using Eq. (3), D(Sw ) can be developed at each effective stress condition. Then, Eq. (2) can be solved iteratively
for Fw using an implicit integral or through a backward-differencing numerical approximation scheme to specify
Fw (Sw ) and C33. More details on the derivation of the analytical solution are given in Supplementary Note 2. The
stress-dependency of C has been investigated analytically by Haghi et al.12. In the next section, we discuss the
indispensable impact of stress-dependent pore deformation on C at both microscopic and macroscopic scales.
Results and discussion
Core‑scale observations. Figure 2a presents the experimental data (black circles) of increments in Nw
over time on a semi-log plot with an ultimate
√ Nw = 46% (i.e., where the data shows a plateau). Figure 2a shows
that the curve with C = 2.9 × 10⁻⁵ m/ s best matches our experimental data under a zero effective stress con-
dition. Figure 2a further shows the gas and water saturation (0.31 and 0.69, respectively) and their qualitative
distribution in the core at the end of SI. Quantitative descriptions of pore/grain structure and gas/water cluster
size distributions are provided in Fig. 2b, c, respectively. Figure 2b indicates a pore and grain mean radius of
70 μm and 137 μm, respectively; both span up to 327 μm. Figure 2c shows that the gas phase is mainly trapped in
the bigger pores (mean radius of 61 μm) while water occupies the small pores (mean radius of 28 μm) at the end
of SI. Movie S1 (see Supplementary Information) shows the same SI of water, but at the scale of a single droplet
at the surface of the unconfined carbonate specimen, which also reveals the strong affinity of the dry specimen
to the water phase.
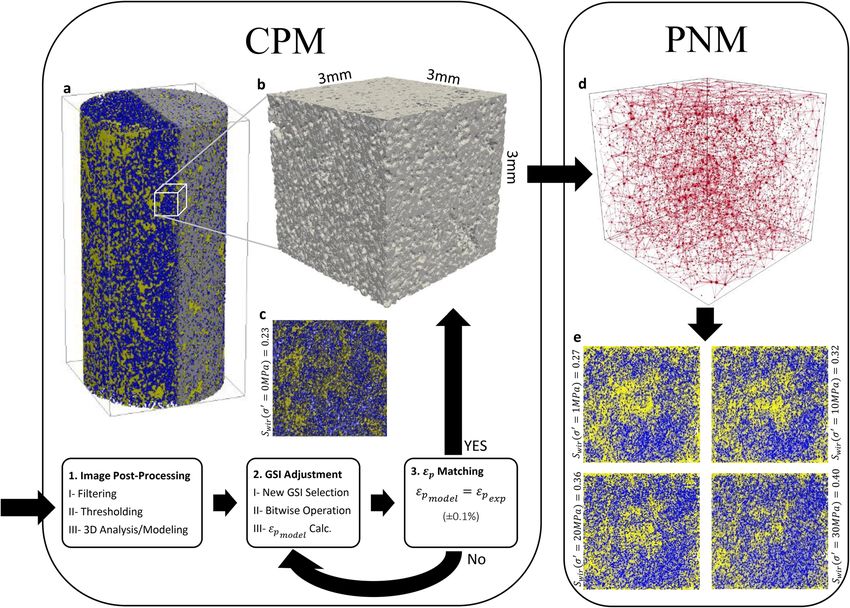
The fitted curves in Fig. 3a were derived based on Eq. (1) and matched on the experimental Nw data at four
different effective stresses (1,√10, 20, and 30 MPa). Figure 3a shows a systematic decrease in the calculated C
(2.5 × 10⁻⁵ − 1.4 × 10⁻⁵ m/ s ) and the measured ultimate Nw (42–25%) by increasing the effective confining
stress (1–30 MPa). These observations quantify the striking impact of poromechanics on fluid-fluid displacement,
which is the main focus of this paper. Figure 3a further shows the trend of the decline in the calculated C to be
comparable with the intensity of changes in the pore strain; pore strain alteration attenuates drastically when the
effective stress is increased from 0 to 10 MPa (Fig. 3b). Some experimental studies have revealed that Nw ∝ tn
in a sparsely-connected pore-space (n = 0.5 in Eq. (1)), where n depends on the pore connectivity (i.e., a poorly
connected pore-space leads to n < 0.5) and sample shape38. The value of n might also increase by time for a single
specimen until the wetting front exceeds the crossover length χL of percolation theory (i.e., accessible porosity
Scientific Reports | (2021) 11:3328 | https://doi.org/10.1038/s41598-021-82236-x 4
Vol:.(1234567890)www.nature.com/scientificreports/
Figure 3. Characterization of stress-dependent SI, pore strain, absolute permeability, and end-point saturation
using core-scale experiments. The figure provides plots of stress-dependent (a) Nw over time with the
corresponding C values, (b) pore strain and normalized permeability, and (c) Swir and Swm at the core-scale.
to the core inlet decreases with distance until χL is exceeded)38. The variable n value due to pore connectivity
might also explain the slight initial deviation from the line of n = 0.5 in Figs. 2a and 3a.
Figure 3b shows the alteration of pore strain (εp) and normalized absolute permeability (kn) under an increas-
ing state of effective confining stress. The blue curve in Fig. 3b was fitted on εp data at each effective stress using
the following non-linear equation (assuming pore strain is equal to volumetric s train10)
(1 − γS ) ′ ′
εp = σ − γS e−σ /KS + γS (4)
KH
where KH is the bulk moduli of hard parts (e.g., solid grain), KS is the bulk moduli of soft parts (e.g., pores), and
γS is defined as the fraction of (volume soft part)/(bulk volume) at the unstressed condition. Eq. (4) is derived
based on natural-strain-based Hook’s law for the soft parts (i.e., an exponential function) and engineering-
strained-based Hook’s law for the hard parts (i.e., a linear function)10,39. For the case of the current carbonate
core, we calculated KH , KS , and γS equal to 1.53 GPa, 1.25 MPa, and 0.043, respectively, using the least square
regression method on eight εp data-points (Fig. 3b) with R2 = 0.9941.
We fitted kn data at each effective stress using the Carman and Kozeny correlation40, red curve, in Fig. 3b.
3
1 − ϕi 2 1
k ϕ
kn = = (5)
ki ϕi 1−ϕ τn
The index i indicates the property at the unstressed condition. −
In Eq. (5), τn represents the non-linear nor-
malized tortuosity of the flow path inside the porous medium τ = a((1 − εP )−m − 1) + 1, where a and m are
material constants11. Using the least square regression method, we calculated a = 0.68 and m = 34.7 for eight
kn data-points (Fig. 3b) with R2 = 0.9966. The calculated positive values for a and m can be translated into an
increasing trend of τn in response to an increase in effective stress. Figure 3c outlines the sensitivity of the irre-
ducible water saturation Swir and maximum water saturation Swm (i.e., maximum Sw achieved at the end of SI)
with effective confining stress. Figure 3c also represents a substantial increase in Swir (0.23–0.4) with an increase
in effective stress (0–30 MPa), while the decrease in Swm is less significant (0.69–0.65).
In Fig. 3c, we find a significant increase in Swir with an increase in effective stress while injecting gas at
a constant pressure differential ( p = 500kPa) at all stress conditions. Our results from earlier stress-dependent
core-flooding experiments showed a decrease in Swir with an increase in effective stress while injecting gas at
constant flow rate (8 ml/min) at all stress c onditions10,11. Hue and B enson31 argued that stress-dependent Swir
in fractures is influenced strictly by the capillary number. Our findings support the same hypothesis in porous
media using core-scale experimental results. Mechanistically, the compaction of the pore throats, due to an excess
effective confining stress, obstructs the flow path of the invading gas phase during PD by increasing the flow
channel’s capillary pressure, Pc , while the driving energy coming from the injection pressure is fixed. Based on
the Young–Laplace e quation29, Pc = 2γ cos(α)/r , reducing the pore throat’s radius, r , leads to an increase in Pc
as long as interfacial tension and the contact angle, α, are fixed. An increase in the channel’s capillary pressure in
response to an increase in effective stress turns into a decline in capillary number, which significantly attenuates
the capillary desaturation process of the water phase in the porous medium. This pore-scale logic explains why
Scientific Reports | (2021) 11:3328 | https://doi.org/10.1038/s41598-021-82236-x 5
Vol.:(0123456789)www.nature.com/scientificreports/
there is a continuum-scale increase in Swir by increasing the effective confining stress (Fig. 3c). Additionally, an
increase in the channel’s capillary pressure due to stress-dependent compaction increases the likelihood of capil-
lary instability and snap-off, which leads to an increase in the volume of the trapped gas in the porous rock (i.e.,
residual gas saturation, Sgr ). This physical rationale elucidates the observed macroscopic decrease in Swm with
an increase in effective stress in Fig. 3c. However, Fig. 3c shows that the stress dependency of the measured Swm
(i.e., Swm = 1 − Sgr ) is not significant. This result can be explained by noticing the constant pressure differential
( p = 5kPa) during SI was inadequate for significant mobilization of the trapped gas phase in the media, which
implies that an increase in capillary number during the fluid-fluid displacement intensifies the poromechanical
impacts on Swir and Swm. For more clarifications on the two-phase experimental results, stress-dependent C and
effective saturation (Swe = Swm − Swir ) are plotted in Fig. S2 (see Supplementary Information), which highlights
a significant decline in both parameters in response to an increase in effective stress from 0 to 30 MPa.
Pore‑scale flow modeling. Using the σPFM approach, Fig. 1e reveals a systematic increase in the calcu-
lated Swir in response to an increase in effective stress, which is compatible with the experimentally measured
values in Fig. 3c. Figure 1e further delivers qualitative insights into the distribution of the gas phase inside the
cube, which is comparable with the observed gas distribution inside the cube at zero effective stress in Fig. 1c. In
Fig. 1e, a manifestation of poromechanical controls on multiphase fluid flow at the pore-scale is the transition
of the flow channels from a gas flow conduit to a gas capillary barrier by increasing the effective stress, which
is evident through the dissipation of the region with a high gas concentration in the central part of the cube in
response to stress-dependent pore deformation. Movies S2 and S3 (see Supplementary Information), which
were developed from σPFM, present stress-dependent PD and SI in the cubic pore network model, respectively.
Using σPFM, we provided a quantitative description of stress-dependent fluid-fluid displacement by deriv-
ing the multiphase flow properties of the network model, namely (1) SI relative permeability (Fig. 4a) and (2)
SI capillary pressure (Fig. 4b), under increasing effective stress conditions. Figure 4a shows a rightward shift in
krg , which is pertinent to our experimental observations associated with the increase of Swir , in response to an
increase in effective confining stress. Figure 4a also shows a decreasing trend in krw with an increase in effective
stress. This trend manifests the significant impact of pore-space deformation on flow-path tortuosity and flow
conductivity during SI. We also added a plot of relative permeability versus (Sw − Swir ) for comparison in Fig. S3
(see Supplementary Information) in which all relative permeability curves started from zero on the horizontal
axis41. Moreover, true effective mobility function TEM = kkr /ϕµ versus (Sw − Swir ) is also plotted in Fig. S4 (see
Supplementary Information) as an alternative dynamic rock-typing process to quantify the impact of stress-
dependent relative permeability on S I42. Both approaches reveal a systematic decrease in kr and TEM function
for water and N2 phases in response to an increase in effective stress, which indicates a decreasing trend of rock’s
quality for water and N 2 flow inside the specimen. Figure 4b reveals a significant increase in capillary pressure
under increasing effective stress conditions, which is a hallmark of a pore network system under progressive
compaction. In Fig. 4a,b, the 3D colored curves, which are extracted from the following power-law f unctions10,
are fitted on the σPFM’s results (circles and squares). The color bar indicates variable effective stress conditions.
β
Pc = Pe Sw∗ (6)
n
krw = krwm Sw∗ w (7)
n
krg = krgm 1 − Sw∗ g (8)
In Eqs. (6–8), Pe is the entry capillary pressure, krwm is the maximum krw , krgm is the maximum krg (≈1 for
imbibition), and Sw∗ = (Sw − Swir )/(Swm − Swir ). Furthermore, β , nw , and ng are fitting constants (Fig. 4c). As
illustrated in Fig. 4d, krwm decreases and Pe increases in response to stress-dependent pore compaction, which
can be interpreted based on a decrease in the pore channel’s radius r in the Carman-Kozeny m odel40, k = ϕr 2 /8τ ,
and the Young–Laplace equation, respectively.
Figure 4e plots the calculated C over time following the analytical framework given in the previous section
and using the modeled relative permeability and capillary pressure with σPFM (Fig. 4a,b) under variable effec-
tive stress conditions. Figure 4e reveals a systematic increase in the calculated C with an increase in effective
stress, which is consistent with our experimental results (Fig. 3a) and a result of the decrease in water relative
permeability with effective stress (Fig. 4a). Stress-dependent C can be interpreted as the stress-dependent SI
rate in geological formations. This observation demonstrates the success of the σPFM in the prediction of the
poromechanical impact on fluid-fluid displacement in porous media. The slight inevitable difference between the
predicted stress-dependent C in Fig. 4e and the experimental values in Fig. 3a could be explained by scale effects
(i.e., cube-scale versus core-scale) on the two-phase flow properties of porous media. In this study, the deter-
mination of whether our SI experiments in fact occurs by only co-current flow or a combination of co- and
counter-current flow is not trivial. Experimental studies have shown that SI always has some degree of counter-
current flow43. However, in this study, the presented analytical derivation for counter-current SI applies to the SI
experiments because the displaced fluid ( N2) is essentially inviscid and therefore all of the hydraulic resistance
was in the imbibing water44.
Figure 5 provides quantitative insights into changes in two topological invariants, namely (1) Euler Number
(χ), which is a measure of connectivity in the pore-space, and (2) connectivity density (ρConn), which indicates
the number of redundant pore-throats per unit volume (mm−3), with an increase in effective s tress45,46. Details
on these calculations are given in Supplementary Note 3. Figure 5 shows an increment in χ and a decline in ρConn
Scientific Reports | (2021) 11:3328 | https://doi.org/10.1038/s41598-021-82236-x 6
Vol:.(1234567890)www.nature.com/scientificreports/
Figure 4. Pore-scale modeling results representing stress-dependent SI and multiphase flow properties of
the cubic specimen using σPFM technique. This figure provides insights into stress-dependent (a) relative
permeability kr , (b) capillary pressure Pc , (c) fitting constants n and β in Eqs. (6–8), (d) curve fitting endpoints
krwm and Pe in Eqs. (6–8), and (e) Nw over time with the corresponding C values for the cube.
Euler number Connec vity Density
400 300
200
250
0
ρConn (mm^-3)
200
-200
-400 150
χ
-600
100
-800
50
-1000
-1200 0
0 10 20 30
Effecve Stress (MPa)
Figure 5. This figure shows stress-dependent changes in Euler number and connectivity density ( mm−3) of the
cube, which indicate the transition of the porous media from a well-connected (χ < 0) to a poorly-connected
(χ > 0) pore-space with an increase in effective stress from 0 to 30 MPa.
Scientific Reports | (2021) 11:3328 | https://doi.org/10.1038/s41598-021-82236-x 7
Vol.:(0123456789)www.nature.com/scientificreports/
in response to an increase in effective stress from 0 to 30 MPa, which are an indication of the transition from a
well-connected (χ < 0) to a poorly-connected pore-space (χ > 0).
Applications in geoscience. Stress-dependent pore deformation due to fluid flow and change in pore
pressure (i.e., poromechanics) is a ubiquitous phenomenon in nature27. Poromechanics has a prominent influ-
ence on fluid transport via living cells and t issues47,48, deformation of articular cartilage and cardiac m
uscles49,50,
and plant movements51. Poromechanics is specifically a dominant mechanism for a wide range of applications in
geoscience such as magma propagation in the earth’s mantle47. Human activities related to fluid withdrawal and
injection operations in subsurface formations can significantly alter the state of in-situ stress in the earth’s crust,
leading to reduced aquifer deliverability and surface subsidence, which has made the role of poromechanics in
earth materials even more crucial. Induced seismicity and earthquakes triggered by stress changes are leading
to deformation in groundwater systems and hydrocarbon reservoirs52–54. In multiphase flow systems, porome-
chanical interaction is important for many applications in groundwater hydrology, geophysics, and geoenergy,
including water infiltration in the vadose zones, transport of non-aqueous phase liquid contaminant in aquifers,
geological CO2 storage, energy extraction from geothermal reservoirs, and enhanced oil recovery.
In this study, we showed the striking impact of stress-dependent pore deformation on fluid-fluid displace-
ment and the recovery of a carbonate specimen. N 2 is an important gas in the atmosphere of the earth: dry air
is composed of almost 80% n itrogen55. As gases are predominantly the non-wetting phase in most liquid-gas
flows in natural porous media, the observed mechanisms for water-N2 from this study are extendable for a wider
range of liquid-gas systems. In groundwater hydrology, water-air displacement is the governing fluid-transport
mechanism in the dynamic unsaturated zones (i.e., vadose zones). Vadose zones have a great influence on the
subsurface distribution of water56. Research has shown that 1.7 ± 0.4 billion people live in regions (dominated by
the US, China, India, Iran, Saudi Arabia, Pakistan, and Mexico) where the global groundwater footprint (GF ),
(i.e., required aquifer area for a sustainable ecosystem and life) is greater than the actual area of hydrologically
active aquifers Aa, with the current global GF/Aa equal to 3.5 ± 0.715. Excessive groundwater abstraction causes
aquifer depletion, an extension of the unsaturated zones in aquifers, and pore compaction due to an increase in
effective stress. The evidence for this claim includes extensive land subsidence and sinkhole formation in these
areas25. A significant reduction in the atmospheric emission of greenhouse gases is another global concern.
Large-scale geological carbon storage is found to be essential to achieve this objective57. In this context, carbon
capture and storage (CCS) is expected to reach a CO2 storage rate of 6000–7000 million tonnes per annum by
205058. This highlights the importance of an accurate estimation of the CO2 storage capacity of the targeted
subsurface formations.
We have shown that pore deformation due to an increase in effective stress from 0 to 30 MPa leads to a 75%
increase (Swir=0.23 to 0.4) in the irrecoverable volume of water (irreducible water) in the carbonate sample after
PD and a 46% decrease ( Nw=0.46 to 0.25) in the replenishable volume of pore-space with water. These find-
ings highlight the critical role stress-dependent pore deformation plays in the calculation of the groundwater
extent (i.e., available volume or thickness of groundwater) and Aa in similar porous materials. Poromechanics
controls not only the recoverable volume of groundwater during depletion, which is stored in the porous matrix
of aquifers, but it also governs the ultimate volume and inflow rate of the groundwater into the porous matrix
of unsaturated zones during the recharging phase, which may decelerate the aquifer replenishment process sig-
nificantly. In a similar way, this dramatic change in Swir , in response to an increase in effective stress from 0 to
30 MPa, can also be interpreted as a 22% decrease in the storable volume of gas inside the porous rock and the
recovery of the liquid phase from the porous rock while the gas injection pressure is fixed. This dramatic change
in the gas storage capacity and liquid recovery is critical for similar subsurface gas injection operations includ-
ing CO2 geological storage and enhanced oil recovery (e.g., miscible/immiscible gas flooding), respectively. It is
noteworthy that the considerable boost (46%) in Nw during water imbibition with a decrease in effective stress
conditions allows us to predict a surge in energy recovery from naturally fractured hydrocarbon reservoirs with
a water-wet rock during water flooding. Although the carbonate sample used in this study does not represent all
carbonates, this study highlights the significance of physical interaction between poromechanics and multiphase
fluid flow in the generic porous media.
Conclusions
We have explored the impact of stress-dependent pore deformation on multiphase flow mechanisms in a car-
bonate rock sample by conducting a set of isothermal PD and SI experiments under a wide range of effective
confining stress conditions (0–30 MPa). We have shown that the irreducible water saturation Swir increases
systematically when increasing effective stress (Fig. 3c), while injection pressure was fixed during PD. On the
other hand, we have noticed a systematic decrease in the amount of water imbibed, Nw and the maximum water
saturation reached, Swm after SI in response to an increase in effective stress (Fig. 3). We have further shown the
consistency between these core-scale stress-dependent observations with the non-linear changes in the pore
strain and normalized permeability, where the rate of changes fades gradually by increasing effective stress con-
ditions (Fig. 3b). Fitting Eq. (1) on the experimental Nw data has proved the systematic dependency of C , which
determines the SI rate, to effective stress conditions.
We have quantified the pore, grain, water cluster, and gas cluster size distribution of the unconfined speci-
men using micro-CT, which has provided us with insights into the initial structure of the pore-space and phase
distribution (Fig. 2). We have further quantified stress-dependent changes in the topology of the pore-space using
Euler number and connectivity density invariants, which demonstrated the transition of the porous media from
a well-connected (χ < 0) to a poorly-connected (χ > 0) pore-space with an increase in effective stress from 0
to 30 MPa. We have introduced the σPFM methodology by coupling CPM and PNM techniques to reconstruct
Scientific Reports | (2021) 11:3328 | https://doi.org/10.1038/s41598-021-82236-x 8
Vol:.(1234567890)www.nature.com/scientificreports/
the 3D stress-dependent pore-space model, extract the corresponding pore network model, and simulate stress-
dependent PD and SI at the pore-scale (Fig. 1). Using σPFM, we have modeled stress-dependent relative perme-
ability and capillary pressure for SI, which has predicted an increasing trend for Swir and Pc and a decreasing
trend for kr and TEM functions for both phases with an increase in effective stress condition (Fig. 4a,b). We have
revealed that the analytical approach for SI based on σPFM’s results were successful in predicting the downward
shift of Nw under increasing effective stress conditions (Fig. 4e), which was compatible with the experimental
data. This consistency between the core-scale experimental results and pore-scale predictions demonstrates that
our method is reliable for stress-dependent multiphase flow modeling in deformable porous media.
We have discussed the poromechanical controls on multiphase flow mechanisms for a wide range of applica-
tions from biophysics to geoscience. We have shown that effective stress increase due to overexploiting ground-
water threatens the sustainability of some groundwater resources and their dependent ecosystems. We have
further shown the significant impact of pore deformation on the gas storage volume in CO2 sequestration and
the recovery of hydrocarbon reservoirs. All these findings underscore the remarkable control of poromechanics
on multiphase fluid flow in porous media and elaborate the physics behind the changes at the micro-scale and
macro-scale, which pave the way for future relevant research in geoscience and engineering.
Materials and methods
All the experiments were performed on a water-wet Indiana limestone sample (from Kocurek Industries INC.,
US) with a diameter of 3.73 cm, length of 10.1 cm, and initial density of 2260 kg/m3 (Fig. S5, Supplementary
Information). Deionized water and N2 were used as the wetting and non-wetting phases, respectively, with
µw = 652.7µPas, µg = 18.4µPas, and γ =69.36 mN/m59,60. At the end of each stress-dependent PD-SI process,
the core was flushed with CO2 to displace the trapped N2 in the pore-space, vacuumed instantly over a liquid
nitrogen cold trap to remove residual C O2 in the core, and re-flushed with high-pressure deionized water for
sufficient time to reach a 100% saturation of the water. The schematic of the core-flooding equipment, which was
designed for the stress-dependent PD and SI experiments, is shown in Fig. S5 (see Supplementary Information).
The porosity and absolute permeability of the unconfined specimen were measured as 0.153 and 2.96 × 10⁻¹⁴ m2,
respectively. The air-water contact angle ( αA−W ) at the equilibrium condition was determined to be ≈ 60° using
a Drop Shape Analyzer (DSA). This confirms the water-wet essence of the specimen being exposed to air as the
second phase (Fig. S6, Supplementary Information). The measured αA−W was also used in the PNM code as the
intrinsic contact angle. The unconfined core was initially scanned using micro-CT with a voxel size of 8.6 μm
to capture the pore structure and phase distribution at Swir and Swm. The carbonate core was contained inside a
Viton rubber sleeve for all of the core-flooding experiments and stationary X-ray scanning processes. The full-
diameter core was scanned in the Pharmaceutical Orthopedic Research Lab (PORL) at the University of Alberta
using the micro-CT imaging suite. The voltage and spot size of the sealed tubal X-ray source within the imaging
equipment was 100 kV and < 5 μm. The equipment provided a 360° rotational field-of-view. The post-processing
and calculations were performed using the CT Analyser in Bruker micro-CT 3D Suite software. The workflow for
the image post-processing is illustrated in Fig. S7 (see Supplementary Information). We performed skeletoniza-
tion and sphere-fitting steps to derive the size distribution plots in Fig. 2 (Supplementary Note 1). In Figs. 2, 3
and 4, the least square regression method was used to fit curves on the experimental data and calculate constants.
Received: 23 November 2020; Accepted: 18 January 2021
References
1. Gambolati, G. & Teatini, P. Geomechanics of subsurface water withdrawal and injection. Water Resour. Res. 51(6), 3922–3955
(2015).
2. Cueto-Felgueroso, L. & Juanes, R. Nonlocal interface dynamics and pattern formation in gravity-driven unsaturated flow through
porous media. Phys. Rev. Lett. 101(24), 244504 (2008).
3. Verdon, J. P. et al. Comparison of geomechanical deformation induced by megatonne-scale CO2 storage at Sleipner, Weyburn, and
In Salah. Proc. Natl. Acad. Sci. 110(30), E2762–E2771 (2013).
4. Shaffer, G. Long-term effectiveness and consequences of carbon dioxide sequestration. Nat. Geosci. 3, 464–467 (2010).
5. Pak, T., Butler, I. B., Geiger, S., van Dijke, M. I. & Sorbie, K. S. Droplet fragmentation: 3D imaging of a previously unidentified
pore-scale process during multiphase flow in porous media. Proc. Natl. Acad. Sci. 112(7), 1947–1952 (2015).
6. Honeyman, B. D. Geochemistry: colloidal culprits in contamination. Nature 397, 23–24 (1999).
7. Tomac, I. & Sauter, M. A review on challenges in the assessment of geomechanical rock performance for deep geothermal reservoir
development. Renew. Sustain. Energy Rev. 82, 3972–3980 (2018).
8. Siriwardane, H. J., Gondle, R. K., Varre, S. B., Bromhal, G. S. & Wilson, T. H. Geomechanical response of overburden caused by
CO2 injection into a depleted oil reservoir. J. Rock Mech. Geotech. Eng. 8(6), 860–872 (2016).
9. Dusseault, M. B., & Collins, P. M. Geomechanics effects in thermal processes for heavy oil exploitation. Heavy Oils: Reservoir
Characterization and Production Monitoring, 287–291 (2010).
10. Haghi, A. H., Talman, S. & Chalaturnyk, R. Consecutive experimental determination of stress-dependent fluid flow properties of
Berea sandstone and implications for two-phase flow modeling. Water Resour. Res. 56(1), e2018WR024245 (2020).
11. Haghi, A. H., Chalaturnyk, R. & Talman, S. Stress-dependent pore deformation effects on multiphase flow properties of porous
media. Sci. Rep. 9(1), 1–10 (2019).
12. Haghi, A. H., Chalaturnyk, R. & Geiger, S. New semi-analytical insights into stress-dependent spontaneous imbibition and oil
recovery in naturally fractured carbonate reservoirs. Water Resour. Res. 54(11), 9605–9622 (2018).
13. Rabbani, H. S., Joekar-Niasar, V., Pak, T. & Shokri, N. New insights on the complex dynamics of two-phase flow in porous media
under intermediate-wet conditions. Sci. Rep. 7(1), 4584 (2017).
14. Reynolds, C. A., Menke, H., Andrew, M., Blunt, M. J. & Krevor, S. Dynamic fluid connectivity during steady-state multiphase flow
in a sandstone. Proc. Natl. Acad. Sci. 114(31), 8187–8192 (2017).
Scientific Reports | (2021) 11:3328 | https://doi.org/10.1038/s41598-021-82236-x 9
Vol.:(0123456789)www.nature.com/scientificreports/
15. Gleeson, T., Wada, Y., Bierkens, M. F. & Van Beek, L. P. Water balance of global aquifers revealed by groundwater footprint. Nature
488(7410), 197–200 (2012).
16. Herbert, C. & Döll, P. Global assessment of current and future groundwater stress with a focus on transboundary aquifers. Water
Resour. Res. 55(6), 4760–4784 (2019).
17. Haghi, A. H., Kharrat, R., Asef, M. R. & Rezazadegan, H. Present-day stress of the central Persian Gulf: implications for drilling
and well performance. Tectonophysics 608, 1429–1441 (2013).
18. Haghi, A. H., Chalaturnyk, R. & Ghobadi, H. The state of stress in SW Iran and implications for hydraulic fracturing of a naturally
fractured carbonate reservoir. Int. J. Rock Mech. Min. Sci. 105, 28–43 (2018).
19. Snee, J. E. L. & Zoback, M. D. Multiscale variations of the crustal stress field throughout North America. Nat. Commun. 11(1),
1–9 (2020).
20. Zoback, M. D. Reservoir Geomechanics (Cambridge University Press, Cambridge, 2010).
21. Hoyt, A. M., Chaussard, E., Seppalainen, S. S. & Harvey, C. F. Widespread subsidence and carbon emissions across Southeast Asian
peatlands. Nat. Geosci. 13, 435–440 (2020).
22. Ojha, C., Werth, S. & Shirzaei, M. Groundwater loss and aquifer system compaction in San Joaquin Valley during 2012–2015
drought. J. Geophys. Res. Solid Earth 124(3), 3127 (2019).
23. Haghighi, M. H. & Motagh, M. Ground surface response to continuous compaction of aquifer system in Tehran, Iran: results from
a long-term multi-sensor InSAR analysis. Remote Sens. Environ. 221, 534–550 (2019).
24. Alghannam, M. & Juanes, R. Understanding rate effects in injection-induced earthquakes. Nat. Commun. 11, 3053 (2020).
25. Galloway, D. L., Jones, D. R., & Ingebritsen, S. E. Land Subsidence in the United States, Vol. 1182 (US Geological Survey, 1999).
26. Biot, M. A. General theory of three-dimensional consolidation. J. Appl. Phys. 12(2), 155–164 (1941).
27. Detournay, E. & Cheng, A. H. D. Fundamentals of poroelasticity. In Comprehensive Rock Engineering: Principles, Practice and
Projects. Analysis and Design Methods Chapter 5 Vol. 2 (ed. Fairhurst, C.) 113–171 (Pergamon Press Inc, New York, 1993).
28. Zimmerman, R. W., Somerton, W. H. & King, M. S. Compressibility of porous rocks. J. Geophys. Res. Solid Earth 91(B12), 12765–
12777 (1986).
29. Peters, E. J. Advanced Petrophysics: Dispersion, Interfacial Phenomena Vol. 2 (Live Oak Book Company, Austin, 2012).
30. Oak, M. J., Baker, L. E. & Thomas, D. C. Three-phase relative permeability of Berea sandstone. J. Petrol. Technol. 42(08), 1–054
(1990).
31. Huo, D. & Benson, S. M. Experimental investigation of stress-dependency of relative permeability in rock fractures. Transp. Porous
Media 113(3), 567–590 (2016).
32. Darcy, H. Les fontaines publiques de la ville de Dijon: English Translation, The Public Fountains of the City of Dijon, translated by P.
Bobeck, Kendall/Hunt Publishing Company, Dubuque, Iowa, 2004 (Victor Dalmont, Paris, 1856).
33. Blunt, M. J. Multiphase Flow in Permeable Media: A Pore-Scale Perspective (Cambridge University Press, Cambridge, 2017).
34. Lucas, R. On the time-law of the capillary rise of liquids. Kolloid Z 23, 15–22 (1918) ((Translated from German)).
35. Washburn, E. W. The dynamics of capillary flow. Phys. Rev. 17, 273–283 (1921).
36. McWhorter, D. B. & Sunada, D. K. Exact integral solutions for two-phase flow. Water Resour. Res. 26(3), 399–413 (1990).
37. Schmid, K. S., Geiger, S. & Sorbie, K. S. Semianalytical solutions for cocurrent and countercurrent imbibition and dispersion of
solutes in immiscible two-phase flow. Water Resour. Res. 47(2), W02550 (2011).
38. Hu, Q., Ewing, R. P. & Dultz, S. Low pore connectivity in natural rock. J. Contam. Hydrol. 133, 76–83 (2012).
39. Liu, H. H., Rutqvist, J. & Berryman, J. G. On the relationship between stress and elastic strain for porous and fractured rock. Int.
J. Rock Mech. Min. Sci. 46(2), 289–296 (2009).
40. Carman, P. C. Flow of Gases Through Porous Media (Butterworths Scientific Publications, Oxford, 1956).
41. Mirzaei-Paiaman, A. & Ghanbarian, B. A new methodology for grouping and averaging capillary pressure curves for reservoir
models. Energy Geosci. 2(1), 52–62 (2020).
42. Mirzaei-Paiaman, A. & Ghanbarian, B. A note on dynamic rock typing and TEM-function for grouping, averaging and assigning
relative permeability data to reservoir simulation models. J. Nat. Gas Sci. Eng. 87, 103789 (2020).
43. Ma, S., Morrow, N. R. & Zhang, X. Generalized scaling of spontaneous imbibition data for strongly water-wet systems. J. Petrol.
Sci. Eng. 18, 165–178 (1997).
44. Mason, G. & Morrow, N. R. Developments in spontaneous imbibition and possibilities for future work. J. Petrol. Sci. Eng. 110,
268–293 (2013).
45. Ji, L., Lin, M., Jiang, W. & Wu, C. An improved method for reconstructing the digital core model of heterogeneous porous media.
Transp. Porous Media 121(2), 389–406 (2018).
46. Vogel, H. J. Topological Characterization of Porous Media. In Morphology of Condensed Matter 75–92 (Springer, Berlin, 2002).
47. MacMinn, C. W., Dufresne, E. R. & Wettlaufer, J. S. Fluid-driven deformation of a soft granular material. Phys. Rev. X 5(1), 011020
(2015).
48. Moeendarbary, E. et al. The cytoplasm of living cells behaves as a poroelastic material. Nat. Mater. 12(3), 253–261 (2013).
49. Lai, W. M., Hou, J. S. & Mow, V. C. A triphasic theory for the swelling and deformation behaviors of articular cartilage. J. Biomech.
113, 245 (1991).
50. Yang, M. & Taber, L. A. The possible role of poroelasticity in the apparent viscoelastic behavior of passive cardiac muscle. J. Biomech.
24(7), 587–597 (1991).
51. Dumais, J. & Forterre, Y. Vegetable dynamicks”: the role of water in plant movements. Annu. Rev. Fluid Mech. 44, 453–478 (2012).
52. Wang, C. Y., Manga, M., Shirzaei, M., Weingarten, M. & Wang, L. P. Induced seismicity in Oklahoma affects shallow groundwater.
Seismol. Res. Lett. 88(4), 956–962 (2017).
53. Manga, M. et al. Changes in permeability caused by transient stresses: Field observations, experiments, and mechanisms. Rev.
Geophys. 50(2), RG2004 (2012).
54. McCormack, K. A. & Hesse, M. A. Modeling the poroelastic response to megathrust earthquakes: a look at the 2012 Mw 7.6 Costa
Rican event. Adv. Water Resour. 114, 236–248 (2018).
55. Rumble, J. R., Lide, D. R. & Bruno, T. J. CRC Handbook of Chemistry and Physics: A Ready-Reference Book of Chemical and Physical
Data, 2018–2019 99th edn. (CRC Press, Boca Raton, 2018).
56. Stallman, R. W. Multiphase Fluids in Porous Media: A Review of Theories Pertinent to Hydrologic Studies (US Government Printing
Office, Washington, 1964).
57. Ringrose, P. S. & Meckel, T. A. Maturing global CO2 storage resources on offshore continental margins to achieve 2DS emissions
reductions. Sci. Rep. 9(1), 1–10 (2019).
58. IEA. Carbon Capture and Storage: The Solution for Deep Emissions Reductions (International Energy Agency Publications, Paris,
2015).
59. Lemmon, E. W. & Jacobsen, R. T. Viscosity and thermal conductivity equations for nitrogen, oxygen, argon, and air. Int. J. Ther-
mophys. 25(1), 21–69 (2004).
60. Yan, W., Zhao, G. Y., Chen, G. J. & Guo, T. M. Interfacial tension of (methane+ nitrogen)+ water and (carbon dioxide+ nitrogen)+
water systems. J. Chem. Eng. Data 46(6), 1544–1548 (2001).
Scientific Reports | (2021) 11:3328 | https://doi.org/10.1038/s41598-021-82236-x 10
Vol:.(1234567890)www.nature.com/scientificreports/
Acknowledgements
We thank Stephen Talman from the GeoREF RG2 group for helping us with the initial version of lab equipment
design, and Michael Doschak from OMX Imaging Services for his guidance on micro-CT image processing. The
authors also acknowledge the financial support of the NSERC/Energi Simulation Industrial Research Consortia
on Reservoir Geomechanics.
Author contributions
A.H. designed the research, conducted the experiments, analyzed the data, and wrote the first manuscript. R.C.
helped with developing the idea for the study. M.J.B. contributed to data analysis and revising the manuscript.
K.H. contributed to some laboratory experiments. S.G. contributed to data analysis and revising the manuscript.
All authors reviewed the manuscript.
Competing interests
The authors declare no competing interests.
Additional information
Supplementary Information The online version contains supplementary material available at https://doi.
org/10.1038/s41598-021-82236-x.
Correspondence and requests for materials should be addressed to A.H.H.
Reprints and permissions information is available at www.nature.com/reprints.
Publisher’s note Springer Nature remains neutral with regard to jurisdictional claims in published maps and
institutional affiliations.
Open Access This article is licensed under a Creative Commons Attribution 4.0 International
License, which permits use, sharing, adaptation, distribution and reproduction in any medium or
format, as long as you give appropriate credit to the original author(s) and the source, provide a link to the
Creative Commons licence, and indicate if changes were made. The images or other third party material in this
article are included in the article’s Creative Commons licence, unless indicated otherwise in a credit line to the
material. If material is not included in the article’s Creative Commons licence and your intended use is not
permitted by statutory regulation or exceeds the permitted use, you will need to obtain permission directly from
the copyright holder. To view a copy of this licence, visit http://creativecommons.org/licenses/by/4.0/.
© The Author(s) 2021
Scientific Reports | (2021) 11:3328 | https://doi.org/10.1038/s41598-021-82236-x 11
Vol.:(0123456789)You can also read