Genome Analysis and Replication Studies of the African Green Monkey Simian Foamy Virus Serotype 3 Strain FV2014 - MDPI
←
→
Page content transcription
If your browser does not render page correctly, please read the page content below
viruses
Article
Genome Analysis and Replication Studies of the
African Green Monkey Simian Foamy Virus Serotype
3 Strain FV2014
Sandra M. Fuentes 1,† , Eunhae H. Bae 1,2,† , Subhiksha Nandakumar 1,3,† , Dhanya K. Williams 1,4
and Arifa S. Khan 1, *
 1    Laboratory of Retroviruses, Division of Viral Products, Office of Vaccines Research and Review, Center for
      Biologics Evaluation and Review, U.S. Food and Drug Administration, Silver Spring, MD 20993, USA;
      sandra.fuentes@fda.hhs.gov (S.M.F.); eunhaebae@gmail.com (E.H.B.); subhikshananda@gmail.com (S.N.);
      dhanya.williams@fda.hhs.gov (D.K.W.)
 2    Current Address: Ross University School of Medicine, Miramar, FL 33027, USA
 3    Current Address: Marie-Josée and Henry R. Kravis Center for Molecular Oncology, Memorial Sloan
      Kettering Cancer Center, New York, NY 10065, USA
 4    Present Address: Office of Device Evaluation, Center for Devices and Radiological Health, U.S. Food and
      Drug Administration, Silver Spring, MD 20993, USA
 *    Correspondence: arifa.khan@fda.hhs.gov; Tel.: +1-240-402-9631
 †    These authors contributed equally to this work.

 Received: 30 December 2019; Accepted: 1 April 2020; Published: 6 April 2020

 Abstract: African green monkey (AGM) spumaretroviruses have been less well-studied than other
 simian foamy viruses (SFVs). We report the biological and genomic characterization of SFVcae_FV2014,
 which was the first foamy virus isolated from an African green monkey (AGM) and was found to
 be serotype 3. Infectivity studies in various cell lines from different species (mouse, dog, rhesus
 monkey, AGM, and human) indicated that like other SFVs, SFVcae_FV2014 had broad species and
 cell tropism, and in vitro cell culture infection resulted in cytopathic effect (CPE). In Mus dunni (a
 wild mouse fibroblast cell line), MDCK (Madin-Darby canine kidney cell line), FRhK-4 (a fetal rhesus
 kidney cell line), and MRC-5 (a human fetal lung cell line), SFVcae_FV2014 infection was productive
 resulting in CPE, and had delayed or similar replication kinetics compared with SFVmcy_FV21 and
 SFVmcy_FV34[RF], which are two Taiwanese macaque isolates, designated as serotypes 1 and 2,
 respectively. However, in Vero (AGM kidney cell line) and A549 (a human lung carcinoma cell
 line), the replication kinetics of SFVcae_FV2014 and the SFVmcy viruses were discordant: In Vero,
 SFVcae_FV2014 showed rapid replication kinetics and extensive CPE, and a persistent infection was
 seen in A549, with delayed, low CPE, which did not progress even upon extended culture (day 55).
 Nucleotide sequence analysis of the assembled SFVcae_FV2014 genome, obtained by high-throughput
 sequencing, indicated an overall 80–90% nucleotide sequence identity with SFVcae_LK3, the only
 available full-length genome sequence of an AGM SFV, and was distinct phylogenetically from other
 AGM spumaretroviruses, corroborating previous results based on analysis of partial env sequences.
 Our study confirmed that SFVcae_FV2014 and SFVcae_LK3 are genetically distinct AGM foamy virus
 (FV) isolates. Furthermore, comparative infectivity studies of SFVcae_FV2014 and SFVmcy isolates
 showed that although SFVs have a wide host range and cell tropism, regulation of virus replication is
 complex and depends on the virus strain and cell-specific factors.

 Keywords: simian foamy virus; spumaretrovirus; serotype; high-throughput sequencing; replication
 kinetics; cytopathic effect; reverse transcriptase activity

Viruses 2020, 12, 403; doi:10.3390/v12040403                                        www.mdpi.com/journal/viruses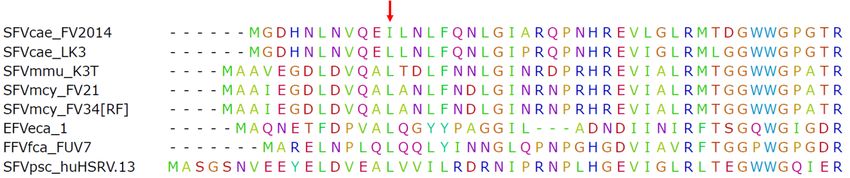
Viruses 2020, 12, 403                                                                                2 of 16

1. Introduction
     Early isolates of simian foamy viruses (SFVs), which belong to the recently described genus
Simiispumavirus in the subfamily Spumaretrovirinae and family Retroviridae [1], were distinguished based
on serotyping using neutralization assays. SFVcae_FV2014, previously known as SFV strain FV2014,
isolated from the kidney tissue of an African green monkey (Chlorocebus aethiops), was designated as
Type III [2] because it was serotypically distinct from other simian spumaretroviruses available at that
time, which were SFV Type I and Type II, isolated from Taiwanese macaques (Macaca cyclopis) [3,4].
Subsequently, SFV strain LK3 was isolated from a lymphoblastoid cell line, established from a lymph
node of a healthy C. aethiops [5] and designated as SFV serotype 3 based on sequence relatedness in
hybridization experiments to the SFV Type III isolate FV2014 [6]. Unlike spumaretroviruses from
macaque species, the number of reported foamy virus isolates from African green monkey (AGMs) are
limited to FV2014 and LK3 [1]. The full-length sequence of SFV-3 strain LK-3 (referred to as SFV-3; [7])
was found to be more similar to SFV Type I than to the human foamy virus (subsequently found to
be of chimpanzee origin [8]; current designation SFVpsc_huHSRV.13). Later, phylogenetic analysis
based on short fragments in env obtained by DNA PCR amplification of 22 AGM spumaretrovirus
sequences indicated diversity in AGM viruses and placed LK-3 and SFV-3/SFVcae_FV2014 on distinct
branches of AGM spumaretroviruses [9]. It should be noted that in an earlier study [5], sera obtained
from an SFVcae_LK3-infected AGM did not neutralize SFVcae_FV2014, and serum against the latter
virus did not neutralize SFVcae_LK3. These results indicate that the serotype of SFVcae_LK3 needs to
be further verified.
     The high diversity of sequences in SFVs cocirculating with their host species is generally thought to
be a result of intraspecies superinfection [10], and there is also evidence of interspecies virus infections
and recombination. We have reported that the Taiwanese macaque isolate SFVmcy_2 (SFV serotype II,
now referred to as SFVmcy_FV34[RF]), is a recombinant virus, which contains sequences in the env/SU
region similar to SFVcae_LK3 (referred to as SFVagm-3; [11]). Additionally, Blochmann et al. reported
isolation of SFVmac-R289hybAGM (currently designated as SFVmmu-R289hybAGM[RF]) from a
rhesus macaque, which also had a similar recombination in env involving an AGM spumaretrovirus [12].
Since SFVs cocirculate and cospeciate with their hosts and are generally located in distinct geographical
regions [8], foamy virus (FV) transmission and recombination may occur due to exposure of different
NHP species in holding facilities during importation or handling in biomedical research facilitates and
in zoos. Furthermore, human infections with FVs from various NHP species, including macaques and
AGMs, have occurred due to occupational exposure in North America and in natural settings in Africa
and Asia [8].
     To study viral interactions of spumaretroviruses from different monkey species and potential for
cross-species human infections, our laboratory previously developed well-characterized virus stocks
of SFVs isolated from macaques [13,14]. In this study we describe the preparation and characterization
of an SFVcae_FV2014 virus stock. Molecular and biological analysis showed that SFVcae_FV2014 is
phylogenetically distinct from the AGM isolate SFVcae_LK3; furthermore, SFVcae_FV2014 had distinct
replication kinetics from the macaque viruses, SFVmcy_FV21 and SFVmcy_FV34, based on infectivity
studies using a variety of cell lines from different species.

2. Materials and Methods

2.1. Virus Preparation
     SFV type 3 strain FV2014, an isolate from an African green monkey (grivet monkey kidney) [2],
was obtained from American Type Culture Collection (ATCC, Manassas, VA, USA; catalogue number
VR-218, lot 3W, titer 104.25 per 0.2 mL in A-72 (canine tumor) cells; 8 days). The virus passage history
provided by ATCC (host cells × number of passages) was: rabbit kidney (RabK) × 4, grivet monkey
kidney (Grivet MkK) × 3, RabK × 10, primary rabbit kidney (PrRabK) × 1, and A-72 canine tumor cell
line × 2 (ATCC CRL-1542).
Viruses 2020, 12, 403 3 of 16
A laboratory virus stock was prepared in Mus dunni cells, which were previously found to
be highly susceptible to SFV replication [14]. Infected cells were grown until the cell culture was
terminated due to extensive cytopathic effect (CPE) at passage 4 (day 11 after infection). Supernatant
was collected and clarified by low speed centrifugation (1200 rpm for 10 min at 4 ◦ C; GH-3.8 Swinging
Bucket Rotor, Allegra 6KR Centrifuge, Beckman Coulter Life Sciences, Indianapolis, IN, USA) prior to
filtration (0.45-µm-pore-size test tube top filter units; Corning, Cambridge, MA, USA). Aliquots were
prepared for storage at −80 ◦ C. The 50% tissue culture infective dose (TCID50 ) of the SFVcae_FV2014
virus stock was determined in MRC-5 cells using ten-fold dilutions with read-out for CPE on day
14 [15].
SFVmcy_FV21 and SFVmcy_FV34[RF], which were originally isolated from Macaca cyclopis [3,4],
were obtained from ATCC (catalogue number VR-276, FV21, lot 5 WE and catalogue number VR-277,
FV-34, lot 5 WE, respectively). The passage history at ATCC (host cells × number of passages) for
SFVmcy_FV21 was: PrRabK × 13, KB (subline of HeLa) × 1, LLC-MK2 (normal rhesus monkey
kidney) × 7, KB × 1, normal rat kidney × 2, Hep2 × 3 and A-72 × 2; and for SFVmcy_FV34[RF] was:
PrRabK × 13, KB × 2, normal rat kidney × 2, and A-72 × 2. Viruses were amplified with low passage
(< 5 or about < 15 days) in the M. dunni cell line [14]. Virus stocks were prepared when extensive
CPE occurred, and reverse transcriptase (RT) activity was determined using a modified single-tube
fluorescent product-enhanced RT assay (STF-PERT) [16], described in Section 2.3. The virus titer
(TCID50 ) was determined in MRC-5 cells at day 14: SFVmcy_FV21 virus stock was 105.5 TCID50 per
mL and SFVmcy_FV34[RF] was 105.03 TCID50 per mL.
2.2. PCR Assays and Copy Number Standard
Detection of SFVmcy_FV21 and SFVmcy_FV34[RF] sequences was based on the
previously described PCR assay using Set B outer and inner primer sets from the long
terminal repeats (LTR) region [14]. The outer primer pair consisted of forward primer
50 -CAGTGAATTCCAGAATCTCTTC-30 and reverse primer 50 -CACTTATCCCACTAGATGGTTC-30 ,
and the inner primer pair consisted of forward primer 50 -CCAGAATCTCTTCATACTAACTA-30 and
reverse primer 50 -GATGGTTCCCTAAGCAAGGC-30 . The PCR conditions were modified: 95 ◦ C 3 min,
95 ◦ C 3 min, 95 ◦ C 1 min, 55 ◦ C 1 min, and 72 ◦ C 1 min, for 35 cycles with extension 72 ◦ C 10 min and
4 ◦ C hold.
For detection of SFVcae_FV2014 sequences, primers were selected from the LTR-gag region
of the full-length genome (Genbank accession number MF582544) using Primer-Blast (NCBI, NLM,
National Institutes of Health, Bethesda, MD, USA). The outer primers were designated as SFVcae-F3
(5’-TGTTTGAGTCTCTCCAGGCTT-3’ extending from nucleotide position 1365 to 1385) and SFVcae-R3
(5’-CCATCTGTCATGCGAAGTCC-3’; nucleotide position 1937 to 1918), which amplified a 573 bp
fragment. The inner primers were designated as SFVcae-F2 (5’-TAATGGGCAATGGCAATGCTT-3’;
nucleotide position 1452 to 1472) and SFVcae-R2 (5’-TCTCTGTGATTGGGTTGTCTAGC-3’; nucleotide
position 1910 to 1888), which amplified a 459 bp fragment. The first amplification was performed in
100 µL volume using 3 U of the Taq DNA polymerase (Roche Applied Science, Mannheim, Germany,
catalogue number 11647679001) with 0.5 µM final concentration of the outer primer set and 250 ng of
total cell DNA (QIAamp DNA Blood Mini Kit, Qiagen, Germantown, MD, USA) or 2 ng cDNA, prepared
using Superscript VILO cDNA synthesis kit (Life technologies, Cat no. 11754) and cleaned using Zymo
Research’s DNA clean and concentrator kit (catalogue number D4013). The second amplification was
performed using the inner primer set and 10 µL PCR product from the first amplification in a total
volume of 100 µL. For both amplifications, the conditions for the PCR were: 95 ◦ C for 1 min, 55 ◦ C for
1 min, and 72 ◦ C for 1 min for 35 cycles. Initial denaturation was done at 95 ◦ C for 3 min and the final
extension at 72 ◦ C for 10 min. Specificity of the LTR-gag PCR assays was determined by testing the
three SFV isolates: The LTR PCR assay detected both SFVmcy_FV21 and SFVmcy_FV34[RF], whereas
the LTR-gag PCR assay was specific for detection of SFVcae_FV2014.Viruses 2020, 12, 403 4 of 16
The SFVcae_FV2014 LTR-gag fragment amplified using the outer primer pair was cloned and a
copy number standard was made by spiking ten-fold dilutions of the DNA, ranging in the background
of 0.25 µg cellular human genomic DNA (Roche, catalogue number 1169111200). Limit of detection for
the second amplification was 10-100 copies.
Gag primers used for confirmation of sequence variants (described in Section 2.4.1) were
SFV-3-F-1592 (5’-GTGAAAGGAATTGTGTA-3’) and SFV-3-R-2425 (5’-GAAGATGATGCAATAGG-3’)
(covering the region extending from nucleotide positions 1592-2425). PCR amplification was performed
in a total volume of 50 µL containing 2 ng cDNA, 0.5 µM of each oligo, 0.8mM dNTP mixture, 1×
TaKaRa Ex Taq Buffer, and 5 U of TaKaRa Ex Taq (Clontech, catalogue number RR001A). PCR conditions
were: 98 ◦ C 3 min, 98 ◦ C 10 s, 58 ◦ C 1 min, and 72 ◦ C 1 min, for 35 cycles with extension 72 ◦ C 10 min
and 4 ◦ C hold.
2.3. Infectivity Analysis
Replication kinetics of SFVcae_FV2014, SFVmcy_FV21, and SFVmcy_FV34[RF] were compared
using cell lines originating from different species and tissues shown in Table 1.
Table 1. Cell lines used in infectivity studies.
Cell Name Source Host Species Tissue Origin Cell Type
Mus dunni [14] wild mouse tail fibroblast
MDCK (NBL-2) ATCC, CCL-34 dog kidney epithelial
FRhK-4 ATCC, CRL-1688 rhesus macaque fetal, kidney epithelial
Vero ATCC, CCL-81 African green kidney epithelial
monkey
MRC-5 ATCC, CCL-171 human lung, fetal fibroblast,
diploid
A549 ATCC, CCL-185 human lung, carcinoma epithelial
Cells used in this study originated from cell banks used in our other SFV infectivity studies
(unpublished; [14]). MDCK, MRC-5, and Vero were grown in Eagle’s minimum essential medium
(EMEM) and M. dunni, FhRK-4, and A549 were grown in Dulbecco’s modified Eagle medium (DMEM).
All media were supplemented with 10% fetal bovine serum (GE Healthcare Hyclone, Logan, Utah,
catalogue number SH30071.03; heat inactivated 56 ◦ C for 30 min), 100 U of penicillin per mL, 100 µg of
streptomycin per mL (Quality Biological, Gaithersburg, MD, USA; catalogue number 120-095-721),
and 2 mM l-glutamine (Quality Biological; catalogue number 118-084-721). In addition, EMEM was
also supplemented with 1 mM sodium pyruvate (Quality Biological; catalogue number 116-079-721)
and 0.1 mM minimum non-essential amino acids (MEM-NEAA, Quality Biologicals, catalogue number
116-078-721).
SFV infection was carried out according to our laboratory’s standard protocol. Cells were planted
in 25 cm2 flasks 24 h prior to infection and virus (193 TCID50 ) was added at 50–70% cell confluence.
The number of cells planted were: M. dunni, 250,000; MDCK, 333,000; Vero, FRhK-4, A549; and MRC-5,
500,000. The cell passage at time of infection was: A549, p86; Vero, p129; MRC-5, p29; M. dunni, p45;
FRhK-4, p45; and MDCK, p65). The optimum cell numbers were determined for each cell line and
a low multiplicity of infection (approximate 0.0002–0.00045) was used. This was determined based
on the most sensitive cell line in order to obtain differences in the replication kinetics for all of the
viruses in the different cell lines. Cells were transferred to 75 cm2 flasks upon reaching confluence and
passaged every 3–4 days. Filtered supernatant (0.45-µm-pore-size test tube top filter units; Corning,
Cambridge, MA, USA) was collected and stored at −80 ◦ C at each passage. Cultures were terminated
at 4+ CPE (>75% cell death) or at day 30 to day 55, in case of slow or no CPE. Virus replication was
monitored by microscopic observation of CPE progression in the cell monolayer and by determining
the RT activity in filtered supernatant using a modified STF-PERT assay [16], in which the RT and
the PCR steps were done in two steps, instead of using the one-step published protocol due to theViruses 2020, 12, 403 5 of 16
discontinuation of AmpliWax PCR Gem 50. The assay was performed as described previously except
that the RT reaction was done in the first step and then the PCR reaction mix was added immediately
for the second step in the assay. All the samples collected from infectivity studies in one cell line were
tested in duplicate or triplicate in the modified STF-PERT assay to compare kinetics of virus replication.
Uninfected cells were set-up in parallel as control.
2.4. Preparation of Viral Nucleic Acid, Sequencing, and Bioinformatics Analysis
2.4.1. High-Throughput Sequencing
Virus was concentrated by ultracentrifugation (45,000 rpm for 90 min at 4 ◦ C; Rotor TLA-45,
Beckman Coulter Optima MAX-XP Ultracentrifuge) or by using a Nanosep 30KD Omega Device (P/N
OD030C33) with centrifugation at 5000× g for 20 min 4 ◦ C. RNA was extracted using QIAamp Viral
RNA Mini Kit (catalogue number 52904).
Viral nucleic acid prepared from SFVcae_FV2014 virus stock was sequenced using the MiSeq
Illumina platform (CD Genomics, Shirley, NY, USA) as previously described [17], and a consensus
virus sequence (SFVcae_FV2014 GenBank accession number MF582544) was generated by mapping
the raw reads to the SFVcae_LK3 full-length genome as reference [7] (NCBI RefSeq accession number
M74895). Default parameters were used for mapping: the length fraction (the minimum percentage of
the total alignment length that must match the reference sequence at the selected similarity fraction)
was set to be 0.5, and the similarity fraction (the minimum percentage identity between the aligned
region of the read and the reference sequence) was set to be 0.8. The long terminal repeats (LTRs)
were mapped separately using the same default mapping parameters to generate a complete and
full-length consensus genome sequence of SFVcae_FV2014. Sequences in low-coverage regions were
confirmed by virus-specific PCR assays. Open reading frames were identified using ORF Finder
(https://www.ncbi.nlm.nih.gov/orffinder/).
Viral nucleic acid was prepared from filtered supernatant of SFVcae_FV2014-infected Vero cells at
culture termination (day 15) for high-throughput sequencing using Illumina Hi-Seq (FDA/CBER Core
Lab). The total numbers of quality, paired-end reads were 342,517,062 and the average read length was
99.2 bases. Sequence analysis was performed using CLC Genomics Workbench software, version 10.1.1
(CLC bio, Aarhus, Denmark). The sequence from SFVcae_FV2014 (accession number MF582544) was
used as reference for the mapping. The default parameters were used, with the exception of length
fraction and similarity fraction, which were set at 0.8 and 0.9, respectively.
To find virus variants, the reads were remapped using the SFVcae_FV2014 consensus sequence as
the reference genome. Fixed ploidy variant detection analysis was done using the default setting with
the noise threshold set at 10% and variant probability cutoff ≥35%, based on the known error rate of the
Illumina sequencing platform [18]. Unaligned tail analysis helped to identify the previously reported
splicing events in tas, bet, and env regions [19,20]. Ambiguous positions and splice sites were confirmed
by PCR amplification and Sanger sequencing of gel-purified fragments (QIAquick gel extraction kit;
Qiagen, catalogue number 28714).
2.4.2. Sanger Sequencing
Sanger sequencing was used to confirm virus infection and HTS sequence results. Viral nucleic acid
was extracted from SFVcae_FV2014 virus stock and cDNA synthesis done as described in Section 2.4.1.
Total DNA was extracted from virus supernatant to confirm virus infection by PCR amplifications as
described in Section 2.2. PCR fragments were analyzed on a 0.6% agarose gel and the expected size
fragment was extracted and purified using QIAquick gel extraction kit (Qiagen, catalogue number
28714) for Sanger sequencing (CBER Core Facility).Viruses 2020, 12, 403 6 of 16
2.5. Sequence Comparison and Phylogenetic Analysis
Comparative nucleotide sequence analyses and amino acid analyses were done for full-length,
individual viral genes, and LTR with MegAlign (DNASTAR Lasergene, Inc. Madison, WI, USA) using
the ClustalW method. Accession numbers for SFV sequences used in the analysis are shown in Table 2.
Table 2. Simian foamy virus (SFV) isolates used for phylogenetic analysis and sequence alignments.
Virus Previous Designation Species of Virus Isolation Accession Number 1
SFVmcy-1,
SFVmcy_FV21 Taiwanese macaque NC_010819
(SFV serotype I)
SFVmcy-2,
SFVmcy_FV34[RF] Taiwanese macaque KF026286
(SFV serotype II)
SFVmmu_K3T SFVmmu-K3T Rhesus macaque KF026288
SFVmmu_R289HybAGM[RF] SFV-R289HybAGM Rhesus macaque JN801175
SFVcae_FV2014 SFV 3 African green monkey MF582544
(SFV serotype III)
SFVcae_LK3 SFVagm-3 African green monkey NC_010820
SFVcae_agm4 agm4 African green monkey AJ244075
SFVcae_agm5 agm5 African green monkey AJ244067
SFVcae_agm20 agm20 African green monkey AJ244091
SFVcae_agm24 agm24 African green monkey AJ244090
SFVpve SFVcpz Chimpanzee NC_001364
SFVpsc_huHRSV.13 HFV Chimpanzee KX08159
SFVggo SFVgor Gorilla HM245790
BFVbta BFV Cow NC_001831
EFVeca_1 EFVeca Equine AF201902
FFVfca_FUV7 FFVfca Feline Y08851
1 GenBank or NCBI Reference Sequence.
To compare the amino acid sequence of the SFVcae_FV2014 Gag at nucleotide position 1857 with
the Gag of other foamy viruses, the Gag amino acid sequences from SFVcae_LK3, SFVmmu_K3T,
SFVmcy_FV21, SFVmcy_FV34[RF], SFVpsc_huHRSV.13, EFVeca_1, FFVfca_FUV7, and SFVcae_FV2014
(accession numbers in Table 2) were aligned using ClustalW (MegAlign Pro DNASTAR Lasergene
v.15).
Phylogenetic trees were generated based upon the nucleotide sequences in the entire env gene
and in the SU region of env using MEGA7.0.14 (Molecular Evolutionary Genetics Analysis; www.
megasoftware.net) as previously described [11]. The list of viruses and accession numbers used in the
analysis is shown in Table 2. Briefly, nucleotide sequences were aligned in MEGA using ClustalW. The
maximum-likelihood method based on the general time reversible model was chosen because it had the
lowest Bayesian information criteria score in a model test performed in MEGA. The bootstrap consensus
tree inferred from 1000 replicates was taken to represent the evolutionary history of the taxa analyzed.
Branches corresponding to partitions reproduced in less than 50% bootstrap replicates are collapsed.
The initial tree for the heuristic search was obtained automatically by applying neighbor-joining and
BioNJ algorithms to a matrix of pairwise distances estimated using the maximum-composite-likelihood
(MCL) approach and then selecting the topology with the superior log likelihood value. A discrete
gamma distribution was used to model evolutionary rate differences among sites. All positions
containing gaps and missing data were eliminated.
3. Results
3.1. Characterization of SFVcae_FV2014 Virus Stock
A virus stock of SFVcae_FV2014 was prepared and characterized for molecular and biological
studies. The original virus from ATCC was amplified, similar to our other laboratory stocks of SFVs, in
M. dunni with low passage (Viruses 2020, 12, 403 7 of 16
found to produce a large number of extracellular virus particles compared to other cell lines [14]. Virus
titer was 104.5 per mL in MRC-5 cells [21].
Illumina MiSeq was used to determine viral sequences in the SFVcae_FV2014 virus stock. The
consensus sequence was published [17]. Further analysis indicated the presence of a variant in gag at
nucleotide position 1857: the variant frequency of A was 52% (represented in the consensus sequence)
and T was 48%. This result was confirmed by Sanger sequencing. Interestingly, further passage of virus
Viruses
by 2019, 11, x M.
inoculating FORdunni
PEER cells
REVIEWwith the SFVcae_FV2014 virus stock indicated increased frequency 7ofofthe 17
T variant (82%) at culture termination, which corresponded to extensive CPE and peak RT activity. The
of the
one T variant
nucleotide (82%)resulted
change at culture
in atermination,
conservativewhich
amino corresponded to extensive
acid mutation from CPE
isoleucine and peak
to leucine RT
in the
activity. The one nucleotide change resulted in a conservative amino acid mutation from
consensus sequence of SFVcae_FV2014 located in the coiled-coil CC1 domain of the Gag protein. It is isoleucine
to leucine
noted that in
thethe consensus
leucine residuesequence
is highlyofconserved
SFVcae_FV2014 located in the coiled-coil
in spumaretroviruses (Figure 1).CC1 domain of the
Gag protein. It is noted that the leucine residue is highly conserved in spumaretroviruses (Figure 1).
Figure 1. SFVcae_FV2014
Figure 1. SFVcae_FV2014 variant. Amino acid
variant. Amino acid sequence
sequence alignment
alignment for
for N-terminal
N-terminal Gag
Gag protein
protein amino
amino
acids.
acids. The
The Gag
Gag sequences
sequencesfrom
fromdifferent
differentfoamy
foamyviruses
viruses(FVs) were
(FVs) werealigned using
aligned ClustalW.
using TheThe
ClustalW. firstfirst
50
amino acids of the alignment are shown. The red arrow points to the position of the conserved
50 amino acids of the alignment are shown. The red arrow points to the position of the conserved leucine
in the CC1 domain of Gag; the change to isoleucine is indicated in the box.
leucine in the CC1 domain of Gag; the change to isoleucine is indicated in the box.
The certificate of analysis for the original ATCC stock indicated that it was contaminated with
The certificate of analysis for the original ATCC stock indicated that it was contaminated with
Mycoplasma hominis. However, the bioinformatics analysis of the MiSeq data for our laboratory
Mycoplasma hominis. However, the bioinformatics analysis of the MiSeq data for our laboratory stock
stock prepared in M. dunni did not show sequences mapping to M. hominis (NCBI accession number
prepared in M. dunni did not show sequences mapping to M. hominis (NCBI accession number
NC_013511; data not shown), thus indicating the absence of mycoplasma contamination in the
NC_013511; data not shown), thus indicating the absence of mycoplasma contamination in the
SFVcae_FV2014 virus used in our infectivity studies.
SFVcae_FV2014 virus used in our infectivity studies.
3.2. Studies of SFVcae_FV2014 Replication
3.2. Studies of SFVcae_FV2014 Replication
Infectivity studies were done to compare the biological properties of SFVcae_FV2014 and SFV
Infectivity
macaque isolates,studies were done and
SFVmcy_FV21 to compare the biologicalToproperties
SFVmcy_FV34[RF]. of SFVcae_FV2014
remove differences and SFV
due to previous
macaque isolates,
propagation SFVmcy_FV21
of the viruses andhost
in different SFVmcy_FV34[RF]. To stocks
species, all the virus remove differences
were generateddue to previous
by low-passage
propagation of the viruses in different host species, all the virus stocks were
in M. dunni cells. The kinetics of virus replication were determined using a low virus amount generated by low-
(193
passage in M. dunni cells. The kinetics of virus replication were determined using
TCID50 ), which was previously determined to allow virus propagation without early termination bya low virus amount
(193 TCIDCPE.
extensive 50), which was previously determined to allow virus propagation without early termination
Cell lines from different host species and cell types were included to determine the
by extensive CPE.
influence of host onCell linesof
kinetics from
SFVdifferent hostVirus
replication. species and cell was
replication typesevaluated
were included
based toondetermine
development the
influence
and of host
progression on kinetics
of CPE of and
in the cells SFVthe replication.
increase inVirus
the RTreplication was evaluated
activity produced based
in cell-free cultureon
development and progression of CPE in the cells and the increase in the RT activity produced
supernatant. The results from one of two studies are shown in Figure 2 (panels A–F): similar replication in cell-
free culture
kinetics weresupernatant.
seen in both.The results from one of two studies are shown in Figure 2 (panels A–F):
similar
In replication kinetics2A),
M. dunni (Figure wereSFVmcy_FV21
seen in both. and SFVmcy_FV34[RF] showed similar and rapid
replication: RT activity was initially seen in both SFVmcy isolates at day 4, which increased significantly
(about 1000-fold) at day 8, resulting in culture termination due to extensive CPE. A delay in replication
kinetics was seen with SFVcae_FV2014, where the initial RT activity and CPE was detected at day
8, which increased to a high level by day 15, and the culture was terminated due to extensive CPE.
However, a similar level of RT activity was seen for the three viruses at culture termination (4–8 × 10⁶
pU per µL). In MDCK cells, SFV viruses had similar kinetics as in M. dunni except virus production
was about a log lower for SFVmcy viruses (Figure 2B).Viruses 2020, 12, 2019,
Viruses 403 11, x FOR PEER REVIEW 8 of 17 8 of 16
(A) Mus dunni
9 10 6
7 10 6
RT activity (pU/ L)
5 10 6
3 10 6
1 10 6
1 10 4
5 10 3
0
0
2
4
6
8
10
12
14
16
0
2
4
6
8
10
12
14
16
Days
SFVmcy_FV21 +++
SFVmcy_FV34 +++
SFVcae_FV2014 + ++ +++
RT activity (pU/ L)
RT activity (pU/ L)
0
2
4
6
8
10
12
14
16
18
20
22
24
26
28
30
0
2
4
6
8
10
12
14
16
18
20
22
24
26
28
30
32
(F) A549
9 10 6
7 10 6
RT activity (pU/ L)
RT activity (pU/ L)
5 10 6
3 10 6
1 10 6
1 10 3
5 10 2
0
0
2
4
6
8
10
0
2
4
6
8
10
12
14
16
18
28
33
38
43
48
53
58
Days
SFVmcy_FV21 + +++
SFVmcy_FV34 + ++ +++ ++++
SFVcae_FV2014 + +
Figure 2. Kinetics of SFV replication. The kinetics of virus replication for SFVcae_FV2014 (N) were
compared Figure
with 2. Kinetics of SFV replication.
SFVmcy_FV21 The kinetics of virus
(•) and SFVmcy_FV34 () replication
in variousforcellSFVcae_FV2014 () were species
lines from different
compared
(A) M. dunni; (B)with
MDCK;SFVmcy_FV21
(C) FRhK-4; () and
(D)SFVmcy_FV34 () in and
Vero; (E) MRC-5; various
(F)cell
A459linescells.
from Uninfected
different species
cells were
(A) M. dunni; (B) MDCK; (C) FRhK-4; (D) Vero; (E) MRC-5; and (F) A459 cells. Uninfected cells were
the negative control (H). Data from one of two independent studies are shown. Virus replication was
the negative control (). Data from one of two independent studies are shown. Virus replication was
determined based upon virus production in cell-free supernatant using the PERT assay (reported as
determined based upon virus production in cell-free supernatant using the PERT assay (reported as
pU/µL RT activity)
pU/μL and by
RT activity) andvisualization of cytopathic
by visualization of cytopathiceffect
effect(CPE) development
(CPE) development in in
thethe
cellscells (reported as:
(reported
+ for upas:
to+25%
for upcell monolayer
to 25% affected;
cell monolayer ++, ++,
affected; upup
toto50%
50%monolayer affected;
monolayer affected; +++;+++;
up toup75%toaffected
75% affected
cells; and ++++,
cells; > 75%
and ++++, > 75% of cell
of cell monolayeraffected).
monolayer affected). SFVmcy_FV21
SFVmcy_FV21 infection in M.in
infection dunni was terminated
M. dunni was terminated
at 3+ CPE due to insufficient cells for further passage. For comparison, the reverse transcriptase (RT)
activity shown in the segmented Y-axis of the graph has the same Y-maximum value, although different
cell lines had varied peak RT. The segmented, linear Y-axis shows the virus input and low-level RT
activity on the bottom segment and the peak RT activity on the top segment. Error bars represent the
SEM of virus supernatant samples tested in triplicate (M. dunni, MDCK, and MRC-5) or duplicate
(Vero, FRhK-4, and A549) in the PERT assay. All samples from one cell line were tested in the same
PERT assay.Viruses 2020, 12, 403 9 of 16
Notable differences in replication of SFVmcy and SFVcae viruses were seen in the simian cell lines.
In the FRhK-4 cells (Figure 2C), SFVmcy_FV21 and SFVcae_FV2014 had similar kinetics of replication
with initial RT detection at day 8 and culture termination due to extensive CPE on day 17, with about
similar levels of RT activity (1–5 × 10⁵ pU per µL). Interestingly, SFVmcy_FV34[RF] had greatly delayed
kinetics of replication: A very low level of RT activity was detected on day 8, which increased slowly
but remained significantly low even at time of culture termination (about 75-fold lower); furthermore,
there was also a delay in CPE progression, which was initially detected on day 17 but did not progress
to extensive cell lysis even at day 30, when the experiment was terminated. In Vero cells (Figure 2D),
the kinetics of replication for SFVcae_FV2014 were similar to M. dunni cells: with initial RT activity
seen at day 6, with a fairly rapid and high increase in RT activity at time of culture termination on day
13 (about 3 × 10⁶ pU per µL). Unexpectedly, the replication of the SFVmcy viruses was significantly
delayed compared to SFVcae, with low RT and slow CPE progression: In the case of SFVmcy_FV21,
RT activity could be initially detected on day 6 and progressed slowly, and was detected above input
background on day 11, increasing at a low level until culture termination on day 32, with RT activity <
2 × 10³ pU per µL. RT was not detected with infection of Vero using SFVmcy_FV34[RF]; although CPE
was seen starting at day 11, no progression was seen during the culture period ending on day 32, at the
time of experiment termination.
All three SFVs had rapid replication kinetics in MRC-5 cells (Figure 2E) although SFVmcy_FV21 had
earlier culture termination at day 7 with 3- to 4-fold less RT activity compared with SFVmcy_FV34[RF]
and SFVcae_FV2014, which had similar replication kinetics with culture termination on day 10 with
high RT activity (about 106 pU per µL). SFV infection of A549 cells (Figure 2F) showed differences
in replication kinetics between the different viruses: SFVmcy_FV21-induced CPE progressed more
rapidly with culture termination on day 11, whereas CPE progressed slower with SFVmcy_FV34[RF]
with culture termination on day 18, although for both viruses, CPE was seen at day 8 and the RT activity
was initially detected on day 6. Very slow kinetics of replication were seen with SFVcae_FV2014:
a low-level RT activity was seen at day 29 with a low peak on day 34, which decreased on day 41,
the next time point tested, and again increased on day 55, at culture termination, and the RT activity
above input was seen only at day 34 and also at day 55, when the experiment was terminated; low
CPE was seen at day 39 and thereafter, but without progression.
Virus infection in Vero cells was confirmed for SFVmcy_FV21 and SFVmcy_FV34[RF] by PCR
amplification of DNA prepared from cells collected on day 34 (Figure 3A, lane 1 and 2, respectively).
Specific virus detection was verified by a second round of PCR amplification using internal primers,
and virus identity was confirmed by nucleotide sequence analysis of the fragments from the first PCR
amplification assays.
Viruses 2019, 11, x FOR PEER REVIEW 10 of 17
Detection
Figure 3. Figure of SFV
3. Detection of sequences
SFV sequencesbybyDNA
DNA PCR analysis.
PCR analysis. DNA DNA prepared
prepared at from
at day 34 day 34 from
SFVmcy_FV21-
SFVmcy_FV21- and SFVmcy_FV34[RF]-inoculated
and SFVmcy_FV34[RF]-inoculated Vero
Vero cells(panel
cells (panel A,
A,lanes
lanes1 and
1 and2, respectively)
2, respectively) was
was analyzed using LTR primer sets (outer for 1st amplification and inner for second amplification).
analyzed using LTR primer sets (outer for 1st amplification and inner for second amplification). DNAs
DNAs prepared from SFVcae-FV2014-inoculated A549 cells at day 34 and day 55 (panel B; lanes 3
prepared from
and 4,SFVcae-FV2014-inoculated A549LTR-gag
respectively) were analyzed using cells atouter
day and
34 and
innerday 55 (panel
primer sets. DNAB; lanes
from 3 and 4,
respectively) were analyzed
uninoculated using
cells was LTR-gag
obtained outer
from each cell and inner
line (day 34)primer sets. asDNA
and included from
negative uninoculated
control (lanes cells
U). from each cell line (day 34) and included as negative control (lanes U).
was obtained
Virus infection in A549 cells was investigated by DNA PCR analysis of cells collected at day 34
and day 55 (Figure 3B, lanes 3 and 4, respectively). The results indicated an increase in
SFVcae_FV2014 sequences with passage due to detection in the first round of PCR at day 55 but only
in the second amplification with the day 34 sample. Virus identity was confirmed by nucleotide
sequence analysis of the fragment obtained in the first PCR amplification at day 55.Viruses 2020, 12, 403 10 of 16
Virus infection in A549 cells was investigated by DNA PCR analysis of cells collected at day 34
and day 55 (Figure 3B, lanes 3 and 4, respectively). The results indicated an increase in SFVcae_FV2014
sequences with passage due to detection in the first round of PCR at day 55 but only in the second
amplification with the day 34 sample. Virus identity was confirmed by nucleotide sequence analysis of
the fragment obtained in the first PCR amplification at day 55.
3.3. SFVcae_FV2014 Genome Analysis
3.3.1. Structure and Sequence Comparison
The genomic organization of the assembled SFVcae_FV2014 genome [17] was found to be similar
to other SFVs: It had the expected structural genes (gag, pol, and env) and accessory (tas and bet) genes,
an internal promoter, and long terminal repeats (LTRs) [8]. An 18-bp primer binding site (PBS) was
identified at position 1713 to utilize the tRNALys1,2 isoacceptor for initiation of minus-strand DNA
synthesis of spumaviruses [22]. The complete genomic sequence of SFVcae_FV2014 with alignment to
the SFVcae_LK3 sequence is shown in Figure S1 and summarized in Table 3. The size of the gag and
pol regions in SFVcae_FV2014 were the same as those in SFVcae_LK3, encoding 643 amino acid Gag
and 1143 amino acid Pol proteins, respectively. There was also a 52 bp overlap between gag and pol
and between pol and env in both viruses. However, there were differences in the size of env, tas, and bet,
which resulted in a difference in size of encoded proteins between SFVcae_FV2014 and SFVcae_LK3.
The env encoded a protein containing four additional amino acids in SFVcae_FV2014, which did not
affect the reading frame (986 aa). The tas region of SFVcae_FV2014 had an early stop codon resulting in
a 296 aa protein as compared to 298 aa for the Tas in SFVcae_LK3. An insertion of nucleotide A in
position 11703 resulted in SFVcae_FV2014 having a longer Bet (504 aa) compared to SFVcae_LK3 (469
aa) and to the SFVmcy_FV21 and SFVmcy_FV34[RF] (497 aa and 308 aa, respectively).
Table 3. Comparison of genomic structures of SFVcae isolates.
SFVcae_FV2014 SFVcae_LK3
Viral Regions Location 1 ORF 3 Location 1 ORF 3
LTR/gene 2 LTR/gene 2
LTR 1–1710 1710 1–1708 1708
gag 1827–3758 1932 643 1825–3756 1932 643
pol 3706–7137 3432 1143 3704–7135 3432 1143
env 7085–10045 2961 986 7083–10031 2949 982
tas 10,015–10,905 891 296 10,001–10,897 897 298
10,015–10,285, 10,001–10,271,
bet 1515 504 1410 469
10,581–11,824 10,567–11,705
LTR 11,418–13,127 1710 11,404–13,111 1708
1 nucleotide position; 2 number of nucleotides; 3 number of amino acids.
Comparative sequence analysis indicated that SFVcae_FV2014 and SFVcae_LK3 had an overall
sequence identity of about 70% to 90%, with the highest identity in the LTR, pol, tas, and bet regions
(Table 4). Interestingly, in env there was high nucleotide and amino acid sequence identity in LP and
TM, but only about 71% nucleotide and 67% amino acid identity in the SU region. SFVcae_FV2014
sequences were also compared with SFVmcy_FV21 and recombinant viruses SFVmcy_FV34[RF]
and SFVmmu_R289HybAGM, which were previously found to have 77% amino acid identity to
SFVcae_LK3 in the SU region (designated as SFVagm-3 in previous study; [11]). An overall sequence
identity of 50–85% was seen, with the lowest being in the LTR, gag, tas, and bet regions. In env,
the lowest was observed in the SU region, however, interestingly, SFVmcy_FV21 had about 74%
sequence identity with SFVcae_FV2014, which was slightly higher than that seen between the two
SFVcae viruses. Similarity plot analysis (Simplot) and BootScan analysis in Simplot did not indicate
recombination in sequences of SFVmcy_FV21 or SFVcae_FV2014 (data not shown).Viruses 2020, 12, 403 11 of 16
Table 4. Sequence comparison of SFVcae_FV2014 and different SFV isolates.
SFV Isolates % Sequence Identity
LTR gag pol env env-LP env-SU env-TM tas bet
SFVcae_LK3 nt 88.71 81.5 86.3 79.1 79.6 71.1 86.6 90.2 88.8
aa 85.4 91.6 81.5 86.5 67.3 93.9 91.3 88.5
SFVmcy_FV21 nt 66.9 68.1 81.7 75.0 71.4 73.8 77.0 66.1 61.8
aa 65.8 86.1 78.2 73.0 73.5 84.8 52.2 51.4
SFVmcy_FV34(RF) nt 65.8 68.8 81.9 75.0 72.2 69.1 76.6 65.4 64.4
aa 66.7 86.3 78.2 73.8 63.2 83.9 52.5 50.9
SFVmmu_R289(RF) nt 67.6 69.6 81.5 73.4 73.8 68.3 77.8 66.7 62.2
aa 67.6 86.4 74.5 76.2 63.7 85.3 53.7 51.2
1 Numbers are percent identity using the ClustalW alignment option in MegAlign (DNASTAR Lasergene).
To further analyze the relatedness of SFVcae_FV2014 in the SU region with other SFVs that are
available only as a partial sequence, a BLASTN search of the GenBank nt/nr database was done.
SFVcae_FV2014 had between 71–78% nucleotide sequence identity and between 68–81% amino acid
similarity with the other SFV sequences from AGM (data not shown). Some of these (SFVcae_agm4,
SFVcae_agm5, SFVcae_agm20, and SFVcae_agm24) were selected as representative sequences of
clusters A–D [9] in the phylogenetic analysis discussed below.
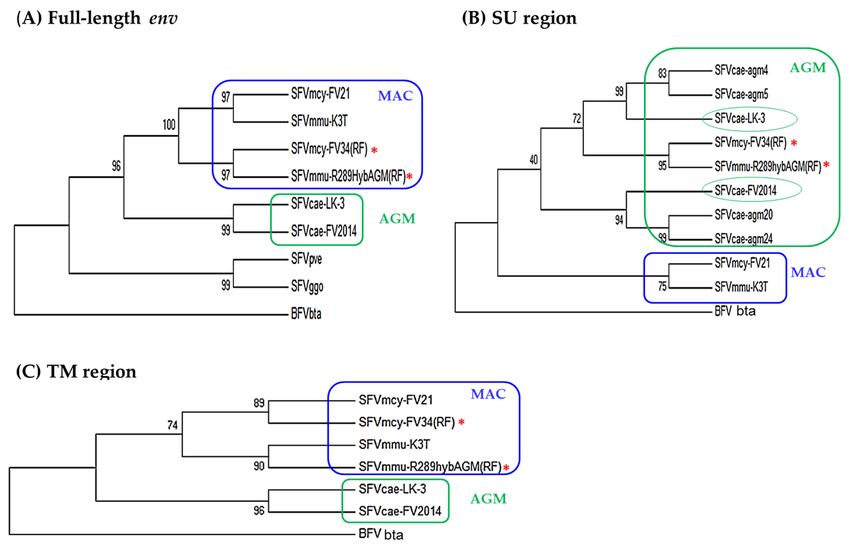
3.3.2. Phylogenetic Analysis
Analysis of the evolutionary relatedness of the nucleotide sequences in LTR, gag, pol, tas,
and bet showed that SFVcae_FV2014 and SFVcae_LK3 branched together and clustered with the
macaque isolates, which included SFVmcy_FV21 and SFVmcy_FV34[RF] branched together, and the
SFVmmu_R289HybAGM[RF] on a separate branch (data not shown). To evaluate the differences seen
in SFV sequence identity in the LP, SU, and TM regions of env (Table 3), phylogenetic analyses were done
in the full-length env and its subregions. This included SFVmmu_K3T, a naturally-occurring rhesus
macaque virus isolated in our laboratory and in the SU region, also sequences from other AGM SFVs
(SFVcae_agm4, SFVcae_agm5, SFVcae_agm20, and SFVcae_agm24). Constructed trees of the full-length
env, SU, and TM regions are shown in Figure 4; results in the LP are not shown since they were similar
to the TM. Analysis in env indicated the AGM viruses SFVcae_LK3 and SFVcae_FV2014 were branched
together and clustered with the macaque isolates where SFVmcy_FV21 and SFVmmu_K3T branched
together and SFVmcy_FV34[RF] and SFVmmu-R289HybAGM[RF] branched together. A difference in
branch results was seen when analysis was done in the env subregions. In TM, SFVs branched with
their monkey species: SFVmcy and SFVmmu were clustered on different branches and SFVcae isolates
branched together. Similar results were seen in LP. However, in the SU region, although all of the SFVs
from AGM were clustered together and the SFVs from macaques were clustered together, SFVcae-LK3
and SFVcae_FV2014 did not branch together and were grouped separately, along with different
SFVcae_agm sequences: SFVcae_agm4 and SFVcae_agm6 with SFVcae_LK3 and SFVcae_agm20 and
SFVcae_24 with SFVcae_FV2014 [9]. Interestingly, SFVmcy_FV34[RF] and SFVmmu-R289HybAGM[RF]
branched together in a third group in the AGM cluster, further corroborating recombination in their
SU region with SFV sequences from AGM [11,12].in LP. However, in the SU region, although all of the SFVs from AGM were clustered together and
the SFVs from macaques were clustered together, SFVcae-LK3 and SFVcae_FV2014 did not branch
together and were grouped separately, along with different SFVcae_agm sequences: SFVcae_agm4
and SFVcae_agm6 with SFVcae_LK3 and SFVcae_agm20 and SFVcae_24 with SFVcae_FV2014 [9].
Interestingly, SFVmcy_FV34[RF] and SFVmmu-R289HybAGM[RF] branched together in a third
Viruses 2020, 12, 403 12 of 16
group in the AGM cluster, further corroborating recombination in their SU region with SFV
sequences from AGM [11,12].
Figure 4. Phylogenetic analysis of SFV env. Results are shown for the nucleotide sequence in:
Figure 4. Phylogenetic analysis of SFV env. Results are shown for the nucleotide sequence in: (A) full-
length env, usingenv,
(A) full-length 2900using 2900inpositions
positions in the final
the final dataset; dataset;
(B) SU region(B) SU1305
using region using in
positions 1305
thepositions
final in the
final dataset; and (C) TM region using 1242 positions in the final data set. The accession
dataset; and (C) TM region using 1242 positions in the final data set. The accession numbers of the numbers of the
virus sequences used for the analysis are shown in Table 2. BFVbta was used as
virus sequences used for the analysis are shown in Table 2. BFVbta was used as the outgroup for all the outgroup for all the
trees.
the TheThe
trees. percentage
percentage ofof
replicate
replicatetrees
treesininwhich
whichthe
theassociated
associated taxa
taxa clustered
clustered together in the
together in the bootstrap
bootstrap
test (1000test (1000 replicates)
replicates) are shown are shown
next tonext
the to the branches.
branches. ColorColor indicates
indicates thethe clustering
clustering ofof AGM(green) and
AGM
(green) and MAC
MAC (blue) (blue)
isolates isolates
based on based
analysison analysis of indicated
of indicated regionsregions
in env. in env. Recombinant
Recombinant virusvirus is
is indicated with
indicated with
an asterisk. an asterisk.
4. Discussion
Previous analysis of spumaretroviruses in AGMs has focused on investigating intraspecies genetic
diversity based on sequence analysis in the env/SU region [9]. The results showed prevalence of
SFV strains that were divided into two phylogenetically diverged groups, each comprising distinct
clusters (group 1 contained clusters A and B; group 2 contained clusters C and D). Furthermore,
SFVcae_LK3 (designated as SFV-3/LK-3 in the reference paper) belonged to group 1 but was distinct
from sequences in clusters A and B, whereas SFVcae_FV2014 (designated as SFV-3 in the reference
paper) was an outlier and was divergent from both groups 1 and 2. In the present study we obtained
the full-length genomic sequence of SFVcae_FV2014 and showed that it is a genetically distinct virus
from SFVcae_LK3. The sequence differences between these SFV isolates might be due to distinct FV
strains circulating in the AGMs in different geographical regions [23,24]. Although specific information
about monkey origin is not available, it is reported that SFVcae_FV2014 was isolated from a grivet
monkey kept in New York, USA [2], whereas other FV sequences in groups 1 and 2 were obtained
from AGMs caught in the wild in Kenya and singly-housed in Freiburg, Germany [9]. Furthermore,
SFVcae_LK3 was isolated from an AGM housed in Freiburg, Germany, but exposed to other AGMs
and rhesus macaques during captivity [5]. Additionally, it is noted that SFVcae_LK3 was isolated from
lymphoblastoid cells whereas the other sequences in groups 1 and 2 were PCR-amplified from kidney
tissue. The phylogenetic differences in AGM SFV sequences from naturally-occurring viruses and the
laboratory-isolates highlight the need for evaluating the biological properties of natural SFV isolatesViruses 2020, 12, 403 13 of 16
along with laboratory strains for developing relevant in vitro models to investigate SFV replication in
NHPs and their potential for intra-, inter-, and cross-species virus transmission.
The large number of studies demonstrating broad distribution of SFVs in Old World and New
World NHPs and species-specific prevalence of SFV strains have been based on sequence analysis of
genomic regions [8,24–34]. Whole-genome analysis of some isolates has shown that genetically-diverse
SFV strains circulating in different NHP species have contributed to the generation of recombinant
viruses involving the SU region in env [11,12,35]. It is noted that sequence variation in SU was initially
characterized in feline foamy viruses [36]. However, there is a lack of information regarding the
biological properties of SFV strains that could be potential parent sequences involved in generation of
recombinant viruses. We previously identified that SFVmcy_FV34[RF], isolated from M. cyclopis, was a
recombinant virus with >90% overall nucleotide sequence identity to SFVmcy_FV21 (also isolated
from the same monkey species), except in the SU region, which had about 76% nucleotide sequence
identity to SFVcae_LK3, an AGM isolate [11]. Since recombination between viruses depends on
the ability of two viruses to superinfect or coinfect the same species and replicate in the same cell
type, we have investigated the biological properties of SFVmcy_FV34[RF] and its potential parent
viruses SFVmcy_FV21 and SFVcae_FV2014, which had overall 80–90% nucleotide sequence identity
to SFVcae_LK3. Cell lines from a range of different host species, tissues, and cell types were used to
evaluate the host range and replication kinetics. To minimize variability in the virus preparations,
the virus stocks were prepared in a similar manner and infectious titer obtained using the same assay.
A low virus titer was used for infection to differentiate replication kinetics. As expected, there was
productive infection with CPE in the fibroblastic cell lines [37,38], although higher virus production
(RT activity) was seen in M. dunni [14] than in MRC-5. Furthermore, SFVcae_FV2014 had slightly
slower replication kinetics in M. dunni compared with the SFVmcy viruses, whereas no difference was
seen in MRC-5. Since all three viruses in the study were isolated from kidney tissue, kidney epithelial
cell lines from rhesus monkey, AGM, and dog were included. Different kinetics of virus replication
were seen: In MDCK cells, all three SFVs had rapid replication with CPE; in FRhK-4, SFVcae_FV2014
and SFVmcy_FV21 had similar rapid kinetics with CPE, whereas SFVmcy_FV34 had delayed kinetics
ending in only 3+ CPE at day 30; in Vero only SFVcae_FV2014 showed rapid replication with CPE
whereas SFVmcy_FV21 had delayed replication kinetics (3+ CPE at day 32) and SFVmcy_FV34 had a
persistent infection without CPE progression (confirmed by PCR) until the culture was terminated on
day 32. It should be noted that in our earlier study in Vero, SFVmcy_FV34 (then called SFV-2) showed
low RT activity around day 30 but the lot of virus and infection titer used was different [14]. In the
human lung carcinoma A549 epithelial cells, both SFVmcy viruses had productive infections with
CPE, however, SFVcae_FV2014 had a persistent infection without CPE progression even on long-term
culture (>50 days), although break-through low level RT activity was seen on day 33 and 55. It was
noted that SFVcae_FV2014, SFVmcy_FV21, and SFVmcy_FV34[RF] had broad host ranges and infected
all of the cell lines in the study, however, each had distinct replication kinetics except in MRC-5. This
may be due to the MRC-5 cells being a diploid cell line whereas the others were continuous cell lines
or because the viruses were titered in MRC-5. Further studies are needed to evaluate FV replication
in primary tissues and cell cultures, diploid cells, and continuous cell lines to determine the relevant
in vitro infectivity model that can accurately reflect in vivo infection.
The infectivity results in this study confirmed SFVs have a broad host range and further showed
that regulation of virus replication post-entry is complex, depending on specific virus–host interactions.
These results emphasize the need to study the biological properties of different SFV strains within a
species to investigate their potential for replication and recombination as well as intra- and cross-species
transmission. It is noted that a limitation of the current study is using SFVs that have an in vitro
passage history in cell lines of different host species and cell types, however, FV genomes seem to be
relatively stable and are therefore not expected to mutate in vitro or in vivo at a high rate like other
retroviruses [9]. We are further investigating potential for SFV mutations in vitro by sequence analysis
of viral genomes in productive and chronic infections.Viruses 2020, 12, 403 14 of 16
Rapid replication of SFVcae_FV2014 was seen in Vero, however, a persistent infection was seen with
SFVmcy_FV34[RF]. Since the SU region in the latter is related to the AGM viruses, the results suggest
that sequences outside the SU may be involved in regulation of virus replication. We are currently
investigating virus–host interactions to determine factors that could be important determinants of
virus replication and virus latency. The overall results from the infectivity studies suggest a complex
mechanism of regulation of SFV replication.
Transcription of SFVmcy_FV21 and SFVcae_LK3 (previously designated as SFV-1 and SFV-3) has
been shown to be cell-line dependent [39] and productive, persistent infection of hematopoietic cells
by SFV psc_huHRSV.13 (previously designated as HFV) has been reported [37]. Latently infected
cultures with SFV have been established from epithelial cells [40–42] and lymphoblastoid cells [43].
Furthermore, in vivo SFV infection is widespread throughout the animal but remains generally latent
except in the oral tissues [44]. Furthermore, recent in vivo studies have confirmed in vivo replication
in oropharyngeal tissues [45] and further identified that it is limited to the short-lived differentiated
epithelial cells [46]. Our infectivity studies analyzing the replication kinetics of three SFVs in different
cell lines from various species indicates that virus replication is dependent on the virus strain and
interaction of virus-specific sequences with host-specific factors is an important determinant of outcome
of infection. Studies are underway with naturally-occurring SFV strains from rhesus macaques to
identify the virus–host interactions involved in SFV replication.
Supplementary Materials: The following are available online at http://www.mdpi.com/1999-4915/12/4/403/s1,
Figure S1. Nucleotide sequence alignment of SFVcae_FV2014 and SFVcae_LK3. Sequences were aligned using
EMBOSS Stretcher version 6.6.0 using default parameters (http://www.ebi.ac.uk/Tools/psa/emboss_stretcher/help/
index-nucleotide.html). Nucleotide positions are indicated. Vertical lines indicate identical bases and dots indicate
different bases. The LTRs, gag, pol, env, tas, and bet regions are indicated. The TATA, poly A+ signal, and poly A+
sites are underlined in the LTRs. The 3 nucleotides for the start and termination codons of genes are shown in
red. The TATA in tas is underlined and the start site of the internal promoter (IP) is indicated by an arrow. The
regulatory signals are indicated based upon homology to the SFVcae_LK3 sequence [7].
Author Contributions: A.S.K. conceived and designed the experiments. E.H.B., S.N., S.M.F., and D.K.W. conducted
the experiments. All authors contributed to writing and reviewing the manuscript. All authors have read and
agreed to the published version of the manuscript.
Acknowledgments: All funding for the project was received by the U.S. Food and Drug Administration.
Conflicts of Interest: The authors declare no conflict of interest.
References
1. Khan, A.S.; Bodem, J.; Buseyne, F.; Gessain, A.; Johnson, W.; Kuhn, J.H.; Kuzmak, J.; Lindemann, D.;
Linial, M.L.; Lochelt, M.; et al. Spumaretroviruses: Updated taxonomy and nomenclature. Virology 2018, 516,
158–164. [CrossRef] [PubMed]
2. Stiles, G.E.; Bittle, J.L.; Cabasso, V.J. Comparison of simian foamy virus strains including a new serological
type. Nature 1964, 201, 1350–1351. [CrossRef] [PubMed]
3. Johnston, P.B. A second immunologic type of simian foamy virus: Monkey throat infections and unmasking
by both types. J. Infect. Dis. 1961, 109, 1–9. [CrossRef] [PubMed]
4. Johnston, P.B. Strain fv-21 of simian foamy virus type 1 was cloned and sequenced after isolation from the
taiwan monkey macaca cyclopsis. J. Microbiol. Immunol. Infect. 2000, 33, 60–61.
5. Neumann-Haefelin, D.; Rethwilm, A.; Bauer, G.; Gudat, F.; zur Hausen, H. Characterization of a foamy
virus isolated from cercopithecus aethiops lymphoblastoid cells. Med. Microbiol. Immunol. 1983, 172, 75–86.
[CrossRef]
6. Schweizer, M.; Corsten, B.; Neumann-Haefelin, D. Heterogeneity of primate foamy virus genomes. Arch.
Virol. 1988, 99, 125–134. [CrossRef]
7. Renne, R.; Friedl, E.; Schweizer, M.; Fleps, U.; Turek, R.; Neumann-Haefelin, D. Genomic organization and
expression of simian foamy virus type 3 (sfv-3). Virology 1992, 186, 597–608. [CrossRef]
8. Pinto-Santini, D.M.; Stenbak, C.R.; Linial, M.L. Foamy virus zoonotic infections. Retrovirology 2017, 14, 55.
[CrossRef]Viruses 2020, 12, 403 15 of 16
9. Schweizer, M.; Schleer, H.; Pietrek, M.; Liegibel, J.; Falcone, V.; Neumann-Haefelin, D. Genetic stability
of foamy viruses: Long-term study in an african green monkey population. J. Virol. 1999, 73, 9256–9265.
[CrossRef]
10. Liu, W.; Worobey, M.; Li, Y.; Keele, B.F.; Bibollet-Ruche, F.; Guo, Y.; Goepfert, P.A.; Santiago, M.L.;
Ndjango, J.-B.; Neel, C.; et al. Molecular ecology and natural history of simian foamy virus infection in
wild-living chimpanzees. PLoS Pathog. 2008, 4, e1000097. [CrossRef]
11. Galvin, T.A.; Ahmed, I.A.; Shahabuddin, M.; Bryan, T.; Khan, A.S. Identification of recombination in the
envelope gene of simian foamy virus serotype 2 isolated from macaca cyclopis. J. Virol. 2013, 87, 8792–8797.
[CrossRef] [PubMed]
12. Blochmann, R.; Curths, C.; Coulibaly, C.; Cichutek, K.; Kurth, R.; Norley, S.; Bannert, N.; Fiebig, U. A
novel small animal model to study the replication of simian foamy virus In Vivo. Virology 2014, 448, 65–73.
[CrossRef] [PubMed]
13. Nandakumar, S.; Bae, E.H.; Khan, A.S. Complete genome sequence of a naturally occurring simian foamy
virus isolate from rhesus macaque (sfvmmu_k3t). Genome Announc. 2017, 5, e00827-17. [CrossRef] [PubMed]
14. Khan, A.S.; Sears, J.F.; Muller, J.; Galvin, T.A.; Shahabuddin, M. Sensitive assays for isolation and detection of
simian foamy retroviruses. J. Clin. Microbiol. 1999, 37, 2678–2686. [CrossRef]
15. Karber, G. Beitrag zur kollektiven Behandlung pharmakologischer Reihenversuche. Naunyn Schmiedebergs
Arch. Exp. Pathol. Pharmakol. 1931, 162, 480–483. [CrossRef]
16. Sears, J.F.; Khan, A.S. Single-tube fluorescent product-enhanced reverse transcriptase assay with ampliwax
(stf-pert) for retrovirus quantitation. J. Virol. Methods 2003, 108, 139–142. [CrossRef]
17. Nandakumar, S.; Bae, E.H.; Khan, A.S. Complete genome sequence of the african green monkey simian
foamy virus serotype 3 strain fv2014. Genome Announc. 2017. [CrossRef]
18. Quail, M.A.; Smith, M.; Coupland, P.; Otto, T.D.; Harris, S.R.; Connor, T.R.; Bertoni, A.; Swerdlow, H.P.; Gu, Y.
A tale of three next generation sequencing platforms: Comparison of ion torrent, pacific biosciences and
illumina miseq sequencers. BMC Genom. 2012, 13, 341. [CrossRef]
19. Saib, A.; Koken, M.H.; van der Spek, P.; Peries, J.; de The, H. Involvement of a spliced and defective human
foamy virus in the establishment of chronic infection. J. Virol. 1995, 69, 5261–5268. [CrossRef]
20. Giron, M.L.; de The, H.; Saib, A. An evolutionarily conserved splice generates a secreted env-bet fusion
protein during human foamy virus infection. J. Virol. 1998, 72, 4906–4910. [CrossRef]
21. Khan, A.S.; Kumar, D. Simian foamy virus infection by whole-blood transfer in rhesus macaques: Potential
for transfusion transmission in humans. Transfusion 2006, 46, 1352–1359. [CrossRef] [PubMed]
22. Maurer, B.; Bannert, H.; Darai, G.; Flugel, R.M. Analysis of the primary structure of the long terminal repeat
and the gag and pol genes of the human spumaretrovirus. J. Virol. 1988, 62, 1590–1597. [CrossRef] [PubMed]
23. Aiewsakun, P.; Richard, L.; Gessain, A.; Mouinga-Ondeme, A.; Vicente Afonso, P.; Katzourakis, A. Modular
nature of simian foamy virus genomes and their evolutionary history. Virus Evol. 2019, 5, vez032. [CrossRef]
[PubMed]
24. Switzer, W.M.; Salemi, M.; Shanmugam, V.; Gao, F.; Cong, M.E.; Kuiken, C.; Bhullar, V.; Beer, B.E.; Vallet, D.;
Gautier-Hion, A.; et al. Ancient co-speciation of simian foamy viruses and primates. Nature 2005, 434,
376–380. [CrossRef]
25. Feeroz, M.M.; Soliven, K.; Small, C.T.; Engel, G.A.; Andreina Pacheco, M.; Yee, J.L.; Wang, X.; Kamrul
Hasan, M.; Oh, G.; Levine, K.L.; et al. Population dynamics of rhesus macaques and associated foamy virus
in bangladesh. Emerg. Microbes Infect. 2013, 2, e29. [CrossRef]
26. Calattini, S.; Wanert, F.; Thierry, B.; Schmitt, C.; Bassot, S.; Saib, A.; Herrenschmidt, N.; Gessain, A. Modes of
transmission and genetic diversity of foamy viruses in a macaca tonkeana colony. Retrovirology 2006, 3, 23.
[CrossRef]
27. Ghersi, B.M.; Jia, H.; Aiewsakun, P.; Katzourakis, A.; Mendoza, P.; Bausch, D.G.; Kasper, M.R.;
Montgomery, J.M.; Switzer, W.M. Wide distribution and ancient evolutionary history of simian foamy
viruses in new world primates. Retrovirology 2015, 12, 89. [CrossRef]
28. Katzourakis, A.; Aiewsakun, P.; Jia, H.; Wolfe, N.D.; LeBreton, M.; Yoder, A.D.; Switzer, W.M. Discovery of
prosimian and afrotherian foamy viruses and potential cross species transmissions amidst stable and ancient
mammalian co-evolution. Retrovirology 2014, 11, 61. [CrossRef]
29. Betsem, E.; Rua, R.; Tortevoye, P.; Froment, A.; Gessain, A. Frequent and recent human acquisition of simian
foamy viruses through apes’ bites in central africa. PLoS Pathog. 2011, 7, e1002306. [CrossRef]You can also read