Event Recap Report: 02/27/10 Chile Earthquake
←
→
Page content transcription
If your browser does not render page correctly, please read the page content below
Event Recap Report:
02/27/10 Chile Earthquake

Impact Forecasting LLC
200 East Randolph Street
Chicago, IL 60601
t: 1.312.381.5919
f: 1.312.381.0181
www.aonbenfield.com
Introduction
A powerful magnitude-8.8 earthquake struck central Chile on the morning of
             th
February 27 , 2010, killing at least 550 people, injuring thousands more and
causing devastating damage. The main tremor occurred just off the coast of
Chile at 3:34 AM local time (6:34 UTC) with an epicenter 100 kilometers (60
miles) north-northwest of Chillan, Chile or 325 kilometers (200 miles)
southwest of Santiago, Chile. The temblor’s depth was measured at 35
kilometers (21.7 miles) beneath the earth’s surface. Residents close to the
epicenter reported shaking for nearly 150 seconds. Following the main
earthquake, over 200 aftershocks occurred, of which 150 of these were greater
than magnitude-5.0 and 12 were greater than magnitude-6.0. The main
earthquake shook buildings and forced evacuations in Buenos Aires, Argentina
and was felt 2,900 kilometers (1,800 miles) east from the epicenter in Sao
Paolo, Brazil. The enormity of the initial tremor even caused seiches, defined
as a standing wave in an enclosed or partially enclosed body of water, to occur
in Lake Pontchartrain near New Orleans, Louisiana. Scientists note that the
earthquake was so strong that a normal day on earth was shortened by 1.26                      Source: USGS
microseconds, and violent enough to move the city of Concepcion at least 10
feet (three meters) to the west and the capital, Santiago, about 11 inches (28 centimeters) to the west-
southwest. This is the seventh strongest earthquake ever recorded and the fifth strongest since 1900.

The figure below is a simulated spatial distribution of ground shaking from Impact Forecasting’s
catastrophe model.

  Source: Impact Forecasting

Event Recap Report: 02/27/10 Chile Earthquake                                             Page 2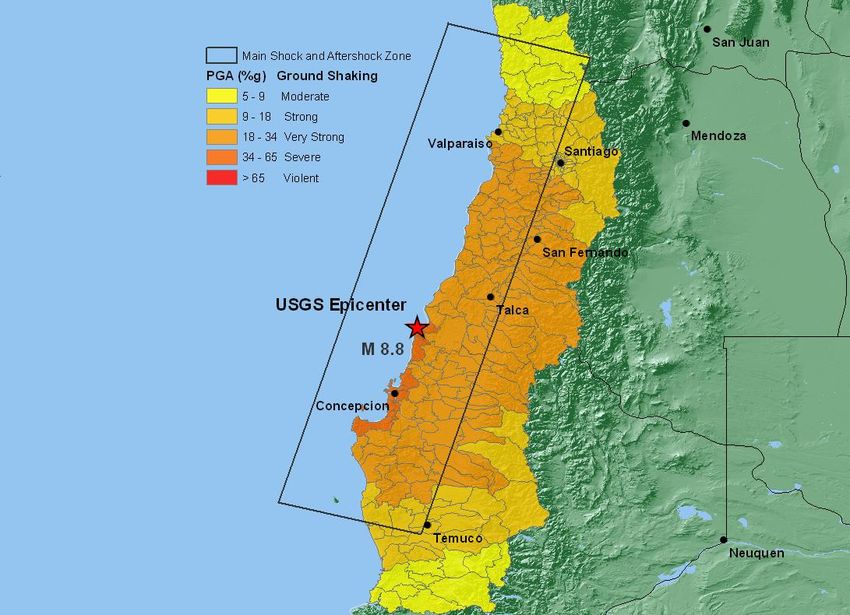
Seismological Recap
Seismicity and Tectonic Setting of Central Chile
Chile is one of the most seismically-active regions of the world, second only to Japan (Figure 1). On
average, a magnitude-8.0 earthquake occurs in Chile once every ten years. Most earthquakes in this part
of the world occur along the line where the Nazca Plate (Figures 2 and 3) slides at an angle (known as
oblique subduction) under the South American Plate. The subduction zone runs along the entire 5,000-
kilometer (3,106-mile) length of the western coastline of South America.

                                                                           As a result of pushing from the Nazca Plate, the
                                                                           South American Plate has been lifted up, creating
                                                                           the towering Andes Mountains (Figures 3 and 4).
                                                                           Chile is wedged between the Pacific Ocean
                                                                           (Nazca Plate) and the Andes Mountains. Most of
                                                                           the population lives in a narrow longitudinal valley
                                                                           (Lomnitz, SRL, 2004). Most of these valleys are
                                                                           filled with soft soils (Celebi, 1987, BSSA) that can
                                                                           amplify earthquake ground motion by a large
                                                                           factor and result in increased damage to
                                                                           populated areas.

  Figure 1: Map showing historic earthquake activity in Chile from 1990      Figure 2: Geometry of the Nazca-South America plate
  to present. The star is the 2/27/10 earthquake. Magenta line indicates     boundary zone at the latitudes of central Chile. The arrows
  the plate boundary between Nazca and South America (Credit:                indicate the motion of the Nazca plate towards South
  www.iris.edu)                                                              America (Credit: www.igp.gob.pe/geod/andespj.html)

Climate and terrain conditions of Chile make it difficult to document historical earthquakes of the past
(Lomnitz, 2004, BSSA). However, it is known that there were at least 85 destructive earthquakes with
magnitudes greater than 7.0 between 1570 and 1960, and 25 earthquakes greater than magnitude-7.0
since 1960. The May 12, 1960, magnitude-9.5 earthquake (Figure 5) in Chile was the largest earthquake
ever recorded by seismological instruments. A large area (1,000-kilometer (621-mile) long by 120-
kilometer (75-mile) down dip) of the subducting Nazca Plate slipped 20 meters (66 feet) under the South
American Plate, producing large ground motions over a large area and also a destructive tsunami. The
earthquake shaking itself killed at least 1,655 people (mainly due to collapsed buildings), while the large
tsunami waves killed an additional 2,000 people. It should be noted that the worst seismic disaster in
Chile’s history came in 1939 after a magnitude-8.3 earthquake killed 28,000 people. For reference sake,
the great Sumatran earthquake of 2004 in Indonesia was a magnitude-9.1 event that also occurred within
a subduction zone area.

Event Recap Report: 02/27/10 Chile Earthquake                                                                           Page 3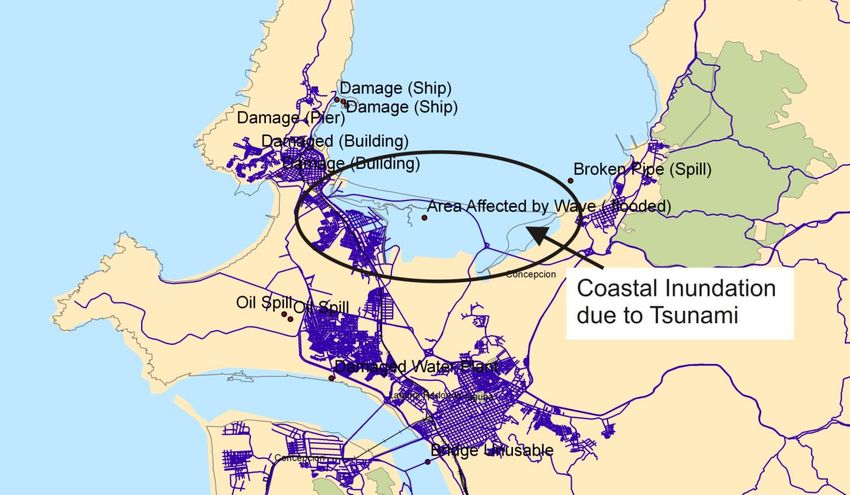
Figure 4: The convergence of the Nazca and South
Figure 3: Depiction of the area of Peru                    American Plates has deformed and pushed up
where the Nazca Plate is going under                       limestone strata to form towering peaks of the Andes
the South American Plate, causing                          Mountains. (Credit: USGS)
earthquakes under the ocean.
(Credit: web.mit.edu)

The February 27, 2010 Magnitude-8.8 Maule, Chile
Earthquake
The February 27, 2010 earthquake occurred about 230
kilometers (143 miles) north from the epicenter of the
historic May 22, 1960 magnitude-9.5 Chilean
earthquake (Figures 5 and 6). The 2010 event
occurred at a shallow depth of about 35 kilometers (22
miles) at the locked zone (shallower than 50 kilometers
(31 miles)) between the low-angle subducting Nazca
Plate and the overriding South American Plate. Based
on background seismicity and sense of fault motion
studies, the interface between the Nazca and South
American plates is seismically coupled between a
depth of 20 and 50 kilometers (12 and 31 miles), and
because of this large subduction thrust earthquakes
occur (magnitude-7.5 and above) at this depth interval
(Delouis et al., 1996; 2009). The magnitude-8.8
February 27, 2010 earthquake occurred at the younger
portion of the 5,000-kilometer (3,106-mile) subduction
zone, where the Nazca Plate dives fast with a stronger
coupling (tight sticking that causes strong friction
between the two plates) with the overriding plate. In
Figures 5 and 6, the rupture areas of the recent              Figure 5: Map showing the spatial relationship
earthquake and ensuing aftershocks are shown. The             between previously located earthquakes (1900
rupture runs nearly 500 kilometers (311 miles) in length      to present) and the 2/27/10 Chile earthquake
and 50 kilometers (31 miles) in width.                        (yellow star) and its aftershocks (yellow circles).
                                                              Also shown are the rupture zones of the 1922
                                                              1960 earthquakes (white hashed areas).
                                                              (Credit: USGS)

Event Recap Report: 02/27/10 Chile Earthquake                                                        Page 4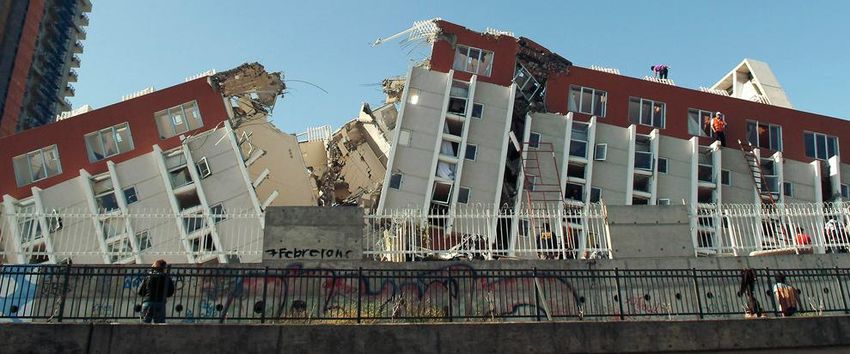
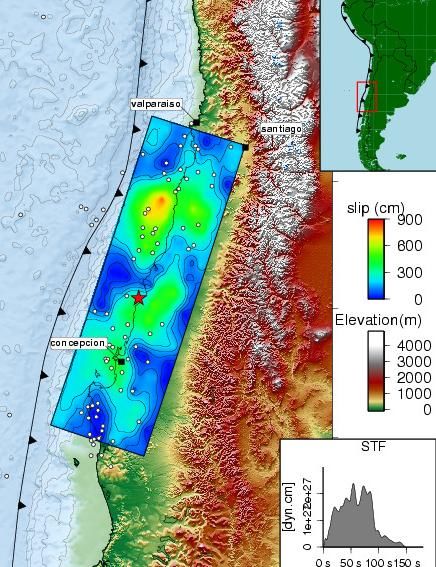
In Figures 6 and 7, a model of the rupture evolution is shown.
                                                      The colored patches represent the amount of motion (slip),
                                                      and the contours (Figure 7) represent the amount of elapsed
                                                      time since the earthquake began. This model estimates a
                                                      fault motion (rupture) of over 500 kilometers (311 miles) along
                                                      the length of the fault as well as the distance from the Earth’s
                                                      surface at depths of over 50 kilometers (31 miles). The
                                                      longest rupture lengths occurred within the first 100 seconds,
                                                      while smaller displacements continued for the next 150
                                                      seconds following the start of the earthquake.

                                                      When comparing the recent Chile earthquake with the
                                                      January 12, 2010 magnitude-7.0 earthquake in Haiti, the
                                                      maximum amount of slip on the fault during the Chile event is
                                                      only about two times more (shown in Figure 8). However, the
                                                      amount of energy released from the magnitude-8.8
                                                      earthquake is approximately 512 times more. This is a result
                                                      of the larger rupture area of the Chilean event.

 Figure 6: Surface projection of the fault plane
 slip distribution. The red star represents the
 epicenter of this event. The white dots are the
 aftershocks. The lowest inset shows that most of
 the energy is released during the first 100
 seconds (Credit: USGS and
 http://tectonics.caltech.edu/slip_history/2010_chi
 le/index.html)
                                                           Figure 7: Slip (motion) on the fault plane that produced the
                                                           magnitude-8.8 earthquake significantly lower than the magnitude-
                                                           9.5 May, 22 1960 earthquake. (Credit: http://tectonics.caltech.edu/)

Seismic Gaps and Future Seismic Hazard Predictions from Seismicity and GPS Studies
The seismic potential for large and great interplate earthquakes (earthquakes within the boundary
between two plates) along the Chilean and southern Peruvian margins of South America has been
thoroughly analyzed by scientists in the past (Ruegg et al. 2009; Nishenko, 1985). The majority of the
coastal range segments of Chile have been the site of at least one magnitude-8.0 earthquake during the
last 130 years with the exception of south central Chile region (red box inset of Figure 6). The last time
this area experienced a subduction earthquake was on February 20, 1835 (observed and reported by
Charles Darwin) with an estimated magnitude between 8.0 and 8.5 (Lomnitz, SRL, 2004). Segments that
have not experienced large earthquakes for many decades, called seismic gaps, are zones of relatively
high seismic risk for the near future and will eventually be filled by large-magnitude earthquakes
(magnitude-7.7 or larger) (Kelleher, 1972).

Event Recap Report: 02/27/10 Chile Earthquake                                                                 Page 5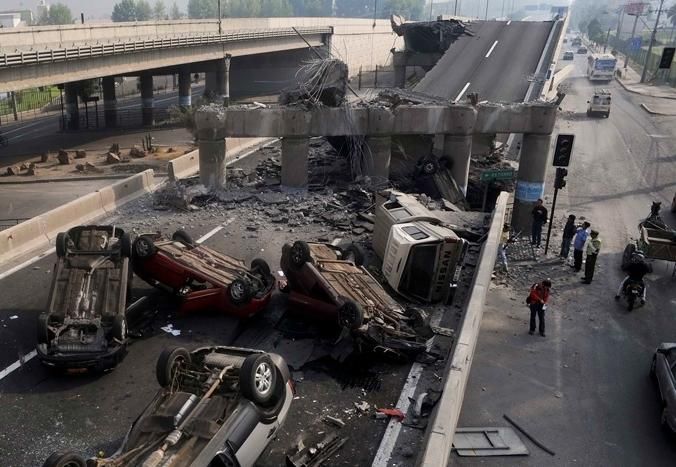
Figure 8: Amount of slip and rupture area comparisons between the February 27, 2010 Chile and the January 12, 2010 Haiti
earthquakes (Credit: USGS and Caltech).

Based on a statistical analysis of earthquake repeat times, a scientist predicted a high potential for large
earthquakes within a 20-year period (from the date of the study published in 1983) in two regions of central
Chile. The first was the Coquimbo-Illapel region, which includes the Valparaiso region (Figure 9a, just south of
the 1906 M8.6 in Figure 9b). This first prediction was fulfilled (Lomniz, 2004, GRL) by the 1985 magnitude-8.0
Valparaiso earthquake. The second predicted region of high seismic potential was the Talca-Concepción
region, located just north of the rupture zone from the May 22, 1960 earthquake and south of the rupture zones
corresponding to the 1928 Talca earthquake and the 1906 and 1985 Valparaiso earthquakes (Figures 9a and
9b). The 1939 magnitude-8.3 earthquake (Figure 9b) that affected the Coquimbo-Illapel region was ruled as a
non-typical subduction earthquake (Ruegg et al., 2009; Beck et al., 1998).

GPS observations show that the Nazca Plate is obliquely subducting at variable rates ranging from 80
millimeters (3.15 inches) per year at the location of the February 27, 2010 earthquake to 18.5 millimeters
(0.72 inches) per year to the south. Seismologists installed GPS stations to study the motion of the Nazca
Plate under the South American Plate in the second seismic gap region. These seismologists’ findings
indicated that the two plates are seismically locked at a depth of about 55 kilometers (34 miles), and this
may be the site of a future major thrust earthquake in the Biobío and Maule region of Chile. However, the
most important parameter for hazard is the slip rate, defined as the length of slip that the fault moved
divided by the number of years lapsed since the last major earthquake. For example, the May 22, 1960
magnitude-9.5 earthquake occurred after 130 years following the last major event. This provides a slip
rate of 18.5 millimeters (0.72 inches) per year, which is less than the convergence rate of the two plates at
the location of the 1960 event. Other scientists have concluded that the strains in the second seismic gap
have not been relieved since 1835 with a convergence rate of 68 millimeters (2.68 inches) per year. An
accumulated slip deficit of more than ten meters (33 feet) is large enough to produce a significant
earthquake with a magnitude greater than 8.0. The February 27, 2010 magnitude-8.8 earthquake, by
virtue of its location, qualifies as filling the second area of high seismic potential.

Event Recap Report: 02/27/10 Chile Earthquake                                                              Page 6
The rupture zone of the May 22, 1960 earthquake has the lowest potential along the margin and is
not expected to re-rupture within the next 100 years. In northern Chile, a magnitude-8.0 earthquake
occurred in 1995 near the city of Antofagasta. This region has been quiet since 1877, and the 1995
earthquake is assumed to have advanced the timing of the next great earthquake in northern Chile
(Delouis et al., 1995, BSSA).

       (a)                                                                                      (b)

  Figure 9: (a) Rupture areas (hatched) of large shallow earthquakes of central and southern Chile until 1985. The black and white balls show
  the type of fault motions. (b) Hatched areas represent estimated rupture zones of large (magnitudes greater or equal to 7.7) South American
  earthquakes of most of the 1900. Numbers in parentheses are magnitudes. The gaps between the hatched zones are future danger zones of
  earthquakes. (Credit: Astiz and Kanamori, BSSA, 1986)

Event Recap Report: 02/27/10 Chile Earthquake                                                                             Page 7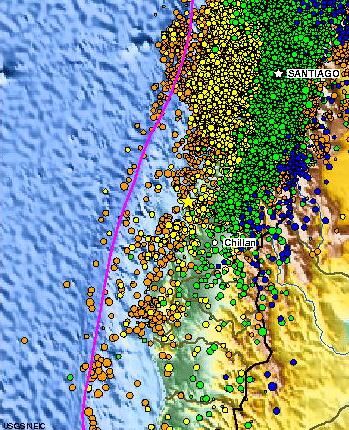
Property Effects
The Chilean government indicated that widespread extensive damage occurred and a ‘state of
catastrophe’ was declared. Chile’s National Institute of Statistics indicate that there are over 4.5 million
households in the country, and at least 1.5 million of these were damaged, over 500,000 of which were
destroyed. The quake affected over two million people across six separate regions.

Concepción
The hardest-hit region was Maule, where the majority of the fatalities occurred. In the city of Concepción,
thousands of homes and multi-story structures collapsed, cars were flattened, rubble covered streets and
several fires broke out after gas lines ruptured. According to Chilean officials, the majority of the homes
that collapsed were older buildings that were constructed with a mixture of sand, clay, straw and water.
However, one modern building in Concepción sustained major damage – a 15-story apartment building
that cracked in half shown below.

                                                                                            Source: Spreadit.org

Santiago
In the capital city of Santiago, officials noted that many of the modern-built homes, buildings and other
structures were largely unaffected due to high anti-seismic building codes following years of large
earthquakes. Nevertheless, a large number of older homes and other structures were heavily damaged –
including three hospitals, the national Fine Arts Museum, the Museum of Contemporary Art and the Divine
Providence church. Approximately 3,300 residents in Santiago were left homeless. Wall cracks, chips
and damaged façades were also noted on many government buildings and ministry headquarters.

The rest of Chile
Reports of substantial damage were also indicated in smaller towns and cities closer to the epicenter. In
the Maule capital city of Talca, hundreds of buildings crumbled as the main earthquake struck. The city’s
administrative building and the local hospital were destroyed and almost every home in the city’s center
was flattened. In Temuco, widespread damage was reported as adobe and façades fell from buildings
and crushed cars on the streets below. Additional reports of severe damage came from the towns of
Rancagua and Curico.

See Appendix A for Chile’s regions and Appendix B for a further breakdown of home and other structure
damage per city.

Event Recap Report: 02/27/10 Chile Earthquake                                                 Page 8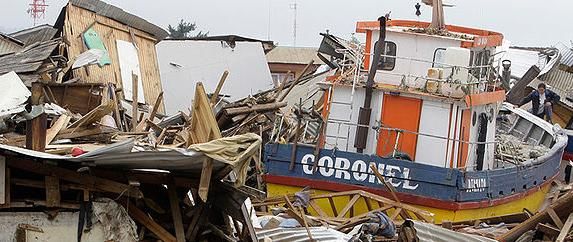
Fires Following the Main Earthquake
Several building and structure fires were reported after the initial earthquake struck. Local officials noted
that many of the fires occurred due to underground gas lines rupturing or at locations where flammable
tanks exploded. However, several fires were intentionally set by looters in the cities of Concepción,
Santiago and Chillan as well as at the El Manzano prison.

Post-Earthquake Societal Issues
Within hours following the main
                                       Source: Realtruth.org
earthquake, thousands of
looters that included residents
of Chile’s lower and middle
classes took to the streets in
the city of Concepción and
began ransacking clothing
boutiques, grocery stores,
electronic stores and ATMs.
Several looters set fire to
various businesses throughout
the city. Many people went to
Concepción’s port, where
products from damaged
storage bins were stolen. Looting was also rampant in parts of Santiago, Chillan and Talcahuano.
Once the Chilean government declared a ‘state of catastrophe,’ a dusk-to-dawn curfew was issued as
military soldiers were ordered to enter the uncontrolled cities and restore calm, bringing a quick end to
the looting as thousands of troops roamed the streets with assault rifles and dispersed tear gas. According
to police officials, door-to-door searches of city residents recovered over 1.03 billion Chilean Pesos (USD
2.0 million) in stolen goods including refrigerators, sofas, mattresses, clothing, crates of liquor and flat
screen televisions.

There remains a large disparity in terms of socioeconomics. According to Chile’s National Statistics
Institute, the top 20 percent of wage earners make an average of 1.66 million Chilean Pesos (USD 3,200)
per month, while the bottom 20 percent earn only 176,737 Chilean Pesos (USD 340) per month.

Building Codes and Types
Since Chile is located in a highly seismic region, the government has a long-established set of strict
building codes. A brief look at Chile’s building code history indicates that the first seismic codes were
established as far back as 1935. The 1972 version of the building code was revised following the
magnitude-7.8 earthquake that struck in 1985, though those updates first went into effect in 1993. The
1985 code was later updated in 1996 and 2003. Today, it is estimated that approximately three percent of
recently built buildings are not up to the current building code. However, newly built ‘essential’ facilities do
conform to the current code. Overall, about 30 percent of the total buildings in Chile are designed based
on older versions of the building code.

The most predominant construction types are masonry (reinforced, confined, or unreinforced), and
approximately 60 percent of residential buildings and 40 percent of commercial buildings are of this type.
Other residential construction types are based on wood frame, which account for nearly 20 percent of the
building stock. For highrise apartments, contractors typically use concrete, while 33 percent of
commercial buildings are built using reinforced concrete. Steel construction is used in about 15 percent of
commercial structures. Industrial buildings are typically built using steel or light metal.

Event Recap Report: 02/27/10 Chile Earthquake                                                 Page 9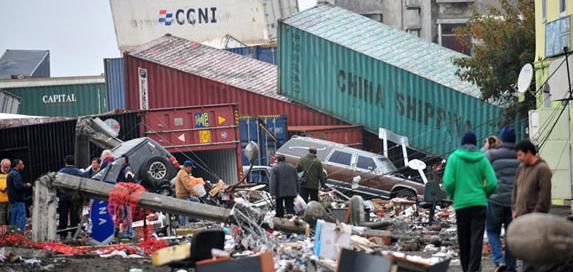
Tsunami Effects
Tsunami damage in Dichato
The Pacific Tsunami Warning
Center (PTWC) immediately
issued a Tsunami Warning for
nearly every nation bordering
the Pacific Ocean (nearly one-
quarter of the entire globe) as
the magnitude-8.8 earthquake
triggered tsunami waves. In
Chile, tsunami waves severely
impacted a 435-mile (700- Source: Wikipedia
kilometer) stretch of the
coastline. The highest
unofficial tsunami wave amplitude was recorded offshore Valparaiso, Chile at 8.6 feet (2.6 meters). The
tsunami also struck the Juan Fernandez Islands (located just off the Chilean coastline), where at least six
people were killed and 11 people were reported missing. The coastal town of Talcahuano saw significant
losses after a series of large tsunami waves left 80 percent of the town’s residents homeless. Ten
thousand homes were destroyed and hundreds more were severely damaged. The tsunami also
destroyed the town’s governing buildings as water rushed inland. In Concepción, tsunami waves flooded
coastal neighborhoods and destroyed a large number of homes and cars. Numerous large fishing boats
were also washed ashore. In Pelluhue, at least 300 homes were destroyed after an unconfirmed 18-foot
(six-meter) tsunami wave overwhelmed the small town. Village officials in Dichato reported 800 homes
destroyed after tsunami waves traversed far inland along a river valley. The Chilean Navy was
criticized by the government for failing to quickly alert residents along the coast about the impending
threat of a tsunami.
Elsewhere along the Pacific Ocean border, smaller tsunami waves were recorded along coastal sections
of the United States, Canada, Russia, Japan, New Zealand, Australia, French Polynesia, American
Samoa, the Philippines and Indonesia. The table below shows some notable recorded tsunami
measurements reported by the PTWC and the Global Disaster Alert and Coordination System (GDACS).
Notable Tsunami Reports from the PTWC and GDACS
Station Country or Territory Height (m) Height (ft)
Los Cambuchos Chile 8.0 26.2
Coronel Chile 7.9 25.9
Concepción Chile 7.8 25.6
Dichato Chile 7.8 25.6
Constitución Chile 7.7 25.3
Carrizal Peru 5.8 19.0
Valparaiso Chile 1.6 5.2
Acapulco Mexico 0.62 2.9
Kahului, Hawaii United States 0.98 2.0
Nuku Hiva French Polynesia 0.95 2.0
See Appendix C for a graphical representation of tsunami damage in Concepción and Talcahuano.
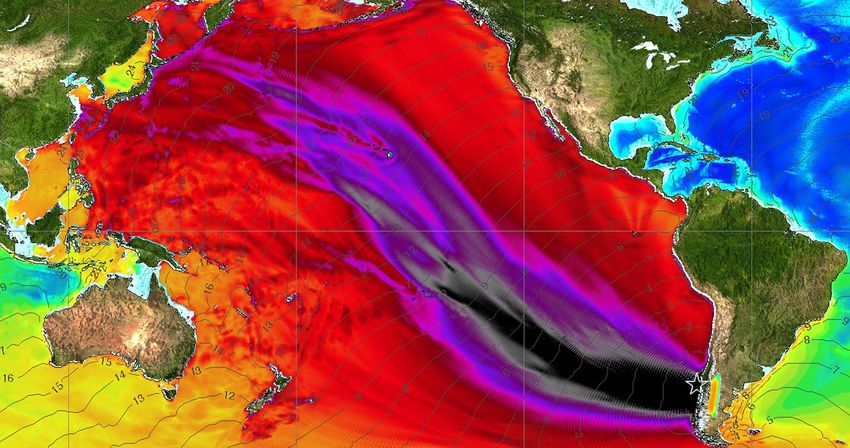
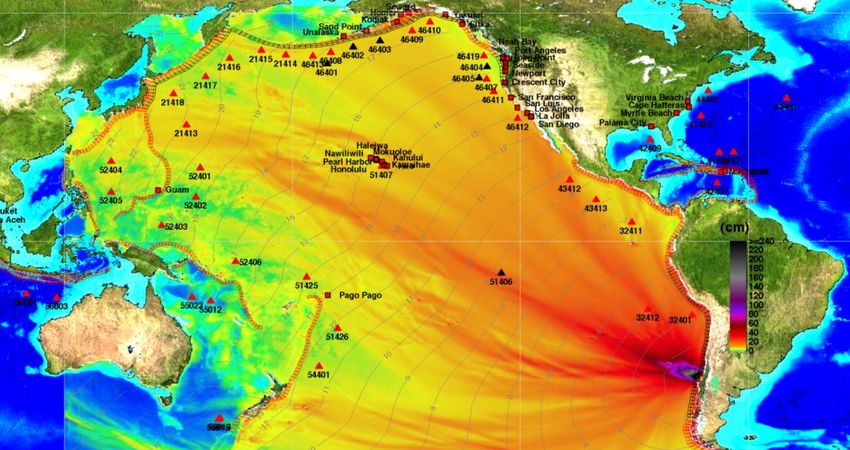
Event Recap Report: 02/27/10 Chile Earthquake Page 10The figures below are two National Oceanic and Atmospheric Administration’s (NOAA) computer generated tsunami wave amplitude estimated measurements (in centimeters) in the 24 hours following the February 27, 2010 magnitude-8.8 earthquake (top) and the May 22, 1960 magnitude-9.5 earthquake (bottom). February 27, 2010: Magnitude-8.8 EQ May 22, 1960: Magnitude-9.5 EQ Event Recap Report: 02/27/10 Chile Earthquake Page 11
Utility Effects
Widespread power outages were reported throughout Chile following
                                                                                      Source: Spreadit.org
the main earthquake. According to the country’s three largest electricity
companies (Endesa Chile, Chilectra and Transelec), over two million
homes lost electricity, including 1.5 million alone in Santiago. However,
electricity was restored within five days to the majority of the region due
to many of the main power grids not sustaining extensive damage.
Electrical production companies such as Empresa Nacional de
Electricidad SA and AES Corp. reported that generation units were
temporarily shut down due to damage. Overall, approximately 17
percent of total capacity (or 545 megawatts) of power generation was
shut down immediately following the earthquake. Landline
telecommunications were impacted in the cities of Concepción,
Constitution, Talcahuano, Chillan and Curico as large swaths of power
poles and power lines were downed. Wireless phone operators (Entel,
Claro and Movistar) reported that several antennas had collapsed and
minimized available wireless signals. An enormous amount of demand for the limited available signals
caused a network overload. Wireless internet access was available in several areas throughout Chile,
enabling rescue teams to communicate with international and local aid groups. Other utility issues
included the widespread loss of access to clean drinking water, the failing of regional sewage systems and
underground gas pipes bursting.

Industrial Effects
Following the initial tremor, copper production was shut down across central sections of Chile as several
mines sustained damage. Some of the companies forced to shut down production were Codelco (El
Tiente and Andina), Anglo American (Los Bronces and El Soldado), Scaw Metal (Antofagasta), Amerigo
Resources and Freeport McMoRan Copper and Gold Inc. Representatives from each company noted
combined shut down of copper cost producers several thousand tons (tonnes), approximately one-fifth of
Chile’s total copper production. As power was restored, many of the closed mines were able to restart
production. Many company officials relayed that further disruptions in copper deliveries were anticipated
due to the widespread damage to highways and seaports. Chile produces about 34 percent of the world’s
copper supply.

Chile’s two oil refineries were also affected, with officials saying the 100,000 barrel-per-day Aconcagua
refinery near Santiago was forced to shut down for at least five days. However, Chile's state-run oil
company ENAP was not certain when the bigger Biobío refinery located near Concepción would again be
operational. The Biobío refinery reportedly had no water or electricity supply, but saw no noticeable
damages. The Energy Minister noted that Chile was not expected to sustain a fuel shortage, but was
prepared to import more fuel if needed.

Infrastructure Effects
The earthquake severely impacted the transportation infrastructure across Chile. Hundreds of roads
buckled along with several key bridges and overpasses collapsed. Many failures were also reported along
Chile’s only major highway, the north-south Pan American Highway. Significant damage occurred on the
highway between Santiago and Temuco, which greatly reduced relief and rescue efforts to the hardest-hit
coastal cities. Large amounts of debris on the highway and other roads allowed only small vehicles to
travel and not the essential truck traffic to maintain the country’s health and economy. A total of eleven
pedestrian bridges were damaged along the Santiago-Los Vilos stretch, including a collapse along the
Claro River. Chilean officials noted that because the earthquake struck in the overnight hours, the
casualty rate was largely minimized due to a lack of traffic on the roads. During the daylight hours, the
Pan American Highway is normally bustling with bumper-to-bumper traffic. Going forward, engineers
anticipate Chilean governmental officials to analyze the need for another cross-country travel route to
minimize future vulnerabilities.

Event Recap Report: 02/27/10 Chile Earthquake                                           Page 12
Additional transportation
Source:
infrastructure damage was Spreadit.org
reported at Santiago’s
international airport, where the
main passenger terminal
sustained significant damage.
Airport officials shut down the
facility for 24 hours following the
main earthquake to inspect the
damage. The main runway was
largely unaffected, though
airlines were limited only to
arrivals for the first four days
after the earthquake. In
Constitución, the town’s main
airport runway was overwashed
by tsunami waves. The Santiago
Metro rapid-transit network
(consisting of the city’s subway
st
system, bus routes and other public transportation) was temporarily closed and later opened on March 1 .
At Chile’s main ports, widespread damage also reported particularly closest to the earthquake’s epicenter.
The country’s primary seaport located in Valparaiso was ordered closed, while the port in Talcahuano was
completely destroyed by the tsunami. In the port city of San Antonio, the port suffered minor damage and
was closed for four days before undamaged sections were allowed to reopen. Chilean shipping interests
were forced to detour to other ports to the north of the epicenter to minimize the delivery of exports and
imports.
Other agricultural infrastructure sectors also were heavily impacted, including crops, wine and fish.
According to Chile’s chairman of the agricultural chamber, approximately 125 million liters of cellared wine
(representing 12.5 percent of the country’s inventory estimated at 260 to 312 billion Chilean Pesos (USD
500 to 600 million)) was lost after old storage buildings in the Maule, Cachapoel, Colchagua, Maipo,
Casablanca and Biobío regions crumbled. The tsunami and earthquake combined to demolish fishing
boats and also kill millions of fish after they were washed ashore. In Talcahuano, the entire fish industry
valued at 20.8 billion Chilean Pesos (USD 40 million) was lost. Chile’s renowned farm-raised salmon
industry was impacted as delivery trucks were unable to transport the fish to seaports due to the main Pan
American Highway being impassable. The rest of the agricultural infrastructure (primarily crops)
reportedly sustained severe damage.
According to the Chilean Tourism Bureau, the overall tourism infrastructure fared fairly well. The far north
and far south tourist sections of Chile which includes popular locations such as Pucon, Puerto Varas and
Puerto Montt were generally unaffected. In fact, just days following the main earthquake, the Chile
Foreign Office released a statement suggesting that all areas outside of the regions of Maule and Biobío
were open for business. Chile’s tourism industry brought in 5.2 trillion Chilean Pesos (USD 10 billion) to
the country in 2009 and represents nearly 3.5 percent of the GDP.
See Appendix D for a further breakdown of infrastructure damage per city.
Insurance Market Effects
According to the Chilean insurance association AACH, only six percent of the country’s homes have
earthquake insurance. The low percentage is likely based on the fact that it is sold as an additional policy
to fire insurance. Insured losses from the association are estimated at 1.35 trillion Chilean Pesos (USD
2.6 billion), with the majority of the losses coming from commercial policies. Based on various reports
from the Chilean government, reconstruction costs were expected to range between 7.8 and 15.6 trillion
Chilean Pesos (USD 15 and 30 billion).
Event Recap Report: 02/27/10 Chile Earthquake Page 13Appendix
Appendix A
Regions of Chile
Key Name Capital
XV Arica and Parinacota Arica
I Tarapacá Iquique
II Antofagasta Antofagasta
III Atacama Copiapo
IV Coquimbo La Serena
V Valparaíso Valparaiso
VI O'Higgins Rancagua
VII Maule Talca
VIII Biobío Concepción
IX Araucanía Temuco
XIV Los Ríos Valdivia
X Los Lagos Puerto Montt
XI Aisén Coihaique
XII Magallanes and Antártica Chilena Punta Arenas
RM Santiago Metropolitan Santiago
Source: Wikipedia
Event Recap Report: 02/27/10 Chile Earthquake Page 14Appendix B
Maipu (outside Santiago) – Apartment building severely damaged.
Santiago – Fine Arts Museum, Museum of Contemporary Art severely damaged.
Santiago (Nuñoa district) – The Emerald residential project (Paz Corp.) in Santiago's Nuñoa district:
there is a possibility that the building will have to be demolished.
Curico – Over 90 percent of the historical center was destroyed, including a total of 1,000 homes
severely damaged, most of which were made of adobe.
Constitución – Oceanfront industrial region, coastal airstrip, and riverfront community along Rio Maule
were inundated by tsunami.
Lloca – Much of the town was washed away by the tsunami.
Valpariso (Plan de Vina district) – Several buildings damaged (among them the Festival Building of 9
North, the Tricahue in 8 North, the Achiras in 3 North, Tenerife in 4 Norte and Batuco in Limache
Street).
Curanipe – Severe tsunami damage on the coast.
Dichato - Water rose steadily (surging above the second floors of homes) and lifted homes off of their
foundations; cars were stacked three high in the streets; 800 homes were destroyed.
Talca –The governmental building of Intendance (a historical monument) was left uninhabitable; at
least two Catholic churches were damaged; a jail wall fell and a fire was intentionally set; numerous
houses collapsed, mainly those of adobe.
Temuco – Building damage, particularly those made of adobe, and façades fell and caused damage to
cars; some offices destroyed.
Talcahuano (near Concepción) – The port was destroyed; streets collapsed; the city building was
destroyed; up to 80 percent of Talcahuano’s residents are homeless, with 10,000 homes
uninhabitable and hundreds more destroyed; coastal regions greatly affected by tsunami.
Concepción – Damage to historical district where older building reside; reports of inhabitants give
account of collapses of dozens of homes in the historical center; city hall collapsed; a newly
constructed 15-story apartment building in Alto Rio damaged.
Pelluhue – Three hundred homes were destroyed.
Cobquecura - Collapsed bridges, crashed buses and sunken pavement.
HOSPITALS
Santiago – The Ministry of Health decided to close Félix Bulnes Hospital (a large public hospital in
Santiago) due to severe structural damage. The hospital relocated more than 200 patients to other
health facilities in Metropolitan Region.
Talca – All but two of the 13 wings at the Talca Hospital were left in ruins.
Curicó, Parral and Cauquenes – Each city sustained substantial damage to their hospitals.
Event Recap Report: 02/27/10 Chile Earthquake Page 15Appendix C Damage map of Concepción and Talcahuano Event Recap Report: 02/27/10 Chile Earthquake Page 16
Appendix D

AIRPORTS
   Santiago International Airport – Airport terminal suffered severe damage and almost all flights to and
                                                                                                nd
   from the city were cancelled; national and international flights partially resumed on March 2 .

MARINE PORTS
  Port of Valpariso (region V) – Terminal Pacífico Sur Valparaíso partially resumed operations at its
                                  th
  main terminal on February 28 for both passenger and cargo handling; Docks 4, 5, 7 and 8 remain
  inoperative until further structural inspections are carried out.
     San Antonio – The port suffered extensive damage and left inoperable, with changes in the
     surface levels of Espigón dock's berths 1, 2, 3 and 5; the port's Puerto Panul bulk handling
     terminal lost a crane after it fell into the ocean during the quake; San Antonio's fishing port
     Puertecito was left inoperative by the large waves that hit the coast after the earthquake; the
     facility's offices were damaged.
     Puerto Coronel (private port) – Extensively damaged.
     Talcahuano (Region VIII) – The main port operated by Empresa Portuaria (a state firm) was
     extensively damaged by the tsunami.
     San Vicente – Port was left inoperative.
     Naval Base of Talcahuano – The naval base of the Chilean Navy in Talcahuano was greatly affected
     by the tsunami, seriously damaging the facilities; the Molo 500 dock and ship rehabilitation facility
     suffered structural damages.
     Ventana (region V) – Port suffered damage; only one of the port's five docks was left operative.
     Isla Mocha – Most of the port infrastructure was completely washed away.
     Caleta Pacheco Altamirano – The administrative offices were flooded; boats were lost; the concrete
     port area was fractured by the water.

RAILWAY
   Merval (metropolitan rail system) – Widespread damage caused 17 days of delayed services; the Las
   Cucharas railway bridge (connecting Viña del Mar to Quilpué district) was damaged.

ROADS AND HIGHWAYS
  Region V – Damage to Lo Gallardo bridge; landslide damage to Camino Laguna Verde & Ruta E-41.
     Region VI –Ruta de la Fruta highway closed due to damage to the El Durazno and Alhué bridges; no
     transit along the Graneros overpass on the Ruta H-15 highway due to structural damage; no transit
     along a stretch of Ruta H-640 due to structural damage; Ruta H-634 road was shut down; Ruta H-10
     was shut down due to problems in the El Roble area, while Lolén bridge collapsed; Ruta 1-80-G saw
     damage on four bridges and was closed.
     Region VII – Road J-60 suffered damage on one of its lanes and many of its bridges; damage noted
     along Ruta 128 road that connects Parral and Cauquenes; the Curanipe and Duao bridges collapsed;
     the Escalones overpass over the Mataquito River collapsed.
     Region VIII – Coastal roads suffered major damage; Juan Pablo II Bridge collapsed and need to
     be rebuilt.
     Region IX – Rodrigo Bastidas Bridge was shut down.
     Region XIV – The road connecting Los Venados to Rupumeica was cut off; transit along the Ruta
     T-205 road was limited.

Event Recap Report: 02/27/10 Chile Earthquake                                             Page 17
Event Recap Reports use publicly available data from the internet and other sources. Aon Benfield summarizes this publicly
available information for the convenience of clients and Aon Benfield employees.
About Aon Benfield: As the industry leader in treaty, facultative and capital markets, Aon Benfield is redefining the role of the
reinsurance intermediary and capital advisor. Through our unmatched talent and industry-leading proprietary tools and products, we
help our clients to redefine themselves and their success. Aon Benfield offers unbiased capital advice and customized access to
more reinsurance and capital markets than anyone else. As a trusted advocate, we provide local reach to the world’s markets, an
unparalleled investment in innovative analytics, including catastrophe management, actuarial, and rating agency advisory, and the
right professionals to advise clients in making the optimal capital choice for their business. With an international network of more than
4,000 professionals in 50 countries, our worldwide client base is able to access the broadest portfolio of integrated capital solutions
and services. Learn more at aonbenfield.com.
Copyright © by Aon Benfield. No claim to original government works. The text and graphics of this publication are provided for
informational purposes only. While Aon Benfield has tried to provide accurate and timely information, inadvertent technical
inaccuracies and typographical errors may exist, and Aon Benfield does not warrant that the information is accurate, complete or
current. The data presented is intended to convey only general information on current natural perils and must not be used to make
life-or-death decisions or decisions relating to the protection of property, as the data may not be accurate. This data has no official
status and should not be used for emergency response decision-making under any circumstances.
Copyright © by Aon Corporation. All rights reserved. No part of this document may be reproduced, stored in a retrieval
system, or transmitted in any form or by any means, electronic, mechanical, photocopying, recording or otherwise.
Impact Forecasting® is a wholly owned subsidiary of Aon Corporation.
Event Recap Report: 02/27/10 Chile Earthquake Page 18You can also read