Metalliferous Sediments in the Atlantis II Deep - Assessing the Geological and Economic Resource Potential and Legal Constraints - Kiel Institute ...
←
→
Page content transcription
If your browser does not render page correctly, please read the page content below
Metalliferous Sediments in the
Atlantis II Deep – Assessing the
Geological and Economic Resource
Potential and Legal Constraints
by Christine Bertram, Anna Krätschell,
Killian O’Brien, Warner Brückmann,
Alexander Proelss and Katrin Rehdanz

No. 1688 | March 2011
Kiel Institute for the World Economy, Hindenburgufer 66, 24105 Kiel, Germany

Kiel Working Paper No. 1688 | March 2011

Metalliferous Sediments in the Atlantis II Deep – Assessing the Geological and
Economic Resource Potential and Legal Constraints

Christine Bertram, Anna Krätschell, Killian O’Brien, Warner Brückmann, Alexander Proelss,
Katrin Rehdanz

Abstract:
To date, mineral resources are only mined on land but projected increases in demand have brought the
exploration and exploitation of marine mineral resources back into focus. The Atlantis II Deep, located in
the central Red Sea between Saudi Arabia and Sudan, is one of the largest marine sulfide deposits known,
with high concentrations of metals such as zinc, copper, silver and gold. However, little is known about
the economic potential of marine minerals as well as the legal constraints. Our geological assessment
shows that the deep is similar in grades and scale to large land-based deposits. Its economic potential is
far from negligible. The present value of possible gross revenues ranges from 3.11 to 8.21 billion US-$,
depending on the minerals considered. From a legal perspective, a general duty to cooperate in the
exploration and exploitation of non-living resources located in disputed maritime areas is identified in
both customary international law and in the UNCLOS. It is submitted that a joint development agreement
is one means of ensuring compliance with this duty in general and in the case of the Atlantis II Deep in
particular.

Keywords: Atlantis II Deep, deep-sea mining, joint development scheme, metalliferous sediments,
resource potential, Saudi-Sudanese Red Sea Commission.

JEL classification: Q30, Q34, Q38.

Christine Bertram                                                  Anna Krätschell
Kiel Institute for the World Economy                               IFM-GEOMAR - Leibniz Institute of Marine
24100 Kiel, Germany                                                Sciences, Kiel, Germany
Telephone: +49 431 8814 261                                        E-mail: akrätschell@ifm-geomar.de
E-mail: christine.bertram@ifw-kiel.de
                                                                   Warner Brückmann
Killian O’Brien                                                    IFM-GEOMAR - Leibniz Institute of Marine
Walther Schücking Institute for International Law,                 Sciences, Kiel, Germany
Christian-Albrechts-University at Kiel, Germany                    E-mail: wbrueckmann@ifm-geomar.de
E-mail: kobrien@internat-recht.uni-kiel.de
                                                                   Katrin Rehdanz
Alexander Proelss                                                  Kiel Institute for the World Economy, Kiel,
Department of Law, University of Trier, Germany                    Germany
Walther Schücking Institute for International Law,                 Department of Economics, Christian-Albrechts-
Christian-Albrechts-University at Kiel, Germany                    University at Kiel, Germany
E-mail: aproelss@internat-recht.uni-kiel.de                        E-mail: katrin.rehdanz@ifw-kiel.de@ifw-kiel.de

____________________________________
The responsibility for the contents of the working papers rests with the author, not the Institute. Since working papers are of
a preliminary nature, it may be useful to contact the author of a particular working paper about results or caveats before
referring to, or quoting, a paper. Any comments on working papers should be sent directly to the author.
Coverphoto: uni_com on photocase.com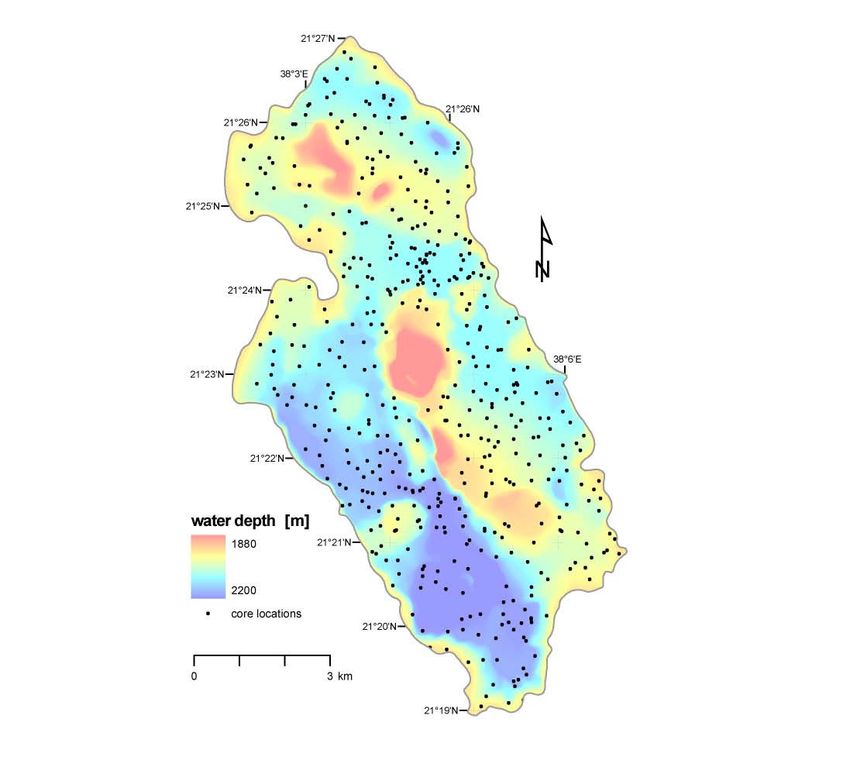
1 Introduction
To date, the majority of mineral resources are mined on land, but projected increases in
demand have brought the exploration and exploitation of marine mineral resources back into
focus (Glasby, 2000; Hoagland et al., 2010). The Canadian company Nautilus has begun its
exploration of massive sulfide deposits in the coastal waters in Papua-New Guinea’s
Exclusive Economic Zone (EEZ) with the aim of starting exploitation in 2012. China has
recently applied for a contract area in international waters to explore massive sulfide deposits
(Pedroletti, 2010). Moreover, a Saudi-Arabian company has been granted an exclusive mining
license over the Atlantis II Deep (A2D) in the Red Sea. Another reason behind this growing
interest is the uneven distribution of mineral resources across the globe. The Democratic
Republic of Congo (DRC), for example, possesses more than 50% of the world’s cobalt
reserves; about 30% of the world’s copper reserves are located in Chile; and about 50% of the
world’s manganese reserves are shared by Ukraine and South Africa (USGS, 2010b).
Literature on deep-sea mining first emerged in the 1970s as a result of rising metal prices and
a need for supply security of important minerals. Aspects that were investigated include
assessments of e.g. environmental impacts (see e.g. Clark and Neutra, 1983; Brown, 1983),
legal constraints (see e.g. Stein and Walter, 1977) and economic considerations (see e.g.
Kirthisingha, 1983; Shusterich, 1982; Cameron and Georghiou, 1981). Since metal prices did
not increase as predicted and metal shortages did not occur, the interest in this topic declined
and only few studies were published after 1983.
Today, the interest in deep-sea mining is resurfacing as a consequence of metal prices rising
again (Gaylord, 2000; Pedroletti, 2010). A few recent studies exist (Halfar and Fujita, 2002;
Hoagland et al., 2010) but little is known as yet about the economic potential of marine
minerals. This raises the question whether marine deposits can play a role in supplying
mineral resources to world markets in the future. Given the fact that most of these minerals
are located in areas beyond the limits of national sovereignty, the legal framework applicable
to the exploration and exploitation of these deposits differs significantly from that applicable
to onshore activities, which are almost exclusively governed by the standards of domestic law.
To our knowledge, we are the first to investigate these issues related to the A2D resources
located in the Red Sea, midway between Saudi Arabia and Sudan (see Figure 1).
The A2D is the largest marine sulphide deposit known with high concentrations of metals
such as zinc, copper, silver and gold. It is similar in scale to large land-based deposits. The
A2D has partly been explored, and mining as well as preprocessing of the mined sediments
has proven feasible during an unprecedented effort initiated by the Government of Sudan and
further supported by the Saudi-Sudanese Red Sea Commission. An environmental impact
study was conducted alongside this mining project as the first of its kind. However, due to
economic reasons the project was stopped around 25 years ago, before having entered into the
pilot mining operation stage. Today, technology, environmental perception and research
standards as well as economic preconditions have changed considerably, which motivates the
demand for a new evaluation of this marine deposit.
Figure 1. Red Sea with political borders. The location of the A2D is framed and the inlay shows its bathymetric
map starting at a water depth of 1880m.

The extensive data on the resource stocks present in the A2D gives us the opportunity to
reevaluate these reserves from an economic perspective and to analyze possible impacts of an
extraction on the world market. There is no recent work on this subject. Comparing the stocks
to the current metal production in Saudi Arabia and Sudan, the numbers are significant and far
from negligible. With regard to the law of the sea, the A2D is, next to the Timor Gap, one of
the most relevant resource deposits worldwide. It is therefore well suited for an evaluation of
the potential of joint development schemes applicable to disputed sea areas as a means of
furthering or perhaps even replacing delimitation efforts.
In the following we briefly review the potential of the A2D from a geological perspective
(Section 2), before we investigate its economic potential (Section 3) and legal constraints
(Section 4). Section 5 discusses the results and concludes.

2 Geological setting
The Red Sea is a textbook example of a modern-day oceanic rift-basin forming as a result of
continental break-up. A characteristic feature in the central and northern Red Sea are more
than a dozen isolated bathymetric depressions, colloquially referred to as “deeps”, which are
filled with salt brines derived from the leaching of the Miocene salt deposits underlying the
entire Red Sea. The A2D is the largest basin of this kind in the axial rift zone of the Red Sea
(see Figure 1). As a topographic depression, which encompasses an estimated volume of
17km³ from a water depth of 1,900m to 2,200m, the A2D contains layered fluids with
temperatures of up to 66°C and salinities of up to 27%. Beneath the brines, up to 40m of fine-
grained metalliferous sediments have been accumulating for the past 25,000 years (Anschutz
et al., 1995, 1998; Anschutz, 2000; Bäcker and Schoell, 1972; Hartmann, 1985; Zierenberg
and Shanks, 1986). These sediments are characterized by a high horizontal and vertical
variability in metal concentrations, with generally high average grades of metals such as zinc,
copper and silver (Zn>2%, Cu>~0.5%, Ag>~39g/t) (Scholten et al., 2000; Barbery et al.,
1981). With proven reserves of 89.5 million tons (dry salt free), A2D has a considerable size,
even compared to land-based deposits (see Table 1), which makes it the largest marine sulfide
deposit known (Barbery et al., 1981).

Table 1.
Comparison of A2D’s average metal grades and size with two large land-based sulfide deposits.

                Average Grades      Atlantis II Deep   Mt. Isa, Australia    Meggen, Germany

                   Zinc [%]               2.06                 7.00               7.00

                  Copper [%]              0.45                 0.10               0.10

                   Silver [g/t]          38.40               150.00               14.00
                                                 a
                   Size [Mt]             89.50               150.00               50.00
Data Source: Barbery et al. (1981), Davis (2005), Ehrenberg et al. (1954).
a
  Dry salt-free.

2.1 Deep Sea Mining A2D – The MESEDA project
Other than mining of deep-sea manganese nodules, manganese crusts and seafloor massive
sulfides, the mining of seafloor sedimentary sulfides, as present in A2D, has not been in focus
recently (Glasby, 2000). However, it is foreseeable that this is going to change, since only
recently the Saudi-Arabian company Manafa has been granted an exclusive mining license
over the A2D for a period of 30 years. A2D is the largest and most intensively investigated marine sulfide deposit of its kind, but investigations regarding its commercial potential, the viability of mining the metalliferous sediments as well as accompanying environmental investigations date back more than 25 years. From 1969 to 1981, numerous expeditions recovered more than 500 sediment cores from the A2D as part of an exploration effort initiated by the Government of Sudan and further supported by the Saudi-Sudanese Red Sea Commission, which was formed in 1974. The German company Preussag carried out the exploration campaign “Atlantis II-Deep Metalliferous Sediments Development Program” (MESEDA). This program was aimed at the assessment of the overall technical viability of deep sea mining and the processing of metalliferous muds on board of a vessel. The program encompassed a pre-pilot mining test (PPMT), environmental surveys including the study of pre-mining environmental conditions of the Red Sea in the area of the A2D, as well as an economic evaluation. During the PPMT, the mining system and the onboard processing of the muds proved to be feasible. However, due to declining commodity prices the economic interest in the project ceased in the early 1980s. The environmental risk assessment study conducted during and after the deep-sea mining process of the MESEDA project was the first of its kind. One main result was a set of valuable data resulting from base line research of the Red Sea environment. Another main achievement were guideline data on water depth for a low-risk disposal of tailings, which result from the onboard processing of metalliferous muds. The sediment plume, which developed after the disposal of tailings during a PPMT, was considered a key risk factor and thus closely studied. In this context, a problematic characteristic of A2D sediments is their pronounced fineness, which allows them to be dispersed more widely. Definite evaluations of commercial mining impacts could not be provided by the environmental study due to temporal and spatial limitations (Ahnert and Borowski, 2000). Further environmental studies were envisaged during the pilot mining operation, which, in the end, was never conducted. Hence, a high degree of uncertainty remains regarding possible environmental risks resulting from mining A2D. 2.2 Metal contents Several deposit evaluations of A2D have been published (Bischoff and Manheim, 1969; Guney et al., 1984; Hackett and Bischoff, 1973; Mustafa et al., 1984) (see Table2). The varying results can be explained by differences in the amount of data used for calculations, the application of different statistical approaches, as well as a pronounced variability in the chemical composition of the sediments. However, the deposits have not yet been fully explored, since their deeper parts were only covered by a few exploration corings, which did not provide sufficient data for a proper estimation of the complete in situ geological reserves. While presenting reserve numbers, it must be stated that actual reserves, which could be profitably mined, may be quite different (Barbery et al., 1981). Table 3 provides information on the metal contents of the A2D according to different studies. It includes results from our own calculations which are described in detail in Section 2.3. These results form the basis for our economic considerations in Section 3.
Hackett and Bischoff (1973) calculated the total amount of zinc and copper based on an
isopach map, which was compiled on the basis of 28 cores from the 1969 Wando River
cruise. Guney et al. (1984) based their calculations on 628 cores. The numbers provided by
Mustafa et al. (1984) are based on a total of 605 corings. The two last-mentioned studies
included all data from the Preussag campaigns in A2D and calculated reserves applying the
Kriging method for an area of 500x500m². The results were then grouped for total reserve
estimation.
Table 2.
Comparison of different calculation results of in situ resources in A2D.
Hackett and Guney et al.
Own calculations Mustafa et al. (1984)
Bischoff (1973) (1984)
6
Zinc [10 t] 3.27 – 3.75 3.22 1.89 1.95
Copper [106t] 0.74 – 0.81 0.81 0.425 0.425
Manganese [106t] 3.83 – 4.30 x x x
Silver [t] 6,502 – 7,100 x 3,750 3,625
Cobalt [t] x x 5,369 5,230
Gold [t] x x 47 46
Cores [n] 480 28 628 605
Note: An x indicates that no information is available.
2.3 Data Analysis
Unpublished geochemical data emanating from Preussag’s MESEDA project formed the basis
for our own calculations. All information regarding the MESEDA project is available to us in
analog form. We digitized the geochemical data, compiled them in a geodatabase and thus
made them available for further processing and visualization. In this study the geochemical
data were used for recalculating the metal contents for certain depth slices.
The data were derived from a total of 480 sampled sediment cores taken in the A2D. Most of
the cores (260) are at least 10m long, in some places coring reached down to 17 - 18m. The
approximate extension of the survey area is 60km2 with around 8 cores taken per m² (see
Figure 2).
Samples of 100cm in length were homogenized and then processed. The quantitatively
determined components are
• Wet density [g/cm³]
• Water content (110°C) [%]
• Dry salt-free material [%]
• Calcium oxide [%], Carbon dioxide [%], Iron [%], Manganese [%], Zinc [%], Copper
[%], Silver [ppm], Silicon dioxide [%], Sulfide Sulfur [%].
The analytical values refer to dry, salt-free material. Information on cobalt and gold is not
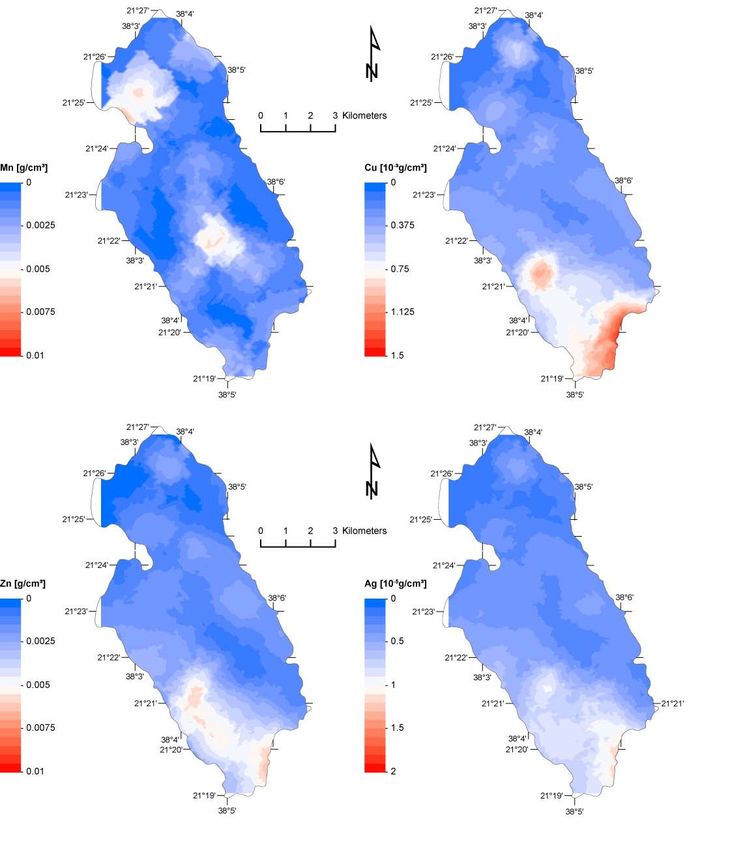
available.Figure 2. A2D bathymetry map with core locations relevant to this study. For our analysis we used a regular data interpolation method (Delaunay triangulation) as well as a modified ridge estimator method to assess the total amount of components across the entire deep. The two methods yielded comparable results, which are summarized in Table 3. This serves as a rough overview of metal contents in according depth slices in the deep. The spatial coverage of cores was insufficient below 14m, so the estimations were restricted to the parts
Table 3.
Results of mass calculations with regular data interpolation and modified ridge estimator method, area covered
by cores in the respective depth range and number of comprised values.

                Zinc [t]              Copper [t]            Manganese [t]          Silver [t]
Depth                                                                                            Area     Values
                                    reg.     ridge                                reg.   ridge
 [m]     reg. int.   ridge est.                         reg. int.   ridge est.                   [km²]     [n]
                                    int.      est.                                int.    est.
  0-1     100,043      102,885     20,619    21,668       66,371       71,218      207     215    61.4      178
  1-2     105,469      111,990     20,312    21,034       73,003       76,399      225     242    61.7      264
  2-3     138,833      148,922     27,015    29,133       90,168      104,468      329     355    63.1      367
  3-4     172,357      176,862     31,823    33,519      251,973      264,646      348     353    63.4      423
  4-5     225,294      240,530     43,014    46,358      359,769      361,621      423     434    62.1      400
  5-6     246,062      251,810     51,951    51,855      443,006      472,272      446     445    61.4      374
  6-7     261,470      268,759     63,084    67,248      440,766      454,589      483     495    59.9      315
  7-8     310,522      370,024     76,108    86,961      379,255      336,465      602     656    59.3      252
  8-9     444,017      501,917     99,123   109,976      321,035      259,796      763     808    57.5      190
 9-10     335,858      365,760     84,351   101,310      327,824      335,810      582     679    49.9      138
10-11     274,196      522,494     58,696    82,957      307,437      336,133      517     680    45.5       97
11-12     263,662      213,169     69,641    74,050      268,317      347,823      798     903    43.6       69
12-13     162,748      131,654     46,429    40,202      406,199      730,853      379     368    29.1       47
13-14     231,114      339,696     43,938    48,316       99,221      146,853      400     488    18.8       26
  Σ     3,271,645    3,746,472    736,104   814,587    3,834,344    4,298,946    6,502   7,121

Figure 3 displays spreading maps of different metal contents, based on average values of each
entire core, since a presentation of maps for all components at all available depths would be
beyond the scope of this paper. The maps reveal a remarkable variability in the lateral
distribution of metal contents. Especially the southwestern and western basins hold the
highest contents of copper, zinc and silver.
The data presented by this study will serve as one part of background information for the
following economic considerations. Manganese, iron, and smaller percentages of cobalt,
molybdenum and vanadium were denoted as difficult to extract economically and thus not
included in the Preussag evaluations (Barbery et al., 1981). Nevertheless, we calculated
values for manganese, although it is still not proven if there is an economic way of extraction.
The data presented in Section 3 for cobalt and gold are taken from the studies of Guney et al.
(1984) and Mustafa et al. (1984), respectively.
Figure 3. Kriging maps of A2D showing the distribution of different metal contents, based on mean values of 480 cores. Note: The maps were produced using ArcGIS 9.3 – Geostatistical Analyst.
3 Economic potential
3.1 Trends in world metal markets
Mineral resources are used as raw materials in a range of production processes. Copper, for
example, is widely used for electrical and electronical applications, wiring, and plumbing as
well as for electricity and communications infrastructure. It is the third most commonly used
industrial metal after steel and aluminum (ABARE, 2010b). The production of and the
demand for mineral resources is closely related to the development of the world economy.
Consequently, the financial crisis and the subsequent economic downturn induced substantial
cutbacks in metal demand during the first half of 2009 (World Bank, 2010a). However,
continued demand from emerging economies, especially from China and India, has induced
recent increases in consumption and prices. This trend is expected to continue in the future
(ABARE, 2010a). Figures 4 and 5 illustrate how metal production has increased throughout
the last half century due to economic growth.

Figure 4. World annual copper, zinc, and manganese production from 1950 to 2008. Own presentation. Data
source: USGS (2010a).

Figure 5. World annual cobalt, gold, and silver production from 1950 to 2008. Own presentation. Data source:
USGS (2010a).
Table A-1 in the appendix gives a detailed overview of world metal production and demand
including copper, zinc, gold and silver for the period from 2006 to 2009. Our economic
considerations focus on these mineral resources because they are relatively scarce on earth but
necessary for many production processes and consequently are traded at high prices on world
markets. Moreover, price forecasts for these metals are more readily available (World Bank,
2010a).
According to Table A-1, world refined zinc consumption decreased by around 7% to 10.6
million tons in 2009 but increased in China and India. World copper consumption is estimated
to have risen by approximately 1% to around 18.3 million tons in 2009, induced by an
increased copper consumption in China but lower demand from the USA and other OECD
countries. The demand for metals such as zinc and copper in countries like China and India is
expected to continue to grow in the medium term (ABARE, 2010a,b).
The demand for silver decreased in 2009 due to a decreasing demand for industrial
production, photography, and jewelry, which could not be made up for by an increasing
demand for silverware and coins. 2009 was also characterized by an increasing investment
demand (Silver Institute, 2010). Gold fabrication, which consists of gold used in jewellery,
electronics, dental applications, medals, coins and other industrial uses, fell by more than 16%
to 2,417 tons in 2009, reflecting higher prices and a decline in global economic activity.
However, the investment demand for gold, which grew strongly in 2009, is likely to remain
strong during 2010 due to the European debt crisis and uncertainty concerning the scope and
pace of economic recovery (ABARE, 2010a).
Manganese is used as an essential input in steel production for which there is no substitute.
On average, 10kg of manganese alloys are used per ton of steel produced. The global
recession induced major cutbacks in demand for ferroalloys and thus for manganese (USGS,
2010b; IMnI, 2010). Cobalt is used mainly in superalloys as well as for the production of
rechargeable batteries. Over the last years, demand patterns shifted from the USA and
Western Europe to Asia, and increases in demand were driven almost exclusively by chemical
applications such as batteries (CDI, 2010).
Metal production was also influenced by the economic crisis. For example, shrinking demand
and decreasing prices led to cutbacks in mining capacity for zinc production in late 2008 and
the beginning of 2009, so that world zinc mining production fell by around 8% to 10.8 million
tons in 2009 (ABARE, 2010b). Moreover, metal markets were tight due to a low scrap supply
and numerous strikes, e.g. in Canada and South America (World Bank, 2010a). World copper
mining production, however, showed a steady increase, rising from 8.8 million tons in 1988 to
15.9 million tons in 2009, due to a steady increase in copper demand from growing
economies around the world (BGS, 2009). Both copper and zinc production are expected to
recover throughout 2010 and 2011 (ABARE, 2010a). Cobalt is usually mined as a byproduct
of other metals such as copper or nickel (CDI, 2010).
World gold supply increased in 2009, mainly driven by increases in scrap sales from old
jewelry, which reached a record high of 1,674 tons in 2009 due to high gold prices. World
gold mining production increased by 7.5% to 2,572 tons in 2009 with the largest increase
occurring in Asia and Russia (ABARE, 2010a,b). World silver mine production increased
steadily over the last years, reaching 22,070 tons in 2009, while scrap sales decreased by
nearly 6% to 5,154 tons, which is mainly due to lower silver use and recycling in photography
(Silver Institute, 2010).
Metal prices have been increasing strongly in the last years and metal markets have been
extremely volatile. This was not due to the absolute scarcity of minerals but rather due to
imbalances of supply and demand and unexpectedly strong demand impulses from China and
India, driven by increased industrial production and the development of new production
processes (ISI, 2009).
Metal prices decreased significantly between July 2008 and February 2009, reflecting the
economic downturn as a result of the financial crisis. However, metal prices started to rise
again in March 2009, partly reflecting recovering industrial production as well as a strong
import demand from China and tight scrap markets (World Bank, 2010a). The second half of
2010 again saw a slight decrease in metal prices due to the European debt crisis and
uncertainty with regard to future economic growth as well as due to the intention of the
Chinese government to slow its growth (ABARE, 2010a). Metal prices are expected to
increase moderately over the next two years as the global economy recovers and demand
expands (World Bank, 2010a). 1
Aggregate information on metal price indices and corresponding forecasts can be inferred
from Figure 6. Table A-2 in the appendix provides an overview of the development of prices
of selected metals from 2006 to 2009 as well as World Bank price forecasts until 2020.

Figure 6. Metals and minerals price indices (2000=100). Own presentation. Data source: World Bank (2010b).

1
 Prices for copper, gold and silver have increased strongly during the last quarter of 2010 due to supply
shortages (copper) and strongly increasing investment demand (gold and silver). However, we apply the more
moderate and conservative estimates provided by the World Bank (2010a) for the analysis in Section 3.4.
3.2 World metal reserves and A2D resources
Table 4 provides an overview of world metal reserves in 2010 and the main countries in
which they occur. In addition, the table shows the amount of absolute resource deposits in the
A2D as well as its percentage relative to total world reserves.

Table 4.
Metal resources in the A2D in relation to total world metal reserves.
    (000 metric tons)   Global reserves       Main countries            A2D (low)   A2D (high)    %
                           in 2010
Copper                          540,000           Chile (29.6%)            740            810       ~0.15%
                                                   Peru (11.7%)
                                                 Mexico (7.0%)
                                              Indonesia (5.7%)
Zinc                           200,000           China (16.5%)           3,270          3,750   1.64-1.88%
                                              Australia (10.5%)
                                                    Peru (9.5%)
                                            Kazakhstan (8.5%)
Manganese                      540,000         Ukraine (25.9%)           3,830          4,300   0.70-0.80%
                                          South Africa (24.1%)
Cobalt                            6,600     DR Congo (52.0%)            5.230a         5.369b       ~0.08%
                                             Australia (23.0%)
Silver                              400           Chile (17.5%)          6.502          7.100   1.63-1.78%
                                                   Peru (14.8%)
                                                Poland (13.8%)
                                                 Mexico (9.3%)
Gold                                 47   South Africa (12.8%)          0.046a         0.047b       ~0.10%
                                              Australia (12.3%)
                                                Russia (10.6%)
                                                    USA (6.4%)
                                              Indonesia (6.4%)
Own calculations and presentation. Data source for reserves in 2010 and main countries USGS (2010b).
a
  Data taken from Mustafa et al. (1984).
b
  Data taken from Guney et al. (1984).

The figures reported in Table 4 refer to onshore reserves. 2 World copper reserves, for
example, currently amount to 540 million tons, 29.6% of which are located in Chile, 11.7% in
Peru, 7.0% in Mexico and 5.7% in Indonesia. However, global land-based copper resources
are likely to exceed 3 billion tons and about 700 million tons may be contained in deep-sea
nodules. Identified zinc resources amount to 1.9 billion tons worldwide. In addition to the
reserves reported in Table 4, 1 billion ton of hypothetic and speculative cobalt resources may
exist in manganese nodules and crusts on the ocean floor (USGS, 2010b).
Mineral resource deposits in the A2D thus do not constitute a large fraction when compared to
global reserves or to reserves in the largest deposit countries. Zinc or silver reserves in China,
for example, are ten times higher than those in the A2D. Still, the resources in the A2D are

2
  Table A-3 in the appendix provides information on the development of onshore world metal reserves from
2005 to 2010.
located within an area of 60 km2 and are thus concentrated quite locally. As described in Section 2, the concentration of the minerals in the A2D is lower compared to those in land- based mines for zinc but higher for copper. Overall, ore concentrations are comparable to those of terrestrial mines. Moreover, the mineral resource deposits in the A2D can be compared to terrestrial mines regarding the absolute amounts of ore. For example, the company XSTRATA, the world’s largest zinc producer and one of the largest copper producers, exploits the Lomas Bayas II mine in Northern Chile, which has a copper content of 768,000 tons. Proven copper reserves in XSTRATA mines range from 120,000 tons to 3.1 million tons (XSTRATA, 2009a). The same company extracts zinc e.g. from the McArthur River mine in Australia, which has proven zinc reserves of 3.37 million tons. Proven zinc reserves in XSTRATA mines range from 452,100 tons to 3.37 million tons (XSTRATA, 2009b). Moreover, Barrick`s Round Mountain mine in North America had proven and probable gold reserves of 41.56 tons as of December 2009. Proven and probable reserves in Barrick`s gold mines range from 0.54 tons to 505.73 tons (Barrick, 2010). All Pan American silver mines together had proven and probable silver reserves of 6,632 tons as of December 2008. Reserves in the mines exploited by Pan American range from 111.4 to 1,820.1 tons (Pan American, 2010). Therefore, the A2D is similar in scale to large land-based deposits. 3.4 The economic potential To indicate the economic potential of the mineral resource deposits in the A2D, we calculated the present values (PVs) of possible future gross revenues created by resource exploitation. For this purpose, we assume that half of the resources identified in the A2D are exploited over 20 years at a constant annual rate. 3 We further assume that exploitation starts in 2011 and continues until 2030. This implies, for example, that copper extraction would amount to between 18,500 tons and 20,250 tons per year. This is only 0.1% of annual global mine production, so that it is unlikely that the extraction of mineral resources from the A2D will influence mineral prices on world markets. Thus, we can take the prices on world mineral markets as given. To evaluate resource extraction, we use the nominal price forecasts presented by the World Bank until 2020 (see Table A-2 in the appendix). For the years 2013 to 2014 and 2016 to 2019, prices have been interpolated linearly. From 2021 onwards we are building two scenarios: The first scenario assumes that prices remain constant, reflecting a situation in which increasing demand can be balanced by increasing production (low price scenario). The second one assumes moderately increasing prices until 2030, reflecting a situation in which increasing demand cannot be balanced with increasing production. These assumptions are meant to illustrate two possible scenarios of future development. Of course, price developments are highly uncertain and driven by economic activity but also by demographic changes, changes in taste and lifestyle and technological progress. 3 The assumed exploitation time of 20 years is equal to that mentioned in the Preussag reports. We assume that only part of the identified resources is mined because it will not be possible to extract the full metal content. For simplicity, we assume that half of the resources can be extracted, thus assuming total mined amounts comparable to those mentioned in the Preussag reports.
Table 5 shows the PVs of resource extraction according to the different scenarios and
different discount rates (5%-10%) as well as for the uncertainty range of the mass calculation
for the resources. Summing up the minimum values for the PVs, which are printed in italics in
Table 5, we receive a total PV of the resources in the A2D amounting to 3.11 billion US$.
The sum of the maximum values (underlined in Table 5) is equal to 5.29 billion US$.

Table 5.
Present values of the Atlantis II resource deposits.
 Values in       Discount     Copper      Copper         Zinc          Zinc      Silver   Silver   Gold     Gold
million USD        rate        (low)      (high)         (low)        (high)     (low)    (high)   (low)   (high)

                              740,000t    810,000t     3,270,000t   3,750,000t   6,502t   7,100t     46t      47t
 Low Price             5%        1,258       1,377          1,935        2,219     889      971      401     410
  Scenario             7%        1,079       1,181          1,658        1,902     757      827      342     349

                      10%          880         963          1,349        1,547     610      666      275     281

 High Price            5%        1,369       1,499          2,082        2,388     905      988      408     417
  Scenario             7%        1,160       1,270          1,766        2,025     769      840      347     354
                      10%          931       1,019          1,417        1,625     618      674      278     284
Own calculations.

These calculations only include the base metals copper and zinc as well as the precious metals
gold and silver as World Bank price forecasts are only available for them and not for cobalt
and manganese. Assuming that also half of the cobalt and manganese resources of A2D are
mined over the next 20 years, and assuming for simplicity that prices stay constant at the level
of September 2010, an additional PV of 2.55 to 2.86 billion US-$ could be gained from
manganese extraction, and an additional PV of 56.09 to 57.58 million US-$ could be gained
from cobalt extraction, both using a discount rate of 10%.
Note that these calculations are rough estimates of monetary revenues that crucially depend
on our assumptions on e.g. future price paths. In our calculations, we further assume that deep
sea mining A2D is profitable at world market prices. To calculate the socially optimal net
present benefit of extraction we would need to take into account extraction costs and
environmental impacts; since this information is currently unavailable our figures only show
possible gross revenues. In order to become economically attractive, A2D must be suited to
compete with land-based deposits concerning size, grade (metal contents) and accessibility.
As discussed above, the metal content of some minerals is similar to or higher than that of
land-based deposits and the size of the A2D is similar compared to large onshore deposits.
Accessibility might be lower due to the fact that the minerals are located in water depths of up
to 2,200m. This could induce higher extraction costs. On the other hand, land-based deposits
often have to be recovered from deep below the earth´s surface, which requires costly
infrastructure. Moreover, cost-reducing technological advances and the high levels of
concentration might compensate higher extraction costs of deep-sea mining. To limit
environmental impacts, precautionary performance standards, environmental regulations and
the establishment of Marine Protected Areas are certainly required (Halfar and Fujita, 2002).
3.5 The economic significance for Sudan and Saudi Arabia
As the resource deposits in the A2D represent a potentially substantial source of income, we
have investigated the importance of these resources for the economies of Saudi Arabia and
Sudan. Table 6 presents gross domestic product (GDP) data for Saudi Arabia and Sudan in
2008 and indicates which metals and how much were produced in these countries and how
this relates to reserves in the A2D.
Table 6.
Macro data for 2008 for Saudi Arabia and Sudan.
GDP GDP growth GDP per Metal production in % of A2D
2008 (bn current (% p.a.) capita 2008 reserves
US$) (current US$)
Saudi 468.8 4.0 19,022 Copper 1,465t 0.18-0.2%
Arabia Zinc 3,663t ~0.1%
Gold 4,527kg 9.6-9.8%
Silver 8,232kg ~0.1%
Sudan 55.9 8.0 1,353 Gold 2,276kg 4.8-4.9%
Silver 2,400kg 0.03-0.04%
Own presentation. Data source: World Bank (2010a), USGS (2009b).
Sudan has had one operating gold mine with a capacity of 5,000 kg as of 2008. The mine is
being exploited by the Canadian-based company La Mancha Resources Inc., which produced
2,276 kg of gold in 2008. The Sudanese Government owned 56% of the mine. Moreover,
2,400 kg of silver were produced in 2008. Mining and quarrying only account for 0.6% of
national GDP. The petroleum sector has a much greater importance for the Sudanese
economy, accounting for 18.6% of GDP (USGS, 2009b).
Saudi Arabia is the world`s leading producer of petroleum and has the largest proven oil
reserves (21% of world total reserves). Hydrocarbon production accounted for more than 60%
of national GDP in 2008. However, a variety of metals are also produced in Saudi Arabia. In
2008, there were 1,263 active mining and quarrying licenses and 145 active exploration and
reconnaissance licenses. In 2008, 1,465 tons of copper, 3,663 tons of zinc, 4,527 kg of gold
and 8,232 kg of silver were produced in Saudi Arabia. The Government held ownership
interests in most of the companies operating in the mining sector. All mineral deposits are
exclusively owned by the state. However, Saudi Arabia`s privatization program is expected to
encourage international investors (USGS, 2010c).
Given the annual average prices of 2008, the market value of metal production was
approximately 65 million US$ for Sudan and 153 million US$ for Saudi Arabia in 2008. This
accounts for around 0.1% of GDP for Sudan and even less for Saudi Arabia. However, the
mineral resource deposits in the A2D would add considerable amounts to the reserves of both
countries. Copper resources in A2D, for example, are 500 times higher than Saudi Arabia's
2008 annual copper production. The zinc and silver resources in the A2D are approximately a
thousand times as high as annual production in Saudi Arabia but gold reserves in the A2D are
only ten times as high. For Sudan, the A2D resources are twenty times larger than annual
production in the case of gold and up to 3,000 times larger for silver.4 Legal constraints
The capacity of states to exercise sovereignty over mineral resources extends to the soil and
subsoil of the entire land territory of the state to an undetermined depth. The increasing
scarcity of such resources on land is causing a noticeable increase in the interest of states in
exploring and exploiting off-shore mineral resources. From a legal perspective, this renewed
interest in non-living resources raises a number of difficult questions to which there are few
definitive answers. The international law of the sea has, throughout the centuries, exhibited a
strong trend of increasing the jurisdictional capacity of coastal states. This development has
resulted in an increased potential for conflicts concerning resources and an acute need for
accurate and efficient delimitation of maritime areas, in particular those subjected to
overlapping claims of coastal states with opposite or adjacent coasts. Owing to the complexity
of the delimitation process, only 136 boundaries or 36% of the estimated total of 379 global
maritime boundaries have been wholly or partially agreed upon. Despite any assertions to the
contrary (Miyoshi, 1999, p. 30), it is widely agreed that large parts of the Red Sea are not
delimited (Colson and Smith, 2005, pp. 3469-3470; Schofield, 2009, p. 14). 4 The increase in
pressures on mineral resources and the correlative increase in overlapping claims have led
states to seek to develop alternative solutions including cooperation mechanisms such as the
joint development agreement (JDA). The agreement reached between Sudan and Saudi Arabia
on the exploitation of the A2D represents just such a JDA. In the following, it remains to be
determined whether an increased implementation of this and similar joint development
mechanisms has a firm footing in international law and whether, in fact, states are under a
duty to cooperate in this manner.
4.1 Legal properties of A2D
Notwithstanding the geographical information provided above concerning the status and
position of A2D within the Red Sea, it is first necessary to establish a number of properties
regarding the site in question from a legal perspective. The Red Sea is a semi-enclosed sea in
accordance with the terms of the 1982 United Nations Convention on the Law of the Sea
(UNCLOS) 5 (Colson and Smith, 2005, p. 3467). This Convention defines “enclosed or semi-
enclosed sea” as “a gulf, basin or sea surrounded by two or more States and connected to
another sea or the ocean by a narrow outlet or consisting entirely or primarily of the territorial
seas and exclusive economic zones of two or more coastal States” (Art. 122), and subjects
states bordering enclosed or semi-enclosed seas to particular obligations (in Art. 123).
Notwithstanding this legal status, the majority of the Red Sea riparian States claim the full
ambit of maritime rights and jurisdictional zones afforded to them under the UNCLOS. The
relevant area for the purposes of this paper comprises “the seabed and subsoil of the
submarine areas that extend beyond [the] territorial sea throughout the natural prolongation of
[the] land territory” (Art. 76 UNCLOS) and is referred to as the continental shelf. The
significance of the metalliferous deposits being contained within the continental shelf area
rests in the nature of the rights accorded to states over that area under the terms of the
4
Only 3 of 13 boundaries have been delimited (see Dzurek, 2001, p. 12).
5
1833 U.N.T.S. 3.UNCLOS. The coastal state does not enjoy sovereignty over the continental shelf (Churchill and Lowe, 1999, p. 151). Nonetheless, it is imbued with far-reaching sovereign rights to explore the seabed and exploit any natural resources found (Ong, 1999, p. 774). These rights exist ab initio and ipso facto, and they are also inherently exclusive to the coastal state without the need of any claim being made. It is for these very reasons that delimitation has often proven so difficult with respect to potentially competing maritime claims, and it has resulted in the advent of joint development mechanisms under the auspices of a general duty of cooperation. 4.2 Duty to cooperate in general international law Despite there being no multilateral convention requiring states to cooperate with respect to the utilization of common natural resources in general terms, there are several indications that such a duty exists in customary law. According to Lagoni (1979, p. 233), the presence of mineral deposit clauses in the delimitation agreements of states would seem to indicate the existence of a practice sufficient to result in a customary rule requiring “[s]tates to cooperate in the exploration and exploitation of common deposits of liquid minerals.” The general nature of the clauses contained in the majority of JDAs appears to sufficiently demonstrate the “fundamentally norm-creating character” (International Court of Justice, 1969, p. 43) required to constitute a rule of customary law. The relevant literature is, nonetheless, somewhat inconclusive regarding the second element of customary international law, namely the subjective element of acceptance of a particular obligation as binding in law which is referred to as opinio juris (see Lagoni, 1979, p. 235; contrast Ong, 1999, p. 788). It is submitted that the considerable number of agreements already reached incorporating general cooperation clauses in instances where the maritime boundary surrounding resources is unclear (see Rodriguez-Rivera, 2008, p. 8; Dzurek, 2001, p. 1; Townsend-Gault), the utterances of the International Court of Justice in several delimitation decisions (1969, p. 43; 1982, p. 320, Judge Evensen dissenting) as well as secondary sources of law such as Resolutions of the United Nations General Assembly (1970) all point towards the existence in international law of a general duty to cooperate. This duty is implicitly reflected in Art. 1 No. 3 of the Charter of the United Nations (UN Charter), according to which the achievement of “international co- operation in solving international problems of an economic, social, cultural, or humanitarian character“ is one of the central purposes of the UN. This general customary duty to cooperate is further substantiated by the terms of the UNCLOS (Ong, 1999, p. 797). Art. 74(3) on the delimitation of the exclusive economic zone (EEZ) requires states to “make every effort to enter into provisional arrangements.” Although the phrase “make every effort” may leave some room for maneuver on part of the states, the spirit of the provision is clear: States are required to conclude practical provisional arrangements governing the disputed or undelimited area (Nordquist, 1993, p. 815). Similarly, Art. 142 provides that states must conduct all activities in the Area with due regard to the rights and legitimate interest of any coastal state within whose jurisdiction the deposits may lie (Ong, 1999, p. 784). More importantly for present purposes are Arts. 83(3) and 123
UNCLOS. Art. 83(3) contains an identical provision to Art. 74(3), only it is applicable with
respect to the continental shelf.
Art. 123, entitled “cooperation of States bordering enclosed or semi-enclosed seas”, acts as a
lex specialis with respect to the exercise of rights by states bordering a semi-enclosed sea. An
initial textual understanding of this provision would seem to leave the reader in no doubt that
it cannot apply to the A2D issue as a reference is made under litera (a) to the exploration and
exploitation of living resources, not the metalliferous, non-living resource of interest in the
A2D exploration. Notwithstanding this, further consideration ought to be paid to the wording
in its context, the systematic structure of the provision as well as its purpose. 6 First, the terms
“exploration” and “exploitation” are expressions usually reserved in the Convention to non-
living resources. If one compares the provisions governing living resources in the EEZ, the
parlance applied is that of “conservation” and “utilization” rather than exploitation (compare
Art. 62 UNCLOS; see also Proelss, 2006, p. 248). This would seem to indicate that the
inclusion of the reference to “living” resources may not have been the original intention of the
states parties to the UNCLOS and that Art. 123 could be interpreted as requiring cooperation
with respect to non-living resources too. Second, there is no indication that the list provided
for in Art. 123 is in any way exhaustive. Thus, it is not fallacious to assert that certain
unenumerated areas of cooperation may be included in the ambit of Art. 123. This contention
is further borne out when one considers it in conjunction with the third supposition that the
purpose of the provision itself, i.e. “the need and desirability of cooperation between States
bordering a […] semi-enclosed sea” (Nordquist, 1993, p. 356), is heightened by the factual
composition of a semi-enclosed sea. “Ideally, the approach to management should be holistic
and coordinated in other [sic] for the states concerned to discharge their responsibilities […].”
(Townsend-Gault, p. 14, emphasis added) Taking these factors into consideration, it is
possible to summarize that Art. 123 contains a duty on riparian states of semi-enclosed seas,
such as the Red Sea, to cooperate with each other with regard to delimitation and resource-
related issues. One caveat must nonetheless be appended to this statement: The somewhat
watered-down formulation “should cooperate” as opposed to “shall cooperate” weakens the
duty to cooperate considerably in terms of a duty to enter into negotiations with the aim of
establishing some kind of cooperation (International Court of Justice, 1969, p. 47, para. 85),
but it is submitted that complete failure to act would not suffice to meet the requirements of
the provision concerned.
Having established that a duty to cooperate exists either in customary law or as a result of the
provisions of the UNCLOS, it remains to be examined whether states are under a duty to
employ a JDA or whether the duty to cooperate allows for greater latitude in the method
which can be employed.

4.3 JDA as a cooperation mechanism
Miyoshi (1999, p. 3) defines a joint development as “[a]n inter-governmental arrangement of
a provisional nature, designed for functional purposes of joint exploration and/or exploitation
6
 Such an understanding is in keeping with the rules of treaty interpretation prescribed by the Vienna Convention
on the Law of Treaties, 1969.
of hydrocarbon resources of the sea-bed beyond the territorial sea.” The first reference to the
concept of JDAs made in the practice of international courts and tribunals is to be found in the
North Sea Continental Shelf Cases from 1969. In those cases the International Court of
Justice (1969, p. 53) stated that parties could employ “a regime of joint jurisdiction, use or
exploitation for the zones of overlap or any part of them.” JDAs offer states the possibility to
cooperate when either the boundary is delimited but the deposit straddles the boundary, or
when the continental shelf has not yet been delimited and there is a potential for overlapping
areas within the limits of national jurisdiction.
Having said that, certain elements ought to be present in order to ensure that a JDA is capable
of fulfilling its purpose of furthering cooperation between two states. First, the zone in which
the resources are found must be adequately defined. Second, the resources which are
contained within that zone must also be determined. Third, the jurisdictional rights of the
parties with respect to the resources must be resolved. Finally, the parties must reach
agreement on the conditions and individual details regarding the exploration and exploitation
of the resources including such issues as the division of costs as well as profits (Lagoni, 2006,
p. 281 with further references). The specifics of the Sudan-Saudi Arabia Agreement
concerning A2D will now be analyzed based on the foregoing criteria and taking into account
considerations concerning the potentially imperative nature of a JDA in the Red Sea area.

4.4 JDA in the Red Sea
Following the discovery of potentially valuable metalliferous deposits between 1964 and
1966, Saudi Arabia passed domestic legislation asserting its trusteeship for all non-living
resources in the Red Sea until such time as an agreement could be reached with all states on
ownership and exploitation of the resources (Ford and Simnett, 1982). By way of an
Agreement between Sudan and Saudi Arabia relating to the Joint Exploration of the Natural
Resources of the Sea-Bed and Sub-Soil of the Red Sea in the Common Zone of 16 May
1974, 7 the two states purported to establish a JDA. 8 Taking into account the criteria
mentioned in the preceding paragraph necessary for the establishment of a JDA, it can be
summated that the Agreement is indeed sufficient to act as a JDA for the purpose of ensuring
cooperation between the contracting parties. First, the zone in which the resources can be
found is adequately defined by Arts. III and IV of the JDA which created the so-called
Common Zone, an “area of the sea-bed adjacent to the [coast of the state in question] where
the depth of the superjacent waters is uninterruptedly one thousand meters.” Second, the
resources contained in the zone had already been identified by the exploratory work carried
out in 1964 and 1966 and, subsequent to the creation of the JDA, by Preussag AG. By
creating the Common Zone in Art. V, the parties, third, resolved the issue of jurisdictional

7
  1974 U.N.T.S. 197.
8
  Note that any attempt to construe the Joint Exploitation Agreement as providing for the delimitation of the
continental shelves of Saudi Arabia on the one hand and Sudan on the other on the basis of Arts. III and IV
thereof is erroneous as the terms of that agreement are not sufficiently specific to constitute a delimitation, nor is
this the purpose for which the agreement was intended (Dzurek, 2001, p. 16). According to Art. VII litera (a) of
the Agreement, the Joint Commission established with the Agreement shall, inter alia, be charged with the
function “to survey, delimit and demarcate the boundaries of the Common Zone.”
rights with respect to the resources: “The two Governments shall have equal sovereign rights
in all the natural resources of the Common Zone which rights are exclusive to them.” Finally,
the creation of the Joint Commission in Art. VII as well as the provision in Art. XII
concerning the provision of funds by the Saudi Arabian Government serves to resolve any
issues regarding the division of costs.

5 Discussion and conclusion
So far, mineral resources are only mined on land, but projected increases in demand have
brought the exploration and exploitation of marine mineral resources back into focus. This
study shows that even though the A2D only hosts comparably small amounts of mineral
resources compared to global reserves and global annual mine production, the value of the
resources in the A2D still is considerable and might be even higher, keeping in mind that
exploration, which took place about 30 years ago, covered only half of the deposit. Moreover,
A2D is the largest marine sulfide deposit known with metals concentrated in an area of 60
km2. The mineral resource deposits in the A2D would add considerable amounts to the
reserves of both riparian countries, Sudan and Saudi-Arabia.
The present value (PV) of the resources in the A2D could range from 3.11 billion US$ to 5.29
billion US$, taking into account copper, zinc, silver, and gold. An additional PV of 2.6 to 2.9
billion US-$ could be gained from manganese and cobalt extraction. These PVs only indicate
possible gross revenues of sea floor mining from which exploitation costs will have to be
deducted in order to estimate net gains. Leadoff extraction costs might be higher compared to
land-based deposits. However, once acquired, mining vessels and equipment could be reused
and moved from A2D to other deposits of the same type. Mining as well as preprocessing of
the mined sediments has proven feasible during the MESEDA project. Nevertheless, our
estimates of gross revenues are rather lower bounds. Revenues might be much larger; firstly,
our assumptions regarding price developments are rather conservative; secondly, we assume
extraction of only 50% of the total estimated deposit; thirdly, our calculation cover only part
of the metals present in the A2D, and fourthly, A2D has only partly been explored.
Seafloor mining is likely to have negative impacts on the marine environment, including a
destruction of habitat, the death of marine animals living at and close to the mining site and a
degradation of water quality. This implies that the costs faced by society are likely to be larger
than the direct costs of resource extraction. Consequently, the environmental impacts, which
are external to the decision of a private resource extractor, would have to be evaluated and
accounted for in order to assess the social benefit of seafloor mining. This would require
appropriate regulatory measures to be taken to control seafloor mining. Such might include a
taxation of seafloor mining or an establishment of safety and liability regulations.
Newly developed innovative technologies and products are likely to further increase world
demand for mineral resources, especially for trace metals such as Indium, Gallium, Neodym,
or Germanium. These trace metals are important e.g. for the production of photovoltaics, laser
technologies, displays or fibre optic cables – all considered key technologies of the future. A
study carried out by the Fraunhofer Institute for Systems and Innovation Research (ISI)
indicates that global demand for Gallium, driven by innovative production technologies, may
be six times as high in 2030 as world production was in 2006. For Neodym, this ratio may be
3.8 and 3.3 for Indium (ISI, 2009). These results highlight that the mineral resources in the
A2D in the Red Sea could have an even higher economic potential than indicated here if trace
metals such as Gallium, Neodym and Indium were found there.
Regarding the situation under the law of the sea, having ascertained that the JDA entered into
between Sudan and Saudi Arabia is a suitable cooperation mechanism, it remains to answer
the question whether there is an obligation in international law to employ JDAs regarding
common marine resources. Pertaining to the situation in the Red Sea, this is even more
relevant in light of the fact that it is not completely clear whether the parties to the JDA today
still consider the Agreement in general and the Joint Commission in particular as the relevant
fora for their cooperation. While no evidence exists that the JDA has expired, the present
authors could not obtain any information on whether the Joint Commission has actually
implemented the tasks assigned to it by the JDA at all and, if so, to what extent. It seems that
the issue of exploiting the resources located in the A2D has only recently come to the
forefront again due to its economic potential described above, which could result in a revival
of either the JDA or the legal dispute which led to its implementation in 1974.
It has been shown above that there is a duty for states to cooperate with each other in the
administration of common resources under both customary international law and in the
UNCLOS. The A2D is an area within a semi-enclosed sea on the continental shelf between
Saudi Arabia and Sudan. Consequently, the riparian states are required to cooperate regarding
the exploitation of the resources (Art. 123 UNCLOS). Furthermore, they must continue to
work towards a delimited solution and, pending delimitation, make every effort to enter into
provisional arrangements designed to provide the states with a mechanism to meet that aim
(Art. 83(3) UNCLOS). Given the geographical peculiarities of the Red Sea, due regard must
be given to several principles which have, in light of their technical nature and limitation to
individual cases, not yet obtained the status of customary law but nonetheless serve as guiding
standards. First, the principle of unitization considers the complex pressures (rock, water, gas
etc.) to which the resources are subjected and the difficult and potentially dangerous
procedure employed to separate the metals from the sludge on the sea floor. It then posits that
where a deposit straddles boundaries “other States cannot extract minerals from their part of
the deposit, even if the first State has extracted only that portion originally situated in its
territory or continental shelf” (Lagoni, 2006, p. 217, quoting Ely, 1937-1938, p. 1219), as to
do so would result in the other state being unable to exploit the resources under its
jurisdiction. Second, a further principle requiring attention is the efficiency principle which
implies that physical properties of a deposit must be taken into account in order to secure
maximum exploitation (Ong, 1999, pp. 778-779). Third, based on the duty to make every
effort not to jeopardize the reaching of a final agreement regarding delimitation contained in
Art. 83(3) UNCLOS, states are required to exercise mutual restraint with respect to the
exploitation of common deposits. This principle has been taken to imply a prohibition on
unilateral action where such action results in the risk of “depriving other States of the gains
they might realize by exercising their sovereign rights of exploitation” (Ong, 1999, p. 798).
Finally, considerations of equity arising out of Art. 300 UNCLOS provide a basis for the
You can also read