Russia A Basic Guide 2021 - Macro-Advisory
←
→
Page content transcription
If your browser does not render page correctly, please read the page content below
Russia
                                     A Basic Guide
                                         2021

Russia | A Basic Guide | July 2021                   Independent • Local • Commercial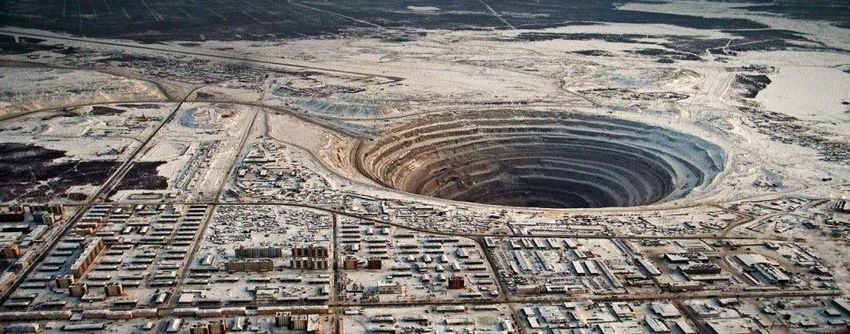
Contents

                                                12   Economy – The Past
3    How Big is Russia?                                                                24   Energy Sector
                                                13   Economy – The Present
4    Nature and Geography                                                              25   Renewable Energy in Russia
                                                14   Economic Recovery Plan
5    Russian People                                                                    26   Hydrocarbons in Graphs
                                                15   Balance Sheet
6    Population Density and Locations                                                  27   Metals & Mining in Russia
                                                16   Economy – Forecasts
7    Governance                                                                        28   Consumer Sectors
                                                17   Economy – Potential
8    Senior Government Officials                                                       29   Agriculture
                                                18   National Projects Program
9    Informal Governance & Influence                                                   30   Eurasia Economic Union
                                                19   Energy Sector and the Economy
10   Chronology of Soviet and Russian leaders                                          31   Transport Networks – BRI and INSTC
                                                20   Sanctions – The Main Actions
11   Covid-19 in Russia                                                                32   Russia’s Timeline
                                                21   Sanctions – Timeline and Impact
                                                                                       33   Our Services
                                                22   Business Survey Rankings
                                                                                       34   Russia Coverage Reports Suite
                                                23   ESG in Russia
                                                                                       35   ESG Coverage

                                                                                       36   Contacts

Russia | A Basic Guide | July 2021                                                               Independent • Local • Commercial   2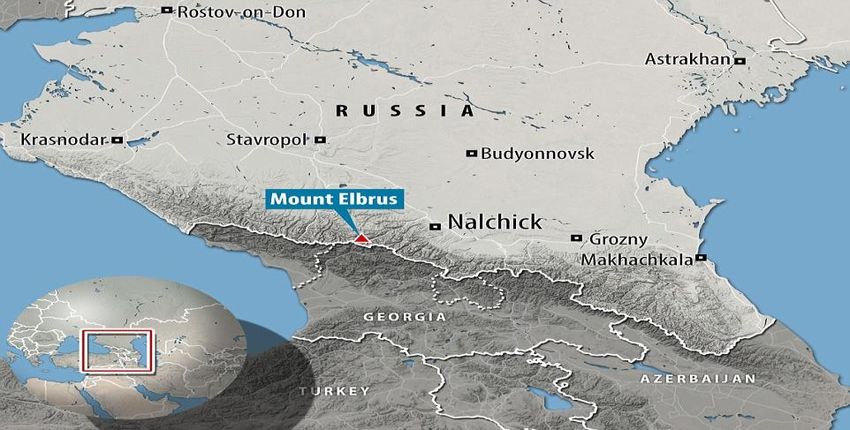
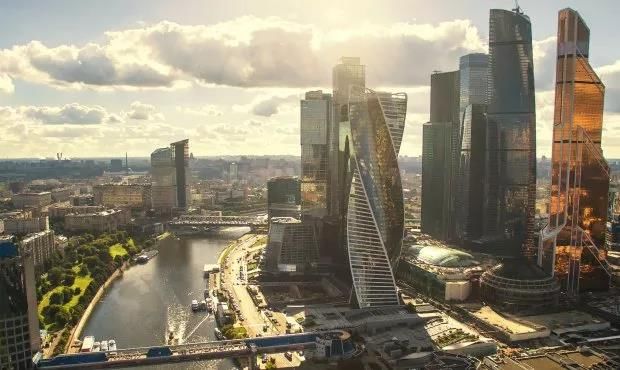
How Big Is Russia

 Russia is the World’s Largest Country
Russia’s land mass covers one-eighth of the planet’s land mass.

Bordering Europe, Asia, the Middle-East & the Arctic (Russia has by far the largest
border with the Arctic).

14 separate countries have a land border with Russia.

Russia has nine time zones (reduced from 11 in 2010) stretching from Kaliningrad to
Kamchatka.

The five tallest (occupied) buildings in Europe (eight out of the top ten) are in Russia –
the tallest is the Lakhta Center (Gazprom HQ in St Petersburg) at 462.5 meters.

 Moscow is Europe’s Largest City*
 The city has a population of 12.6 mln.

 The Moscow catchment area has a population of about 20 mln.

 Rated the world’s sixth most congested city for traffic (TomTom data) with a congestion
 level of 59% in 2019. In the 2020 survey, Moscow ranked as the worst city (54%
 congestion) but all other major world cities were reduced due to Covid lockdowns.

 Moscow is ranked as the 62nd most expensive city for expats in the Mercer 2021
 survey. It was placed 21st in the 2020 survey.

 Average temperature range is -15C (Jan/Feb) to +30C (July/August).

 Moscow’s Ostankino Tower (540 m) is the tallest structure in Europe.

* Excluding Istanbul which is mostly in Asia

Russia | A Basic Guide | July 2021                                                           Independent • Local • Commercial   3
Natural Resources

 Huge Natural Diversity                                                                    Mt Elbrus and Lake Baikal
World’s largest forest coverage with 8.1 mln sqm (21% of global total).

Russia and Canada combined control 80% of the Arctic.

Four of the world’s ten longest rivers are in Russia, with the Yenisei the longest at
5,540 Km (5th longest in the world).

Highest mountain in Europe: Mt. Elbrus at 5,620 meters (Mt. Blanc is 4,810 meters).

Lake Baikal is the world’s oldest lake (25 mln years), the deepest (1,642 meters), has
the clearest water, and holds more fresh water than any other lake (22-23% of the
world’s total fresh water supply).

Russia has the world’s 3rd largest area of arable land, with 121.8 mln hectares (the US
has 174.5 mln hectares and India has 160 mln hectares).

In 2020, Russia was the world’s largest exporter of wheat (also in 2017 and 2018). It is
expected to be again the world’s largest exporter of wheat in 2021/22.

Russia is home to the second-largest population of wild tigers (after India).

Russia | A Basic Guide | July 2021                                                                                Independent • Local • Commercial   4
People

 Population & Life Expectancy                                                                                 Population Trend & Expectation
Total population of 145.99* mln. (9th largest in the world). It fell by 0.6 mln from January                  Russian Demographics
1st 2020.                                                                                                                                                          1999                    Current      2030F
                                                                                                              Total Population                                     147.5                     146.0      146.3*
                                                                                                              Urban based, % of total                                73.8                      75%        75%
Millennials have a life expectancy of 72.3 years. (78.7 for women and 68.9 for men).
                                                                                                              Rural based, % of total                                26.2                      25%        25%
In 1994, the average life expectancy was 64.5 years.
                                                                                                              Workforce, mln                                         86.3                       82    85.4-89.2
                                                                                                              Retirement age, men, years                              60                        65            65
Most educated population in the World (OECD) – 54% hold a tertiary degree.
                                                                                                              Retirement age, women years                             55                        60            63
                                                                                                              Life expectancy, men, years                            55.9                      68.9       73.3
Russia does not have capital punishment.
                                                                                                              Life expectancy, women, years                          72.4                      78.7       81.5

World’s   3rd
           largest recipient of migrant workers currently (was the                  3rd   largest source of   Total Reproductive Rate (TPR)                           1.2                       1.5         1.5
emigrants during 1990-2010).                                                                                  Source: Rosstat, Worldometers
                                                                                                              * Rosstat projection is for a low of 144.3 mln and a high of 148.4 mln in 2030

 Language, Culture & Religion                                                                                 Moscow Mosque Cathedral
Russian is the 7th most used language in the world. English is spoken in the biggest
cities.

Russian is the 5th most-used language on the Internet.

Ethnic Russians make up 81% of the population. There are 160 separate ethnic groups
in Russia.

41% of the population adhere to the Russian Orthodox religion; 6-9% are Muslim**;
25% claim to be spiritual but not religious; 13% are atheists; and 10-15% claim “another
religion”.

* As of May 1st 2021
** Moscow is home to the largest Muslim population in Europe (excluding Istanbul)

Russia | A Basic Guide | July 2021                                                                                                                                Independent • Local • Commercial        5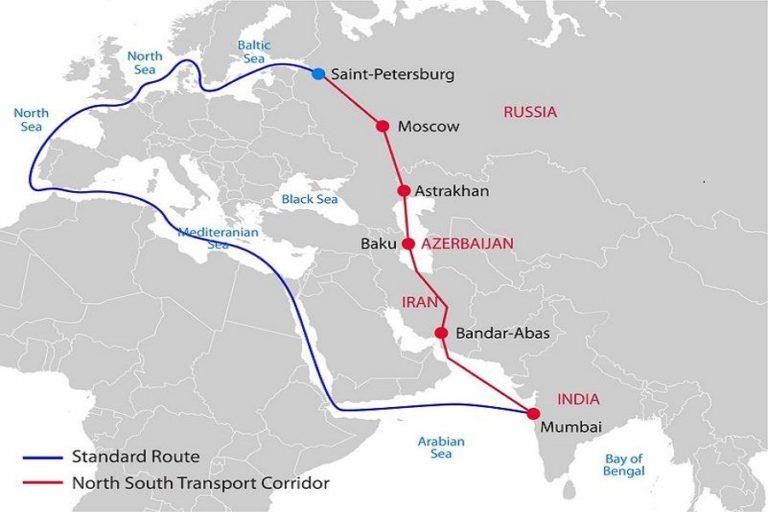
Where do People Live?

 Federal Administration Regions                                                         Urbanization & Largest Cities
There are 85 regions with different degrees of autonomy. All have two members in the   75% of the total population lives in cities.
Federation Council.
                                                                                       Russia is under-populated with a density of only 8.3 people per sq. km.
The 85 regions are further subdivided into:
                                                                                       100 mln people live in European Russia, west of the Ural mountains.
    •   22 Republics
                                                                                       Russia has 15 cities with a population greater than 1 mln and an additional 12 cities
    •    9 Krais
                                                                                       with a population of between 0.5 mln and 1.0 mln.
    •   46 Oblasts
    •    3 Federal cities
    •    1 Autonomous Oblast
    •    4 Autonomous Okrugs

                                                                                                                              Russia’s Largest Cities - mln
                                                                                                                              Moscow                                     12.6
                                                                                                                              St. Petersburg                              5.3
                                                                                                                              Novosibirsk                                 1.6
                                                                                                                              Yekaterinburg                               1.4
                                                                                                                              Nizhny Novgorod                             1.3
                                                                                                                              Kazan                                       1.3
                                                                                                                              Samara                                      1.2
                                                                                                                              Omsk                                        1.2
                                                                                                                              Chelyabinsk                                 1.2
                                                                                                                              Rostov-on-Don                               1.1
                                                                                                                              Source: WorldAtlas

Russia | A Basic Guide | July 2021                                                                                                    Independent • Local • Commercial          6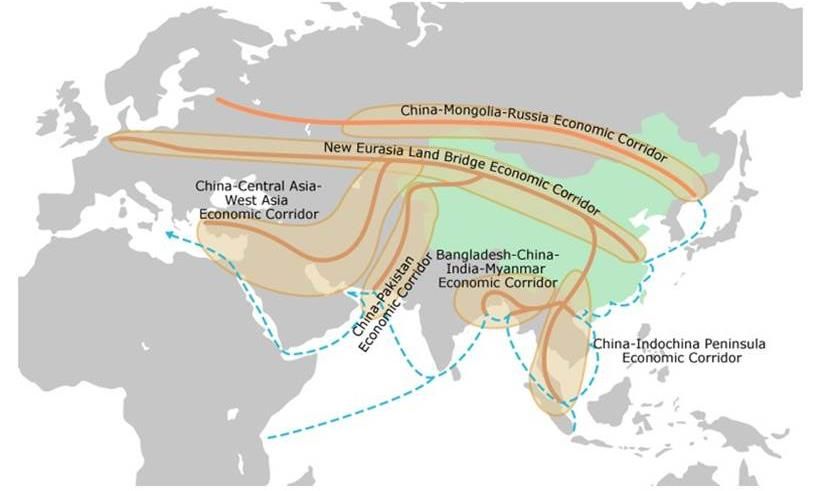
Governance in Russia

 Structure of Government                                      Schematic of Government                                       Elections
The Presidential Administration      is   the   centre   of                      Executive                      Central    The Duma is elected for a five-year term. The next
                                                              Legislature                      Judiciary
governmental authority.                                                           Branch                         Bank      election is scheduled for September 2021.

The cabinet, headed by the Prime Minister (currently                                                                       The President’s term is for six years. Vladimir Putin was
Mikhail Mishustin), who reports to the President. Laws        Federation                      Constitutional   Chairman/   inaugurated for his second six-year term in May 2018.
                                                                                  President
                                                               Council                           Court         Governor
are drafted by the Cabinet.                                                                                                But, as a result of the July 2020 Constitutional
                                                                                                                           Referendum, the clock has been reset. It means that
Draft laws are sent to the Lower House of Parliament                                                                       Vladimir Putin may seek two further terms as president.
(Duma) and approved (or rejected or changed) in three                                                                      As of July 2021, he refuses to say what his plans are.
                                                                                    Prime      Supreme
readings and then sent to the Federation Council (the            Duma                                          Deputies
                                                                                   Minister     Court
Upper House).                                                                                                              Putin enjoyed a high level of public support for most of
                                                                                                                           his period in office because, before him there was
Because of the Constitutional change of 2020, from                                                                         poverty, chaos, lawlessness and no hope. Since he was
September 2021 the Duma will have the ability to                                   Deputy                                  elected president, the country has been very stable and
                                                                                               Arbitrage
propose legislation on its own.                                                     Prime
                                                                                   Minister
                                                                                                Courts                     while the economy is prone to volatility as it is more
                                                                                                                           open to global factors, people’s incomes and lifestyles
The Upper House must approve a bill and then send it to                                                                    have improved significantly since 2000.
the President for signature.
                                                                                                District                   However, Russian demographics are changing and
                                                                                  Ministers
The Duma is controlled by the United Russia Party. It                                           Courts                     people are less automatically supportive of the
was founded in December 2001 and the current                                                                               government and the president. They are more
Chairman is former President Dimity Medvedev. The                                                                          demanding and more willing to express frustration with
party is loyal to the Administration.                         Source: Macro-Advisory Ltd.                                  delays and economic failures. This has been the case in
                                                                                                                           recent years as the economy has been weak and
There is no credible or sizeable opposition in Russia.
                                                                                                                           incomes have declined in real terms.
The other parties in the Duma are regarded as the
systemic opposition.

Russia | A Basic Guide | July 2021                                                                                                   Independent • Local • Commercial           7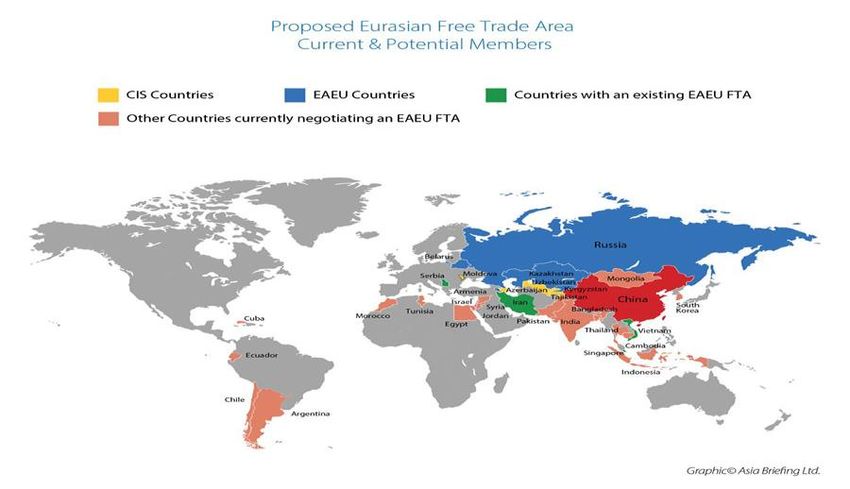
Government Structure

Key Players In The Russian Elite                                                    Siloviki
Function in Government                                                     Name     Position                                                                                  Official
President                                                          Vladimir Putin   Defence Minister                                                                  Sergey Shoigu
Prime Minister                                                  Mikhail Mishustin   GU of the General Staff (GRU)                                                     Igor Kostyukov
Chairwoman of the Federation Council                        Valentina Matviyenko    Director of National Guard                                                          Viktor Zolotov
Director of the Foreign Intelligence Service                    Sergei Naryshkin    Director of Federal Protection Service                                           Dimity Kochnev
Speaker of the State Duma                                    Vyacheslav Volodin     Director of SVR (Foreign Intelligence Service)                                  Sergei Naryshkin
Chief of Staff of the President Executive Office                     Anton Vaino    Director of FSB                                                              Alexander Bortnikov
Special Presidential Representative                                Sergei Ivanov    Minister of Internal Affairs                                                 Vladimir Kolokoltsev
Secretary of the Security Council                               Nikolai Patrushev   Secretary of the Security Council                                              Nikolai Patrushev
Defence Minister                                                   Sergei Shoigu    Emergencies Minister                                                           Yevgeny Zinichev
Foreign Minister                                                  Sergey Lavrov     Foreign Minister                                                                    Sergei Lavrov
Interior Minister                                            Vladimir Kolokoltsev   Head of Investigative Committee                                              Alexander Bastrykin
Director of the FSB                                          Alexander Bortnikov    General Prosecutor                                                                  Igor Kransnov
Source: Kremlin.ru                                                                  Source: Macro-Advisory Ltd.

Senior Cabinet: Prime Minister and Deputy Prime Ministers                           Government Ministers
Position                                                                    DPM     Ministry                                                                                 Minister
Prime Minister                                                  Mikhail Mishustin   Agriculture                                                                     Dmitry Patrushev
First Deputy Minister                                           Andrey Belousov     Construction & Housing                                                              Irek Faizullin
Dep PM, Head of Government Administration                     Dmitry Grigorenko     Culture                                                                          Olga Lyubimova
Dep PM – Construction industry                                  Marat Khusnullin    Digital Development & Communications                                           Maksut Shadayev
Dep PM – Social Affairs                                         Tatiana Golikova    Economic Development                                                         Maxim Reshetnikov
Dep PM – Digital Government                                     Alexey Overchuk     Energy                                                                          Nikolai Shulginov
Dep PM – Industry & Energy                                      Alexander Novak     Far East Development                                                           Alexey Chekunov
Dep PM – Far East                                                    Yuri Trutnev   Finance                                                                           Anton Siluanov
Dep PM – Agriculture                                         Viktoria Abramchen     Health                                                                          Mikhail Murashko
Dep PM – Culture & Sport                                    Dmitry Chernyshenko     Higher Education & Science                                                         Valery Falkov
Defence Industry                                                     Yuri Borisov   Justice                                                                     Alexander Konovalov
Source: Russian Government                                                          Knowledge (Schools)                                                              Sergei Kravtsov
                                                                                    Labor                                                                            Anton Kotyakov
                                                                                    Natural Resources                                                              Alexander Kozlov
                                                                                    North Caucasus                                                               Sergei Chebotaryov
                                                                                    Sport                                                                              Oleg Matytsin
                                                                                    Trade & Industry                                                                 Denis Manturov
                                                                                    Transport                                                                         Vitaly Saveliev
                                                                                    Source: Macro-Advisory Ltd.

Russia | A Basic Guide | July 2021                                                                                                   Independent • Local • Commercial            8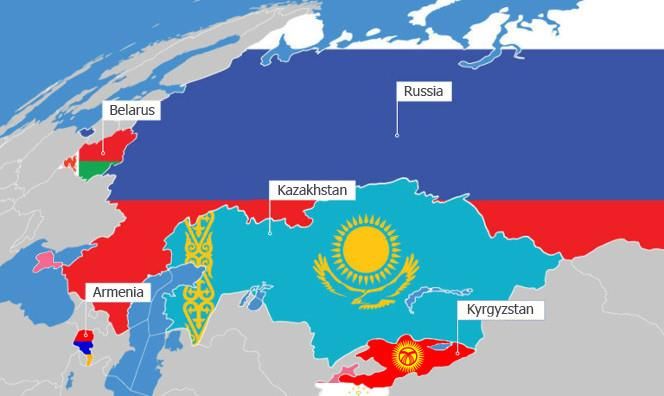
Informal Governance & Influence in Russia

                                                        Various groups in, and close to,
                                                        government have a great deal
                                                        of autonomy. This is why there
                                                        are often actions which appear
                                                        to      be   contradictory    to
                                                        government       policy     and
                                                        priorities.

                                                        President Putin more often acts
                                                        as an arbitrator between the
                                                        different groups and maintains
                                                        both a power balance and
                                                        political stability.

                                                        For investors, it is important to
                                                        understand how decisions are
                                                        made in Russia and how
                                                        various       individuals      or
                                                        organizations     protect   their
                                                        respective interests and pursue
                                                        their own agendas.

                                                        As a result of the Constitutional
                                                        changes made this year, the
                                                        Duma committees are expected
                                                        to have a greater role and
                                                        influence in setting regulations
                                                        and proposing or altering
                                                        legislation affecting business in
                                                        the country.

Russia | A Basic Guide | July 2021          Independent • Local • Commercial         9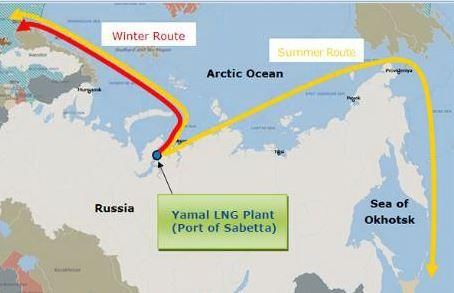
Russia’s Leaders

 Vladimir Putin                                                                           Putin Becomes Russia’s Second Longest-Serving Leader

Born October 7th, 1952 in Leningrad.                                                     Longest-serving Russian Leaders over the Past 100 Years (days in office)

1985-1990 served as a KGB case officer in East Germany.                                            Joseph Stalin                                                               10,636
                                                                                                Vladimir Putin*                                                      7,852
1991-1996 held various posts in St. Petersburg Mayor’s office.
                                                                                               Leonid Brezhnev                                               6,601
August 1996 moved to Moscow to work for the Yeltsin administration.                          Nikita Khrushchev                               3,536
                                                                                                    Boris Yeltsin                         3,096
July 1998-August 1999 was Director of FSB.                                                   Mikhail Gorbachev                         2,480
                                                                                             Dmitrii Medvedev                     1,461
August 1999 was appointed Prime Minister.                                                     Georgii Malenkov              705
                                                                                                 Yurii Andropov            454
December 31st, 1999 Yeltsin resigned, and Putin assumed the Presidency. He was            Konstantin Chernenko             391
formally elected in March 2000.                                                                  Vladimir Lenin            387

March 2004 is re-elected President for four years.
                                                                                         Source: Macro-Advisory *from Jan 1 2000 to June 30 2021

May 2008-12 served as Prime Minister.

March 2012 is elected President for six years.                                            The Great Czars
March 2018 is elected President for a fourth term, until May 2024. By then, Putin will
have been President for a total of 9,040 days. Because of the July 1st Constitutional    Peter I (the Great)                                  ruled from 1682 – 1725
Referendum, Putin may contest two more six-year terms when his current term ends in
                                                                                         Catherine II (the Great)                             ruled from 1762– 1796
May 2024. That would be an additional 4,383 days as leader.
                                                                                         Alexander I                                          ruled from 1801 – 1825

                                                                                         Nicholas I                                           ruled from 1825 – 1855

                                                                                         Alexander II                                         ruled from 1855 – 1881

Russia | A Basic Guide | July 2021                                                                                                          Independent • Local • Commercial      10
Covid-19 & Russia
How Bad? How Does Russia Compare?
Russia moved very quickly with efforts to contain the Covid-19 virus when it started to Russia reported a high rate of infections, largely because of extensive testing, but a low
appear in late March 2020. The government imposed a nationwide lockdown in April, death rate. As of May 2021, Russia reported 5.0 mln infections and confirmed that 4.7
forcing companies to place employees on paid leave. The strict lockdown started to mln of these had recovered. The number of Covid-19 linked deaths, as of that date,
ease from mid-May and most domestic restrictions were eased by end-July 2020. was 119,194.
Russia experienced a third wave of infections in 2Q21 because of the spread of the The number of deaths is relatively low on a per capita basis at 814 per mln population.
Delta variant and reimposed some mild restrictions. But the government made clear it The death rate in Moscow has been much higher, at 1,561 per mln, and roughly in line
would not consider any economically damaging restrictions. with the European average.
The rate of vaccination in the country was low, at approx. 16%, in early June 2021. There is always an element of suspicion when Russia reports relatively favorable data,
A majority of people polled in May 2021 said they were not planning to get vaccinated. and especially in this case when the infection rate is high, but the death count low. The
But that will likely change if/when vaccine certificates are required for travel or to gain government’s statistical agency (Rosstat) publishes more complete data with an
entry to events. As a result, some city authorities started to introduce both incentives to approximate 2-month lag. This shows a near triple number for “excess deaths”. Not all
persuade people to be vaccinated and also restrictions on those who refuse. The of these are Covid related.
government’s target is to achieve so-called herd immunity before winter and that would
require a minimum vaccination rate of 60%.
Comparison of Different Estimates of Covid-19 Deaths, Russia Russia – Official* Deaths per mln Population, as of June 12th
Rosstat
Population 145,934,462
Reported to WHO COVID Primary COVID Present Total Excess Deaths
April 1,145 1,748 1,077 2,825 (2,994) Total infected 5,208,687
May 3,686 7,603 5,066 12,669 18,375
Total 14,322,353
June 4,681 7,317 5,018 12,335 25,521
Vaccinated (2 doses)
July 4,522 6,084 4,287 10,371 29,925
August 3,241 4,018 3,655 7,673 13,787 Total Deaths 126,430
* At June 21 2021
September 3,592 5,199 4,599 9,798 31,666
October 7,344 13,896 8,675 24,333 47,777
November 12,229 19,626 16,019 35,645 78,541
December 17,124 31,550 12,885 44,435 95,408
January 16,064 26,292 10,815 37,107 55,694
February 12,836 16,576 7,793 24,369 29,447
March 12,728 17,457 6,258 23,715 38,620 Source: Worldometer, NB only countries with more than 20 mln per population
Total 73,628 157,366 86,147 197,191 461,767
Source: Russian Government (excess is relative to the previous year)
Russia | A Basic Guide | July 2021 Independent • Local • Commercial 11Economy: The Past
Rapid Progress Since 1998 Size of Russia’s GDP, US$ bln
Russia barely had a functioning economy in the 1990s and statistics for the period are Key Phases in Russian Economy: 2000 – 2030(F)
very unreliable. Poverty was widespread and the wealth gap expanded significantly as Period Economy Reason
the Oligarchs emerged. 2000 - 2008 High Growth Base Effect – Rising Oil Receipts – Banks & Consumer Credit Growth
2008 - 2010 GDP Collapse Oil Price Collapse
The country defaulted on some domestic debt in 1998. 2011 - 2013 Strong Recovery Oil Price Recovery – Budget Expansion – Rising Debt
2014 - 2017 GDP Contraction Sanctions – Oil Collapse – Ruble Devaluation – Incomes Decline
Between 2000 and 2013 the economy grew from US$199 bln to US$2,208 bln. This 2017 - 2019 Slow Recovery Budget Conservatism – Low Investment – A Planning Phase
was partly because of the increase in oil export volumes and the rising oil price. In this 2020 - 2021 GDP Contraction Coronavirus Pandemic
period, Russia earned US$3 tln from oil & gas exports. 2021 – 2024(F) Pre-Election Period Higher Oil – Recovery Programs – Government Needs to Deliver
2024(F) – 2030(F) Target Strong Growth Will Need Sanctions Threat to End and Oil to Stay High
Ruble devaluation and recession in 2015 & 2016 cut the value of GDP while changes Source: Macro-Advisory
adopted by the government, e.g., monetary policies and the Fiscal (aka Budget) Rule,
and the oil price recovery, helped GDP recover to $1.7 tln in 2019. The economy is
expected to recover to that level in 2021.
However, while hydrocarbon receipts dominate the budget and government fiscal
policies, the main drivers of growth have been the emerging consumer and Russia
RussiaGDP,
Value of USUS$
Millions
Russian
GDP, GDP, US$ Billions
bln
infrastructure projects. The former has benefited from rising incomes and state social
spending and because of the emergence of consumer credit.
This year’s economic crisis is the country’s fourth since 1998 but, unlike in previous
crisis periods, the government has a strong financial position with which to fund
recovery programs. National debt is less than 19% of GDP and external sovereign debt
is below 3%.
Source:
Source:Central
CentralBank
BankofofRussia
Russia
Source: Federal State Statisics Service
Russia | A Basic Guide | July 2021 Independent • Local • Commercial 12Economy: The Present
Sanctions, Lower Oil & Covid-19 Structure of GDP
The Russian economy was stuck in a narrow growth range between Impact of Oil (Black line - LHS) on GDP (Blue Line - RHS)
2017 and 2019 (see the table to the right for details) as the
government was more focused on creating a viable strategy to
achieve long-term and sustainable growth. There was a great deal of
criticism about the low volume of spending in this period and
accusations that the government preferred to emphasize stability
ahead of investment.
The economy contracted 3.0% in 2020 as a direct result of the Covid
pandemic. This was a relatively good result, when compared to other
nations in 2020. The reason is because of the structure of the
economy, which is dominated by the state sector and by extractive
industries. They were less affected by the lockdowns. The SME and
MSME sectors, which were badly impacted in Russia, only represent
Source: Central Bank of Russia, Trading Economics
an approximate 25% share of the economy, so the overall impact
was mild. Russia: Macro Trends & Medium Term Forecasts Base Case Scenario*
2016 2017 2018 2019 2020 2021E 2022E 2023E
The Fiscal Rule and the weak ruble significantly reduced the GDP, US$ bln $1,347 $1,635 $1,592 $1,633 $1,546 $1,693 $1,951 $2,155
budget’s vulnerability to oil price volatility. The budget needed Growth, real % YoY -0.2% 1.5% 2.3% 1.3% -3.0% 3.5% 2.5% 3.0%
US$115 per barrel (Urals) to balance in 2013 but balanced at US$48 Inflation - year-end, % YoY 5.4% 2.5% 4.3% 3.0% 4.9% 5.2% 4.6% 4.1%
Central bank key rate, % eop 10.0% 7.8% 7.8% 6.3% 4.3% 6.5% 6.25% 5.75%
per barrel in 2019. The target is to cut the breakeven to US$44 per
barrel and to build up the National Welfare Fund with any surplus. Real disposable income, % YoY -5.9% -1.7% 0.1% 0.8% -3.5% 2.5% 2.0% 2.0%
The NWF was valued at US$180 bln on May 1st 2021. Unemployment, % eop 5.4% 5.0% 4.7% 4.6% 5.9% 5.2% 4.8% 4.8%
Budget, balance % of GDP -3.4% -1.4% 2.7% 1.8% -3.8% -0.5% -0.1% 0.0%
Current account, % GDP 1.9% 2.1% 7.1% 4.3% 2.2% 2.7% 2.6% 2.6%
RUB/US$, year-end 61.3 57.7 69.4 62.0 74.4 68.0 66.0 64.0
RUB/EUR, year-end 64.5 69.7 79.5 69.5 91.5 81.0 78.0 75.0
Brent, US$ p/bbl, average $45 $55 $72 $64 $43 $62 $70 $75
Source: State Statistics Agency, Central Bank, Macro-Advisory estimates *as at June 22nd 2021
Russia | A Basic Guide | July 2021 Independent • Local • Commercial 13National Economic Recovery Plan
Response to Covid-19 Lockdown Targets for Social & Economic Recovery
Having stabilized the infection spread and largely eased the lockdown restrictions, the
1. Real income growth • Real wage growth of 2.5% per annum by end 2021
government has put in place a program – the National Economic Recovery Plan
• Share of those with incomes below subsistence level to be lower
(NERP) - to initially stabilize the economy and then move the growth rate back to the
than the level of 2019
level it was at pre-crisis.
• Retail sales growth at 3% per annum
The NERP is an eighteen-month program with specific goals set for each of three • Retail services growth at 2.5% per annum
separate stages:
2. SME Growth • Restore employment in SMEs to the level of 1Q20
1. Adaptation period, from July 1st to September 30th 2020. Here the aim was to • SMEs growing faster than GDP
stabilize the economy and to stop the fall of household incomes.
3. Investment • Investment growing at 4.5% per annum
2. Restoration period, from October 1st 2020 to June 30th 2021. Here the aim was
to restart growth of the economy and incomes.
4. Technology • Growth of value-added in IT sector faster than GDP growth
3. Active growth period, from July 1st to December 31st 2021. This period is when • Number of technology SMEs growing at 10% per annum
the economy should return to pre-Covid growth levels and the economy return
back to the previous long-term development plan, based on the National 5. Exports/import substitution • Growth of non-commodity, non-energy exports of 5% per annum
Projects program.
6. Help Affected Sectors • Industrial output growth of 3% per annum
The total cost of the NERP is estimated at RUB7.3 tln (approx. US$105 bln). The main
items are RUB2.2 tln for infrastructure, RUB1.3 tln to support SMEs, RUB1.1 tln to help
7. Boosting Resilience • Return to death rate trend set in Healthcare National Project
expand the export sectors and RUB1.0 tln to fund the purchase of equipment by state
• Reduce regional debt to agreed levels
agencies.
Russia | A Basic Guide | July 2021 Independent • Local • Commercial 14Russia’s Balance Sheet
Foreign Trade and Current Account National Debt and Federal Budget
Russia
Russia Reports
Reports a Large
a Large TradeTrade Surplus
Surplus (US$(US$
mln)millions)
each yearEach Year National Debt (% of GDP) is the Sixth Lowest in the World
Source:Source:
CentralCentral
Bank ofBank of Russia,
Russia, Trading
Trading Economics
Economics Source: Ministry of Finance
Current AccountSurplus,
Current Account Surplus,%%ofofGDP
GDP Budget Surplus Returned in 2018 (% of GDP) But Covid Spending Reversed That in 2020
Source:
Source:Central
CentralBank
BankofofRussia
Russia Source: Ministry of Finance
Russia | A Basic Guide | July 2021 Independent • Local • Commercial 15Economy: Forecasts
Sanctions, Lower Oil & Covid-19 Macro Forecast Scenarios
The economy contracted by 3% in 2020. The main drivers were the Macro Forecast Scenarios 2021-23*
Covid lockdown in 2Q20, the decline in global trade and Russia’s 2019 2020 2021F 2022F 2023F 2021F 2022F 2023F 2021F 2022F 2023F
participation in the OPEC+ agreement., which resulted in a drop of
Optimistic Scenario Base Case Pessimistic Scenario
2.0 mln barrels per day, or approximately 20% of total output, from
Growth, real % YoY 2.3% -3.0% 4.0% 3.0% 3.5% 3.5% 2.5% 3.0% 2.0% 1.5% 1.9%
May 1st, 2020.
CPI – year-end, % YoY 4.3% 4.9% 4.5% 4.0% 3.5% 5.2% 4.6% 4.1% 6.0% 5.2% 4.9%
The consumer orientated sectors, especially in the durable goods Central bank key rate, % 7.8% 4.3% 5.75% 5.50% 5.00% 6.50% 6.25% 5.75% 7.00% 6.75% 5.00%
area, fell the most as people were unable and unwilling to spend on Retail Sales, % YoY 2.6% -4.1% 6.5% 4.5% 4.5% 5.5% 4.0% 3.0% 3.5% 2.5% 2.5%
non-essential items. Retail disposable inc., % YoY 0.1% -3.5% 3.5% 3.0% 2.5% 2.5% 2.0% 2.0% 1.5% 1.0% 1.0%
Budget, balance % of GDP 2.7% -3.8% 0.0% 0.5% 1.0% -.05% -0.1% 0.0% -1.5% -2.5% -2.0%
If there is no repeat of the Covid lockdown, and the price of Brent
Current account, % GDP 7.1% 2.2% 3.3% 3.4% 4.0% 2.7% 2.6% 2.6% 1.5% 1.0% 1.2%
averages just under US$60 per barrel, the economy is expected to
bounce by 3.5% in 2021. The recovery will be led by the sectors RUB/US$, year-end 69.4 74.4 65.0 63.0 61.0 68.0 66.0 64.0 78.0 75.0 72.0
worst affected last year, e.g., the consumer areas, and by the oil and RUB/EUR year-end 79.5 91.5 77.0 73.0 70.0 81.0 77.0 73.0 93.0 88.0 83.0
gas companies. Brent, US$ p/bbl, average $72 $43 $75 $80 $85 $62 $70 $75 $55 $56 $55
Source: Macro-Advisory Ltd estimates *as at June 22 2021
The table on the top right, shows the summary results expected for
2021, 2022 and 2023, based on pessimistic, base and optimistic
scenarios.
Sanctions and Response Scenarios for GDP and Currency Outlook
Effective responses and no more economically damaging sanctions
The table on lower right shows the estimated trend in the economy
2022F 2024F 2026F 2028F 2030F
using positive and negative sanctions scenarios and therefore the
GDP, % change YoY 3.0% 2.5% 3.0% 4.0% 4.5%
level of investment and government policy actions.
Ruble/US$ exchange rate, average 64.0 62.0 63.0 65.0 65.0
Brent, US$ p/bbl (average) $70.0 $80.0 $70.0 $65.0 $55.0
Ineffective responses and additional economically damaging sanctions
GDP, % Change YoY 3.0% 1.8% 2.2% 2.5% 2.2%
Ruble/US$ Exchange rate, average 64.0 69.0 72.0 75.0 78.0
Brent, US$ p/bbl (average) $70.0 $80.0 $70.0 $60.0 £55.0
Source: Macro-Advisory estimates and scenarios
Russia | A Basic Guide | July 2021 Independent • Local • Commercial 16Economy: Potential
Preparing for a New Growth Model Big Potential
As of mid 2021 Russia’s nominal GDP on a per capita basis was US$11,492. The Continental Shift: The World’s Biggest Economies Over time
World Bank calculates that the GDP per capita using Purchasing Power Parity (PPP) is Countries with the Highest GDP on Earth in 1992, 2008 and 2024
US$27,044.
PPP shows the potential for economic expansion in a country and indicates Russia to
have more than 100% upside. PPP does not imply any timescale as realizing the
potential will depend on effective government actions and other factors. The graphic on
the right assumed a continuation of the trend seen before the Covid-19 crisis.
If/when this potential is realized, the key future growth sectors will include:
• Agriculture and Food Processing
• Technology and Digitalization
• Environment and climate management
• Renewable Energy
• Online Retail and Services
• Logistics & Packaging
• Financial Services
• Petrochemicals
Source: World Bank and IMF * Projection
• Infrastructure & Housing
• Value-Added Processing in Extractive Industries
• Leisure & Tourism
• Healthcare, Medical Equipment and Pharma
• Engineering
Russia | A Basic Guide | July 2021 Independent • Local • Commercial 17National Projects Program
What is the Purpose? 13 Separate Categories
The National Projects Program (NPP) is the government’s strategy to boost economic National Projects Spending Sources (RUB bln, US$ bln and EUR bln)
growth and improve social and demographic conditions. The program was originally Source Ruble bln US$ bln EUR bln** %
Spending spending*
aimed at delivering results by 2024, but the need to divert resources to cover the Covid-
Human Capital
19 pandemic has resulted in the timeline being extended to 2030. Health 1,726 23.80 21.98 6.7%
Education 785 10.82 9.99 3.1%
The full program envisages total spending of US$350 bln with US$126 bln coming from Demographics 3,105 42.83 39.56 12.1%
the Federal Budget. The rest of the money is planned to come from Regional budgets Culture 114 1.57 1.45 0.4%
and from private investors and strategic co-investors via, e.g. PPP schemes.
Quality of Life
Safe and better roads 4,780 65.93 60.89 18.6%
Some of the goals of the NPP have also been adjusted because of the Covid-19 crisis.
Housing 1,066 14.71 13.58 4.1%
The main goals, the so-called National Development Goals, are: Ecology 4,041 55.74 51.48 15.7%
• Improving public health and well-being Economic Growth
Science 636 8.77 8.10 2.5%
• Increasing opportunities for self-realization and talent development Small business 482 6.64 6.13 1.9%
Digital Economy 1,635 22.55 20.83 6.4%
• Creating a comfortable and safe living environment Labor Productivity 52 0.72 0.66 0.2%
Export Support 957 13.20 12.19 3.7%
• Increasing labor efficiency and developing entrepreneurship Transport Infrastructure 6,348 87.56 80.87 24.7%
Total 25,727 354.83 327.71 100%
• Achieving digital transformation Source: World Bank and IMF
• Increasing fixed capital investment by 70% in 2030 over 2020
• Increasing exports of non-primary, non-energy goods by 70% in 2030
Increasing investment in domestic IT projects by four times by 2030
• Life expectancy to rise to 78 years (circa 72.5 years today)
• Reducing the poverty rate to 6.6% of the population by 2030. The World Bank
estimated the poverty rate at 12.1% at the end of 2020 and forecast it to fall to
11.4% by end 2021.
Russia | A Basic Guide | July 2021 Independent • Local • Commercial 18Energy, the Economy and the Ruble
Reducing Budget Vulnerability to Oil Ruble is No Longer a Petro-Currency
The government finally acted to reduce the impact of oil price volatility on the economy Ruble-Dollar
Ruble-Dollar Exchange
Exchange Rate Rate
and in the federal budget with the adoption of the Fiscal (Budget) Rule. This measure
sets the annual budget oil price assumption at US$44/bbl (Urals) and all revenue
earned above that is diverted to the National Fund (Sovereign Wealth Fund). The
money in this fund, valued at almost US$190 bln in June 2021, is then used to fund
state investment programs, and to cover any additional budget spending.
The Federal Budget needed US$115/bbl oil to balance in 2013. In 2019 the budget
balanced with Urals under US$50/bbl. The target is to get it to balance at US$44/bbl
from 2023, although the legacy of the Covid-19 crisis may delay this target date.
• 31% of tax revenue comes from the oil sector
• 13% of tax revenue comes from the gas sector
• The aim is to cut this total to 40% by 2024
• 52% of total exports (2020) were from oil and gas
Source: Trading Economics
• 29% of total GDP (when expanded to consider services, etc.) is linked to Source: Trading Economics
hydrocarbons, but this percentage is reducing as other sectors of the
economy, such as agriculture, grow faster.
Brent, US$ p/bbl, Changes and Ruble Exchange Rate Movement
Current* 2021 YTD* 1Q21 4Q20 3Q20 2Q20 1Q20
Brent, US$ p/bbl $74.90 45.9% 21.1% 30.8% -4.6% 65.4% -62.5%
Ruble-US$ rate 73.13 1.8% -1.7% 5.1% -4.8% 5.9% -21.4%
Ruble - EUR rate 87.07 5.1% 3.2% 0.1% -4.4% -1.0% -19.9%
Source: Bloomberg * as at mid-session June 22nd 2021
Russia | A Basic Guide | July 2021 Independent • Local • Commercial 19Sanctions
Main Sanctions Major Sanctions – With Greatest Economic Impact
The US, EU and several other nations applied sanctions to Russia in 2014 as a result Crimea sanctions (March 2014) These measures started the process which has led to more than 50
of the Crimea referendum / admission to the Federation and the downing of the separate sanctions by the US against Russia since.
Malaysian (MH17) airliner.
Sectoral (August-December 2014) They initiated the focus on the Energy, Finance, and Technology
sectors.
Theses sanctions applied restrictions on investment in some areas of the Russian
energy, finance and technology sectors. CAATSA (August 2017) This is, to date, the most significant of the sanctions applied to
Russia. It established the framework for the many OFAC and
The US sanctions were extended with the CAATSA legislation from August 2017. This Treasury Department actions since.
legislation also introduced the threat of secondary sanctions. A total of over 50
separate sanctions have been applied to Russia by the United States since 2014. The OFAC Tightening (November 2017) Material tightening of the sectoral sanctions in the energy, financial,
and technology sectors.
most recent being in April 2021.
SDN Expansion (April 2018) Added Oleg Deripaska and several other Oligarchs to the SDN list.
US sanctions have no time limit. Any easing of sanctions will require Congressional It also added Rusal (briefly), GAZ, and other companies.
approval. EU sanctions must be approved by all EU states every six months.
CNW - 1 (August 2018) These measures represented another material tightening of
The Russian government responded with a ban on the import of food products from existing measures.
those countries that applied the 2014 sectoral sanctions. This ban is reviewed each
CBW - 2 (August 2019) Much more significant move then the CBW sanctions of August
year. 2018. It place a ban on US investors buying new issue Russian
sovereign Eurobonds.
B.I.S (October 2020) Greatly restrict the technology and technical services that can be
exported from the US to Russia.
NS2 Sanctions NDDAA (Dec 2019 NDAA is December 2019. PEESCA (dec 2020)
and OFAC (Jan 2021).
Biden Sanctions (April 2021) The only measure that may have an impact on the Russian
economy or future industrial development, is the ban on US
investors buying new ruble-denominated debt issued by the
Russian Finance Ministry, the Central Bank, or the National
Welfare Fund after June 14th.
Russia | A Basic Guide | July 2021 Independent • Local • Commercial 20Sanctions – Impact on Russia
Sanctions Impact – Initially Positive but Turned Negative
Sanction Event Russia Response Positive impact Negative Impact Observed Result
Long-Term
Game-Changing Medium-Term Short-Term Short-Term Medium-Term
Damaging
Ban on imported food plus the weak ruble finally led to a big increase in investment
2014 Sectoral sanctions in the agricultural & food sectors. Russia is much less reliant on imported food and is
a big agricultural & food exporter. The effect of the food ban and weak ruble was a
Moscow’s reaction to the 2014 sanctions has been Agriculture & Food spike in inflation to 18%, with food prices up over
proactively positive. To a large extent, this was also The government was finally forced into abandoning the strong ruble policy (from 25%. Both have fallen since. Inflation Spike
because of the collapse in oil revenues at the same time. Weak Ruble 1Q15). A weak ruble policy has helped boost economic competitiveness and
It meant that the government had few options and was exports, which usually supports the budget.
forced into both a more flexible policy response while Less Oil Dependant Higher Interest Rates
also maintaining greater fiscal discipline. The combination of sanctions plus the oil price collapse (from mid 2014) limited the The Central Bank was forced to raise it’s Key Rate
Fiscal Rule government’s options. It has led to the Budget Rule, which will see the budget to 17% in an effort to control inflation and stabilize
The reaction to the sectoral sanctions has been very breakeven at $44/bbl in 2021 (it was $115 in 2013). the ruble. That hurt activity in 2014 & 2015. Reduced Investment
positive and has led finally to increased investment in Political Diversification
agriculture and other sectors, plus it has led to the start It is too early to be able to assess the effect of Foreign investment fell in 2014 and 2015 and that
of export diversification and greatly reduced Russia’s Moscow’s efforts to diversify political, trade and hurt activity and growth plans. FDI and Investment
vulnerability to volatile oil revenues. investments relations. picked up strongly in 2016 and 1H17.
CAATSA legislation The introduction of the threat of secondary sanctions by the US is potentially a
game changer for foreign investors in Russia. Since the legislation was signed
there has been a much slower flow of investment and big multi-nationals are Secondary Sanctions Threat
While the reaction to the sectoral sanctions has been a
More Focused Policy The government has become a lot more serious wary.
clear net positive, that started to change with the
Localization about creating the basis of a new and diverse
CAATSA legislation from August 2017. Foreign investors
economic model. The CAATSA legislation had removed the power of the US president to ease Congressional Control of
have become a lot more wary and have slowed or
sanctions without first getting Congress approval. It means that US sanctions are Sanctions
suspended activities. That has damaged recovery
prospects. likely to remain in place indefinitely and keep in place investment risk.
The continuing slew of new sanctions and the threats from Congress of more to Elevated Investment Risk - has
CBW Sanctions & BIS Tightening It is far too early to be able to say whether the come have strengthened the view that investing in Russia is high risk. Investors reduced the flow of private
proposed National Projects program will work. But it need to carry out greater due-diligence and will be a lot more careful for longer. investment
The continued expansion and tightening of sanctions is a long overdue positive development.
against Russia has both encouraged Moscow to try to National Projects
The bad relations between Washington and Moscow
improve its financial and economic position and to look Geopolitical Risk is Higher -
means that almost any event may be handled worse
for ways to attract more investment. More Focus On Recovery adding to the risk or perception
than previously.
Programs of higher sanctions risk
The government’s more conservative approach has at
But the accumulation of sanctions and the perception least resulted in an improved balance sheet and more
that the cycle of sanctions will not end, is hurting these Russia is struggling to source some equipment,
money is available to fund future programs. More conservative spending
efforts. especially technology and specialist services.
Reluctance to invest in projects
Political relations between Moscow and (most) Western governments is at a very
Continuing Sanctions Risk low point. That creates a dangerous backdrop where new points of conflict may Much harder to attract
ESG and Climate emerge and escalate quickly in the absence of normal dialogue. It means that investment
Russia is more willing to engage in such areas as
The US added new sanctions in April and is required to Cooperation sanctions risk stays high and Moscow could be forced into a position where it
climate change as it seeks ways to engage with
add one more set of sanctions under the CBW bill. This needs to retaliate more aggressively. China drift is increasing
Western nations and to be part of the top table on
frequency of sanctions has created the view that Greater Domestic - Social global issues.
sanctions risk will not ease for a long time. Priority The slower pace of economic recovery and expansion could also lead to a less The government is too focused
stable domestic social and political dynamic, especially as the existing leadership on short-term problem-solving
That is affecting the Russian government’s planned Growing Number Who struggles. and not enough on longer-term
economic, social and political actions. Want Political Changes to strategic developments
End Sanctions and Bad The government has previously reacted to periods of More and tighter sanctions will result in lower investment and a much slower
It is also making economic expansion and social change Geopolitics crisis with greater efforts to improve the business pace of economic expansion - the economy will stay vulnerable to external Risk of social instability is
more difficult. climate. shocks. growing
Source: Macro-Advisory Ltd.
Russia | A Basic Guide | July 2021 Independent • Local • Commercial 21Global Business & Perception Rankings
Business Rankings Perception and Taxation
Global Competitiveness(ranking
Global Competitiveness (out of 140 Countries)
out of 140 Countries) Corruption Perception
Corruption Perception (out ofout
(ranking 180ofCountries)
180 Countries)
Source:World
Source: WorldEconomic
EconomicForum
Forum Source:Transparency
Source: TransparencyInternational
International
Ease
Ease of
of Doing Business (out
Doing Business of 190
(ranking out Countries)
of 190 Countries) Russian Tax Rates
Corporation Tax, % 20.0%
Regional Tax (optional), % 4.0%
Personal Income Tax - below RUB 5.0 mln, % 13.0%
Personal Income Tax - above RUB 5.0 mln, % 15.0%
Dividends, % 15.0%
Sales Tax, % 20.0%
Social Security tax, % 30.0%
Employer , % 30.0%
Employee, % , 0.0%
Source:
Source:World
WorldBank
Bank Ease
EaseofofBusienss
BusinessSurvey
Survey Source: Ministry of Finance
Russia | A Basic Guide | July 2021 Independent • Local • Commercial 22ESG in Russia
Environment Social Governance
New prominence under ESG Covid accelerates development Relatively poor performance
The Environment factor has been pushed to the forefront The Covid crisis has brought fresh emphasis to factors In international comparisons, Russia tends to score low
of international debate, mainly in view of the urgency to such as workplace wellbeing, health and safety and on the G factor. In many ways, this is a ’legacy’ view,
adopt stringent measure on climate change. employment protection, factors which fall under the since many international observers are influenced by the
Social category. In international ratings, Russia scores lawless state of Russia in the 1990s. There have been
Russia now catching up well in this category, as enterprises have a tradition, marked improvements since that time, but instances of
As a major hydrocarbon producer, Russia has been dating from Soviet times, of promoting workers’ welfare corruption do still occur and the government has pledged
reluctant to adopt energy transition policies. Now, and employment protection itself to combat this defect and its perception, realizing
however, the situation has become too critical to side- that it damages the image of the country overseas. The
step and the government is working hard on a package Jobs secured legacy of the Baring Vostok case will take a long time to
of climate change measures, to be adopted in late 2021. Unemployment in Russia is traditionally low, even in overcome.
times of economic crisis. In large part this is because
Going its own way workers are prepared to accept (temporary) pay cuts, International pressure helps
Russia argues that successful energy transition requires rather than agree to redundancies. This ‘social contract’ Those large Russian companies which have
different approaches in different countries, while moving with employers eases the worst shocks of mass international shareholders have moved quickly to
to the same goal of reduced emissions. So, the country unemployment and helps develop loyalty between improve their ESG performance. They realize that
looks to those aspects of the energy transition which workers and managers international investors are now heavily swayed by ESG
play to its strengths, such as producing blue hydrogen factors and that this pressure will not abate. Some of the
from natural gas and promoting nuclear and hydro power Structure of economy helps best ESG performers, such as Lukoil and Polyus Gold,
generation The Russian economy is dominated by large receive international recognition.
enterprises, with small and medium companies being
Picture not as bad as sometimes painted underrepresented. While this is an issue in itself, i.e. for Other issues lag
The electricity generation mix in Russia is approximately achieving faster headline growth, it does mean that Russian companies as a whole have still not fully
20% hydro, 20% nuclear and 40% gas (the cleanest company policies relating to the ‘S’ of ESG can be embraced other factors under the G heading, such as
hydrocarbon fuel). While solar and wind generation are implemented rapidly and thoroughly, since the larger diversity, boardroom pay and full transparency in their
still small (ca 1%) they are growing rapidly. Thus, the companies, especially those in the state sector, have the operations. These are quietly climbing the agenda, as
country claims to be already far along the path of low resources to roll out comprehensive programs the ESG wave grows stronger, but it will take some time
carbon generation. before full international ESG performance is attained.
Russia | A Basic Guide | July 2021 Independent • Local • Commercial 23Russia’s Energy Sector
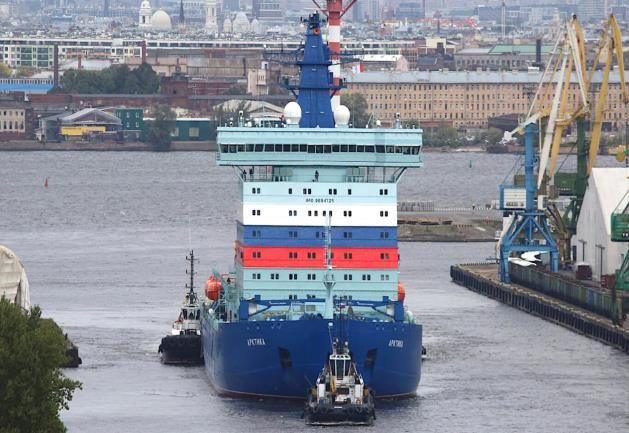
Hydrocarbons LNG, Electricity & Coal Arctic
Gas: 38 tln cu/m reserves, the largest in the Russia opened one of the world’s largest LNG facilities
World (BP Review). in Yamal in December 2017. Phase 1 (LNG 1) has a
capacity of 17.4 mtpa. LNG 2 is due to open in 2023 with
679 bln cu/m produced in 2019 capacity of 19.8 mtpa. LNG 3 is expected to commence
(2nd in world after US). from 2024.
Exports 235 bln cu/m (world’s It will use a fleet of LNG ice-breaker tankers to ship the
highest). gas to Europe and Asia. The world’s largest nuclear-
powered ice-breaker (bottom right) was launched in
Oil: 107 bln bbl reserves – 6.2% of world total 2020. The Arktika entered service in 2021.
(BP Review).
Russia ranks 4th in terms of nuclear power production
11.54 mbpd average production* in 2019 with 1.86 exajoules* in 2019 (BP).
(3rd after the US – 17.45 mbpd –
and Saudi Arabia – 11.83 mbpd). 5th in terms of Hydroelectric production (1.73 exajoules
in 2019).
8.2 mbpd exports** (1st in world and ahead
of Saudi Arabia in aggregate (8.05 mbpd) The world’s 12th largest exporter of electricity.
but Saudi Arabia exports more crude
than Russia). Coal reserves: 2nd largest in the world (15.2% of total),
after the US (23.3% of the total).
Refineries: 5.83 mbpd capacity (3rd largest Coal production is 5.5% of world total and ranks the 6th
after the US and China). biggest producer in world).
Coal exports totaled 5.57 exajoules in 2019, the 3rd
largest in world.
* Includes all sources and liquids
** crude and all refined oil products * 1 exajoule is equal to 163.46 mln barrels of oil equivalent (MMBOE)
Russia | A Basic Guide | July 2021 Independent • Local • Commercial 24Renewable Energy Strategy
Renewables in Russia Government Strategy
‘True’ renewables, such as wind and solar, have a very small percentage of the Russia’s Emission Reduction Pledge Means More Pollution Until 2030
Russian electricity generation market. However, the high proportion of gas, nuclear and
hydro generation (70-80% combined) leads Russian officials to insist that the country is
a low-carbon economy.
At beginning of 2021, Russia had 2.9 GW of renewable energy (1.2% of energy mix):
• Solar 1,734 MW
• Wind 1,030 MW
• Other 136 MW
(Modest) plans to increase renewables in generation mix to 4% by 2035.
Source: Our World in Data
Russian Electricity Generation Mix 2020 Russia Summary of Pledges and Targets
Paris Agreement Ratified Yes
25-30% below 1990 by 2030
2030 unconditional target(s) [19-24% below 1990 by 2030 excl. LULUCF]
[18-25% below 2010 by 2030 excl. LULUCF]
Coverage Economy-wide incl. LULUCF
Target is subject to ”the maximum possible account
LULUCF
of absorbing capacity of forests”
Copenhagen Accord 2020 target(s) 12-25% below 1990 by 2020 (excluding LULUCF)
a) Appropriate accounting of the potential of
Condition(s) Russia’s forestry sector,
b) The undertaking by all major emitters of legally
binding obligations to reduce emissions
Kyoto Protocol (KP) Member of KP CP1 (2008-2012) Yes
Member of KP CP2 (2013-2020) No
Source: System Operator, VTB Capital Research KP CP1 target (below base year) 0% below 1990
Long-term Goal(s) Long-term Goal(s) None (Draft long-term strategy released March 2020)
Russia | A Basic Guide | July 2021 Independent • Local • Commercial 25Russian Hydrocarbons in Graphs
Russia is the World’s Largest Oil Exporter* Russia’s Major Gas Customers, 2019*
Russian OilRussian
Production, ‘000 bpd '000
Oil Production, (2000-2021)
bbl/d (2000 - 2021)
Source: Trading Economics
Source: Trading Economics
Russian Oil Production, ‘000 bpd average
1Q20 March April % of April
000 bpd 000 bpd 000 bpd
Rosneft 3,889 3,853 3,814 33.5%
Lukoil 1,640 1,654 1,708 15.0%
Surgutneftegaz 1,220 1,220 1,314 11.6%
Gazprom Neft 782 803 795 7.0%
Independents 548 559 555 4.9%
Tatneft 586 578 487 4.3%
Gazprom 408 404 405 3.6%
Bashneft 378 379 363 3.2%
Slavneft 277 281 281 2.5%
Novatek 165 162 162 1.4%
Russneft 143 145 144 1.3%
Neftegaz 41 41 40 0.4%
Assoc & JVs 836 838 836 7.4%
Core Oil Producers 10,913 10,915 10,905 96.1% * Pipelines to open in 2019-21
Others 367 375 445 3.9% - Power of Siberia 1, to China with capacity of 38 bcm
Total Russian Oil Output 11,280 10,917 11,350 - Turkish Stream 1, to Turkey with capacity of 31.5 bcm (Phase 2 will have 55 bcm
Source: Russia Energy Department, CDU TEK - Nord Stream 2 planned capacity is 55 bcm (when eventually at full capacity)
Russia | A Basic Guide | July 2021 Independent • Local • Commercial 26World’s Biggest* Metals Provider
Industrial Metals Production Ranking Some of World’s Biggest Mines
Nickel 2nd largest producer
Aluminum 2nd
Rare earth metals** 4th
Steel 5th
Timber 6th
Coal 6th
Lead 7th
Rubber 8th
Copper 9th
Norilsk, in the Arctic Circle, is home to the world’s biggest nickel mine
Precious Metals/Stones Production Ranking
Diamonds 1st
Platinum 2nd
Palladium 2nd
Gold 3rd
Silver 5th
The world’s largest diamond mine, and the world’s 2nd largest man-made hole, is
located in Mirny in east Siberia.
• Based on aggregate production and exports
** Russia has the world’s 3rd largest reserves of Rare Earth Metals. It has a 16.6% share. China is the leader
with a 35.4% share, followed by Brazil with a 17.7% share
Russia | A Basic Guide | July 2021 Independent • Local • Commercial 27Russian Consumer
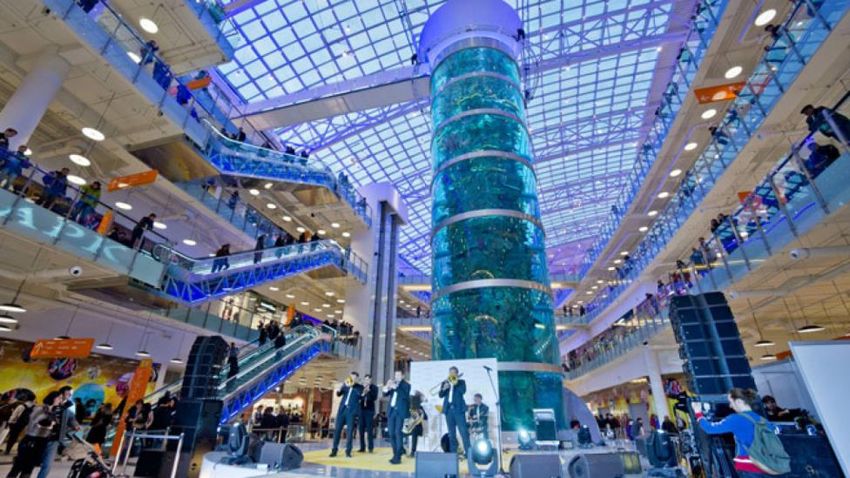
Spending Power in Russia Aviapark, Moscow, is Europe’s Largest Mall*
Largest population in Europe. 100 mln people live in European Russia. Opened Nov 2014 with 500 shops over 390,000 square meters of total space. It has the
tallest cylindrical aquarium in the world at 22.31 meters
In 2013 (pre-recession), Russia had the world’s 5th largest consumer economy and was
rapidly catching-up with Germany.
World’s 6th biggest economy - PPP GDP (World Bank/IMF).
Russia has the 5th largest number of billionaires (117), according to Forbes,
and Moscow, with 79 billionaires, is 4th after Beijing (100), New York (99) and Hong
Kong (80).
Russia is home to 246,000 millionaires, the 21st largest number in the world, according
to Credit Suisse data.
Highest per capita wealth and largest household wealth amongst all emerging
economies (OECD data).
56.5 mln households.
One of the fastest growing e-commerce markets in the world, worth almost US$23.6 bln
in 2020, up 21% YoY. It is projected at US$100 bln by 2028.
Russia is the only country in the world with an indigenous search engine, Yandex, that
successfully competes with Google. Yandex and Google each have close to 50% of the
market.
Smartphone usage = 110 mln or 76%, Internet penetration = 85%, as of January 2021.
Moscow is ranked 413th (out of 604 cities) in the Numbeo.com cost of living survey.
It has a cost index of 41 (New York = 100).
*Source: WorldAtlas
Russia | A Basic Guide | July 2021 Independent • Local • Commercial 28Agriculture
A Priority Growth Sector Moving Towards Self-Sufficiency
Reducing Russia’s food imports and becoming self-sufficient in key areas, and for the Russia’s FoodFood
Russia's & Agriculture
& AgricultureProduce
Produce Imports and
Imports and Exports,
Exports, US$ US$
billionbln
Russia's Food & Agriculture Produce Imports and Exports (US$ billions)
most important products, became a policy priority in late 2010. 50
45
Progress remained slow until the imposition of sanctions in late 2014. Since then, food 40
security is an issue of national security and progress has been much faster. Russia is 35
now largely self-sufficient in all key areas. 30
25
The government is now moving to boost the agriculture and food sectors so that the 20
country becomes a bigger exporter, and these products add to economic and export 15
diversification. The target is to increase the value of food exports to US$45 bln by 2024 10
(from US$25 bln in 2019). While this is a very aggressive target, the direction is for 5
0
strong export growth. 2011 2012 2013 2014 2015 2016 2017 2018 2019
Exports Imports
Russia’s agriculture efficiency is still low by world standards. IT is improving slowly and
offers significant output growth potential over the longer-term. Source:Russia
Source:
Source: Russian Russian Customs
Customs
Customs Department
Dept.
Dept.
The weak ruble policy is a key element in providing support for the sector, especially for
Russia’s March Towards Food Self-Sufficiency
the bulk traded commodities. The government is also adopting other measures to
Table 1. Comparison of Specific Food Security Targets, 2010 Doctrine vs 2020 Doctrine
attract more investment into food processing with the aim of increasing value-added Minimum production Self-sufficiency Actual level
Product
food exports. targets, set in 2010 indicators, set in 2020 in 2019
Grain 95% 95% 170.8%
The expanding BRI rail network also makes it a lot easier, faster and cheaper to export Sugar 80% 90% 112.6%
produce and processed foods to China and other Asian markets. This is especially Vegetable oil 80% 90% 198.4%
Meat and meat products (on meat basis) 85% 85% 94.6%
helpful for Russian exports as China is forced to look for alternatives to US products
Milk and dairy products (on milk basis) 90% 90% 81.7%
which have been, or may be, blocked due to trade restrictions.
Fish products (in live weight – raw weight) 80% 85% 154.5%
Potatoes 95% 95% 100%
Vegetables, melons and gourds N/A 90% 95.8%
Fruit and berries N/A 60% 33.9%
Seeds of key crops of domestic selection N/A 75% 2.90%
Edible salt 85% 85% 63.6%
Source: Agroinvestor
Russia | A Basic Guide | July 2021 Independent • Local • Commercial 29Eurasian Economic Union
A Catalyst for Trade Growth EaEU Trade Footprint is Expanding
Russia is one of the five members of the Eurasian Economic Union (EaEU), which Footprint of the Eurasian Economic Union
has a combined population of 185 mln and an aggregate GDP valued at US$2.1 tln
(2021E). Using the World Bank’s Purchasing Power Parity methodology, the
potential value of the EaEU GDP is US$4.7 tln or more than 100% upside.
The Supreme Eurasian Economic Council is the highest supranational body of the
Eurasian Economic Union (EaEU) and is composed of the Heads of State or
Government of member states of the EaEU, with meetings by the heads of state at
least once a year. Decisions are taken by consensus – all states have an equal vote
- and are binding on all States, which include Armenia, Belarus, Kazakhstan,
Kyrgyzstan, and Russia.
The EaEU is focused only on trade and has no security or political agenda. The
trade and economic structure is modelled on the European Union and while, initially,
Expanding Trade Deals
Source: Russia-Briefing
it was planned to expand the membership, the strategy now is to focus on trade
deals with neighboring states. Expanding Trade Deals
Current & Potential Members
As of June 2021, the EaEU has signed Free Trade Agreements with Vietnam,
Singapore, Serbia, Iran and Uzbekistan. An FTA with China has also been signed
off but at present remains ‘non-preferential’ – meaning no tariff reductions have yet
been agreed. However, both Russia as the largest EaEU market, and China have
committed to boosting their bilateral trade and stated they intend to double it by
2024 to US$200 bln per annum.
Moscow initiated the EaEU, at least in part, to counter the Chinese Belt and Road
network expansion. The EaEU is a mechanism that allows Moscow to stay fully
engaged with the Central Asian states, at a time when China is expanding its
economic presence. It also takes advantage of the expanding rail network to
facilitate greater internal and external trade.
Source: Russia-Briefing
Source: Russia-Briefing
Russia | A Basic Guide | July 2021 Independent • Local • Commercial 30You can also read