Redefining Resource Adequacy for Modern Power Systems - ES A Report of the Redefining Resource Adequacy Task Force 202
←
→
Page content transcription
If your browser does not render page correctly, please read the page content below

Redefining Resource Adequacy
      for Modern Power Systems

A Report of the Redefining
Resource Adequacy Task Force
202 1                           ES
                                 Energy Systems
                               Integration Group
ES
                     ENERGY SYSTEMS
                   INTEGRATION GROUP

                   About ESIG

                   The Energy Systems Integration Group is a nonprofit organization
                   that marshals the expertise of the electricity industry’s technical
                   community to support grid transformation and energy systems
                   integration and operation, particularly with respect to clean
                   energy. More information is available at https://www.esig.energy.

                   ESIG’s publications

                   This report, as well as other reports and briefs by ESIG, is available
                   online at https://www.esig.energy/reports-briefs.

                   Get in touch

                   To learn more about the recommendations in this report,
                   please send an email to resourceadequacy@esig.energy.

                   To learn more about the Energy Systems Integration Group,
                   send an email to info@esig.energy.

Redefining Resource Adequacy for Modern Power Systems                       Energy Systems Integration Group ii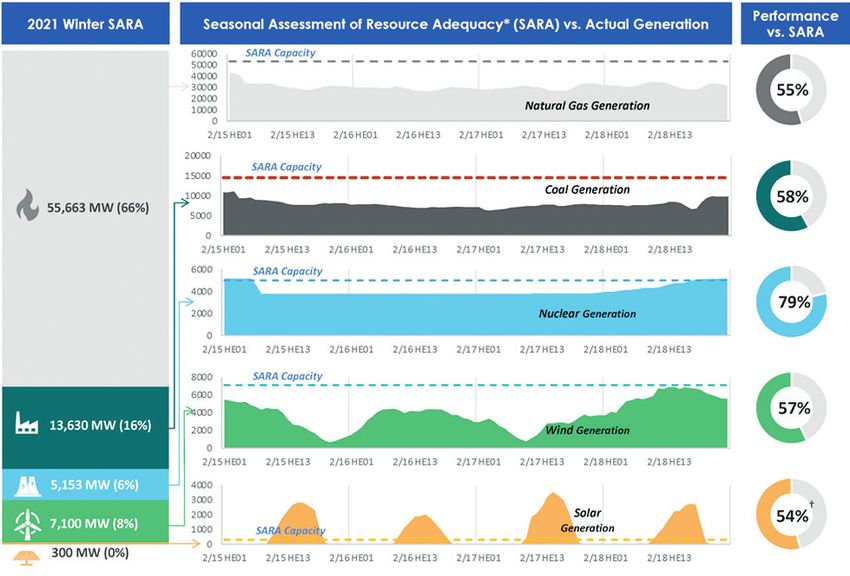
Redefining Resource Adequacy
         for Modern Power Systems
         Report of the Redefining Resource Adequacy Task Force

         Authors
         Prepared by Derek Stenclik, Telos Energy
         The core members of the Redefining Resource Adequacy Task Force are:

            Aaron Bloom, Energy Systems Integration Group
            Wesley Cole, National Renewable Energy Laboratory
            Armando Figueroa Acevedo, Black & Veatch
            Gord Stephen, National Renewable Energy Laboratory and University of Washington
            Aidan Tuohy, Electric Power Research Institute

         Acknowledgments
         The task force collaborated closely with a project team made up of industry experts.
         The task force would like to acknowledge the valuable input and support of the following
         individuals regarding the concepts discussed in this report.

            Chris Dent, University of Edinburgh
            Rob Gramlich, Grid Strategies
            Elaine Hart, Moment Energy Insights
            Karin Matchett, consulting writer/editor
            Michael Milligan, independent consultant
            Mark O’Malley, Energy Systems Integration Group
            Nick Schlag, Energy and Environmental Economics

         Suggested citation
         Redefining Resource Adequacy Task Force. 2021. Redefining Resource Adequacy
         for Modern Power Systems. Reston, VA: Energy Systems Integration Group.
         https://www.esig.energy/reports-briefs.

         Design: David Gerratt/NonprofitDesign.com

         © 2021 Energy Systems Integration Group

Redefining Resource Adequacy for Modern Power Systems                    Energy Systems Integration Group iii
Contents
          1   Evolving Reliability Needs for a Decarbonized Grid

               1   Elements of Resource Adequacy Under Rising Levels of Renewables
               1   Wake-Up Calls from California and Texas
               3   Reassessing the Resource Adequacy Methods

          4 Traditional Resource Adequacy Analysis Problems and Their Causes

               5   Why Reliability Events Occur Is Changing
               7   When Reliability Events Occur Is Changing
               8   How Reliability Events Occur Is Changing: It’s All About the Weather

          9 The Need for a Modified Approach

              10   Principle 1: Quantifying size, frequency, duration, and timing of capacity
         		        shortfalls is critical to finding the right resource solutions
              13   Principle 2: Chronological operations must be modeled across many
         		weather years
              18   Principle 3: There is no such thing as perfect capacity
              21   Principle 4: Load participation fundamentally changes the resource
         		adequacy construct
              22 Principle 5: Neighboring grids and transmission should be modeled
         		        as capacity resources
              25 Principle 6: Reliability criteria should be transparent and economic

         29 Looking Forward

         30 References

Redefining Resource Adequacy for Modern Power Systems                         Energy Systems Integration Group iv
Evolving Reliability Needs
for a Decarbonized Grid

A
        s grids around the world continue to decarbonize           expectations remain as the grid transitions to high
        and integrate renewable energy, it is critical that        variable renewable energy; reliability is paramount. With
        power system planners, policymakers, and regula-           increased variability and uncertainty, how can we ensure
tors continue to balance three pillars of power system             there are enough resources to serve electricity customers
planning: affordability, sustainability, and reliability           whenever and wherever they need power?
(Figure 1). While some stakeholders may have different
priorities across the three pillars, each one is critical to       Elements of Resource Adequacy Under
ensuring a smooth clean energy transition.                         Rising Levels of Renewables
Ask any grid operator their top priority and the answer            One dimension of grid reliability, that taking the longest
is simple: reliability. Our society has come to expect, and        view, is resource adequacy: having enough resources in
require, uninterrupted power—even on the hottest days              the bulk power system available to the system operator
and coldest nights and through the longest storms. These           to meet future load, while accounting for uncertainty in

             F i g u re 1
             The Elements of Grid Reliability

                                         Affordability    Reliability          Sustainability

                Transmission             Distribution    Resource               Operational
                                                                                                     Resilience
                   stability              reliability    adequacy                reliability

                    Frequency                                                       Operating          Storms and
                                             Equipment         Generator
                    and voltage                                                      reserve          other extreme
                                              failures          failures
                     deviations                                                    deficiencies          weather

                     Low short-               Natural           Loss of              Lack of         Cyber and other
                  circuit strength             event           interties            flexibility      human-caused
                                                                                                        attacks

                                                                Weather
                                                               variability

                                                               Load
                                                            uncertainty

             Source: Energy Systems Integration Group.

Redefining Resource Adequacy for Modern Power Systems                                    Energy Systems Integration Group 1
attention to reliability and weather conditions is
The increased role of wind, solar, storage,                                              increasingly important.
and load flexibility requires the industry to                                            The industry has more than two decades of experience
rethink reliability planning and resource                                                integrating variable resources while maintaining—and
adequacy methods.                                                                        even improving—grid reliability. However, a notable
                                                                                         trend is occurring. While early wind and solar capacity
                                                                                         constituted incremental expansions of the grid’s installed
                                                                                         capacity, the industry is now seeing a large swath of fossil
both generation and load. Some uncertainties are becom-                                  generator retirements, including coal, nuclear, and legacy
ing more important, such as correlated generator outages                                 gas assets (Figure 2). As a result, portfolios of wind,
and changes in the weather. By evaluating these uncer-                                   solar, storage, and load flexibility are increasingly used
tainties statistically, grid planners project their resource                             as replacements to conventional fossil capacity.
needs to reach an acceptably low level of risk of capacity
shortages. Risk metrics can then be used to determine                                    These new resources are being utilized not only for
how much investment our power grids require, how much                                    energy, but also for the grid services required to maintain
new generation should be built, what type of generation                                  grid reliability. The increased role of wind, solar, storage,
should be built, and which generation can retire.                                        and load flexibility requires the industry to rethink reli-
                                                                                         ability planning and resource adequacy methods and
The power system has always been heavily influenced by                                   to reconsider analytical approaches. Computational
the weather. Extreme temperatures determine the timing                                   approaches developed in the 20th century are limiting
of peak demand, winter cold snaps can limit natural gas                                  our collective ability to evaluate reliability and risks
supply, gas turbine reliability and output are affected by                               for modern power systems. The confluence of changes
ambient conditions, and hydro output varies seasonally                                   requires new data, methods, and metrics to better
and annually. However, as the grid increasingly relies on                                characterize evolving reliability risks.
variable renewable energy such as wind and solar, the

             F i g u re 2
             Generation Additions and Retirements from 2014 through 2020,
             Plus Planned Retirements

                                                  80

                                                  60

                                                  40
             Change in installed capacity (GW)

                                                  20

                                                   0

                                                 –20

                                                 –40

                                                 –60

                                                 –80
                                                                             Additions    Retirements         Announced retirements   Net change
                                                 –100

                                                 –120
                                                        Natural gas   Coal     Nuclear         Other fossil            Wind            Solar

             Source: Energy Systems Integration Group; data from APPA (2021).

Redefining Resource Adequacy for Modern Power Systems                                                                Energy Systems Integration Group 2
Wake-Up Calls from California and Texas
Two recent events underscore the importance of
modernizing our thinking on resource adequacy in an
era of changing generation mixes and changing weather.
The first occurred in California in August 2020, when a
heat storm resulted in two separate days of involuntary
rolling outages across California’s power system. The sec-
ond occurred in Texas in February 2021, when extreme
winter weather resulted in very high electricity demand
while also causing natural gas fuel supply shortages, low
wind output, and widespread equipment failures across
all generation types. Both of these reliability failures
showed how susceptible the grid can be to inadequate
supply as well as the economic, political, and social fall-
out that can occur when grid reliability is jeopardized.

Steve Berberich, the chief executive officer of the
California Independent System Operator (CAISO) dur-
ing the August 2020 events, summarized the changing
                                                              Resource adequacy methods have
needs of resource adequacy analysis, stating:
                                                              not changed considerably in the past
  There doesn’t have to be a tradeoff between reliability     few decades, despite rapid changes of
  and decarbonization. What caused the [August black-
                                                              the resource mix. The central message
  outs] was a lack of putting all the pieces together.
  You have to rethink these old ways of doing things,         for practitioners, regulators, and
  and I think that’s what didn’t happen. . . . The resource   policymakers is, what got us here
  adequacy program in California is now not matched           won’t get us there.
  up with the realities of working through a renewable-
  based system, and, in a nutshell, needs to be redesigned
  (Hering and Stanfield, 2020).
                                                              there are enough resources to serve load. Resource
Reassessing the Resource                                      adequacy analysis provides the tools to determine
Adequacy Methods                                              whether there are enough resources and, if not, what
                                                              type of resource is needed to meet reliability needs.
The objective of this report is to move that redesign         While this report is comprehensive in its treatment
forward by providing an overview of key drivers chang-        of resource adequacy methods, it intentionally does not
ing the way resource adequacy needs to be evaluated,          address capacity accreditation, which determines how
identifying shortcomings of conventional approaches,          to assess reliability contributions of specific resources,
and outlining first principles that practitioners should      or capacity procurement and market mechanisms,
consider as they adapt their approaches.                      which require further analysis.

This report focuses specifically on the resource adequacy     Resource adequacy methods have not changed con-
analysis and methods that measure system reliability and      siderably in the past few decades, despite rapid changes
risk, and it intentionally stops short of translating that    of the resource mix. The central message for practitioners,
analysis into procurement decisions. Ultimately, system       regulators, and policymakers is, what got us here won’t
planners, regulators, and policymakers need to ensure         get us there.

Redefining Resource Adequacy for Modern Power Systems                             Energy Systems Integration Group 3
Traditional Resource Adequacy
Analysis Problems and Their Causes

A
         t its core, the challenge with resource adequacy     the probability of multiple failures occurring simul-
         analysis is that, while the methods and metrics      taneously was low.
         used by the industry today originated in the last
several decades of the 20th century, they have only been      However, for a grid with high levels of renewables,
improved incrementally while the resource mix transi-         energy-limited resources, and load flexibility, reliability
tioned appreciably. For example, early tools evaluated        is strongly affected by chronological operations and
only single peak load periods and did not assess risk of      weather-influenced correlated events (Figure 3). These
shortfalls across an entire year. These tools often assumed   are two driving factors requiring the industry to mod-
static loads and did not consider energy limitations of       ernize frameworks for resource adequacy analysis.
most resources. Traditional resource adequacy analysis
also made a simplifying assumption that reliability events      Chronological grid operations: Traditional resource
were uncorrelated and that mechanical failures of gener-        adequacy analysis often evaluates only individual peak
ating equipment occurred at random, thus assuming that          load hours and does not consider the full year of

            F i g u re 3
            Two Driving Factors That Require New Approaches to Resource Adequacy

                Chronological grid operations                              Correlated events

                           Variable renewable                               Weather impacts
                           energy

                           Energy-limited
                                                                            Combined outages
                           resources

                           Hybrid resources                                 Climate trends

                           Load flexibility and                             Modular technology
                           demand response                                  reduces correlation

            Source: Energy Systems Integration Group.

Redefining Resource Adequacy for Modern Power Systems                              Energy Systems Integration Group 4
F i g u re 4
Example of Capacity Outage Probability Table

The table shows the probability of multiple units being on outage simultaneously. Looking down a single column, the probability
of multiple units on outage simultaneously drops precipitously. As the total fleet size increases (moving from left to right along a
row), the probability of a large percentage of the overall fleet on outage (e.g., six units out of 18) is a one-in-a-million event.

Source: Calabrese (1947).

   operation. This has two problems: it presupposes that
   the highest risk period occurs during peak load, and              While historical resource adequacy
   it fails to account for the sequential operating charac-
                                                                     analysis focused on probabilities of dis-
   teristics of resources. For example, the usefulness of
   battery storage as a resource depends on the weather              crete independent mechanical or electrical
   (and resulting generation) in the preceding days and              failures, weather-influenced correlated
   expectations for needs in subsequent hours. Likewise,
                                                                     events should now be recognized as
   the use of demand response as a resource depends
   on how long the system has already been asking                    a driving factor of reliability.
   customers to provide demand response.

   Correlated events: While historical resource
   adequacy analysis focused on probabilities of discrete           the likelihood that many generators would be on outage
   independent mechanical or electrical failures (modeled           at the same time, thus increasing the risk of a shortfall
   with randomly occurring forced outages), weather-                and failure to meet load.
   influenced correlated events should now be recog-
   nized as a driving factor of reliability.                        An example of this analysis, referred to as the convolution
                                                                    method, can be found in a capacity outage probability
Why Reliability Events Occur Is Changing                            table from a seminal work on resource adequacy from
                                                                    the mid-20th century (Figure 4). This table shows the
Historically, determining whether there were enough                 probability, in millionths, that the indicated number
resources available to meet load was a straightforward              of units would be out simultaneously for fleets having a
analysis, with the foundation rooted in probabilistic               given number of units when the outage rate is 2 percent.
assessment. With the power system made up of many                   It shows that as the number of units goes up, the like-
large, centralized fossil fuel generators for which fuel            lihood of a large portion of the fleet being on outage
availability was rarely a concern, the availability of a            decreases quickly—so for an interconnected power
generator was largely based on discrete maintenance                 system, the probability of capacity shortfall events
and mechanical failures (forced outages). Each generator            diminishes noticeably as system size increases.
could be characterized with a maintenance outage rate
(%) and a forced outage rate (%), which were used to                A probabilistic approach may have been appropriate
determine the likelihood the unit would be unavailable              or the historical power system, where reliability risk
to serve load. Because these were mechanical failures and           stemmed largely from mechanical failures of large gen-
largely uncorrelated (with one another, the weather, or             erating units that could mean many hundreds, or even
other factors), probabilistic assessments could quantify            thousands, of megawatts (MW) lost due to a single

 Redefining Resource Adequacy for Modern Power Systems                                     Energy Systems Integration Group 5
failure. Coal and nuclear generation were the primary                              Second, the gas turbine technology in wide use today is
fuel sources and had weeks’ worth of fuel storage on site,                         more dependent on ambient temperature than are steam
so fuel availability was not a concern and output was                              turbine technologies. This is especially true at high
not variable.                                                                      summer temperatures. Both extreme high and extreme
                                                                                   low temperatures derate the maximum output of the
However, while randomly occurring forced outages are                               machines, correlating their availability to the underlying
still important to consider, it is increasingly important to                       temperature. Mechanical failures are also more likely
consider correlated generator failures and outages, due                            during extreme cold events for most technologies and
to either the underlying weather or other root causes.                             fuel types in common use today. The correlation in these
                                                                                   types of outages was clearly evident in the February 2021
First, a large shift from coal to gas capacity has increased                       event in Texas, as shown in Figure 5 (ERCOT, 2021c).
risks associated with fuel supply. The electric power sector
is now tightly coupled with the natural gas delivery system,                       Third, for a grid with higher levels of wind, solar, storage,
which delivers fuel on demand, with little or no storage                           and load flexibility, the actual events that are correlated
located at the power plant. As a result, correlated outages                        have very different characteristics. Unlike a fossil fuel–
due to fuel supply failures are now a key reliability risk,                        powered generator, which can lose hundreds or even
especially during the winter months when multiple                                  thousands of MWs of capacity to a single failure, the loss
power plants may experience interrupted fuel supplies                              of capacity from the disconnection or failure of small,
simultaneously. These same time periods see significant                            modular resources is much smaller and more geographi-
increases in load and mechanical failures. This confluence                         cally dispersed. Wind, solar, and storage plants are made
of factors is leading some system operators, like the New                          up of many independent inverter-controlled resources.
York Independent System Operator (NYISO), to require                               While any individual wind turbine may fail, the probabil-
dual-fuel capability for natural gas generators and others,                        ity of an entire plant failing is much lower. This modular-
like the Electric Reliability Council of Texas (ERCOT),                            ity shifts the analysis from discrete generator forced
to discuss potential winterization requirements.                                   outages to evaluations of the likelihood of correlated
                                                                                   events and common mode failures.

F i g u re 5
Correlated Outages for Natural Gas Generators by Cause During the ERCOT
February 2021 Event

                      30
                           Sunday (2/14)   Monday (2/15)   Tuesday (2/16)   Wednesday (2/17)   Thursday (2/18)   Friday (2/19)

                      25
                                                                                                                                 ■ Weather
                                                                                                                                   related
                      20
                                                                                                                                 ■ Equipment
     Gigawatts (GW)

                                                                                                                                   issues

                      15                                                                                                         ■ Fuel
                                                                                                                                   limitations

                                                                                                                                 ■ Miscellaneous
                      10
                                                                                                                                 ■ Existing
                                                                                                                                   outages
                       5

                      0

Note: Extreme cold temperatures began on Monday morning.

Source: Electric Reliability Council of Texas (2020c).

 Redefining Resource Adequacy for Modern Power Systems                                                      Energy Systems Integration Group 6
F i g u re 6
Shifting Periods of Risk in MISO with Increasing Levels of Solar Photovoltaics
90 0.06%
80
0.05%
70
Net load diurnal profile (GW)
Loss of load probability
60 0.04%
50
0.03%
40
30 0.02%
20
0.01%
10
0 0.00%
0 1 2 3 4 5 6 7 8 9 10 11 12 13 14 15 16 17 18 19 20 21 22 23
Hour (Eastern Standard Time)
■ Base ■ 10% ■ 30% ■ 50% ■ 100%
Source: Midcontinent Independent System Operator (2021).
When Reliability Events Occur as well as other, weather-influenced times during which
Is Changing production across the fleet is well below average.
The changing resource mix is also affecting when reli- These dynamics were evident in the involuntary rolling
ability events are more likely to occur. In traditional outages in California in August 2020, which occurred
resource adequacy analysis, periods of higher probability late in the evening after the sun had set and solar
of a shortfall were almost always associated with peak resources dropped off, several hours after peak load
loads. Because generator outages were assumed to be occurred in the middle of the day. The shifting periods
random and variable resources constituted a small part of shortfall risk are illustrated in Figure 6 (MISO, 2021).
of the resource mix, generator availability was assumed As levels of solar generation increase, the periods of
to be relatively uniform across the year. As a result, peak risk shift from 3 p.m. to 6 p.m. due to changes in
risk occurred during periods of higher demand. Across resource availability.
most of North America, this usually occurred during hot
summer afternoons or cold winter mornings or evenings. Winter cold snaps are also increasingly challenging, as
seen in the Texas event in February 2021, which occurred
However, time periods with a risk of shortfall are shift- in a historically summer-peaking system that has a high
ing. The periods of risk we’re used to keeping our eye winter reserve margin. While load is higher than normal
on may no longer be the most challenging. In the case during periods of extreme cold, for most summer-peaking
of solar, the diurnal pattern causes a drop in solar pro- systems these winter loads still tend to be lower than the
duction at the end of the day correlated among all solar annual peak. However, the challenge also manifests itself
plants in the area, and extended cloud cover can reduce on the supply side with increased probabilities of equip-
output as storms pass through a region. For wind gen- ment failures, wind turbine icing, and natural gas supply
erators, wind speeds can be correlated as different atmo- that is stressed by heating demand. Thus, in these winter
spheric conditions or storm fronts pass through a region. periods, shortfalls do not have a single root cause, but
As a result, in a system with high levels of wind and solar are rather a correlation of multiple challenges.
resources, there are both predictable lulls in production
Redefining Resource Adequacy for Modern Power Systems Energy Systems Integration Group 7Periods of risk can also be common during off-peak
periods if extended cloud cover across a region reduces
solar availability and weather patterns reduce wind
speeds. These declines in solar and wind production can
align with extreme cold and heat, and therefore higher
loads. Finally, even periods once characterized as low
risk, like the spring and fall seasons, may have increased
risk. Given that large fossil generators are typically taken
offline for maintenance during these periods, if an outlier
weather event occurs, the probability of a shortfall can
increase significantly even though loads are considerably
lower than they are in peak periods.
Taken together, the shifting periods of risk mean that
planners can no longer bypass analysis and evaluate only
peak load periods. A broader evaluation across all hours
of the year is necessary to accurately capture shifting
periods of risk of shortfall. Given the energy limitations
of storage and demand response and the operational
characteristics of other resources like start-up times
and ramp rate limitations, the all-hour approach must
be combined with a chronological assessment of grid The increased dependence on weather that accompanies
operations across an entire year. From a modeling per- the shift to more wind and solar on the system causes
spective, the disciplines of production cost modeling and multiple issues. The first and most obvious is that weather
resource adequacy modeling are increasingly blurred. variability affects the availability of these generation
resources. Hour-to-hour changes in weather and elec-
How Reliability Events Occur Is Changing: tricity generation mean that a system’s probability of
It’s All About the Weather a capacity shortfall is constantly changing. Given that
serving load in a high-renewables power system also
The power system has always been heavily influenced
involves the use of energy-limited resources such as
by the weather—extreme temperatures determine the
storage and demand response, a chronological perspective
timing of peak demand, winter cold snaps can limit
on system modeling and simulation is required, rather
natural gas supply, gas turbine reliability and output are
than the static analysis used in traditional analysis.
affected by ambient conditions, and hydro output varies
seasonally and annually. However, as already discussed, as In addition, while weather is constantly changing, so is
the grid increasingly relies on variable renewable energy, climate—the weather conditions prevailing in an area in
like wind and solar, the attention to reliability and general or over a long period. If a changing climate leads
weather conditions is increasingly important. to changes in weather, temperature, and extreme events,
it changes the overall resource adequacy risk profile.
Traditional resource adequacy analysis typically evalu-
Traditional resource adequacy analysis relied solely on
ated weather as a driver of system load. Weather changes
historical weather data; however, the use of historical
could move peak demand periods and created uncertainty
data to characterize load and renewable resources may
in planners’ load forecasts. There was some recognition
not be appropriate for gauging future risks affected
that weather could lead to correlated outages of the
by climate change.
fossil fleet, but rarely was this trend evaluated explicitly.
Instead, the outage rate assigned to generators was based
only on forced outages for unexpected mechanical
failures and planned maintenance.
Redefining Resource Adequacy for Modern Power Systems Energy Systems Integration Group 8The Need for a Modified Approach
T
o overcome the limitations in traditional resource 100 years of power system planning and conventional
adequacy analysis, a fresh look is required. While approaches, how would resource adequacy be evaluated
decades of resource adequacy analysis can be used for modern power systems? How should risk and reli-
as a reference point for reliability planning moving for- ability be evaluated in a power system with large shares
ward, future methods will need to evolve, and a set of of wind, solar, storage, and load flexibility? How can
first principles can be a useful guide. While each region methods be developed in a technology-neutral manner,
and system require a unique process, guiding principles to ensure the methods evolve with a changing resource
can help ensure a consistent approach in terms of the mix and new technologies? Responses to these questions
objectives, structure, and process of resource adequacy point to six principles of resource adequacy for modern
planning. Consistency in approaches to resource adequacy power systems.
can better allow for sharing of insights and best practices,
interregional resource coordination, and a smoother The objective of these principles is to clearly articulate
regulatory process for resource procurement. evolving resource adequacy concepts to system planners,
regulators, and policymakers in order to encourage a
The first principles listed below are based on a few consistent approach to complex challenges. The princi-
simple questions: if the approaches to resource adequacy ples are not meant to be overly prescriptive; instead, they
analysis started from scratch, without a backdrop of are designed to provide a guiding framework that can
Redefining Resource Adequacy for Modern Power Systems Energy Systems Integration Group 9be used by system planners around the world, regardless regarding what the shortfalls look like. Loss of load
of the unique system attributes. These principles are hours (LOLH) counts the average expected number of
designed to help system planners do three things: first, hours of shortfall, loss of load events (LOLEv) is similar
to better understand and quantify the reliability shortfalls to LOLE but allows for multiple “events” to occur in a
that a modern power system is more likely to experience; single day or a single event to span multiple days, and
second, to identify ways that such shortfalls can be miti- expected unserved energy (EUE) calculates the average
gated and responded to; and third, to understand what amount of energy unserved.
the resource adequacy analysis means for resource
procurement. Looking Beyond LOLE
Principles 1 and 2 address the new needs in our under- The reliance on the LOLE metric was adequate in
standing of capacity shortfalls. Principles 3, 4, and 5 focus traditional resource adequacy analysis because shortfalls
on new understandings of capacity and resource types tended to share similar characteristics, largely occurring
in a modern power system. Principle 6 calls for the inclu- during peak load events and caused by randomly occur-
sion of economic considerations in reliability analyses. ring forced outages of the conventional fossil fleet. In
addition, the resource solutions implemented when the
LOLE measure was exceeded were one size fits all. The
Principle 1: Quantifying size, frequency,
combustion turbine was the de facto resource used to
duration, and timing of capacity shortfalls meet reliability needs, as it was the lowest capital cost
is critical to finding the right resource way to get more “steel in the ground,” and operating
solutions. costs (based on fuel efficiency) were not a concern
As the power system’s resource mix changes, resource because the units were rarely utilized. However, the
adequacy metrics need to be transformed as well. The resource options available to system planners today
conventional resource adequacy metric, loss of load are numerous. Energy storage, demand response, and
expectation (LOLE), quantifies the expected number load flexibility provide competitive alternatives to
of days when capacity is insufficient to meet load. A the combustion turbine approach for many types
common reliability criterion is one day of outage in of shortfall events.
10 years, often simplified to 0.1 days per year LOLE.
But LOLE is an opaque metric when used in isolation. Energy storage, demand response, and load
It only provides a measure of the average number of
flexibility provide competitive alternatives
shortfalls over a study period and does not characterize
the magnitude or duration of specific outage events. It to the combustion turbine approach for
also does a poor job of differentiating shortfalls, which, many types of shortfall events.
depending on their length and duration, can have un-
equal impact on consumers and can require different
mitigation options. For example, since LOLE only
quantifies frequency, a shortfall of 1 percent of load for In addition, the reliability events are now more varied;
10 hours is measured the same way as a shortfall of 10 therefore, understanding the size, frequency, duration,
percent of load for 10 hours. In addition, there is very and timing of potential shortfalls is essential to finding
little consistency in this metric’s application, as different the right resource solutions. LOLE is an inadequate
planners in different regions interpret the criterion metric in a world of more varied shortfall events because
differently, and each region has different institutional it provides limited information on shortfall events’ size
and regulatory requirements that determine what and duration. This makes it difficult to know the true
probability of unserved energy is acceptable. impact of potential shortfalls and nearly impossible to
determine the types of resources necessary to reduce
Similar metrics also provide information on the the number of shortfalls.
probability of a shortfall event but limited information
Redefining Resource Adequacy for Modern Power Systems Energy Systems Integration Group 10F i g u re 7
Building Blocks of Resource Adequacy Metrics
Example 1— Same LOLEv and LOLH, but very different events Example 2— Same LOLH and EUE, but very different events
MW A LOLEv = 1 Max MW = 5 MW MW C LOLEv = 3 Max MW = 4 MW
LOLH = 4 Max MWh = 12 MWh LOLH = 3 Max MWh = 4 MWh
EUE = 12 Duration = 4 hr EUE = 6 Duration = 1 hr
hrs hrs
MW B LOLEv = 1 Max MW = 1 MW MW D LOLEv = 1 Max MW = 2 MW
LOLH = 4 Max MWh = 4 MWh LOLH = 3 Max MWh = 6 MWh
EUE = 4 Duration = 4 hr EUE = 6 Duration = 3 hr
hrs hrs
Each block represents a one-hour duration of capacity shortfall, and the height of the stacks of blocks depicts the MW of unserved
energy for each hour. A: a single, continuous four-hour shortfall with 12 MWh of unserved energy; B: a single, continuous four-hour
shortfall with 4 MWh of unserved energy; C: three discrete one-hour shortfall events with 6 MWh of unserved energy; D: a single,
continuous three-hour shortfall with 6 MWh of unserved energy.
Source: Energy Systems Integration Group.
Differentiating Capacity Shortfalls indistinguishable. However, the top event is three times
larger in terms of unserved energy and five times larger
Systems with the same LOLE and LOLH can have very in terms of the maximum unserved energy at a single
different risk profiles, types of shortfalls, and mitigation point in time. The events have very different impacts on
options. Figure 7 illustrates four different capacity short- customers and may require different mitigation strategies
fall events. On the x-axis of each chart is time and on on the part of system operators.
the y-axis is the MW of a shortfall event. Each block
represents a one-hour duration of capacity shortfall, and While EUE is better at differentiating individual events,
the height of the stacks of blocks measures the amount this metric too can have challenges. The charts on the
of unserved energy. These building blocks show how right (Figure 7C and D) show consistent unserved energy
different shortfall events can be and thus how easily and loss of load hours, but the top plot shows three
traditional metrics can fail to capture them. distinct events (LOLEv of 3), whereas the bottom plot
shows a single event. In this case, the corresponding
The two charts on the left (Figure 7A and B) show EUE and LOLH metrics are identical, but the LOLEv
how simple expected value metrics can fail to distinguish metrics are three times larger in the top example. Separate
between very disparate events. These charts show a single events could be mitigated by energy storage that can
continuous capacity shortfall event of equal duration re-charge between events, but may be further challenged
(four hours). Both of these events would count toward by demand response programs that may be limited by
the aggregate loss of load events (LOLEv) metric as one the number of allowable calls.
event, since they occur within the same day, and both
would count toward LOLH with four hours. From an Without the use of multiple metrics, as well as additional
LOLEv and LOLH perspective, then, the events are information on the size (both in MW and megawatt-
Redefining Resource Adequacy for Modern Power Systems Energy Systems Integration Group 11hours (MWh)), frequency, and duration of individual
events, determining appropriate mitigation actions is
difficult. For example, the event on the top left would
require at least three times more energy storage and
demand response than the event on the bottom left.
For the events on the right, a battery resource of 4 MWh
could avoid all of the unserved energy in the top right
event (provided it could recharge between events), but
would be insufficient to avoid the bottom right event
(where we would need 6 MWh of storage). This infor-
mation would be impossible to ascertain by LOLE,
LOLH, and EUE metrics alone. Resource adequacy
metrics that can quantify size, frequency, duration,
and timing of shortfall events are critical to finding
the right resource solutions.
Achieving Deeper Insights into
Resource Adequacy Metrics
quantifies the expected aggregate size (amount of energy)
One of the biggest limitations of LOLE, LOLH, and duration of shortfall events as opposed to only quan-
and EUE metrics is that they provide only an average tifying the probability or frequency of one occurring.
measure of system risk across many hundreds or thousands However, EUE still provides only a single average metric
of samples. They do not provide information on the that cannot distinguish between the individual events.
full distribution of shortfalls. New methods in resource
adequacy analysis should expand to provide additional In addition, resource adequacy analysis should pay atten-
insights into not only the average (expected value) re- tion not just to the expected values, but to potential tail
source adequacy events, but also the characteristics of events. While high-impact, low-probability events are
the individual events themselves. System planners require very rare—and system planners intentionally do not plan
this type and quantity of information to ensure that they to mitigate all potential risk—these events’ impact on a
can right-size mitigations to meet the system’s specific high-renewables grid is important to assess given their
reliability needs. potentially devastating impact on customers.
Unfortunately, traditional resource adequacy metrics’
simplification of hundreds or thousands of power system
New methods in resource adequacy
simulations into a single average offers little insight into
analysis should expand to provide addi- the distribution of potential resource adequacy shortfalls
tional insights into not only the average that the system could experience. A system that has rare
(expected value) resource adequacy but very large events could appear to have the same level
of reliability as a system with more frequent, smaller
events, but also the characteristics events, causing current metrics to fail to account for
of the individual events themselves. the much greater impact on consumers—and society in
general—of the large events. Future resource adequacy
analysis should move beyond expected values and provide
information on the distribution of individual events.
It is too early to tell whether entirely new metrics need
to be developed, but what is certain is that planners need The chart in Figure 8 (p. 13) quantifies the number of
to extract more information and details from existing shortfall events (each represented as a dot) for a single
ones. Increased use of EUE is a good first step, as it system simulated across three different resource mixes.
Redefining Resource Adequacy for Modern Power Systems Energy Systems Integration Group 12F i g u re 8
Scatter Plot of Size, Frequency, and Duration of Shortfall Events
with Energy-limited Reliance on Energy Limited Resources
Magnitude
Scenario 1 Scenario 2 Scenario 3 (MWh)
Frequency
7000
900 6000
800
5000
700
600 4000
Size (MW)
500
3000
400
300
2000
200
100 1000
0
0
2 4 6 8 2 4 6 8 2 4 6 8
Duration (hours) Duration (hours) Duration (hours)
Source: Energy Systems Integration Group.
Each resource mix has very different underlying Chronological operations
Principle 2:
resources but the same LOLE of 1-day-in-10-years (i.e., must be modeled across many weather
the same number of dots). However, despite having the years.
same LOLE, the systems have very different risk profiles.
An improperly planned high-renewables grid may Historically, traditional resource adequacy analysis
experience much larger shortfall events than those we evaluated only periods of peak demand for reliability risk.
are used to planning for due to sustained periods of low This was in part due to the more limited computational
renewable production. This could cause longer and larger capabilities of the time as well as to a resource mix that
disruptions—even if the probability of these events did not fluctuate much seasonally or hourly, making the
occurring is lower than historical norms. Improved use fluctuations of load the main variable. In addition, there
of resource adequacy metrics can avoid this challenge. was limited energy storage on the system with which to
smooth out demand. The small amount that was installed
Improved utilization of existing metrics and visualiza- was pumped hydro, often with 12 or more hours of
tions must move beyond average values. They must pro- energy storage, and energy limitations were less of a
vide information on the distribution of events as well as concern. As a result, systems included few short-duration
provide emphasis on individual, rather than aggregate, and energy-limited resources that would not be able to
event characteristics. Relying on multiple metrics and provide extended support during reliability events. There-
visualizations of the size, frequency, duration, and timing fore, if generation on the system was adequate during
of shortfall events will allow planners to select mitigations the period of highest load, it would be adequate during
and resources that are appropriately sized to fit system the rest of the year as well.
needs and avoid over-procurement of resources.
Redefining Resource Adequacy for Modern Power Systems Energy Systems Integration Group 13Today, the increased reliance on variable renewable A simple planning reserve margin that is used to procure
energy and energy-limited resources is changing the a certain amount of capacity above and beyond peak load
resource adequacy construct. Periods of risk are no longer does not ensure that the system will be reliable during
confined to peak load conditions, but are shifting to other times of the year given changes in the resource mix.
other time periods due to abnormal weather events, the
daily setting of the sun, and the fossil fleet undergoing Importance of Chronological Evaluation
increased maintenance during fall and spring. The in- of All Hours
creased levels of variable renewable energy mean that
resource analysis requires specific attention to hourly, The California rolling blackouts in 2020 are a good
seasonal, and inter-annual resource variability. The se- example. California’s resource adequacy construct and
quence of the variability is key, given that energy-limited planning reserve margin are based on the peak gross
resources such as batteries or demand response require load, which occurs in the middle of the day during sum-
either a preceding period or subsequent period of high mer months. However, periods of peak risk in California
production to be useful for grid reliability. This will now occur in the evening hours as solar resources decline
require increased reliance on weather and power fore- and loads remain relatively high. This is clearly illustrated
casting and integrated storage scheduling that considers in Figure 9, which shows the gross and net load for
forecast uncertainty to ensure that storage can be CAISO for the August days when rolling blackouts
available when needed. occurred (CAISO, 2021). The conventional assumption
that peak risk is aligned with peak load is no longer
As a result, the conventional approach of designing a true, requiring a chronological evaluation of all hours
system solely to meet peak load conditions—via a static of the year so that the times of risk of shortfall can be
planning reserve margin—is no longer appropriate. accurately identified.
F i g u re 9
Gross and Net Load During the 2020 California Reliability Event
50
45
40
35
Gigawatts (GW)
30
25
20
15
10
5
0
0 2 4 6 8 10 12 14 16 18 20 22 0 2 4 6 8 10 12 14 16 18 20 22
August 14, 2020 August 15, 2020
■ Stage 3 emergency Demand Net demand
Source: Energy Systems Integration Group; data from California Independent System Operator (2021).
Redefining Resource Adequacy for Modern Power Systems Energy Systems Integration Group 14F i g u re 1 0
Example of Chronological Resource Adequacy Simulations with a Shortfall Event
Generation (MW)
One Week of Grid Operations
■ Fossil ■ Solar ■ Wind ■ Storage ■ Unserved energy
Source: Hawai’i Natural Energy Institute (2020).
Modeling sequential grid operations is critical to cap-
Chronological operations and scheduling ture the whole picture: the variability of wind and solar
resources along with the energy limitations of storage
ensure that energy storage and demand
and load flexibility. Chronological stochastic analysis is
response will be around long enough, and thus increasingly important, simulating a full hour-to-
can fully recharge, to support the system hour dispatch of the system’s resources for an entire year
through reliability challenges. of operation across many different weather patterns, load
profiles, and random outage draws. An example is shown
in Figure 10, which illustrates a week of chronological
commitment and dispatch of a power system, and a
This chronological assessment is required to ensure that shortfall that occurs when there is insufficient storage
the energy storage and demand response will be available available to extend through the late evening hours.
for enough hours to get the system through periods Despite load being significantly lower in the late evening
of scarce supply. Energy-limited resources may reduce hours, the probability of a shortfall is higher (HNEI,
reliability risk in some periods (when the storage is dis- 2020).
charging or when load is reduced), but only if they in-
crease risk in other periods (when the storage is charging Need for Many Years of Weather Data
or when load is shifted to earlier or later times). Hour-
to-hour operations and scheduling ensure that energy In addition to modeling chronological grid operations,
storage and demand response will be around long enough, resource adequacy analysis for modern power systems
and can fully recharge, to support the system through requires the incorporation of many years of weather data.
reliability challenges. Chronological assessment is essen- Many years of synchronized hourly weather and load
tial to highlight resource adequacy needs and necessary data are necessary to understand correlations and inter-
procurement of long-duration storage resources. annual variability between wind and solar generation,
outages, and load. The same weather conditions can
affect wind and solar output, whose probabilities are
driven by irregular and complex weather patterns, and
load and thermal unit derates—requiring that the
Redefining Resource Adequacy for Modern Power Systems Energy Systems Integration Group 15F i g u re 1 1
ENSTO-E Example of Monte Carlo Simulation Principles
N
Climate NxM
Years Monte-Carlo
Simulations
Source: European Network of Transmission System Operators for Electricity (2020a).
weather data be consistent across these inputs. The Using stochastic production cost methods—combining
California event in August 2020 stemmed, at least in both chronology and varying weather across a full 8,760-
part, from a widespread heat wave that seemed highly hour analysis—is necessary to help identify times and
improbable based on historical patterns but may be more situations of peak risk. Given that low-probability events
likely now and into the future due to climate change. drive resource adequacy challenges, a long historical
More changes to resource adequacy analysis and model- record of weather data is necessary to identify the prob-
ing are needed to address both potential conditions ability of potential extremes. With higher renewable
and resource availability during these conditions. energy and storage capacity on the grid, these periods are
likely to be made up of more combinations, across more
An example of this process is shown in Figure 11, which variables, than planners were accustomed to in the past.
depicts the European Network of Transmission System
Operators for Electricity’s (ENTSO-E) regional grid Data Limitations in Weather Modeling
planning methodology. In this approach, random unit
outages are sampled across many years of synchronized Analysts and policymakers should be cognizant, however,
weather data and across many years of annual variations of data limitations. This methodology is data-intensive
in wind, hydro, solar, and load (ENTSO-E, 2020a). Each and requires a convergence of power systems and meteo-
weather year is simulated against the same number of rological expertise. System planners often have access to
stochastic generator outage profiles to create a matrix long historical records of solar and hydro resources, but
of weather years and outage draws. The total number of may be limited on wind data. In addition, historical data
samples is the product of the two, and average resource may be available for system load, but underlying changes
adequacy statistics are calculated across them. This pro- to consumer behavior, load growth, and distributed energy
cess allows system planners to identify whether certain resources may limit the usefulness of legacy load data
weather conditions lead to increased probabilities of from several years in the past. Where long historical
shortfall events. records of correlated wind, solar, hydro, and load are not
available, planners will need to either use a limited data
The methodology also helps ensure resource adequacy sample or develop methods that can bootstrap a larger
across an entire range of potential operations, as opposed dataset based on correlation of a smaller, but complete,
to just the peak load periods or average weather conditions. dataset to a longer dataset such as temperature.
Redefining Resource Adequacy for Modern Power Systems Energy Systems Integration Group 16In addition, past observations may no longer be good trend as a baseline assumption in their resource
predictors of future conditions with a changing climate. adequacy process:
Part of reliability planning is ensuring that the system
can maintain reliability during potential—and credible— The impact of climate change on adequacy assess-
weather events. The California heat wave saw some of ments can be significant, considering that an impor-
the highest average temperatures in the past 35 years, tant element of the adequacy models is the underlying
spread across most of the western United States. Simi- climate-dependent data used as input. ENTSO-E
larly, during the 2021 winter events, Texas saw tempera- is working with climate and data experts to prepare a
tures well below the near-term historical record, sus- database that will reliably reflect the impact of climate
tained for many days longer than a similarly cold event change on climate variables and, thus, on adequacy
in 2011. Just because our recent weather data do not simulation results. . . . Our efforts will continue during
include a weather event doesn’t mean system planners the upcoming three years, targeting to reliably incor-
do not have to prepare for one in the future. porate in our models the impact of climate change
by the end of 2023 (ENTSO-E, 2020b).
To assume that historical trends continue into the future
can also be problematic due to climate change, for two Given the uncertainty in the weather, limited data across
reasons. A changing climate will likely cause weather a long historical record, and potential climatic changes,
conditions to diverge from their historical norms and system planners should identify and evaluate potential
may shift load and renewable generation away from drivers of resource adequacy risk, even if they have not
expectations. And climate change may increase the occurred or stressed the system in the past. While it
frequency of extreme weather events, which can increase will be impossible to assign probabilities to these events,
the probability of resource adequacy shortfalls. The Euro- and thus use them to quantify conventional resource
pean members of ENTSO-E, for example, have identified adequacy metrics, these drivers can be used to under-
climate change as a key contributor to resource adequacy stand potential periods of risk for further investigation
risk and are planning to incorporate a climate change and contingency planning.
Redefining Resource Adequacy for Modern Power Systems Energy Systems Integration Group 17More planning should be focused on identifying poten- However, gas plants are not always available on demand,
tial situations where the traditional data-driven statistical as they experience planned as well as weather-related
modeling has limitations, and on testing system reliability. outages. The false dichotomy between the perfect resource
Future resource adequacy analysis should evaluate poten- and resources with only partial “firm capacity” is due
tial situations that may not have occurred in the past but to be replaced by analysis applying the effective load-
could reasonably occur in the future. Identification of carrying capability (ELCC) metric to all resource types.
these high-impact, low-probability events can then be ELCC measures the amount of load that can be added
evaluated in isolation to determine whether and how to a system given the addition of a resource, while main-
they should be mitigated. taining the same level of reliability as the system prior
to the resource addition.
Principle 3: There is no such thing
as perfect capacity. Weather-Dependence of Thermal Generators
As Principle 1 suggests, some capacity shortfalls may The bias toward centering resource adequacy around
consist of frequent but short-duration events, while “firm capacity” and treating a gas turbine as a perfect
others may be infrequent but long-duration events. capacity resource (having an ELCC of 100 percent)
Mitigation strategies will need to be specified accord- causes several problems. First, it assumes that combus-
ingly, because different resources bring different capa- tion turbines and similar fossil technology are available
bilities. Battery energy storage may be well suited to on demand, and rarely assigns an ELCC to these tech-
solve frequent, short-duration shortages, while demand nologies in a similar manner as wind, solar, storage,
response may be better suited for infrequent, but challeng- and demand response technologies. In some cases, the
ing, events. Additional resources like long-duration stor- fossil technology is discounted, but only based on the
age, hydro, and thermal generation may be required for equivalent forced outage rate on demand (EFORd). For
long-duration capacity shortages spanning days or weeks. example, a gas turbine with a 5 percent forced outage
rate would receive 95 percent capacity credit toward
the planning reserve margin.
Different resources bring different capa-
However, as discussed above, there are times when cor-
bilities. Battery energy storage may be well related outages occur on the gas fleet, which increases
suited to solve frequent, short-duration reliability risk substantially. All generation sources are
shortages, while demand response may weather-dependent to some degree. The light blue
segments of the bar chart in Figure 12 (p. 19) provide
be better suited for less frequent events.
the average forced outage rate of resources throughout
the year, whereas the dark blue bar segments show the
increase in forced outage rates during extreme cold con-
Unfortunately, traditional resource adequacy analysis is ditions. Thermal generators, including nuclear, require a
designed around a one-size-fits-all approach to resource water supply which can be threatened by extended drought
adequacy additions. Conventional system planning has conditions, and extreme temperatures can force reduced
often treated a natural gas combustion turbine as peaking operations. Gas turbines have ambient derates due to
“firm capacity” and, therefore, a near-perfect capacity high temperatures, forced outage rates that are consider-
resource that could be added to improve reliability. If a ably higher during extreme cold conditions, and a fuel
system was determined to be short of capacity, combus- supply that can be jeopardized by competition with gas
tion turbines were often used as the default resource to heating demand. Coal piles can freeze solid. Availability
bring the system to the reliability criteria. This is because considerations due to weather, supply, and intra-resource
these represented a low-installed-cost resource and could correlations should be applied to all resource types. If
effectively put more “steel in the ground” for reliability. ELCC is used for capacity accreditation, the methodology
Under this construct, resources like wind, solar, and should be applied to all resource types, not just variable
storage are given partial “firm capacity” credit. renewable energy and energy-limited resources.
Redefining Resource Adequacy for Modern Power Systems Energy Systems Integration Group 18You can also read