World Drug Report 2018 Methodology Report - Research and Trend Analysis Branch UNODC, Vienna - United Nations Office ...
←
→
Page content transcription
If your browser does not render page correctly, please read the page content below
World Drug Report 2018
 Methodology Report
 Research and Trend Analysis Branch
          UNODC, Vienna
Table of Contents
1. Introduction .......................................................................................................................... 1
Sources of information ........................................................................................................... 1
2. Data on drug use and health consequences of drug use ................................................... 4
Overview ................................................................................................................................ 4
Indicators................................................................................................................................ 6
Extrapolation methods ........................................................................................................... 8
Adjustment for differences in age groups .......................................................................... 8
Extrapolation of results from lifetime prevalence to annual prevalence ........................... 8
Extrapolations based on school surveys .......................................................................... 10
Extrapolations based on treatment data .......................................................................... 11
National, regional and global estimates of the number of people who use drugs and the
health consequences of drug use .......................................................................................... 11
Estimates of the total number of people who used illicit drugs at least once in the past
year .................................................................................................................................. 13
Estimates of the number of ‘problem drug users’ ............................................................ 14
Calculation of drug use perception indices ..................................................................... 15
Calculation of regional and global estimates of cannabis use among 15-16 years old
students ............................................................................................................................ 18
Estimates of the prevalence of injecting drug use, HIV and hepatitis (C and B virus)
among people who inject drugs (PWID) .......................................................................... 25
Estimates on the number of drug-related deaths (mortality) ........................................... 30
3. Drug cultivation, production and manufacture .............................................................. 30
Net cultivation ...................................................................................................................... 33
Indirect estimation of illicit opium poppy cultivation ......................................................... 34
Yield and production............................................................................................................ 36
4. Drug trafficking ................................................................................................................. 42
Seizures ................................................................................................................................ 42
Trafficking routes and volumes ........................................................................................... 45
Drug price and purity data ................................................................................................... 451. Introduction
Considerable efforts have been made over the years to improve the estimates presented in the
World Drug Report, which rely, to a large extent, on information submitted by Member
States through the Annual Reports Questionnaire (ARQ). Nonetheless, challenges remain in
producing such estimates because of the gaps and the varying quality in the available data.
One major problem is the heterogeneity in the completeness and the time frame of data
coverage in ARQs reported by Member States. Irregular reporting may result in absence of
data for some years, and may also influence the reported trend in a given year. In addition,
submitted questionnaires are not always comprehensive, and much of the data collected are
subject to limitations and biases. These issues affect the reliability, quality and comparability
of the information received.
Sources of information
Under the International Drug Conventions, Member States are formally required to provide
national drug control related information annually to the ‘Secretary General’ of the United
Nations (i.e. the Secretariat in the UNODC). For this purpose, the Commission on Narcotic
Drugs in 2010 endorsed the revised Annual Reports Questionnaire (ARQ) that is sent to
Member States each calendar year for submission of responses and information on the drug
situation.
The World Drug Report 2018 is based on data primarily obtained from the ARQs submitted
by Governments to UNODC. The data collected in the current ARQ normally refer to the
drug situation in 2016. Out of 199 potential respondents to the ARQ for 2016 (including 193
Member States), UNODC received 110 replies to its questionnaire on the “Extent and
patterns of and trends in drug use (ARQ Part III)” and 113 replies to Part IV on “Extent and
patterns and trends in drug crop cultivation, manufacturing and trafficking”. Europe, had the
best coverage (87 per cent of the respondents provided a reply), followed by Asia (77 per
cent) and the Americas (57 per cent). In the case of Africa, only 31 per cent of the Member
States, and in the Oceania region, only two out of the 16 countries, responded to the Annual
Report Questionnaire.
In general, the quantity of information provided on illicit drug supply is significantly better
than that of information provided on drug demand. Analysis of responses to Part IV of the
1ARQ revealed that 71 per cent of them were ‘substantially’ completed compared to 64 per
cent of Part III (ARQs with completion rates higher than 50 per cent were classified as having
been ‘substantially filled in’; ARQs with completion rates lower than 50 per cent were
classified as having been ‘partially filled in’).
In order to analyse the extent to which Member States provided information, a number of key
questions in the ARQ were identified:
For Part III, on the extent and patterns and trends of drug abuse, the key questions
used for the analysis referred to: trends in drug use, for which 89 per cent of the
respondents returning the ARQ provided information; prevalence of different drugs
among the general population, for which 64 per cent of the respondents provided
information; for prevalence of drug use among youth 59 per cent responded; for
drug related mortality 57 per cent and for treatment demand 80 per cent. On average,
for the countries which submitted Part III to UNODC, the overall response rate of
completion was 63 per cent. However, this analysis does not take into account the
completeness or quality of the information provided in response to each of the areas
mentioned.
For Part IV, on the extent and patterns and trends in drug crop cultivation,
manufacturing and trafficking, the analysis included replies to the questions on: the
quantities seized, for which 97 per cent of the Member States returning the ARQ
provided the information; on trafficking of illicit drugs, for which 97 per cent of
these Member States provided responses; on prices and purity 88 per cent of the
Member States responded, and on persons brought into formal contact with the
police and/or the criminal justice system in connection with drug-related offences,
which 79 per cent of the Member States provided information. The overall analysis
of these data revealed that 72 per cent of the Part IV responses were “substantially”
completed. However this analysis does not take into account the completeness of
responses of the quality of information provided in each of sections mentioned.
Information provided by Member States in the ARQ form the basis for the estimates and
trend analysis provided in the World Drug Report. Often, this information and data is not
sufficient to provide an accurate or comprehensive picture of the world’s drug markets. When
2necessary and where available, the data from the ARQ are thus supplemented with data from
other sources.
As in previous years, seizure data made available to UNODC via the ARQ was
complemented primarily with data from other government sources, such as other official
communication with UNODC, official national publications, data provided to UNODC by the
Heads of National Law Enforcement Agencies (HONLEA) at their regional meetings. and
data published by international and regional organisations such as Interpol/ICPO, World
Customs Organization, European Monitoring Centre for Drugs and Drug Addiction
(EMCDDA) and the Inter-American Drug Abuse Control Commission (CICAD). Price data
for Europe were complemented with data from Europol. Demand related information was
obtained through a number of additional sources, including the national assessments of the
drug situation supported by UNODC, the drug control agencies participating in the
UNODC’s ‘Drug Abuse Information Network for Asia and the Pacific’ (DAINAP), as well as
various national and regional epidemiological networks such as the European Monitoring
Centre for Drugs and Drug Addiction (EMCDDA) or the Inter-American Drug Abuse
Control Commission (CICAD). Reports published by National governments and academic
research published in the scientific literature were also used as additional sources of
information. This type of supplementary information is useful and necessary as long as
Member States lack the monitoring systems necessary to produce reliable, comprehensive
and internationally comparable data.
To this end, UNODC encourages and supports the improvement of national monitoring
systems. Major progress has been made in the area of illicit crop monitoring over the last few
years in some of the countries that have major illicit crop cultivations. In close cooperation
with UNODC and with the support of major donors – these countries have developed
impressive monitoring systems designed to identify the extent of, and trends in, the
cultivation of narcotic plants. These data form a fundamental basis for trend analysis of illicit
crop cultivation and drug production presented in the World Drug Report.
There remain significant data limitations on the demand side. Despite commendable progress
made in several Member States, in the area of prevalence estimates for example, far more
remains to be done to provide a truly reliable basis for trend and policy analysis and needs
assessments. The work currently being done on the World Drug Report 2016 provides yet
3another opportunity to emphasize the global need for improving the evidence base available
to the policy makers and programme planners.
2. Data on drug use and health consequences of drug use
Overview
UNODC estimates of the extent of illicit drug use in the world have been published
periodically since 1997. Assessing the extent of drug use (the prevalence and estimates of the
number of drug users) is a particularly difficult undertaking because it involves in most
settings measuring the size of a ‘hidden’ population. Regional and global estimates are
reported with ranges to reflect the information gaps. The level of confidence expressed in the
estimates varies across regions and drug types.
A global estimate of the level of use of a specific drug involves the following steps:
1. Identification and analysis of appropriate sources (starting from the ARQ);
2. Identification of key benchmark figures for the level of drug use in all countries where
data are available (annual prevalence of drug use among the general population aged
15-64) which then serve as ‘anchor points’ for subsequent calculations;
3. ‘Standardization’ of existing data if reported with a different reference population
than the one used for the World Drug Report (for example, from age group 12 and
above to a standard age group of 15-64);
4. Adjustments of national indicators to estimate an annual prevalence rate if such a rate
is not available (for example, by using the lifetime prevalence or current use rates; or
lifetime or annual prevalence rates among the youth population). This includes the
identification of adjustment factors based on information from countries in the region
with similar cultural, social and economic situations where applicable;
5. Imputation for countries where data are not available, based on data from countries in
the same subregion. Ranges are calculated by considering the 10th and 90th weighted
percentile of the subregional distribution, using the target population in the countries
as weights;
46. Extrapolation of available results for a subregion were calculated only for subregions
where prevalence estimates for at least two countries covering at least 20% of the
population were available. If, due to a lack of data, subregional estimates were not
extrapolated, a regional calculation was extrapolated based on the 10th and 90th
percentile of the distribution of the data available from countries in the region. For the
World Drug Report 2018, this methodology was revised in favour of a weighted
percentile procedure that takes into account the population aged 15-64 in the
countries.
7. Aggregation of subregional estimates rolled-up into regional results to arrive at global
estimates.
For countries that did not submit information through the ARQ, or in cases where the data
were older than 10 years, other sources were identified, where available. In nearly all cases,
these were government sources. Many estimates needed to be adjusted to improve
comparability (see below).
In cases of estimates referring to previous years, the prevalence rates are unchanged and
applied to new population estimates for the year 2016. Currently, only a few countries
measure prevalence of drug use among the general population on an annual basis. The
remaining countries that regularly measure it - typically the more economically developed -
do so usually every three to five years. Therefore, caution should be used when interpreting
any change in national, regional or even global prevalence figures, as changes may in part
reflect newer reports from countries, at times with changed methodology, or the exclusion of
older reports, rather than actual changes in prevalence of a drug type.
Detailed information on drug use is available from countries in North America, a large
number of countries in Europe, a number of countries in South America, the two large
countries in Oceania and a limited number of countries in Asia and Africa. For the World
Drug Report 2018, new estimates of prevalence of drug use among the general population for
the year 2016 were available for 22 countries, while two Member States provided data for the
year 2017. One key problem in national data is the level of accuracy, which varies strongly
from country to country. Not all estimates are based on sound epidemiological surveys. In
some cases, the estimates simply reflect the aggregate number of drug users found in drug
registries, which cover only a fraction of the total drug using population in a country. Even in
5cases where detailed information is available, there is often considerable divergence in
definitions used, such as chronic or regular users; registry data (people in contact with the
treatment system or the judicial system) versus survey data (usually extrapolation of results
obtained through interviews of a selected sample); general population versus specific surveys
of groups in terms of age (such as school surveys), special settings (such as hospitals or
prisons), or high risk groups, et cetera.
To reduce the error margins that arise from simply aggregating such diverse estimates, an
attempt has been made to standardize - as a far as possible - the heterogeneous data set. All
available estimates were transformed into one single indicator – annual prevalence among the
general population aged 15 to 64 – in most instances using regional average estimates and
using transformation ratios derived from analysis of the situation in neighbouring countries..
The basic assumption is that though the level of drug use differs between countries, there are
general patterns (for example, young people consume more drugs than older people; males
consume more drugs than females; people in contact with the criminal justice system show
higher prevalence rates than the general population, et cetera) which apply to most countries.
It is also assumed that the relationship between lifetime prevalence and annual prevalence
among the general population or between lifetime prevalence among young people and
annual prevalence among the general population, except for new or emerging drug trends, do
not vary greatly among countries with similar social, cultural and economic situations.
UNODC does not publish estimates of the prevalence of drug use in countries with smaller
populations (less than approximately 100,000 population aged 15-64) where the prevalence
estimates were based on the results of youth or school surveys that were extrapolated to the
general adult population, as applying such methods in the context of small countries can
result in inaccurate figures.
Indicators
The most widely used indicator at the global level is the annual prevalence rate: the number
of people who have consumed an illicit drug at least once in the twelve months prior to the
study. Annual prevalence has been adopted by UNODC as one of key indicators to measure
the extent of drug use. It is also part of the Lisbon Consensus on core epidemiological
6indicators of drug use which has been endorsed by the Commission on Narcotic Drugs. The
key epidemiological indicators of drug use are:
1. Drug consumption among the general population (prevalence and incidence);
2. Drug consumption among the youth population (prevalence and incidence);
3. High-risk drug use (number of injecting drug users and the proportion engaged in
high-risk behaviour, number of daily drug users);
4. Utilization of services for drug problems (treatment demand);
5. Drug-related morbidity (prevalence of HIV, hepatitis B virus and hepatitis C virus
among drug users);
6. Drug-related mortality (deaths attributable to drug use).
Efforts have been made to present the overall drug situation from countries and regions based
on these key epidemiological indicators.
The use of annual prevalence is a compromise between lifetime prevalence data (drug use at
least once in a lifetime) and data on current use (drug use at least once over the past month).
The annual prevalence rate is usually shown as a percentage of the youth and adult
population. The definitions of the age groups vary, however, from country to country. Given
a highly skewed distribution of drug use among the different age cohorts in most countries,
differences in the age groups can lead to substantially diverging results.
Applying different methodologies may also yield diverging results for the same country. In
such cases, the sources were analysed in-depth and priority was given to the most recent data
and to the methodological approaches that are considered to produce the best results. For
example, it is generally accepted that nationally representative household surveys are
reasonably good approaches to estimating cannabis, ATS or cocaine use among the general
population, at least in countries where there are no adverse consequences for admitting illicit
drug use. Thus, household survey results were usually given priority over other sources of
prevalence estimates.
When it comes to the use of opiates (opium, heroin, and other illicit opiates), injecting drug
use, or the use of cocaine and ATS among regular or dependent users, annual prevalence data
derived from national household surveys tend to grossly under-estimate such use, because
7heroin or other problem drug users often tend to be marginalized or less socially integrated,
and may not be identified as living in a ‘typical’ household (they may be on the streets,
homeless or institutionalized). Therefore, a number of ‘indirect’ methods have been
developed to provide estimates for this group of drug users, including benchmark and
multiplier methods (benchmark data may include treatment demand, police registration or
arrest data, data on HIV infections, other services utilization by problem drug users or
mortality data), capture-recapture methods and multivariate indicators. In countries where
there was evidence that the primary ‘problem drug’ was opiates, and an indirect estimate
existed for ‘problem drug use’ or injecting drug use, this was preferred over household
survey estimates of heroin use. Therefore, for most of the countries, prevalence of opioid or
opiates use reported refers to the extent of use of these substances measured through indirect
methods.
For other drug types, priority was given to annual prevalence data found by means of
household surveys. In order to generate comparable results for all countries, wherever
needed, the reported data was extrapolated to annual prevalence rates and/or adjusted for the
preferred age group of 15-64 for the general population.
Extrapolation methods
Adjustment for differences in age groups
Member States are increasingly using the 15-64 age group, though other groups are used as
well. Where the age groups reported by Member States did not differ significantly from 15-
64, they were presented as reported, and the age group specified. Where studies were based
on significantly different age groups, results were typically adjusted. A number of countries
reported prevalence rates or number of drug users for the age groups 15+ or 18+. In such
cases, adjustments were generally based on the assumption that there was no significant drug
use above the age of 64; the reported number of drug users based on the population age 15+
(or age 18+) was shown as a proportion of the population aged 15-64.
Extrapolation of results from lifetime prevalence to annual prevalence
Some countries have conducted surveys in recent years without asking the question whether
drug consumption took place over the last year. In such cases, results were extrapolated to
reach annual prevalence estimates. For example, country X in West and Central Europe
8reported a lifetime prevalence of cocaine use of 2%. As an example, taking data for lifetime
and annual prevalence of cocaine use in countries of West and Central Europe, it can be
shown that there is a strong positive correlation between the two measures (correlation
coefficient R = 0.94); that is, the higher the lifetime prevalence, the higher the annual
prevalence and vice versa. Based on the resulting regression line (with annual prevalence as
the dependent variable and lifetime prevalence as the independent variable) it can be
estimated that a country in West and Central Europe with a lifetime prevalence of 2% is
likely to have an annual prevalence of around 0.7% (see figure). Almost the same result is
obtained by calculating the ratio of the unweighted average of annual prevalence rates of the
West and Central European countries and the unweighted average lifetime prevalence rate
(0.93/2.61 = 0.356) and multiplying this ratio with the lifetime prevalence of the country
concerned (2% * 0.356 = 0.7%).
Example of annual and lifetime prevalence rates of cocaine use in West and Central Europe
in % of population age 15-64
3.0
Data points
annual prevalence
2.5
Regression curve
2.0
1.5
y = 0.3736x - 0.0455
R = 0.94
1.0 R2 = 0.880
0.5
0.0
0.0 1.0 2.0 3.0 4.0 5.0 6.0 7.0
life-time prevalence in % of population age 15-64
Sources: UNODC, Annual Reports Questionnaire Data / EMCDDA, Annual Report.
A similar approach was used to calculate the overall ratio by averaging the annual/lifetime
ratios, calculated for each country. Multiplying the resulting average ratio (0.334) with the
lifetime prevalence of the country concerned provides the estimate for the annual prevalence
(0.387 * 2% = 0.8%). There is a close correlation observed between lifetime and annual
9prevalence (and an even stronger correlation between annual prevalence and monthly
prevalence). Solid results (showing small potential errors) can only be expected from
extrapolations done for a country in the same region. If instead of using the West and Central
European average (0.387), the ratio found in the USA was used (0.17), the estimate for a
country with a lifetime prevalence of cocaine use of 2% would instead amount to 0.3% (2% *
0.17). Such an estimate is likely to be correct for a country with a drug history similar to the
USA, which has had a cocaine problem for more than two decades, as opposed to West and
Central Europe, where the cocaine problem is largely a phenomenon of the last decade.
Therefore, data from countries in the same subregion with similar patterns in drug use were
used, wherever possible, for extrapolation purposes.
Both approaches—the regression model and the ratio model—were used to determine upper
and lower uncertainty range estimates calculated at a 90% confidence interval among those
aged 15-64 years in the given country. The greater the range, the larger the level of
uncertainty around the estimates. The range for each country is reported in the statistical
annex, where available.
Extrapolations based on school surveys
Analysis of countries which have conducted both school surveys and national household
surveys shows that there is, in general, a positive correlation between the two variables,
particularly for cannabis, ATS and cocaine. The correlation, however, is weaker than that of
lifetime and annual prevalence or current use and annual prevalence among the general
population. But it is stronger than the correlation between opiate use and injecting drug use
and between treatment demand and extent of drug use in the general population
These extrapolations were conducted by using the ratios between school surveys and
household surveys of countries in the same region or with similar social structure where
applicable. As was the case with extrapolation of results from lifetime prevalence to annual
prevalence, two approaches were taken: a) the unweighted average of the ratios between
school and household surveys in the comparison countries with an upper and lower
uncertainty range estimate calculated at a 90% confidence interval; and b) a regression-based
extrapolation, using the relationships between estimates from the other countries to predict
the estimate in the country concerned, with an upper and lower uncertainty range estimate
10calculated at a 90% confidence interval. The final uncertainty range and best estimate are
calculated using both models, where applicable.
Extrapolations based on treatment data
For a number of developing countries, the only drug use-related data available was drug users
registered or treatment demand. In such cases, other countries in the region with a similar
socio-economic structure were identified, which reported annual prevalence and treatment
data. A ratio of people treated per 1,000 drug users was calculated for each country. The
results from different countries were then averaged and the resulting ratio was used to
extrapolate the likely number of drug users from the number of people in treatment.
National, regional and global estimates of the number of people who use drugs
and the health consequences of drug use
For this purpose, the estimated prevalence rates of countries were applied to the population
aged 15-64, as provided by the United Nations Population Division for the year 2016.
In the tables presented in the World Drug Report for regional and global estimates, totals may
not add up due to rounding.
Ranges have been produced to reflect the considerable uncertainty that arises when data are
either extrapolated or imputed. Ranges are provided for estimated numbers and prevalence
rates in the Report. Larger ranges are reported for subregions and regions with less certainty
about the likely levels of drug use – in other words, those regions for which fewer direct
estimates are available, for a comparatively smaller proportion of the region’s population, or
for regions for which the existing estimates show a comparatively larger variability.
Countries with one published estimate (typically those countries with a representative
household survey, or an indirect prevalence estimate that did not report ranges) did not have
uncertainty estimated. This estimate is reported as the ‘best estimate’.
To account for populations in countries with no published estimate, the 10th and 90th
percentile in the range of direct estimates within the subregion was used to produce a lower
and upper estimate. For the World Drug Report 2018, for the first time a weighted percentile
procedure was implemented, that takes into account the population in the 15-64 age group in
11each country. For example, there are four countries in the Near and Middle East / South-West
Asia subregion with sufficiently recent past year prevalence estimates for cocaine use:
Afghanistan (0.00, a point estimate), Iran (Islamic Republic of) (0.00 – 0.01, best estimate
0.01), Israel (0.50 – 0.70, best estimate 0.60) and Pakistan (0.00 – 0.04, best estimate 0.01).
In order to obtain a best estimate for the subregion, the weighted average of the best estimates
for prevalence over these three countries is applied to the population of the remaining
countries in the subregion without prevalence data. To obtain a range for the subregion, the
weighted 10th percentile of the lower bounds of the uncertainty ranges (0.00, 0.00, 0.50 and
0.00), namely 0.00, and the 90th percentile of the upper bounds (0.00, 0.01, 0.70 and 0.04),
namely 0.04, were considered. It is important to note that, as Israel accounts for only about 3
per cent of the population within the 15-64 age group in these four countries, the resulting
weighted percentiles are not heavily influenced by the higher prevalence present in this
country. The percentages of 0.00and 0.04 were applied to the population of the remaining
countries without prevalence data, in combination with the national level data for
Afghanistan, Iran (Islamic Republic of), Israel and Pakistan, to derive subregional lower and
upper estimates of 0.01 and 0.04 per cent respectively.
In some cases, not all the regions in a subregion had sufficient country-level data to allow the
above calculations. In such cases, for the purposes of arriving at estimates at regional level,
lower and upper estimates at the sub-regional level were derived based on the data points
from the entire region, specifically by considering the weighted 10th and 90th percentiles
respectively of the lower and upper country-level estimates. These results were then
combined with the other subregions to arrive at upper and lower estimates, and hence best
estimates, at regional level.
This produces conservative (wide) intervals for subregions where there is geographic
variation and/or variance in existing country-level estimates; but it also reduces the likelihood
that skewed estimates will have a dramatic effect on regional and global figures, as the
weighted percentiles procedure will give a smaller weight to relatively small countries, which
tend to be more likely to present an extreme prevalence.
One exception was South Asia’s subregional opiate and cannabis estimates. In this case,
India’s population accounts for approximately 85% of total population of the six countries in
the subregion, but recent reliable estimates of drug use for India were not available. Instead
of using all prevalence estimates for Asia (that is, estimates from the Near and Middle East to
12East Asia) to determine India’s contribution to the subregional uncertainty, it was determined
that India’s contribution was best reflected by its neighbouring countries.
For the World Drug Report 2018, the region of Oceania was divided into four subregions
(Australia and New Zealand, Melanesia, Micronesia, and Polynesia), while in previous years
no subregional estimates of annual prevalence among the population aged 15-64 were
available. Given that the data for Melanesia, Micronesia and Polynesia is scarce, in order to
avoid imputing these regions with data from only Australia and New Zealand, the closest five
countries to these regions with available data were considered in the calculations, when
necessary. This was the case for the calculations of the prevalence of cocaine, “ecstasy”,
opiates and opioids.
Estimates of the total number of people who used illicit drugs at least once in the past year
This year’s Report used the same approach as in the previous years. Two ranges were
produced, and the lowest and highest estimate of each the approaches were taken to estimate
the lower and upper ranges, respectively, of the total drug using population. This estimate is
obviously tentative given the limited number of countries upon which the data informing the
two approaches were based. The two approaches were as follows:
Approach 1:
The global estimates of the number of people using each of the five drug groups in the past
year were added up. Taking into account that people use more than one drug type and that
these five populations overlap, the total was adjusted downward. The size of this adjustment
was made based upon household surveys conducted in 26 countries globally including
countries from North America (Canada, Mexico and the United States, Europe (including
Italy, Germany, Spain and England and Wales), Latin America (Argentina, Brazil,
Plurinational State of Bolivia, Chile, Peru and Uruguay), Asia and the Pacific (Israel,
Indonesia, Philippines, and Australia) and Africa (Algeria), which assessed all five drug
types, and reported an estimate of total illicit drug use. Across these studies, the extent to
which adding each population of users over estimated the total population was a median
factor of 1.12. The summed total was therefore divided by 1.12
13Approach 2:
This approach was based on the average proportion of the total drug using population that
comprises cannabis users. The average proportion was obtained from household surveys
conducted in the same countries as for Approach 1. Across all of these studies, the median
proportion of total drug users that comprised cannabis users was 81 per cent. The range of
cannabis users at the global level was therefore divided by 0.813.
The global lower estimate was the lower of the two values obtained from the two approaches,
while the upper estimates was the upper value derived from the two approaches described.
Estimates of the number of ‘problem drug users’
It is useful to make estimates of the number of drug users whose use is particularly
problematic, as a proxy to those who could be diagnosed with drug use disorders, as this
subgroup of drug users is most likely to come to the attention of health and law enforcement.
Moreover, this subgroup’s drug use has been estimated to cause the main burden of disease
and public order.
The number of problem drug users is typically estimated with the number of people with drug
use disorders. Sometimes, an alternative approach is used. The EMCDDA has been using
‘injecting or long duration use of opioids, amphetamines or cocaine’ to guide country-level
indirect prevalence estimation studies of problem drug use.
In this Report, as in previous years, each of the five range estimates of the number of people
using each of the five drug groups was converted into a ‘heroin user equivalent’. This was
calculated with ‘relative risk coefficients’ (see below) derived from the UNODC Harm Index.
This method enables the aggregation of results from different drugs into one reference drug.
14Table: Relative risk coefficient
Relative
Deaths risk
Treatment index IDU Toxicity index coefficient
(average
treatment,
IDU, toxicity,
Index Index death)
Opiates 100 100 100 100 100
Cocaine 85.3 47.8 88 18.5 59.9
Amphetamines 20.1 59.5 32 6.8 29.6
Ecstasy 3.8 6.1 20.7 1 7.9
Cannabis 9 0 1.5 0.6 2.8
A lower range was calculated by summing each of the five lower range estimates; the upper
end of the range was calculated by summing the upper range of the five estimates.
To obtain an estimate of the number of ‘problem drug users’, these totals were multiplied by
the corresponding proportion of past year heroin users in the United States National Survey
on Drug Use and Health (range 53-68% over the recent rounds of this survey). Hence, the
LOW estimate is the lower proportion (53%) multiplied by the lower estimated size of the
heroin use equivalent population (31.4 million heroin user equivalents). The HIGH estimate
is the higher proportion (68%) multiplied by the higher estimated size of the heroin use
equivalent population (65.3 million heroin user equivalents). This gives a range of 16.7 to
44.4 million problem drug users globally.
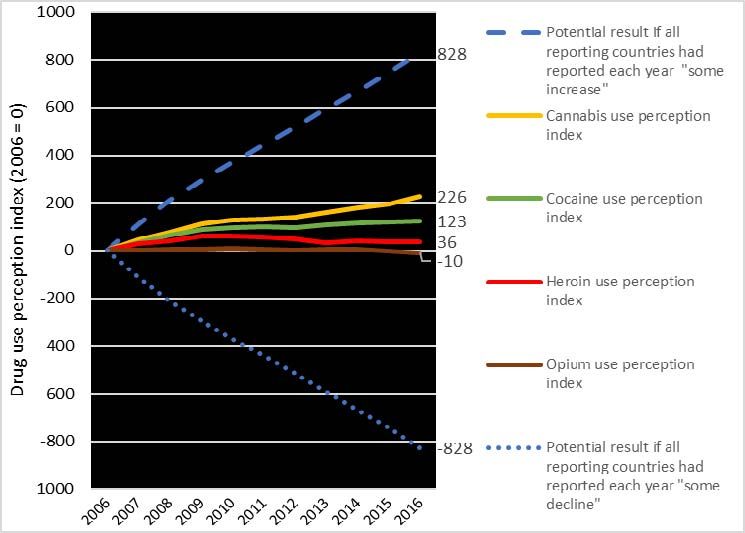
Calculation of drug use perception indices
In addition to estimates on the extent of drug use, member states also provide UNODC with
their perceptions of drug use trends. Such trends are typically based on a multitude of
indicators, including general population prevalence data, school surveys, treatment data,
emergency room visits, mortality data, reports by social workers, health care officials and law
15enforcement officers, arrest data, seizure data, media reports, etc.. Based on this information
a simple index has been created. For reports of “large increase” 2 points were allocated, for
“some increase” 1 point; for “stable” 0 points; for “some decrease” 1 point was deducted and
for “large decrease” 2 points were deducted. The points calculated for each year were
subsequently added to the accumulated points of the previous year to arrive the drug use
perception index. The year 2006 was chosen as the starting year of the index.
Results for cannabis indicate rather strong increases over the 2006-2009 period, followed by
a period of only minor increases though again stronger increases in 2016.
Example of calculation of global cannabis use perception trend index:
Cannabis use
Points* perception index
(accumulated
points; 2006 =100)
2006 45 0
2007 45 45
2008 30 75
2009 36 111
2010 16 127
2011 4 131
2012 9 140
2013 19 159
2014 22 181
2015 15 196
2016 30 226
Points allocated per country:
* “large increase”: 2 points; “ some increase”: 1 point; “stable”: 0; “some decrease”: 1 point; “large decline”: 2 points
16The calculated cannabis use perception index – with a base year of 0 in 2006 - reached 226
points by 2016, the cocaine use perception index 123 points, the heroin use perception index
36 points while the opium use perception use fell by 10 points until 2016. These index
numbers suggest that cannabis, cocaine and heroin use increased while opium use declined
slightly over the 2006-2016 period.
On average close to 83 countries per year reported drug use trends over the 2007-2016 period
to UNODC. If all reporting countries had seen each year a stable situation the drug use
perception index would have remained unchanged at 0; if all reporting countries had seen
“some increase’, the index would have reached 828 points by 2016 (for a drug) and in case all
reporting countries had seen ‘large increases’ the index would have attained 1,656 points by
2016 (for a drug).
Drug use perception index for cannabis, cocaine, heroin and opium, 2006-2016
Source: UNODC, annual report questionnaire data.
17Calculation of regional and global estimates of cannabis use among 15-16 years old
students
UNODC undertook in the World Drug Report – for the first time ever – an estimate of the
annual prevalence of cannabis use among 15-16 years old students, based on available data
from 130 countries.
Cannabis was selected as in most countries cannabis is the drug most widely used, both
among the general population and among youth. For instance, data from the Monitoring the
Future studies suggested that cannabis users among 10th grade students (typically aged 15-16)
accounted for 92 per cent of all drug users in this age group in 2017. Similarly, the the
European School Survey Project on Alcohol and Other Drugs (ESPAD) studies suggested
that cannabis users in Europe accounted for 93 per cent of all drug users in 2015.
The age group “15-16 years” was chosen as this is the “preferred” age group for “youth” that
is asked in UNODC’s annual report questionnaire. This age group was also chosen by
ESPAD which regularly provides data from some 35 European countries on drug and alcohol
use. This age group is also available from the surveys among 10th graders undertaken
annually under the Monitoring the Future project in the United States, funded by the National
Institute on Drug Abuse (NIDA), and from a number of other countries.
Cannabis use prevalence rates typically increase with age until around 18-20 years before
declining again thereafter with age. This also means that for most countries cannabis use
prevalence rates among 15-16 years old students turn out to be rather similar to the broader
group of students aged 12-18 (with those aged 12-14 showing lower rates and those aged 17-
18 showing higher rates). Thus, for the United States the annual cannabis use prevalence
rates amongst 10th graders turn out to be very similar to those found amongst 8th, 10th and 12th
graders combined. Similarly, in Colombia annual prevalence of cannabis use amongst 12 to
18 years old students was found to have been very similar to the rates found among 15-16
years old students. The same applies to students in Pakistan as well. Cannabis use prevalence
rates among students aged 15-16 are thus reasonably good proxies for cannabis use among
the overall student population aged 12-18. They are thus the preferred indicator for measuring
student drug use at the international level as is also reflected in the question on student drug
use in UNODC’s annual report questionnaire.
18The methodology chosen to calculate the global average of cannabis use among students
aged 15-16 years was very similar to the methodology used to calculate cannabis use among
the general population aged 15-64:
1. Listing – on a sub-regional basis – the latest annual prevalence rates of cannabis use
among the population aged 15-16 (which in most cases reflected school surveys) and
multiplying such percentages with the average population of those aged 15-16 in
those countries in 2016.
2. For the remaining countries that reported prevalence data on cannabis use (but not the
requested age group of not annual prevalence the following
adjustments/extrapolations were done:
a. Adjusting surveys using different age groups to a likely estimate for the
population aged 15-16 years; the age adjustments were done based on detailed
data from the United Stated for countries in North America, Europe and the
developed countries of the Oceania region (i.e. Australia and New Zealand);
for Africa and Asia based on detailed data available from Pakistan and for
South America, Central America and the Caribbean based on detailed data
available from Colombia.
A special model was developed for the adjustments. In short, taking into
account considerations of diversity and representativity, the following data
served as benchmarks for the calculation of the conversion ratios: the 2013
survey in Colombia among people aged 12-651, the 2012 survey carried out in
Pakistan jointly by UNODC and the Government of Pakistan targeting the
population aged 15-64 2 and the 2015 National Survey on Drug Use and
Health of the United States among people aged 12 years and older3 . After
collating or generating prevalence data broken down by age groups,
prevalence data were derived for each single-year age group. In cases where
robust data were not available at this level of granularity (e.g. prevalence data
1
Gobierno Nacional de la República de Colombia, Estudio Nacional de Consumo de Sustancias Psicoactivas
en Colombia – 2013.
2
UNODC, Drug Use in Pakistan 2013.
3
Data query engine at http://pdas.samhsa.gov/ and Substance Abuse and Mental Health Services
Administration, Results from the 2015 National Survey on Drug and Health: Detailed Tables.
19available only for the age brackets 15-19, 20-24, 25-29, etc.), the prevalence in
single-year age groups was estimated by optimizing for smoothness the
prevalence data as a function of age - subject to the constraints that the total
number of users within each given age bracket remained unchanged (i.e. equal
to the prevalence multiplied by the population within the specific age bracket).
Where necessary boundary conditions were imposed, e.g. a prevalence of 0 for
ages 10 and below. On the basis of single-year prevalence estimates obtained,
the prevalence rates were estimated for each possible age group that could
potentially arise (e.g. 10-15, 12-19, 14-22). Finally, the conversion factors
were calculated as the ratios of the prevalence data within the respective age
groups as compared to the age groups of interest (age 15-16 years).
b. Extrapolating available life-time or past month data of cannabis use from
individual countries to (missing) annual prevalence data based on a regression
analysis of other countries in the subregion providing both life-time and
annual data among youth or both past month and annual data among youth. A
95 per cent confidence interval was then used to calculate, in addition, a
minimum and a maximum estimate based on such regression data.
3. For the remaining countries which did not report any prevalence data it was assumed
that – on average – they had similar prevalence rates as the population weighted
average of the reporting countries in the subregion. In cases where the reporting
countries accounted for less than 20 per cent of the total population of the subregion,
the (weighted) average of reporting countries in the region as a whole was used
instead.
4. For countries not reporting any prevalence data it was assumed that the lower estimate
was equivalent to the (population weighted) 10th percentile of the reporting countries
in the subregion (or the region if reporting countries in the subregion accounted for
less than 20 per cent of total population in the subregion) while the upper estimate
was equivalent to the (population weighted) 90th percentile of the reporting countries
in the subregion (or the data for the region was used as a proxy if reporting countries
in the subregion accounted for less than 20 per cent of the total population in the
subregion).
20The reported ranges reflected primarily the coverage of a region by student surveys;
in short, the larger the reported error margins, the less countries reported school
survey data in a region or sub-region to UNODC. Error margins turned out to be small
for Europe and the Americas where a majority of countries undertook such school
surveys in recent years while they were rather large for Africa, Asia or for the
Oceania region (with the exception of the economically advanced countries in this
region).
5. The totals of the calculated subregional estimates gave the regional estimates and the
total of the regional estimates then gave the global estimates.
6. The number of cannabis users was shown for a hypothetical average age of 15-16
years; in order to calculate the total number of cannabis users of those aged 15 years
and 16 years the totals had to be still multiplied by two (in order to be in line with the
approach used to show general population estimates for those aged 15-64)
The analysis of drug consumption based on the analysis of waste-water is an alternative
method to estimate drug consumption.
The development of analytical tools and methods for the waste-water analysis took place in
recent years in Europe by waste-water research institutes under the umbrella of the COST
initiative (Sewage Analysis CORe group Europe under the European Cooperation in Science
and Technology initiative), supported by the European Union under the EU Framework
Programme Horizon 2020. Both EU and non-EU countries participate in this cooperation.
In order to obtain – as far as possible – comparable data, waste-water in various cities has
been analysed by the research institutes participating in the COST exercise over a one week
period each year in spring. The amount of benzoylecgonine found each day in the waste-
water was determined and a daily average was calculated. (This is important as cocaine use
is typically more widespread during the weekend than during normal weak days). In a
subsequent step the size of the population responsible for the waste-water in the respective
waste-water catchment areas was determined and the results were shown in terms of average
milligrams of benzoylecgonine (a main cocaine metabolite) per day found in waste-water per
1000 inhabitants.
The waste-water data used for the analysis in the World Drug Report can be found under:
21http://www.emcdda.europa.eu/topics/pods/waste-water-analysis#panel2 as well as under
http://score-cost.eu/wp-
content/uploads/sites/118/2018/03/SCORE_monitoring_final_2017_v8.pdf
Even though the results from the analysis of waste-water have been obtained applying high
levels of scientific rigour, the subsequent analysis of the trends at the European level has
remained a challenge due to the fact that different cities across Europe took part in this
exercise in different years over the 2011-2017 period and differences of cocaine consumption
across European cities continue to be quite significant. This means that the inclusion or the
exclusion of a specific city can have a significant impact on the overall average. In other
words, calculating and comparing the averages of the cities participating each year in the
survey may lead to misleading results as a growing participation of cities with lower levels of
cocaine consumption could well offset increases in overall cocaine consumption.
This problem can be overcome by analysing the results of the cities which participated each
year in this exercise. The time series for each city were then weighted by the population in
the respective catchment areas to calculate the overall average. Such an analysis would show
a strong increase over the 2011-2017 period (65 per cent). However, such results would be
based on the results of just 11 cities and the data from these cities are not necessarily a
reliable indicator for overall cocaine consumption trends in Europe.
An alternative approach used and shown in the report was to expand the analysis (with a
respective 95 per cent confidence interval) to 99 European cities participating in at least one
year in the study analysing bencoylecgonine in waste-water (including 19 cities in 2011, 23
in 2012, 42 in 2014, 53 in 2015, 57 in 2016 and 60 in 2017). UNODC included in its
calculations only cities that were geographically located within Europe, i.e. not included were
cities being part of European countries that were located outside of Europe.4
Interpolation techniques were then used to account for missing data. First data from the 99
cities were entered as reported from individual cities. In case of data gaps between years it
was assumed that there was a gradual increase or decline in per capita results between the two
4
Overall (i.e. including cities located overseas and including cities which did not analyse the benzoylecgonine
content of waste-water) 19 cities participated in waste-water analysis in 2011, 23 in 2012, 42 in 2013, 50 in
2014, 57 in 2015, 58 in 2015 and 66 in 2017. The number of countries participating in the COST exercise rose
from 11 in in 2011 to 23 in 2017; the population covered by the waste-water treatment plants that were analysed
increased from 14 million in 2011 to 36 million in 2017. (SCORE, Waste-Water Monitoring Data 2011-2017,
http://score-cost.eu/monitoring2017/ )
22data points (using the Excel function Series, Trend, Growth). In case of missing data at the
beginning or at the end of the data series, the latest reported data (from other years) was used
to fill the data gaps. This method should have helped to reduce the bias due to the reporting
of additional cities (or the non-reporting of other cities) in specific years while making better
use of reported data, thus reducing potential trend distortions. In order to calculate a
European average, the city results were weighted by the respective population living in the
respective waste-water catchment areas. Based on this method the consumption of cocaine in
Europe appears to have increased by 52 per cent over the 2011-2017 period, from 197 mg of
benzoylecgonine per day found in waste-water per 1,000 inhabitants in 2011 to 300 mg of
benzoylecgonine per day found in waste-water per 1,000 inhabitants in 2017.
This increase is – probably - still a conservative estimate for the actual rise as the model used
assumes no changes after the latest reported data (i.e. using 2016 data as a proxy for 2017
data if the latter were not reported).
The method of interpolations used for calculting the averages is shown below based on a
hypothetical example of data from four cities:
Hypothetical sample: data of benzoylecgonine per 1000 inhabitants in four cities
2011 2012 2013 2014 2015 2016 2017
City A 80 78 75 80 92 95
City B 55 60 85 90
City C 150 154 174 180
City D 140 115 120 125 127
Interpolation method* used for dealing with missing data for calculating the averages
2011 2012 2013 2014 2015 2016 2017
City A 80 78 75 80 92 93 95
City B 55 55 60 67 76 85 90
City C 150 154 160 167 174 180 180
City D 140 131 123 115 120 125 127
23*using Excel growth function for filling in data within a time series and assuming no change after latest year
available
Reported population living in waste-water catchment areas in cities A, B, C, D
2011 2012 2013 2014 2015 2016 2017
City A 120,000 125,000 126,000 128,000 130,000
City B 210,000 215,000 220,000 225,000
City C 60,000 65,000 75,000 77,000
City D 150,000 170,000 175,000 177,000 180,000
Interpolation method* used for estimating population living in waste-water catchment areas in
cities A, B, C, D
2011 2012 2013 2014 2015 2016 2017
City A 120,000 125,000 126,000 128,000 130,000 130,000 130,000
City B 210,000 210,000 215,000 216,654 218,321 220,000 225,000
City C 60,000 65,000 68,176 71,506 75,000 77,000 77,000
City D 150,000 156,391 163,053 170,000 175,000 177,000 180,000
*using Excel growth function for filling in data within a time series and assuming no change after
latest year available
Based on these data the population weighted averages were calculated for the four cities. The
calculation was done in Excel, using for each year the sumproduct function for
benzoylecgonine found in the four cities and the population in the four catchment areas; the
resulting total was then divided by the total population in the four waste-water catchment
areas in the respective year to arrive at the average (i.e. for 2017: (95*130,000+90*225,000
+180*77,000+127*180,000) / (130,000+225,000+77,000+180,000) = 113).
24Calculation of average of benzoylecgonine per 1000 inhabitants in four cities
2011 2012 2013 2014 2015 2016 2017
Average for cities
95 93 95 98 105 110 113
A, B, C, D
Estimates of the prevalence of injecting drug use, HIV and hepatitis (C and B virus)
among people who inject drugs (PWID)
Data sources, selection of country estimates and validation process
Population size estimates for PWID, and the prevalence of HIV and hepatitis among PWID,
were identified over the past five years using a comprehensive search of the published peer-
reviewed literature, a search of the “grey” literature, from the official United Nations survey
instruments of UNODC and UNAIDS, from regional organizations (particularly the
European Monitoring Centre for Drugs and Drug Addiction (EMCDDA)), and through the
global network of UNODC HIV/AIDS Advisors.
The criteria for the selection of country estimates primarily involved the consideration of the
methodological soundness of the estimates, determined according to the classification
presented in the table below (studies in class A are of higher methodological quality and
those in class D of lower quality), with due regard to national geographic coverage, the year
of the estimate, and the definition of the target population (global and regional estimates were
made for the annual prevalence of injecting among both genders aged 15-64). UNODC,
WHO, UNAIDS and the World Bank reviewed all estimates.
25Table: Classification of methodology for people who inject drugs, and those among them living
with HIV and hepatitis
Data are categorized by methodology according to a slightly modified classification originally
proposed in Mathers et. al. (2008) Lancet paper.5
Class Data on people who inject drugs
Indirect prevalence estimation methods
A e.g., capture-recapture,
network scale-up method,
multiplier methods, etc
B1 Mapping/census and enumeration
B2 General population survey
C Treatment and other national registers of drug users
· Official government estimate with no methodology reported
D1 · Experts’ judgment with known method of estimation (eg. an estimate obtained through a rapid assessment)
· Modelling studies (e.g. Spectrum)
· Delphi method or other consensus estimate
D2* Estimate from non-official source with methodology unknown
Class Data on the prevalence of HIV and hepatitis among people who inject drugs
A Seroprevalence study
A1 Multi-site seroprevalence study with at least two sample types (e.g. treatment or outreach sample)
A2 Seroprevalence study from a single sample type
B Registration or notification of cases of HIV infection (e.g. from treatment services)
C Prevalence study using self-reported HIV
· Official government estimate with no methodology reported
D1
· Modelling Studies (e.g. mode of transmission models)
D2* Estimate from non-official source with methodology unknown
*
Data graded D2 are excluded from the dataset
As part of a wider review process, every year since 2014, UNODC, WHO, UNAIDS and the
World Bank have reached out to a broad group of experts from academia (including all
former members of the Reference Group to the United Nations on HIV and Injecting Drug
Use) and regional, international, including civil society, organizations to ensure that a
scientific approach to the methodology was used and that the greatest number of datasets
available worldwide on the subject were included. Data were sent to Member States annually
for their validation and potential comments on the selected estimates, or for completion of
data if surveys had been conducted which UNODC was not aware of.
5Mathers, B., L. Degenhardt, et al. (2008). Global epidemiology of injecting drug use and HIV among people who inject
drugs: a systematic review. The Lancet 372(9651): 1733-1745
26You can also read