EVEN GROWTH PLANNING FOR A GROWING SYDNEY - MCKEL L - MCKELL INSTITUTE
←
→
Page content transcription
If your browser does not render page correctly, please read the page content below
THE
   McKellte
   Institu

   Institute
  McKell
T H E
  T      HEM C K E L L   I N S T I T U T E

Even
Growth
Planning for a Growing Sydney

COMMISSIONED BY UNIONS NSW

F E B R UA RY   2 01 9
1. Introduction
About the McKell Institute
The McKell Institute is an independent,
                                                                                          Institute
                                                                                         McKell
not-for-profit, public policy institute dedicated                                      T H E
                                                                                         T      HEM C K E L L   I N S T I T U T E
to developing practical policy ideas and
contributing to public debate.

                                                                                       Even
For more information phone (02) 9113 0944 or visit
www.mckellinstitute.org.au

                                                                                       Growth
                                                                                       Planning for a Growing Sydney
                             Author
                             EDWARD CAVANOUGH
                             Edward Cavanough is the Manager of
                             Policy at The McKell Institute.

THIS PROJECT WAS COMMISSIONED BY UNIONS NSW

                                                                            THE
                                                                            McKellte
The opinions in this paper are those of the author and do not necessarily
                                                                            Institu
represent the views of the McKell Institute’s members, affiliates,
individual board members or research committee members.
Any remaining errors or omissions are the responsibility of the authors.     Institu   F E B R UA RY   2 01 9
                                                                            McKellte
                                                                            T     HE
4 T H E M C K E L L I N S T I T U T E Even Growth Planning for a Growing Sydney 5
Contents
Executive Summary 8 Recommendation 3: The Medium Density Code must be reformed,
distributing medium density development to low-density,
Foreword 9 low-growth areas in proximity to major employment hubs 42
The Nature of Sydney’s Population Growth 11 Planning for, and enacting, medium density has been poor...............................................................................................................................................................................43
Where Sydney’s population is today..................................................................................................................................................................................................................................................................12 Medium-density works, but must be distributed fairly...................................................................................................................................................................................................43
Visualising population growth from 1990-2015.............................................................................................................................................................................................................................13
Where Sydney’s migration is being directed......................................................................................................................................................................................................................................18
Recommendation 4: Inclusionary zoning must be mandatory 46
Since 2007, Sydney’s population growth has been concentrated to a few areas.....................................................................................................19 The ‘Communities Plus’ Program is just one of many solutions required ..................................................................................................................................47
Sydney’s population density is unevenly distributed .........................................................................................................................................................................................................21 Case Study: The UK market is investing in affordable homes ........................................................................................................................................................................47
A tale of two cities: Comparing economic resources across Sydney................................................................................................................................................22 Case Study: Inclusionary planning in the USA...............................................................................................................................................................................................................................47
Better planning is needed to correct course......................................................................................................................................................................................................................................24 Case Study: South Australia’s affordable housing target.........................................................................................................................................................................................48
Mandating inclusive zoning on new developments would increase affordable housing stock......................................................48
Recommendation 1: Major development projects must be paired to
Inclusionary zoning must be at the heart of future developments ........................................................................................................................................................48
major infrastructure projects and timelines 26
Sydney’s congestion woes ...................................................................................................................................................................................................................................................................................................27 Recommendation 5: The Affordable Rental Housing Act (2009)
The car remains king..........................................................................................................................................................................................................................................................................................................................27 must be amended to encourage lengthier affordable housing tenures
Sydney’s congestion is getting worse, and travel times slower.....................................................................................................................................................................30
beyond the 10 years required in the act 50
Congestion will cost Sydney $12.6 billion in 2030....................................................................................................................................................................................................................31 The Affordable Rental Housing Act has room for improvement ...............................................................................................................................................................51
Large infrastructure pipeline, but few projects near completion................................................................................................................................................................32
Spending on roads has always outweighed rail in Sydney in New South Wales ........................................................................................................34
Recommendation 6: The NSW Government needs to invest in major build-to-rent
schemes and affordable housing projects in low-density Sydney precincts
A more symbiotic relationship between development and infrastructure planning is needed......................................................35
that have demonstrated consistently low population growth 52
Recommendation 2: The Greater Sydney Commission’s housing targets must be Accommodating key workers is vital ................................................................................................................................................................................................................................................................53
revised to encourage urban intensification projects in the South and North 36
Affordable housing benefits the entire community.............................................................................................................................................................................................................54
Greater Sydney Commission housing targets unevenly spread load................................................................................................................................................37 Greater Sydney Commission’s affordable housing targets should be expanded......................................................................................................54
High density does not mean lower livability........................................................................................................................................................................................................................................40 The NSW Government has a key role to play in major build-to-rent and affordable housing projects .........................55
The GSC’s housing targets should be amended to distribute population more evenly
across Greater Sydney ...................................................................................................................................................................................................................................................................................................................41
THE
McKellte
Institu
6                    T H E              M C K E L L                        I N S T I T U T E                                                                                                                                                                                             Sharing
                                                                                                                                                                                                                                                                                            Eventhe
                                                                                                                                                                                                                                                                                                 Growth
                                                                                                                                                                                                                                                                                                    Load Planning for a Growing Sydney 7

Contents                                                                                              CONTINUED

Recommendation 7: The NSW Government must implement
a ‘liveability compact’ with the people of Sydney, ensuring future
growth plans embed measurable liveability targets                                                                                                                                                                                                                            56

Beyond ‘Transit Oriented Development’: Liveability for all must be a central policy goal..................................... 56

International growth strategies often formalise livability targets............................................................................................................................ 56

The benefits and burdens of a global city must be fairly distributed ............................................................................................................ 56

Exclusionary zoning can exacerbate intra-city inequality..................................................................................................................................................... 58

Avoiding ‘opportunity hoarding .............................................................................................................................................................................................................................................. 59

Towards a liveability compact ..................................................................................................................................................................................................................................................... 59

Conclusion                                                                                                                                                                                                                                                                   60
References                                                                                                                                                                                                                                                                   62

                                                                                                                                                                                                                                                                                                                              THE
                                                                                                                                                                                                                                                                                                                              McKellte
                                                                                                                                                                                                                                                                                                                              Institu
8 T H E M C K E L L I N S T I T U T E Even Growth Planning for a Growing Sydney 9
Executive Summary Foreword
Sydney is Australia’s economic and cultural heart. 5.1 million people, or around Sydney’s population will continue to grow throughout this century, reaching up to 9 million
one-fifth of the national population call Sydney home, and enjoy a living standard people by 2060. While the growth poses a challenge for Sydney’s decision makers, it’s also
that – despite all the city’s challenges – remains high by global standards. an opportunity to better distribute the population across the Greater Sydney region.
in the north and east appear to have latent and
By mid-century, Sydney will likely be home to more than 8 million people. This considerable population
underutilised capacity for additional housing and
growth presents an enormous opportunity for Sydney, but comes with an obvious question: how will the
density.” This demonstrates a planning failure, and
city cater for an extra 3 million residents?
must be corrected as Sydney continues to grow.
This report examines Sydney’s population growth, before offering seven recommendations for managing A more equitable city with a fairer distribution
Sydney’s growth in an equitable and sustainable way. of population growth is good for everyone. It
allows key workers – like nurses, emergency
First, it recommends major development projects be paired with major infrastructure projects where
services, teachers, and social workers – to live in
possible. For too long, Sydney has seen population growth outstrip vital services. Before major
Dr craig emerson Sam Crosby the communities they service. It minimizes social
developments are approved, an evaluation of existing and planned infrastructure must be undertaken. chair, CEO,
McKell INSTITUTE exclusion and ‘opportunity hoarding’, which stops
Institute McKell INSTITUTE
Second, this report argues for a re-design of the Greater Sydney Commission’s housing targets. certain sections of society from getting ahead
Currently the Commission’s plan orients future growth towards existing high-growth areas, while lower while allowing others to thrive. It can reduce
growth, lower density regions are expected to see fewer developments. This should be amended to Sydney’s population growth has not been lengthy commutes. Ultimately, a better planned
correct the imbalance.
McKell managed as equitably as it could have been. It is
a city where services are strained, housing is out
city adds to the dynamism and liveability of
Sydney.
Third, it is argued that the Medium Density Code be revised. In its current form, the code allows for of reach, even for those on average incomes, and
TH
urban intensification in existing high-growth LGAs while lower-growth LGAs effectively opt-out. This The consequences of inaction are significant.
E urban intensification is felt most acutely in lower-
should be addressed to facilitate more even urban intensification across Sydney. Without change, Sydney risks losing its egalitarian
income areas.
appeal – to become a city of haves and have nots.
Fourth, it is recommended that Inclusionary Planning is made mandatory. Many projects demonstrate Western Sydney, in particular, has seen a Too often, migration becomes a scapegoat for the
inclusive planning, which sees major developments include affordable housing options. Often, however, disproportionate rate of growth. Over the past challenges Sydney is facing. Without action, the
inclusionary planning is voluntary. Mandating inclusionary planning would likely increase affordable decade the Central and Western planning districts politically convenient response to poor planning is
housing stock across Sydney. have seen their populations grow by 26 and 23 per to argue for less migration – a decision that would
cent, while the North and South planning districts ultimately undermine Australia’s living standards,
Fifth, this report recommends revising the Affordable Rental Housing Act (2009). Currently the Act
have grown by just 15 and 13 per cent, respectively. and ensure low-growth jurisdictions outside of
permits LGAs to opt out of higher density development. Further, developments under the Act require
When looking at specific Local Government Areas, Sydney don’t receive the residents they need.
the inclusion of affordable housing stock for only a 10 year period. This should be extended to increase
differences in growth rates are even more acute:
the availability of affordable housing stock. The NSW Government has to make a choice
Camden in Sydney’s west has grown by 40 per cent
between doubling down on a growth model that
Sixth, this report argues for an increase in Government investment in affordable housing stock and since 2007. Sutherland Shire, the slowest growing
has seen Sydney become a more difficult and
build-to-rent initiatives, particularly in low-density areas in the South and North Planning districts. LGA, has grown by just 6 per cent in that time.
less fair place to live and raise a family, or correct
The uneven distribution of a growing population course to ensure the Sydney of tomorrow is
And finally, it is recommended that the NSW Government develop a ‘liveability compact’ for Sydney.
has created a divided city. The Committee for liveable for every one of its residents.
Creating a liveable city requires more than just pairing infrastructure with population growth. The NSW
Sydney argues “Sydney remains divided along
Government should work towards the creation of a compact that allows a range of key determinants to
geographical lines […] the North West and South-
be tracked and monitored, with the intent to create a fairer, more liveable and more prosperous Sydney.
West Growth Areas on the urban fringe are
experiencing significant growth while other areas
THE
McKellte
Institu
10   T H E   M C K E L L   I N S T I T U T E                                          Even Growth Planning for a Growing Sydney 11

                                               The Nature of Sydney’s
                                               Population Growth
                                               FIGURE 1: SYDNEY’S FORECAST POPULATION GROWTH.

                                               10 000 000

                                                9 000 000

                                                8 000 000

                                                7 000 000

                                                6 000 000

                                                5 000 000
                                                            2018   2021    2024 2027 2030 2033 2036 2039 2042 2045 2048

                                                                    High Estimate            Medium Estimate              Low Estimate

                                                                                                                          Source: ABS Cat. 3222.0

                                               Sydney has been one of Australia’s fastest growing cities for decades. Though Sydney remains
                                               a city of profound opportunity, its capacity to share the challenges of growth throughout the
                                               metropolitan area is uncertain. Despite record investment in infrastructure, Sydney has failed
                                               to fairly distribute a growing population, while proactively providing those populations with
                                               adequate infrastructure that maintains liveability.

                                                                                                                                  THE
                                                                                                                                   McKellte
                                                                                                                                   Institu
12 T H E M C K E L L I N S T I T U T E Even Growth Planning for a Growing Sydney 13
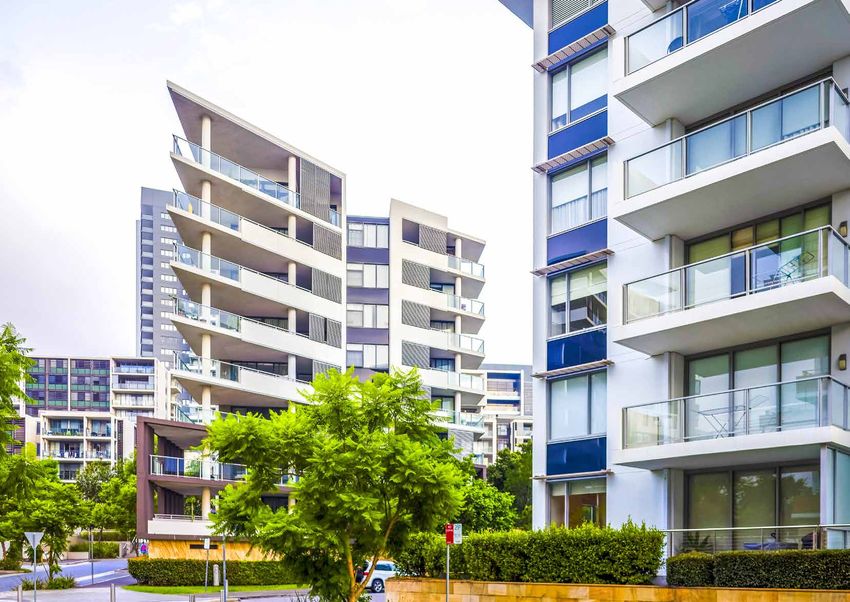
Where Sydney’s population is today
Sydney is Australia’s biggest city, but by international standards its density is modest, particularly in its
north. While Manly, Hornsby, and Chatswood all feature high density there are considerable expanses within
Sydney’s inner-north that remain low density, despite their proximity to the CBD.
The below figures present a visual representation of Sydney’s population density, with data sourced in 2015.
The higher and darker the green bar, the higher the population living within that location. Viewing Sydney
from the northeast, looking southwest, a stark contrast between the southern and northern sides of the
harbour and Parramatta River can be observed.
FIGURE 2:
SYDNEY POPULATION DENSITY, 2015. VIEWED FROM THE NORTHEAST, LOOKING SOUTHWEST.
FIGURE 3:
SYDNEY POPULATION DENSITY, 2015. VIEWED FROM THE NORTHWEST, LOOKING SOUTHEAST.
Source: Daniels, M. Human Terrain: Visualising the World’s Population in 3D. Accessed at pudding.cool/2018/10/city_3d/
Source: Daniels, M. Human Terrain: Visualising the World’s Population in 3D. Accessed at pudding.cool/2018/10/city_3d/
THE
McKellte
Institu
14       T H E   M C K E L L    I N S T I T U T E                                                                                                                                         Even Growth Planning for a Growing Sydney 15

Visualising population growth from 1990-2015                                                                             FIGURE 5:
                                                                                                                         SYDNEY POPULATION GROWTH, 1990 TO 2015. THE GREEN TOWERS REPRESENT GROWTH OVER
                                                                                                                         THAT PERIOD, WHERE THE REDDER TOWERS REPRESENT A REDUCTION IN POPULATION. VIEWED
The following two figures depict population growth from 1990 to 2015. The taller and greener a bar, the higher           FROM SYDNEY’S NORTHWEST, LOOKING SOUTHEAST TOWARDS THE SYDNEY CBD.
the rate of population growth. The taller and redder a bar, the more a local population has declined. Again,
it is clear that certain areas of Sydney are experiencing a considerable degree of population growth when
compared with others.

FIGURE 4:
SYDNEY POPULATION GROWTH, 1990 TO 2015. THE GREEN TOWERS REPRESENT GROWTH OVER
THAT PERIOD, WHERE THE RED TOWERS REPRESENT A REDUCTION IN POPULATION. VIEWED FROM
SYDNEY’S EAST, LOOKING WEST.

                                                                                                                         Source: Daniels, M. Human Terrain: Visualising the World’s Population in 3D. Accessed at pudding.cool/2018/10/city_3d/.1

                                                                                                                         Sydney’s population growth is largely                                    borne the brunt of population growth over the
                                                                                                                         concentrated in a few areas and key growth                               past three decades. While there are few areas
                                                                                                                         corridors. Figure 4 represents Sydney’s                                  that have seen stagnant or negative population
                                                                                                                         population growth since 1990, looking at the city                        growth, there are many areas – even areas within
                                                                                                                         from due east. From this broad perspective, it’s                         proximity to the CBD – that have experienced
                                                                                                                         clear that population growth within the Sydney                           a slow growth trajectory over the past three
                                                                                                                         metropolitan area has been unevenly distributed.                         decades.
Source: Daniels, M. Human Terrain: Visualising the World’s Population in 3D. Accessed at pudding.cool/2018/10/city_3d/   It is evident certain areas within Sydney have

                                                                                                                                                                                                                                                THE
                                                                                                                                                                                                                                                McKellte
                                                                                                                                                                                                                                                Institu
16      T H E    M C K E L L    I N S T I T U T E                                                                         Even Growth Planning for a Growing Sydney 17

FIGURE 6:
SYDNEY POPULATION GROWTH, 1990 TO 2015. THE GREEN TOWERS REPRESENT GROWTH OVER
THAT PERIOD, WHERE THE RED TOWERS REPRESENT A REDUCTION IN POPULATION. VIEWED FROM
SYDNEY’S EAST, LOOKING WEST.

Source: Daniels, M. Human Terrain: Visualising the World’s Population in 3D. Accessed at pudding.cool/2018/10/city_3d/

One such area is in Sydney’s northern suburbs.                          There is no expectation that population would
Figure 5 offers a more granular view of                                 be evenly distributed across every location
population density in northern Sydney. With                             within Sydney. The prevalence of water ways and
the exceptions of the Manly area, Hornsby,                              varying gradients makes Sydney’s geography
Chatswood, and small pockets in the Northern                            complex. Populations tend to concentrate around
Beaches, particularly around Dee Why. The                               transport corridors, and close to employment
suburbs northwest and north of Chatswood,                               and educational facilities. Sydney’s population
such as Forestville, Frenchs Forest, Killara, West                      growth requires more than 36,000 new dwellings
Pymble and Pymble succinctly demonstrate                                annually. There are areas within Sydney’s north
examples of low growth areas within close                               that could embrace increased population density
proximity to the Sydney CBD.                                            to ensure essential services in existing growth
                                                                        centres are not further strained.

                                                                                                                                                            THE
                                                                                                                                                            McKellte
                                                                                                                                                            Institu
18 T H E M C K E L L I N S T I T U T E Even Growth Planning for a Growing Sydney 19
Where Sydney’s migration is being directed Since 2007, Sydney’s population growth has been concentrated to a few areas
Natural population growth, internal Australian migration, and immigration from abroad all help fuel Sydney’s The below figure demonstrates the unequal rate of growth between 2007-2017 in Sydney LGAs. Camden saw
growth. Much of this growth is poorly distributed across the broader Sydney metropolitan area. Certain LGAs a 40 per cent growth in population, with Sutherland Shire experience just 6 per cent.
are receiving far more migrants than others. Sydney LGA and Parramatta LGA received the most migrants in
2018, with Woolhara, Camden, Willoughby, and Kuringai councils taking the fewest.
FIGURE 8: SYDNEY LGAS BY POPULATION GROWTH, 2007-2017.
Population growth benefits communities. However, when observing migration within Sydney, it is evident that
the vast majority are locating themselves in the Sydney LGA and the western growth corridor, which includes LOCAL PLANNING 2007 2017 REAL PERCENTAGE
the Canterbury-Bankstown LGA, Parramatta LGA, Cumberland LGA, and Blacktown LGA. GOVERNMENT
AREA DISTRICT POPULATION POPULATION GROWTH GROWTH
Camden Western 52,178 87,250 35,072 40.19
FIGURE 7: MIGRATION HOT SPOTS IN SYDNEY (LGA) – 2018.
Sydney Eastern 169,056 233,217 64,161 27.51
Canada Bay Eastern 70,196 93,858 23,662 25.21
Parramatta Central 185,175 243,464 58,289 23.94
Strathfield Eastern 34,219 43,585 9,366 21.48
Liverpool Western 172,875 217,736 44,861 20.60
Bayside Eastern 135,831 170,279 34,448 20.23
Blacktown Central 284,925 356,859 71,934 20.15
Cumberland Central 185,224 231,604 46,380 20.02
Hornsby
(A) Lane Cove North 31,678 38,782 7,104 18.31
The Hills Ryde North 102,453 124,798 22,345 17.90
Shire
(A) The Hills Shire Central 138,034 167,296 29,262 17.49
Northern
Beaches Randwick Eastern 128,229 151,993 23,764 15.63
(A)
Ku-ring-gai North 105,551 124,898 19,347 15.49
Blacktown Ku-ring-gai
(C) (A) Georges River South 132,751 156,440 23,689 15.14
Penrith
Willoughby North 67,809 79,574 11,765 14.78
(C)
Parramatta Ryde Willoughby North Sydney North 62,476 73,077 10,601 14.50
(C) (C) (C)
Canterbury-Bankstown South 316,155 367,519 51,364 13.97
Fairfield Penrith Western 177,280 204,785 27,505 13.43
(C) Woollahra
Inner Inner West Eastern 170,481 195,113 24,632 12.62
West (A)
Liverpool (A) Northern Beaches North 237,084 269,378 32,294 11.98
Canterbury-
(C) Bankstown
Randwick Waverley Eastern 65,279 73,176 7,897 10.79
(A) Rockdale
(C) (C) Campbelltown Western 147,159 164,273 17,114 10.41
Camden Fairfield Western 187,872 209,107 21,235 10.15
(A)
Woollahra Eastern 53,564 58,883 5,319 9.03
Sutherland Mosman North 27,900 30,465 2,565 8.41
Shire
Hornsby North 137,694 149,242 11,548 7.73
Campbelltown (A)
(C) Hunters Hill North 13,716 14,716 1,000 6.79
Sutherland Shire South 213,161 227,073 13,912 6.12
Source: ABS Cat. 3218.0
THE
McKellte
Institu20 T H E M C K E L L I N S T I T U T E Even Growth Planning for a Growing Sydney 21
FIGURE 9: 10 YEAR POPULATION GROWTH BY PLANNING DISTRICT. Sydney’s population density is unevenly distributed
PLANNING 2007 2017 REAL FIGURE 10: SYDNEY LGAS BY POPULATION DENSITY (2017).
% GROWTH
DISTRICT POPULATION POPULATION GROWTH
LGA PEOPLE PER SQUARE KM LGA PEOPLE PER SQUARE KM
Central 793,358 999,223 205865 25.95
Sydney 8720.7 Strathfield 3113.0
Eastern 826,855 1,020,104 193249 23.37 Waverley 7825.7 Ryde 3083.4
North Sydney 6969.2 Parramatta 2904.3
Western 737,364 883,151 145787 19.77
Inner West 5516.1 Hunters Hill 2574.1
Burwood 5495.4 Fairfield 2060.0
North 786,361 904,930 118569 15.08
Woollahra 4796.0 Blacktown 1486.6
South 662,067 751,032 88965 13.44 Canada Bay 4711.0 Ku-ring-gai 1462.3
Randwick 4183.6 Northern Beaches 1059.7
Source: ABS Cat. 3218.0
Georges River 4082.6 Liverpool 712.2
Lane Cove 3700.8 Sutherland Shire 680.7
When translated to rates of population growth within the Sydney’s current planning districts, it’s clear that Willoughby 3548.3 Campbelltown 526.7
growth in the Central, Western and Eastern districts has far outpaced that in the North and South planning Mosman 3521.8 Penrith 506.0
districts. The Central district, which encompasses Sydney's geographic centre including Parramatta,
Bayside 3413.1 Camden 434.0
Blacktown, Campbelltown, and the Hills District LGAs, has seen the fastest rate of population growth over
Canterbury-Bankstown 3333.1 The Hills Shire 433.2
the past decade, growing by almost 26 per cent. This contrasts with the South planning district – the slowest
growing – which grew by only 13 per cent in the 10 year period assessed. Cumberland 3236.9 Hornsby 328.0
THE
McKellte
Institu22 T H E M C K E L L I N S T I T U T E Even Growth Planning for a Growing Sydney 23
A tale of two cities: Comparing economic resources across Sydney
FIGURE 11: INDEX OF ECONOMIC RESOURCES RANKING OF SYDNEY LGAS. FIGURE 12:
INDEX OF ECONOMIC RESOURCES, VISUALIZED ACROSS SYDNEY LGAS.
INDEX OF ECONOMIC RESOURCES (ABS 2016) The darker shade of blue represents a higher score on the index, with darker
red representing a greater level of disadvantage.
RANK LGA INDEX SCORE DECILE
1 The Hills Shire 1136 10
2 Ku-ring-gai 1132 10
3 Camden 1104 10
4 Northern Beaches 1095 10
5 Hunters Hill 1093 10
6 Hornsby 1091 10
7 Sutherland Shire 1084 10
8 Bayside 1078 10
9 Mosman 1076 10
Hornsby
10 Lane Cove 1070 10 (A)
The Hills
11 Woollahra 1056 10 Shire
(A)
12 Willoughby 1039 9
Northern
13 Penrith 1022 9 Beaches
(A)
14 Canada Bay 1020 9
15 Waverley 1014 8 Blacktown
(C) Ku-ring-gai
(A)
16 Blacktown 1011 8
17 Ryde 1011 8 Penrith
(C) Parramatta Ryde
(C) (C) Willoughby
18 Liverpool 1008 8 (C)
19 North Sydney 1003 7
Canada
20 Georges River 1000 7 Fairfield Bay
(C) (A)
21 Inner West 994 7 Inner Woollahra
West (A)
22 Parramatta 993 6 Liverpool (A)
Canterbury-
(C) Bankstown
23 Randwick 984 6
(A) Randwick
Rockdale (C)
24 Campbelltown 977 5 (C)
25 Strathfield 976 5
26 Rockdale 974 5 Camden
(A)
27 Botany Bay 968 4
28 Canterbury-Bankstown 956 3
29 Burwood 944 2 Sutherland
Campbelltown Shire
30 Fairfield 943 2 (A)
(C)
31 Cumberland 941 2
32 Sydney 883 1
THE
McKellte
Institu24 T H E M C K E L L I N S T I T U T E Even Growth Planning for a Growing Sydney 25
The ABS Index of Economic Resources (IER)
explores the ‘financial aspects of relative
socio-economic advantage and disadvantage’
nationwide at SA2 levels.2 The data is collected
at the five-year census, the most recent being
in 2016 and published in March, 2018.
The lower the score on the IER, index, the less
access to economic resources an area has. The
ABS states that determinants of a lower score
include a greater proportion of households
with low income, more households paying low
rent and lower rates of home ownership more
broadly. The index is a broader representation
of wealth in Australia, rather than just income.
The index provides a valuable insight into
the financial health of those living in different
LGA’s across the Sydney metropolitan area.
Broadly speaking, Sydney fares better than
other areas within Australia. Eleven LGAs rank
in the top decile of the IER. Most of these
LGAs are situated within the inner-north
and inner-northwest, with the exception of
Sutherland Shire and the Hills Shire. However,
alarmingly, Sydney is also home to 8 LGAs
(9 at the time the census was taken) that
score in the lower 5 deciles. These LGAs
include Parramatta, Randwick, Campbelltown,
Strathfield, Rockdale, Botany Bay, Canterbury-
Bankstown, Burwood, Fairfield, Cumberland
and Sydney. A majority of these LGAs are
situated in Sydney’s west to south-west.
A clear geographic divide is evident when
exploring economic resources across Sydney.
Better planning
is needed to correct course
The mismanagement of Sydney’s population
growth has exacerbated the city’s economic
divide. To correct this course a new approach
that puts fairness, equitable growth and
liveability front and centre is needed.
THE
McKellte
Institu26 T H E M C K E L L I N S T I T U T E Even Growth Planning for a Growing Sydney 27
Sydney’s congestion woes
Sydney now ranks as the 29th most congested city in the world – and there is a real chance this could get
even worse given the expected increase in kilometres travelled on Sydney’s roads. Congestion is an equity
issue, often felt most acutely by those forced to live increasing distances employment hubs. Catering for
future demand requires an understanding of where congestion is worst today, and why.
Recommendation 1:
Major development
FIGURE 13: TOTAL KILOMETRES TRAVELLED ON SYDNEY ROADS,
ALL PASSENGER VEHICLES. 2018 VS 2030 FORECASTS.3
projects must be paired Total Kilometres Travelled on Passenger Vehicles
2018
43.3 Billion
2030
55.57 Billion
to major infrastructure
projects and timelines. The car remains king
On Census day, 2016, 52.7 per cent of Sydney resident travelling to work did in a car they were driving.4 The
BITRE analysis above makes it clear that car travel is likely to dominate for decades to come. While greater
investment in public transport is essential, policymakers need to be cognizant of the staying power of the car,
identify existing choke points in Sydney’s road network, and work towards both easing congestion points,
while orienting new population growth to areas that will alleviate pressure.
KEY POINTS:
Sydney is still dominated by the car, in part
due to a lack of access to efficient public FIGURE 14: HOW PEOPLE TRAVELLED TO WORK ON CENSUS DAY, 2016.5
transport alternatives in relatively high-
density suburban areas. HOW PEOPLE TRAVEL TO WORK, GREATER SYDNEY (2016)
Sydney’s congestion is getting worse, and Car, as driver 1,197,269 52.7
will cost Sydney $12.6 billion by 2030.
Train 247,051 10.9
A majority of infrastructure spending is on
roads, but this hasn’t significantly alleviated Bus 125,503 5.5
congestion.
Worked at home 98,906 4.4
A more symbiotic relationship between
Walked only 91,577 4
development approvals and infrastructure
pipelines needs to be established.
THE
McKellte
Institu28 T H E M C K E L L I N S T I T U T E Even Growth Planning for a Growing Sydney 29
FIGURE 15: PERCENTAGE OF COMMUTERS WHOSE COMMUTE IS
LESS OR GREATER THAN 45 MINUTES, VARIOUS COMMUTING METHODS.6
LESS THAN
GREATER THAN
COMMUTER TYPE OR EQUAL TO
45 MINUTES
45 MINUTES
PER CENT PER CENT
Vehicle driver 87 13
Vehicle passenger 90 10
Train 21 79
Bus 47 53
Ferry 34 66
Taxi 100 0
Walk 96 4
Bicycle 79 21
Other 71 29
Total 77 23
Sydneysiders who don’t drive tend to have longer
commutes, a likely deterrent to commuting on public
transport. In 2013, 79 per cent of those who travelled to
work on train experienced a commute time greater than
45 minutes, as did more than half of bus passengers. Close
to 90 per cent of those who went by car to work , either
as a passenger or driver, enjoyed a commute under 45
minutes. It’s clear why Sydney remains a city where the car
dominates: despite worsening congestion, public transport
remains an unviable option for many commuters. Sydney’s
congestion is felt worst in a few key areas
THE
McKellte
Institu30 T H E M C K E L L I N S T I T U T E Even Growth Planning for a Growing Sydney 31
Sydney’s worst traffic congestion is also where most people work, the CBD and its immediate surrounds. The FIGURE 17:
Grattan Institute’s analysis on Sydney traffic highlights acute traffic issues elsewhere in metropolitan Sydney, SPEEDS AS A PERCENTAGE OF FREE-FLOW SPEED, 2014-2018 – 8 CITY COMPARISON. SYDNEY
particularly in the central growth corridor west of the city. Acute traffic congestion is also evident in the PLACES LAST, AND HAS SEEN A SLOWING OF FREE-FLOW SPEEDS SINCE 2014.10
Northern Beaches, along the A8, and in growth centres in the southwest and northwest metropolitan area.7
101.25
99
FIGURE 16: 96.75
BILLONS OF KILOMETRES TRAVELLED ANNUALLY IN SYDNEY – 2018-2030 PROJECTIONS.
94.5
60
92.25 92.7 92.5
55.57
54.77 90
55
53.94 Sydney Melbourne Brisbane Canberra
53.04 Adelaide Perth Hobart Darwin
52.06
51
49.91
50
48.81 Congestion will cost Sydney $12.6 billion in 2030
47.7
46.56
45.45
44.38 FIGURE 18: AVOIDABLE COSTS OF CONGESTION IN SYDNEY, 2015-2030
45 43.34 12.6
13
11.52 11.9 12.25
11.08
10.12 10.6
9.75 9.14 9.64
40 8.18 8.65
2018 2019 2020 2021 2022 2023 2024 2025 2026 2027 2028 2029 2030 6.89 7.28 7.71
6.12 6.54
6.5
Source: BITRE
3.25
Sydney’s congestion is getting worse, and travel times slower
The perception that congestion in Sydney is is the slowest pace of travel in the country. In 0
getting worse is borne out by data monitoring general Sydneysiders’ commutes are longer, 2015 2016 2017 2018 2019 2020 2021 2022 2023 2024 2025 2026 2027 2028 2029 2030
speeds on Sydney’s roads during peak with the average distance 15.4 kilometres.8 For Source: BITRE
times. Free flow speeds are those that are those working in the city, however, the average
to be expected when a vehicle is travelling commute to work is 18.9 kilometres.9 The
unencumbered by traffic and is a common combination of lengthy commutes, slower travel The congestion caused by the millions of car trips per day in Sydney costs individuals and Sydney’s economy.
measure of congestion. Since 2014, Speeds speeds, and high-percentage of commuters who The Bureau of Infrastructure, Transport and Regional Economics publishes estimates of the ‘avoidable’ social
as a Percentage of Free Flow Speed has typically rely on cars all exacerbate the strains costs of congestion.
been declining in Sydney. Sydney commuters people feel in their everyday lives. In 2018, these costs totaled $7.28 billion in Sydney alone. On current trends, this is expected to reach
typically travel at 92.5 per cent of Free Flow $12.6 billion by 2030. The economic impact of congestion requires action from the state government.
Speeds across the Greater Sydney area. This
THE
McKellte
Institu32 T H E M C K E L L I N S T I T U T E Even Growth Planning for a Growing Sydney 33
Large infrastructure pipeline, but few projects near completion
There remains a discrepancy between those major infrastructure projects that have been completed or
are nearing completion in Sydney’s planning districts, and those that have been announced or planned for.
Futuretransport NSW maps the infrastructure projects that are ‘completed, in progress or planning’ today.
Across the Greater Sydney Area, a total of 328 infrastructure projects are listed in this category. When they’re
broken down into types of projects, the number becomes less significant. There are a total of 16 major rail
projects across the entirety of Sydney, 66 road projects, just three major bus projects, and two light rail projects.
Most of the rail projects are located in the Western City district and Eastern City (CBD and Eastern suburbs)
district. Just one major rail project is to be found in the North District is the region with the least infrastructure
projects ‘completed, in progress or planning’, with just one rail project, seven road projects, one bus project and
zero light rail projects in the district.
FIGURE 19: PROJECTS ‘COMPLETED, IN PROGRESS OR PLANNING’, 2019.11
ALL PROJECTS (INCL FREIGHT, LIGHT
RAIL ROAD BUS
MARITIME, CYCLING & WALKING) RAIL
Western City 108 5 27 0 0
South District 35 0 6 0 0
Eastern City 63 7 8 1 1
North District 44 1 7 1 0
Central City 78 3 18 1 1
TOTALS 328 16 66 3 2
A significant number of major projects have been FIGURE 20: PROJECTS PLANNED FOR COMPLETION
announced and are due for completion in the BY 2040, BUT NOT YET UNDERWAY.12
distant future – some as far away as 2040. Overall,
there are 437 infrastructure projects (NSW ALL INFRASTRUCTURE
Government funded or co-funded) slated to be PROJECTS PLANNED FOR
undertaken across the Greater Sydney region COMPLETION BY 2040
in that period. Again, the bulk of these projects
are forecast to be undertaken in the Western Western City 104
City, Eastern City and Central City planning
South District 78
districts, with the North and South City districts
forecast to have fewer projects. The discrepancy Eastern City 89
between completed, visible projects and those
which are slated for distant delivery exacerbates North District 78
public concerns over whether or not their area
will benefit from the levels of infrastructure Central City 88
investment often touted for leaders.
THE
McKellte
Institu34 T H E M C K E L L I N S T I T U T E Even Growth Planning for a Growing Sydney 35
Spending on roads has always outweighed rail in Sydney in New South Wales Sydney’s train network has been challenged by accommodating almost 40 million more passenger
movements per year. In 2014, there were 282 million passenger movements on Sydney’s train network.
This had risen to 340 million in 2017 – the peak – with 320 million passenger movements recorded in 2018.
That existing infrastructure pipelines favour roads over rail is unsurprising. This follows a consistent trend over
decades in New South Wales. As more Sydneysiders prefer cars as their primary mode of transport, it makes
sense that New South Wales has often seen greater investment in roads than rail. There is a need to close this
gap. Greater investment in rail will help alleviate the pressures on the existing system which is seen by many FIGURE 22:
to be at breaking point, and will help encourage reluctant commuters to opt for the train over taking a car. RISE IN MEDIA COVERAGE OF SYDNEY TRAIN ISSUES, 1998-2018.
Placing incentives on commuters to travel by public transport will only work if the public transport available
to them is efficient, safe and reliable. For many, the frequent delays and perceptions around reliability on 1 000
Sydney’s train network undermines the incentives in place for individuals to make the switch to public 922
transport.
FIGURE 21: 750
COMPARISON BETWEEN COMPLETED INVESTMENT IN RAIL AND ROADS IN NSW, 20 YEAR
TIMESERIES TO 2018.
3 000 000 500
250
2 000 000 167
0
1998 2000 2002 2004 2006 2008 2010 2012 2014 2016 2018
1 000 000
A more symbiotic relationship between
development and infrastructure planning is needed
0
Jan 2000 Jan 2005 Jan 2010 Jan 2015
The challenges facing Sydney’s transport network are clear. The NSW Government should investigate
methods of improving collaborative planning between developers and major infrastructure projects. Under
Rail / Bridges all sectors Roads / Highways all sectors
such a framework, major developments could be staggered to allow for completion in sync with associated
infrastructure and services.
THE
McKellte
Institu36 T H E M C K E L L I N S T I T U T E Even Growth Planning for a Growing Sydney 37
Greater Sydney Commission housing targets unevenly spread load
The Greater Sydney Commission is charged with planning for Sydney’s future. It forecasts that Sydney will
require at least 725,000 new dwellings by 2036 to meet demand. This averages out to figure of 36,250 new
dwellings per year, from 2016. The Greater Sydney Commission has tabled its vision for where Sydney’s new
Recommendation 2: housing stock, and therefore growing population, should be oriented:
Major development FIGURE 23: GREATER SYDNEY COMMISSION HOUSING TARGETS, 2016-2021 AND 2016-2026
projects must be paired
0–5 YEAR HOUSING SUPPLY 20-YEAR STRATEGIC HOUSING
DISTRICT
TARGET: 2016–2021 TARGET: 2016–2036
to major infrastructure Central City
Eastern City
53,500
46,550
207,500
157,500
projects and timelines. North
South
25,950
23,250
92,000
83,500
Western City 39,850 184,500
Greater Sydney 189,100 725,000
KEY POINTS:
Growth has been poorly distributed in Sydney. The fast growing LGA has grown
40 per cent in the last 10 years, with the slowest growing just 6 per cent.
Urban intensification does not necessarily lower liveability. Some of Sydney’s Greater Sydney Commission has argued that, by The growth plans put forward by the Greater
2021, the entirety of Greater Sydney will need Sydney Commission raise questions about the
most liveable suburbs are also some its densest.
189,100 new dwellings constructed. A majority equitable distribution of population growth in
Low growth areas in the South and North planning districts are ideally suited to of these, are expected in three planning districts: Greater Sydney. Of course, as the city continues
greater urban intensification. Central City, Eastern City, and Western City. The to grow, major population centres in the western
North District, for example, is expected to see and southwestern suburbs are expected to grow.
92,000 new dwellings constructed over the However, there are serious questions about the
twenty years from 2036, with the South planning extent to which low-density areas in Sydney are
district expected to see 83,500 new dwellings accomodating the city’s population growth under
constructed. the commission’s plans. While there are certain
Sydney remains divided along geographical lines. In contrast, Central City planning district,
geographic and topographic realities associated
with the North and South planning districts that
The further west and south you travel…the poorer the access to which covers much of Sydney’s central and
limit their carrying capacity, it is clear, as the
north-western suburban areas, is forecast
education and transportation. Meanwhile, the North West and South- to see 207,500 new dwellings built by 2036.
Committee for Sydney has pointed out, that
areas in the north have ‘latent and underutilised
West Growth Areas on the urban fringe are experiencing significant This is around a third of the expected housing
capacity for additional housing and density’.
construction in Greater Sydney in the twenty
growth while other areas in the north and east appear to have latent years until 2036.
and underutilised capacity for additional housing and density.”
– COMMITTEE FOR SYDNEY
THE
McKellte
Institu38 T H E M C K E L L I N S T I T U T E Even Growth Planning for a Growing Sydney 39
FIGURE 24: FIGURE 25:
GREATER SYDNEY COMMISSION HOUSING FORECASTS, SYDNEY PLANNING DISTRICTS, URBAN LIVING INDEX RATINGS ACROSS SYDNEY’S 6 PLANNING AREAS. NORTH, SOUTH AND
0-5 YEARS AND 20 YEAR FORECASTS. CENTRAL FAIR HIGHLY, WHILE WEST AND SOUTH WEST SCORE LOWER.13
THE
McKellte
Institu40 T H E M C K E L L I N S T I T U T E Even Growth Planning for a Growing Sydney 41
The regions slated to house the bulk of Sydney’s population growth often rank lower on a range of liveability Some communities may be reluctant to see a push towards high density. But data demonstrates that high-
scores. The Urban Living Index above visualises how urban areas in the North, East and South planning districts density does not necessarily translate into lower liveability itself. The Urban Liveability Index states that:
score far higher when it comes to certain variables such as access to essential services, income and wealth.
“The affordability, community, employability, amenity and accessibility of an area all inform the liveability of
an urban environment.”
FIGURE 26: SOME OF SYDNEY’S DENSEST SUBURBS ARE ALSO RATES AMONG ITS MOST LIVEABLE
LIVABILITY PERCENTAGE OF
RANK SUBURB
INDEX SCORE DWELLINGS HIGH DENSITY
1 Crows Nest - Waverton 85 71%
Only three of the top 20 ranking suburbs maintain housing density
1 Surry Hills 85 70%
3 Pyrmont - Ultimo 83 91%
lower than 50 per cent. What makes the communities liveable is the
3 Marrickville 83 40% proximity and access to jobs and services, and the positive community
5 Potts Point - Woolloomooloo 82 92% attributes associated with a denser living environment.“Density is central
5 North Sydney - Lavender Bay 82 78% to making sure that every community can access the things that matter
5 Randwick 82 68%
to it because it is density that supports good local jobs and good
5 Chatswood (East) - Artarmon 82 64%
community services. But crucially, this density must be done well.”14
5 Leichhardt - Annandale 82 25%
10 Neutral Bay - Kirribilli 81 76% – MICHAEL ROSE, COMMITTEE FOR SYDNEY
10 Hornsby - Waitara 81 53%
10 Newtown - Camperdown - Darlington 81 40%
13 Parramatta - Rosehill 80 82%
13 Darlinghurst 80 76%
13 Waterloo - Beaconsfield 80 75%
The GSC’s housing targets should be amended
13 Manly - Fairlight 80 70%
to distribute population more evenly across Greater Sydney
13 Redfern - Chippendale 80 69%
The Greater Sydney Commission’s housing targets risk exacerbating existing population pressures on certain
13 Erskineville - Alexandria 80 56%
areas within Greater Sydney, while limiting the amount of development and population growth in low-density,
19 Double Bay - Bellevue Hill 79 71%
low-growth areas. These targets must be addressed to permit a more equitable distribution of a growing
19 Bondi - Tamarama - Bronte 79 67% population across greater Sydney.
Source: ABS Cat. 3218.0
THE
McKellte
Institu42 T H E M C K E L L I N S T I T U T E Even Growth Planning for a Growing Sydney 43
Recommendation 3:
Planning for, and enacting, medium Medium density is a central component to
accommodating a growing Sydney. The mistakes
density has been poor
around the enactment of the medium density
The Medium Density
code, however, provide a cautionary tale for
Medium density housing is often referred to as future reform efforts. From the outset, the plan
the ‘missing middle’ in urban planning. Sydney’s saw medium density to be concentrated in areas
Code must be reformed,
housing stock is characterised by detached already growing too fast, namely in Sydney’s
dwellings and apartments, with fewer new west. This allowed lower-density communities
developments focusing on this third option. to avoid seeing medium density developments
distributing medium
Embracing medium density development, approved in their communities. Future medium
particularly in existing low-growth and low- density plans must orient developments towards
density areas, is vital to fairly accommodate for lower density communities, and ensure that the
density development to
growth in Sydney. And while legislation has been community is adequately briefed about the vital
passed that facilitates the uptake of medium infrastructure and services that will accompany
density, but so far it has been shelved, with only the proposed development.
low-density, low-growth
council areas that already permit medium-density
development.
Medium-density works, but must be
The Low Rise Medium Density Code was passed
areas in proximity to major in April 2018,15 and commenced in a limited form
distributed fairly
in New South Wales in July 2018. However, in May
2018, the NSW Planning Minister announced a The Medium Density Code as it currently stands
employment hubs. deferment for 50 councils, permitting them to
not comply with the new code. The code aimed
to provide fast-track approvals for ‘missing
middle’ medium density developments delivering
has not fairly distributed medium density
development across Greater Sydney. The code
must be amended to allow for the benefits and
challenges associated with urban intensification
‘terraces, one and two story dual occupancies, to be more equitably distributed across Sydney.
and manor houses’.16 There were problems
with the code, however – perhaps none more
so than the fact that council areas that already
KEY POINTS: prohibited medium density development would
not be forced to comply with it.17 There was also
The Medium Density Code was poorly rolled little tangible infrastructure or service provision
out, and has left some areas of Sydney prone plans attached to the code, which exacerbated
to more urban intensification than others. community concerns over the proposal,
and inevitably led to the Local Government
The Medium Density Code must be re-written Association of New South Wales successfully
in a way that doesn’t enable some LGAs to lobby the Planning Minister to ‘take a breath’ on
avoid urban intensification. the plan.18
Poorly distributed medium density
development may exacerbate existing
congestion issues.
THE
McKellte
Institu44 T H E M C K E L L I N S T I T U T E Even Growth Planning for a Growing Sydney 45
THE
McKellte
Institu46 T H E M C K E L L I N S T I T U T E Even Growth Planning for a Growing Sydney 47
Inclusive zoning is a central weapon in Governments’ arsenal to combat inequities in a city. In effect, inclusive
zoning links the development of affordable housing with that of regular market-rate housing projects. Often,
inclusive zoning sees affordable housing stock mandated as part of a development. In Sydney, however,
inclusive zoning tends to be voluntary. Some programs exist, but the growth in affordable housing stock
remains low.
Recommendation 4: The ‘Communities Plus’ Program is just one of many solutions required
Inclusionary zoning One major initiative of the New South Wales’ government’s affordable and social housing policy is the
Communities Plus program.20 Communities Plus dubs itself as an ‘innovative approach to social housing’,
must be mandatory. with its seven existing projects typically demonstrating public-private partnership style investments in
‘integrated communities’. There has been concern from many that major Communities Plus projects, like that
in Waterloo announced in January 2019, result in public land being converted into for-profit development.
The Waterloo project will see 6800 homes build in a small geographic area around half the size of the Green
Square development, with around 25-30 per cent of floor space reserved for affordable and social housing.21
Communities Plus is a start, but bigger projects are likely required in more diverse regions for to meet
demand.
Case Study Case Study
KEY POINTS: The UK market is investing Inclusionary planning
Voluntary inclusionary, or inclusive, zoning schemes in affordable homes in the USA
are proven to be ineffective in addressing housing
In the UK, ‘Key Worker Living’ is a In the US, direct methods to deliver
affordability needs in Sydney.
government funded scheme that homes to people on low and moderate
Exclusionary zoning can exacerbate intra-city inequality, helps key workers in London, the incomes known as ‘inclusionary planning’
and should be avoided. South East and East of England to are widespread requiring developers
Mandating inclusive zoning will help grow the stock of buy or rent a home at an affordable to dedicate completed dwellings and/
affordable housing. price and has plans to build over
22
or make a financial contribution towards
50,000 new homes over the next affordable housing as part of their
decade. The British government has development approval process.24 There
partnered with housing associations are now over 500 inclusionary planning
to meet the challenges that come schemes operating in municipalities across
“Although social housing supply and renewal with a growing population and the the US providing homes to a vast number
is being addressed through programs such as Australian government must do the of people. In San Francisco where the
same. In England and Scotland, it population is approximately 850,000,
Communities Plus and the Social and Affordable
is expected that 20-40 percent of around 150-250 affordable units are
Housing Fund, delivery needs to be accelerated to new housing developments will be constructed every year. This accounts for
cope with the growing waiting list.”19 affordable. 23
12 percent of the city’s total supply.25
– GREATER SYDNEY COMMISSION
THE
McKellte
Institu48 T H E M C K E L L I N S T I T U T E Even Growth Planning for a Growing Sydney 49
Case Study
South Australia’s affordable housing target
South Australia has already started inclusionary planning and its target announced in 2005
aims for 15 percent of significant new housing developments to be affordable.26 By 2016,
over 2000 affordable homes had been constructed with close to 4000 new ones being
committed accounting in total for 17 per cent of new housing supply in South Australia. It is
time for Sydney to follow suit and deliver affordable rental housing to its residents.
In NSW, an inclusionary zoning scheme pilot was introduced to Pyrmont and Ultimo
in the mid 1990s which required developers to dedicate 0.8 to 3 per cent of the floor
area of developments for affordable housing, or that a monetary contribution be
made in lieu of direct affordable housing provision.27 However, to date, the NSW state
government and many in the development sector have favoured voluntary mechanisms
over compulsory ones to supply affordable rental housing and so far, only about 1,300
dwellings (0.5 to 1 per cent) of Sydney’s housing supply between 2009 and 2017 have
been supplied this way. It is time for the government to make affordable housing a
priority and partner with the housing sector and other community organisations to
deliver non-negotiable housing outcomes.
Mandating inclusive zoning on Inclusionary zoning must be at the
new developments would increase heart of future developments
affordable housing stock
The virtues of inclusionary zoning are manifest.
Sydney is Australia’s socio-economic capital To ensure there is an increase in affordable
recognised nationally and internationally for its and social house stock across all five planning
vibrant contribution to the nation. It is critical districts in Sydney, the NSW Government must
that the city maintain and strengthen its diverse explore ways of mandating inclusive zoning on
workforce that drives the economy and affords major projects.
the opportunity for people on low and moderate
incomes to access appropriately priced housing
options in order for them to contribute to their
employment sectors to the best of their ability.
A lack in affordable housing options can result in
a vast social and economic polarisation that will
reduce social welfare and undermine the notion
of the fair-go that this nation has prided itself
on for decades. By mandating inclusive zoning
across the city, more affordable housing stock
would be available across Greater Sydney.
THE
McKellte
InstituYou can also read