India's housing vacancy paradox: How rent control and weak contract enforcement produce unoccupied units and a housing shortage at the same time
←
→
Page content transcription
If your browser does not render page correctly, please read the page content below
India’s housing vacancy paradox: How rent control
  and weak contract enforcement produce unoccupied
       units and a housing shortage at the same time∗

      Sahil Gandhi†1,2 , Richard K. Green‡2 , and Shaonlee Patranabis§1

                                          1
                                              CSEP, India
                               2 University   of Southern California

                                        June 25, 2021
                                              Abstract

          One housing paradox in many markets is the simultaneous presence of high costs
      and high vacancy. India has expensive housing relative to incomes and an urban
      housing vacancy rate of 12.4%. We look at two possible explanations for vacancy –
      pro-tenant rent control laws, and poor contract enforcement. We use public goods
      as a placebo test. Using a two-way linear fixed effects panel regression, we exploit
      changes in rent control laws in the states of West Bengal, Karnataka, Gujarat, and
      Maharashtra to find that pro-tenant laws are positively related to vacancy rates.
      A pro-landlord policy change liberalizing rent adjustments reduces vacancy by 2.8
      to 3.1 percentage points. Contract enforcement measured by density of judges is
      negatively related to vacancy. Provision of public goods and amenities tend to raise
      vacancy. This is consistent with property owners tending to be reluctant to rent
      out their properties in more desirable areas. We estimate that a policy change in
      rent control laws would have a net welfare benefit and could reduce India’s housing
      shortage by 7.5%.

JEL Classification: P48, R31, R38
Keywords: Vacant Housing, Rental Markets, India
  ∗
     The authors would like to thank Brent Ambrose, Jan Brueckner, Shubhogato Dasgupta, Arnab
Dutta, Edward Glaeser, Arpit Gupta, Christian Hilber, Hue-Tam Jamme, Matthew Kahn, Rajat Koc-
char, Somik Lall, Jeffrey Lin, Rakesh Mohan, Anthony O’Sullivan, Abhay Pethe, Kala Sridhar, Alex
Tabarrok, and Vaidehi Tandel for their comments and suggestions. Sahil Gandhi was a post doctoral
scholar at USC at the time of writing this paper. Authors benefited from comments at seminar at
Brookings Institution India Center. Funding support for this paper was provided by Omidyar Network
to CSEP India (formerly Brookings Institution India Center).
   †
     sahil.gandhi1@gmail.com
   ‡
     richarkg@price.usc.edu
   §
     spspatranabis@gmail.com

                                                  1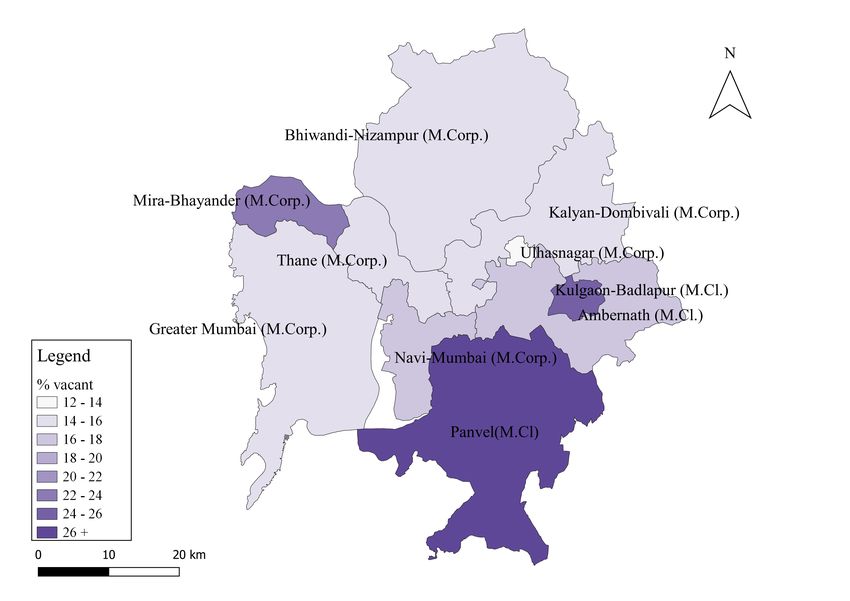
1       Introduction

With cities around the world facing severe housing shortages, the issue of vacant housing
– the apparent opposite of a shortage – has gained prominence, having been covered
extensively by the media.1 Cities such as Washington D.C. and Vancouver have started
taxing vacant houses in order to encourage owners to bring the units back into the market.
Academic literature on reasons for vacant housing has looked at the impact of govern-
ment housing finance (Monkkonen, 2019; Reyes, 2020), inequality (Zhang et al., 2016),
restrictive regulations (Cheshire et al., 2018), and investments in housing for speculative
purposes (Struyk, 1988). The phenomenon of a large number of vacant houses in India
has also been in the news.2 Vacancy is one of a number of serious problems in the Indian
housing market – including a housing shortage that is in the millions3 and a vast number
of households living in slums.
    India is the second largest country by population in the world, and as such makes a
compelling case for the study of vacancy in a high cost country.4 The Census of India
(2011) reports that 11.1 million units, forming approximately 12.4% of the total urban
housing stock, are vacant. By contrast, the Indian Census reported 1.8 million vacant
houses or a vacancy rate of around 9% in 1971 (see fig. 1). Simultaneously, the rental
sector’s share of the occupied residential stock declined significantly (Tandel et al., 2016).
This is attributed to strict rent control laws in India that make it difficult to revise rents
and evict tenants (see Glaeser, 2021). We will argue that a series of laws in India, laws
which are also found in other countries, have led some owners of properties to prefer
keeping units vacant to renting them out. These laws thus lead to the simultaneous
reduction in housing units available for rent and an increase in vacancy of housing units.
We show that the repeal of such laws could lead to more rental units and lower vacancy.
We also argue that weak contract enforcement, a feature of many developing countries,
    1
      See Badger (2017) in the New York Times; Allen (2014) in the Financial Times; Economist (2019).
    2
      See Kaul (2015) in BBC; Chandran (2018) in Reuters; Siwach (2018) in The Times of India.
    3
      As per Ministry of Housing and Urban Poverty Alleviation, Government of India (2012) the housing
shortage in Indian cities is estimated to be at around 18.8 million units.
    4
      For instance, relative to income, Mumbai has the ninth highest house prices in the world (Numbeo,
2021).

                                                  2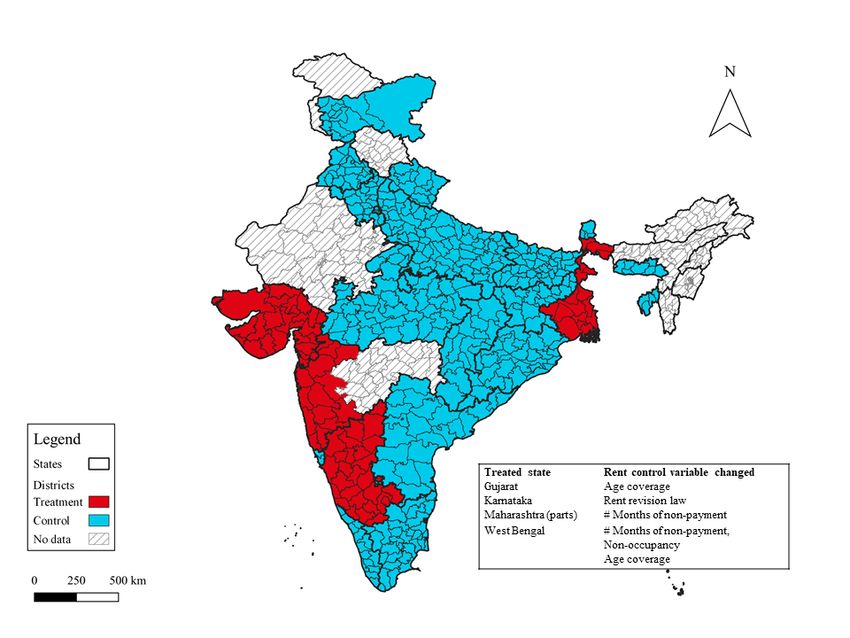
adversely affects housing markets.5 As such, India provides an object lesson for other
countries.
    The Economic Survey of India of 2017-18 (Ministry of Finance, Government of India,
2018) was the first time that policymakers highlighted some of the issues related to vacant
housing.6 The high share of vacant housing is a symptom of larger inefficiencies in the
market and, at the same time, an opportunity to increase housing supply. Given that
India is the country that will see the largest increase in urban population by 2050 (United
Nations, 2018), studying vacant housing and creating policies to address this issue require
urgent attention. There has been scarce academic research on vacant housing in India.
This paper aims to fill this lacuna.
    The paper focuses on intentional vacancies in India, i.e., a strategic decision by land-
lords to keep housing vacant. It explores two potential reasons for this, pro-tenant rent
control laws and weak contract enforcement. We also run a test where we use provision
of public goods as a placebo
    The negative impact of hard rent control on housing markets is well documented in
the literature (see Arnott 1988, Arnott 1995) but there are very few papers (Gabriel
and Nothaft, 2001; Segú, 2020), to our knowledge, documenting its possible impact on
housing vacancy. We exploit changes in the rent control laws in the states of West Bengal,
Karnataka, Gujarat, and Maharashtra for our study. We define the treated group as the
districts in the states where the rent control laws changed and the control group where
there were no changes. We use a two-way linear fixed effects panel regression design to
establish a relationship between pro-tenant rent control laws and vacancy rates in districts
between 2001 and 2011. Our results show that a pro-landlord policy move that relaxes
rent revisions reduces housing vacancy by 2.8 to 3.1 percentage points and leads to a net
welfare gain. Such a move, we estimate, would also reduce India’s housing shortage.
    Developing countries often have overstretched judiciary systems which are unable
   5
      Comparing time taken to enforce contracts across 190 countries, Greece is the lowest ranked devel-
oped country, with a rank of 145. India ranks 163. See:
https://www.doingbusiness.org/en/data/exploretopics/enforcing-contracts
    6
      The chapter titled “Industry and Infrastructure” in Volume II of the Economic Survey 2017-18 (see
Ministry of Finance, Government of India, 2018)

                                                   3
to resolve expeditiously contract disputes, including tenant-landlord disputes. We hy-
pothesize that slow-moving judicial systems discourage property owners from renting to
tenants; so far as we know, we are the first to test this hypothesis. As a robustness check,
we test for how vacancy reacts to various placebos – set of public goods and amenities,
including schools, colleges, hospitals, dispensaries, and roads – at the district level using
panel data for two census years – 2001 and 2011. Provision of public goods and amenities
as measured by educational institutions, medical institutions, and roads tend to raise
vacancy. This is consistent with property owners tending to be reluctant to rent out their
properties in more desirable areas.
This paper is divided into the following sections. Section 2 is a broad overview of
the housing market in India, with a focus on rental and vacant housing. Section 3 is an
overview of the relevant literature. Section 4 describes the empirical strategy and data.
Section 5 presents evidence of distortions in housing markets and section 6 presents
results. Section 7 looks at the impact of lack of public goods and amenities on vacant
housing. Section 8 looks at the welfare implications of rent control policy changes and
section 9 concludes.
2 Context
2.1 Formal housing, slums, and tenure choice
Formal housing supply has not kept pace with the growing demand in Indian cities.
This is due to reasons like stringent land use regulations (see Brueckner and Sridhar,
2012; Sridhar, 2010),7 delays in housing construction (Gandhi et al., 2021), and limits
on ownership of private land (Siddiqi, 2013). The unresponsiveness of the formal market
has led to 17.4% of the urban households living in slums in India (Bertaud, 2010).
Renting as a percentage of total units in urban India has declined from 53% in 1971 to
28% in 2011 (see Panel B in fig. 1). In slums and formal housing, according to the Census
7
One prevalent land use regulation in Indian cities is a limit on the floor area ratio allowed. Local
bodies raise considerable revenues by charging for larger floor area ratio allowances (see Gandhi and
Phatak, 2016).
4Figure 1: Percent rental and vacant houses in urban India
Note: Panel A shows the absolute number of vacant housing units in millions in urban India between
1971-2011. Panel B shows the percent rental and vacant housing in urban India during the same time
period.
Source: Authors’ own using Census of India (various years).
Table 1: Tenure of housing by formal and informal (slums) in urban India in 2011
Tenure Number of units (in mil.) % units by type
All Slums Formal All Slums Formal
Ownership 54.5 9.7 44.9 69.2 70.2 68.9
Rented 21.7 3.6 18.1 27.6 26.3 27.8
Any other 2.6 0.5 2.1 3.3 3.5 3.3
Total 78.9 13.8 65.1 100 100 100
Note: Any other refers to premises that are neither owned nor rented. This
category includes houses provided by an employer rent-free, houses con-
structed on encroached land, unauthorized buildings, and natural shelters
used as housing.
Source: Census of India (2011).
of India, 26.3% and 27.8% of households live in rental accommodation respectively (see
table 1).8 The low share of renting in slums is contrary to the popular belief that renting is
the dominant tenure choice given the flux of labour and absence of formal regulations. In
a study of slums in Pune, a survey finds that 15% of households were renting (Nakamura,
2016). While comparing slums across different cities in the world, Marx et al. (2013) find
8
Data from the National Sample Survey Organisation of India (2012) shows that 31.8% and 35.9%
of households are in rental accommodation in slums and formal housing respectively. The difference in
census and sample survey numbers is because one is the entire population and the other is a sample.
The census collects data from all households in the country and is reliable for understanding aggregate
numbers, whereas the national sample survey numbers are stratified and based on only a sample 0.05%
of the households in urban India and hence could miss several pockets within large cities. For example,
in Mumbai the sample survey only covers 611 households and could under represent pockets that have
more ownership.
5that 26% of the slum households in Mumbai are in rental accommodation.
Table 2: Tenure status and income quintile (MPCE) in urban India
Income quintiles
Tenure 0-20 20-40 40-60 60-80 80-100 Total
Owned 24.0 20.5 20.6 17.7 17.2 100
Rented 13.2 16.1 22.8 23.0 24.8 100
Note: MPCE is defined as the total expenditure in the last 30
days divided by the size of a given household. Consumption ex-
penditure classes (quintiles) calculated using MPCE for urban
households, weighted by sampling weights.
Source: Authors’ calculations based on NSSO 69th Round (2012).
Table 2 shows the tenure status by household income distribution in urban India.
Using monthly per capita expenditure (MPCE) as a proxy for income, we see that renting
exists in all income categories. While the share of renting is the highest for households
in the last quintile, renting is also an important choice for middle-income households.
Table 3 shows the different contract arrangements for rental housing. Only 14.1% of
the slum households have written rental contracts.9 Further, only 18.6% of households in
formal rental housing have written contracts. The low share of written contracts in slums
is expected given their informal nature, whereas the rather low share in formal housing
could be because landlords want to evade rent control laws or save on time and monetary
costs associated with formal contracts (Sharma, 2017).
Table 3: Contracts in slums and non-slum dwellings (%)
Type of tenure Formal Slum Total
Rented: Employer quarter 11.6 2.4 10.7
Rented: With written contract 18.6 14.1 18.1
Rented: Without written contract 69.8 83.5 71.1
Total Rental 100 100 100
Source: Authors’ calculations based on NSSO 69th Round (2012).
9
See Krishna et al. (2020) for more details on written rental agreements in slums.
62.2 History of rent control in India
During the First World War, food price inflation in India (particularly in Bombay) led
landlords to increase rents steeply, causing a rise in evictions.10,11 In order to curb rising
rents and evictions, the rent control law was introduced for the first time in Bombay
in 1918, followed by in Calcutta in 1920 (Tembe, 1976). Other states introduced rent
control after the Second World War (Jauhar, 1995). While these acts protect tenants,
they also permit landlords to evict tenants and increase rents under certain conditions.
For instance, nearly all rent control laws allow landlords to evict tenants if rent is not
paid for a period of time that is stipulated in the law. This varies across states, ranging
between 0.5 months to 7 months.
We found cases of such evictions in many states, with two cases of particular interest
– Madan Mohan and Anr. v. Krishan Kumar Sood (1993)12 from Himachal Pradesh13
and E. Palanisamy v. Palanisamy (Dead) (2003)14 from Tamil Nadu.15 In these cases
the Supreme Court ordered the eviction of tenants for non-payment of rents. Further,
the Supreme Court noted that while the rent control acts are made to protect tenants,
it is the responsibility of the tenant to pay rent in the stipulated time to remain under
these acts’ protection. Hence, these cases demonstrate that eviction clauses have teeth.
That said, these cases did take nine to 10 years to adjudicate.
Rent control acts also place restrictions on when and how rent can be increased.16
There is variance across states in India and some states are relatively pro-landlord in
allowing rent revisions. Tenants have challenged increases in rent as stipulated under pro-
landlord laws. However, the landlords’ rights under the rent control act are protected. For
10
Caru (2013) provides a history of the introduction of the rent control act in Bombay in 1918.
11
We refer to cities and states as they were named at the time of the law.
12
(1993) SCR (1) 107.
13
In Himachal Pradesh, the tenant is allowed to be in default of three months’ rent before they can
be evicted. In this case, the Rent Controller provided the tenant two separate opportunities to pay their
dues. Aggrieved by this leniency, the landlord appealed to the High Court, which rejected his appeal.
Therefore, the landlord appealed to the Supreme Court to evict the tenant and prevailed.
14
(2003) 1 SCC 123.
15
Some other key Supreme Court judgements with respect to evictions in favor of the landlord are in
the states of Uttar Pradesh (1978 AIR 287) and Rajasthan ((2003) 2 SCC 577).
16
These conditions can be on the frequency of increases or when the property is improved. Other
common justifications are increase in taxes on the property and increase in the market value of the
property. However, some states allow for periodical revisions in rent as well.
7example, in the Ujwalabai alias Meena Shantaram Apte v. Namdeo Dnyanoba Shingare
(2001)17 case, the landlord increased rents as per the law and the tenant refused to pay
the increased rent and challenged the increase. The High Court found the increase in
rent acceptable and evicted the tenant on the grounds of non-payment of rent.
Landlords have adapted to the rent control laws and have found ways to work around
them. Table 3 shows that a considerable share of rental contracts in formal housing are
unwritten. There is a growing preference among landlords for short-term (typically 11
month) license arrangements with tenants (Tandel et al., 2016). Landlords are reluctant
to formally register these contracts for fear that the government may, at the stroke of a
pen, be able to bring these leases under the rent control law, as it has done in the past.18
However, the legacy of the rent control law still has a bearing on housing outcomes as it
has affected several properties. For example in 2010, the city of Mumbai had 17% of all
formal units under rent control, with several pockets of the island city having more than
50% (Tandel et al., 2016). Recognising, the adverse impact of the strict rent control laws
on housing markets in India, the government of India has introduced a Model Tenancy
Act in 2021 for states to adopt. One of the main objectives of this act is to reduce vacancy
across cities.19 To achieve this, the act strongly suggests that states liberalize the rents
landlords can set when drafting an agreement. It further proposes an alternate judicial
setup at the district level for all rental litigation, which is mandated to provide a decision
within 60 days.
17
2002 (2) BomCR 76.
18
Given the strict rent control laws and shortage of housing in Bombay in the mid 1900’s, landlords
(or tenants) started renting (or subletting) out their property for a period of 11 months, which would
not come within the purview of the rent control law. However, the Government of Maharashtra, with a
small amendment in 1973 (Maharashtra Act XVII of 1973), made it very difficult to evict tenants under
these agreements, granting these tenants de facto rent control.
19
The background note for the Model Tenancy Act starts with “As per Census 2011 around 110
lakh houses were lying vacant in urban areas. One of the main reasons for non-availability of these
houses for rental purpose is the existing rental laws of the States/UTs, which discourage renting."
Background note available here http://mohua.gov.in/upload/uploadfiles/files/1%20Background%
20Note%20on%20MTA%20(English).pdf
82.3 Vacant housing across India
The annual growth rate of vacant houses between 1971 and 2011 was 12.7% – 75% faster
than the growth of urban households in the same period. Given that the average urban
household size in India is 4.66 people, the vacant stock could house almost 50 million
people or around 13% of the urban Indian population.
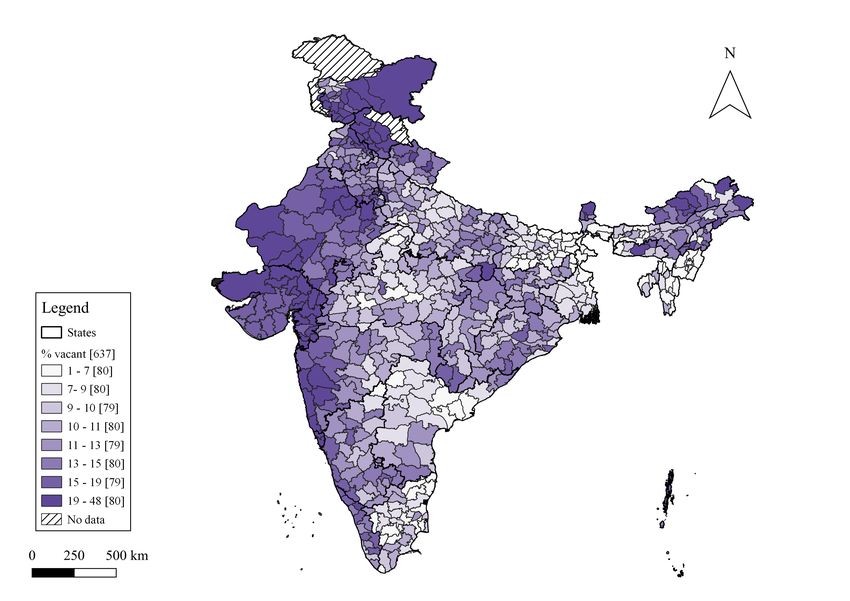
Figure 2: Percent urban vacant houses in major states
Source: Adapted from Gandhi and Munshi (2017) and IDFC Institute (2018) using Census of India 2011.
Figure 2 shows the share and number of vacant urban houses for 19 major states
and union territories in India. They constitute approximately 96.5% of the total of 11.1
million vacant houses in urban India. Among the larger states, Gujarat has the highest
share of vacant houses of the total residential stock (around 19%), followed by Jammu
and Kashmir, Rajasthan, and Maharashtra.20
The distribution of vacancy rates at the district level shows the median is around
12%. The distribution is right-skewed, with 77 districts having more than 20% of their
residential stock vacant. Almost all of western India has higher residential vacancy rates
as compared to the average of 12.38%, as can be noted from figure 3.
Figure 4 shows the vacant housing situation in Indian cities, each having more than
30,000 vacant houses. Towns on the outskirts of major cities have the highest proportion
20
Among all the states and union territories of India, Goa has the highest share of vacant houses at
31.3%.
9Figure 3: Percent urban vacant houses across districts
Source: Authors’ mapping using data from Census of India, 2011.
of their residential stock vacant. Greater Noida, in the periphery of Delhi, has the highest
share of vacant houses (61%).21 Vasai Virar in the outskirts of Mumbai has the second-
highest share of vacant houses at 28%. Greater Mumbai has the highest number of vacant
houses (comprising 15% of its residential housing stock), followed by Delhi and Bangalore.
The state of Maharashtra, as mentioned previously, has the highest number of vacant
houses (2.1 million), which make up around 19% of vacant houses in urban India. The
Mumbai metropolitan region makes up 44% of the vacant houses in Maharashtra. Figure
5 shows the vacancy rate for all towns and cities in Mumbai region. Vasai Virar, Mira
Bhayandar, Panvel, and Badlapur have more than 20% of their residential stock vacant,
which is much more than Greater Mumbai’s.
From figures 5 and 6, we can affirm that non-primate cities in the periphery of the
metropolitan cities of Mumbai and Delhi have a much higher share of vacant housing.
21
Greater Noida is classified as a census town. Census towns are areas that have urban characteristics
but lack an urban local body. In practice, Greater Noida was created as an industrial development area,
and is governed by an industrial development authority.
10Figure 4: Vacant houses in major cities
Source: Source: Adapted from Gandhi and Munshi (2017) and IDFC Institute (2018) using Census of
India 2011.
This pattern could have emerged due to a high number of housing units purchased as
investments but not rented out.
Figure 5: Percent residential stock vacant for cities in Mumbai Metropolitan Region
Source: Authors’ mapping using data from Census of India, 2011.
Note: M. Corp is Municipal Corporation, M. CI is Municipal Council, and MCGM is Municipal Corpo-
ration of Greater Mumbai.
11Figure 6: Percent residential stock vacant for cities in Delhi Region
Source: Authors’ mapping using data from Census of India, 2011.
Note: CB is Cantonment Board, CT is Census Town, DMC is Delhi Municipal Corporation, NDMC is
New Delhi Municipal Corporation, and OG is Outgrowth.
3 Literature Review
3.1 Definitional aspects of vacancy rates
Housing vacancies can be of two types, “intentional” and “unintentional vacancies” (Mol-
loy, 2016, p. 118), or as Segú (2020, pp. 2-3) calls them, “voluntary” vacancy and “fric-
tional” vacancy. Frictions in demand and supply within the housing market lead to some
level of “natural” or “structural” vacancies – referred to as unintentional vacancy – even
in equilibrium. The natural vacancy rate is akin to the natural unemployment rate – it
is the product of a matching problem. For cities in the United States, Rosen and Smith
(1983) show that when actual vacancy rates diverge from the natural vacancy rate, price
adjustments in the housing market bring vacancy back to its natural rate.
Intentional vacancies occur as a rational decision by landlords to keep their units out
of the rental market. Segú (2020) states two reasons for such vacancies in France – price
uncertainties and rent regulations. Uncertainties in future prices could lead to owners
12delaying their transactions in the market, especially if the expectation is that prices will
go up (Segú, 2020). Further, intentional vacancies could also be due to regulations that
impede changes in rents or if there are restrictions on contract termination (Gabriel and
Nothaft, 2001). In such cases, it may be rational to keep the property vacant.
3.2 Reasons for housing vacancies
Monkkonen (2019) looks at housing vacancy in the 100 largest Mexican cities and finds
a strong positive correlation between government housing finance and vacancy rates. In
2010, Mexico had a housing vacancy rate of around 14%. This study found that increased
access to credit directly led to new housing in the suburbs and a higher vacancy there,
along with population loss in core cities.
Zhang et al. (2016) estimated that housing vacancies in parts of urban China are above
20%, leading to ghost towns. At the lower end of the income distribution, housing is
beyond people’s reach because people with high incomes, who often buy multiple houses,
bid up the price. Consequently, the luxury segment of the housing market sees very high
vacancy rates. Zhang et al. (2016) found that a 1% increase in the GINI coefficient leads
to a 0.17% increase in Chinese cities’ housing vacancies.
There are very few studies that look at vacancy rates in private housing markets in
India. Gandhi and Munshi (2017) study vacancy rates in India by looking at both public
and private housing markets. They find high vacancy rates in public housing schemes by
the Government of India, a finding also noted by Pande (2017). These high vacancy rates
may owe to households’ fear of losing their social networks. Households are thus reluctant
to move from slums in cities’ core areas to government housing in the peripheries (see
Barnhardt et al., 2017). Gandhi and Munshi (2017) also find that the low returns on
investments in the private rental market are a possible reason for high vacancy rates in
urban India. They find gross rental yields range between 2%-4% in most Indian cities.
Another potential explanation for high vacancies is the existence of rampant black
money flowing through real estate and land in India. An important source of black money
is the partial payment (a fixed proportion of the price of the property) made by property
13buyers from off-the-books sources of money. Thus, one reason for buying property is to
park money that has not been declared to tax authorities. These properties are often
kept vacant. Kapur and Vaishnav (2015) argue that builders use the black money to
fund election campaigns, in exchange for favors and exemptions. They establish the
relationship between black money and real estate by looking at trends in demand for
cement. They find that demand follows a political business cycle — contracting before
elections and expanding right after. Prima facie, neither low rental yields nor black money
purchases should dissuade a rational agent from renting out their property. However, in
the following section, we hypothesize that the nature of rent control laws and weak
contract enforcement in India could discourage this.
3.3 Literature on resource misallocation
The literature on misallocation and over-consumption of housing owing to rent control
is vast (Glaeser and Luttmer, 2003). Rent control leads to misallocation of housing
in New York; Glaeser and Luttmer (2003) estimate that due to rent control, almost
20% of housing in the city is occupied by households that would reside elsewhere in an
unregulated market. A high housing vacancy rate can reflect a distorted housing market,
where land and capital are inefficiently utilized. Research explaining how rent control
affects the behavior of landlords is scant. Diamond et al. (2019a,b) study the impact of
the expansion of rent control in San Francisco and find that rent control affects landlords’
incentives such that they reduce their supply of rental housing. But no research that we
know of examines the impact of rent control on vacancy rates. India has a long history of
rent control in urban parts of the country (see Tandel et al., 2016), and our hypothesis is
that the rent control legacy disincentivizes landlords to rent out their properties, leading
to a misallocation of resources. On its face, intentional vacancy seems more inefficient
than even mismatch.
Developing countries are well known to have weak contract enforcement. Weak con-
tract enforcement in India has affected how firms structure production and has led to
high resource inefficiencies (Boehm and Oberfield, 2020). For example, in states where
14contract enforcement is weakened by overburdened courts, industries move away from
relationship-specific contracts or market-based contracts to a more hierarchical and ver-
tical production process. The rationale for this is that disputes in market-based contracts
are difficult to resolve in states with weak contract enforcement. Weak contract enforce-
ment could similarly discourage landlords from entering into leases with tenants.22
We hypothesize both rent control and weak enforcement of contracts are partially
responsible for the high rate of vacancy in India, and for the small size of the rental
market.
4 Strategy and Data
4.1 Empirical strategy
The paper looks at two possible reasons for urban vacant housing in India: pro-tenant
rent control, and weak state capacity for contract enforcement. We also conduct a placebo
test using the provision of public goods and amenities. Our unit of observation is the
district. Districts are small sub-geographies of states in India and are akin to counties in
the United States.
We first implement a two-way linear fixed effects panel regression design to establish
a relationship between pro-tenant rent control laws and vacancy rates by estimating the
following linear model :
V Hist = β · RCst + γ · Xist + θi + δt + ist (1)
The dependent variable in eq. (1) is the percent urban vacant housing in district i,
state s and year t. The years refer to 2001 and 2011. RCst is a vector of variables
denoting the pro-tenant or pro-landlord nature of the rent control law. The vector of
variables includes the number of months of non-payment allowed, rent revision dummy,
non-occupancy dummy and coverage of the law. We describe these variables in the
22
Weak contract enforcement in India has increased the amount of litigation against real estate projects
through NIMBYism, which has increased construction times by 20% (Gandhi et al., 2021).
15next section. Treated districts are where these clauses changed and the control districts
are where there was no change (see fig. 7). Xist is a vector of time-varying district
characteristics. This vector includes proportion of scheduled castes and scheduled tribes,
marriage, religion, workforce participation, female population share, mean household
size, and the share of households with access to banking services. We also control for
the per capita number of shops, and offices as well as the number of good, liveable, and
dilapidated buildings per person.23 θi and δt are district and year fixed effects, and ist is
the error term. The parameter of interest is β, the vector of treatment effects of different
rent control clauses on percent vacant housing in the district. We cluster standard errors
at the district level. We also cluster at the state level for one specification.
Figure 7: Treated and control districts for rent control analysis
Note: All district boundaries as represented in Census of India, 2001
We use OLS regression as shown in eq. (2) to look at the impact of state capacity for
contract enforcement on vacancy rates in 2011.
23
Detailed descriptions of how these control variables are enumerated can be found in the Metadata
for Census of India 2011. See: https://censusindia.gov.in/2011census/HLO/Metadata_Census_2011.
pdf
16V His = β · Judgesis + γ · Xis + is (2)
State capacity for contract enforcement is measured by the number of judges per 1000
persons at the district level. To control for state-level variations, we use state dummies.
Xis is a vector of district controls. We also add RCs for the year 2011 to this cross section
analysis for a few specifications. Data limitations prevent us from using panel techniques
with studying the effects of judicial density on vacancy.
An issue with trying to establish this relationship is the possibility of omitted vari-
able bias. The issue is similar to that found in the relationship between police and
crime—because police are stationed in high crime areas, they may appear not to be very
effective in reducing crime (Marvell and Moody, 1996). If higher vacancy is a reflec-
tion of inadequate judicial capacity, places with high vacancy might be assigned more
judges. This positive correlation means that the absolute value of the observed negative
coefficient on judges will be lower than the true value.
We perform a placebo test with the provision of public goods and amenities as our
explanatory variables. We use a linear model similar to eq. (1), as shown in eq. (3) to
estimate the vector of parameters β.
V Hist = β · PGist + γ · RCst + ζ · Xist + θi + δt + ist (3)
PGist is a vector of public goods consisting of the number of educational institutions
per 1000 persons, medical institutions per 1000 persons, and paved roads per square
kilometre in the district i, in state s, at time t, respectively. Xist is the same vector
of time varying characteristics used in eq. (1). We also add the vector of rent control
variables, RCst to eq. (3) for all specifications. We cluster standard errors at the district
level.24
24
We considered a border discontinuity design as an empirical strategy but do not have sufficient
degrees of freedom to run this.
174.2 Vacant housing and tenure data
The primary source of data on vacant housing and tenure choice is the Census of India.
For the censuses of 2001 and 2011, the instruction manual for Houselisting and Housing
census enumerators defines vacant houses as:
“If a Census house is found vacant at the time of House listing i.e., no person
is living in it, and it is not being used for any other non-residential purpose(s)
write ‘Vacant’.”25
The Census of India also provides data on tenure, categorizing occupied houses as
rented or owned.26 Neither vacant housing nor tenure data are available at the individual
household level but are aggregated at the city and district levels. Unlike the United
States, vacant houses in the Census of India are not classified by tenure status. For this
study, we utilize data from 2001 and 2011 to develop panel analyses across 24 states,
using percent vacant houses of urban housing stock as the dependent variable. For cross-
sectional analyses of contract enforcement, we use data from 29 states.
4.3 Rent control variables
Under the Indian federal system, only state legislatures have the power to impose rent
control laws. There would be a lag between passing the law and the change in the
behaviour of the landlords and thus on the effect on housing outcomes. We consider a
lag period of two years. For the data from 2001 and 2011 we use rent control variables
up until the years 1999 and 2009, respectively.27 We first collect historical rent control
laws that would impact housing markets in 2001. For the rent control variables for 2011
25
While the manual instructs the enumerator to note the reason for vacancy, the Registrar General of
India does not release these data. Column 7 of the Census House-listing questionnaire has enumeration
categories for vacancy (see Appendix 1.)
26
There is also a third category, “other,” that refers to premises that are neither owned nor rented.
This category includes houses provided by an employer rent-free, houses constructed on encroached land,
unauthorized buildings, and natural shelters used as housing. Only 3.30% of houses in urban India are
classified thus.
27
West Bengal amended its act in 1997 and it came into effect on 28th December 1998. We are
treating this as if it is 1999. This act would have no impact on housing vacancy in 2001.
18we look at the Dev and Dey (2006) catalogue of rent control laws in India. There were
no changes to the rent control laws between Dev and Dey (2006) and 2011.28
In our database, four states made changes to their rent control laws. We consider
districts in these four states as the treatment group and the others as the control group.
Figure 7 shows the districts (2001 boundaries) according to this classification.29 It also
shows districts dropped from our analysis due to various issues.30
Our variables are:
Number of months of non-payment allowed: This is calculated by adding two ele-
ments of tenant-landlord law: the minimum number of months of non-payment before
a landlord can begin eviction proceedings, and the number of months the tenant has to
vacate after the landlord or the rent controller issues a notice for eviction. This period
of minimum non-payment varies from a fortnight to seven months.31 Laws with longer
minimum periods before eviction can begin are more pro-tenant than laws with shorter
periods. West Bengal and parts of Maharashtra increased the months of non-payment
allowed in our time period.
Rent revision dummy: All rent control laws restrict adjustment of rents by the land-
lords. However, there exists variance across states in India in how strict these conditions
are. Landlords in some states may raise rents annually or when the properties’ market
value increases. In other states they are subject to much stricter restrictions where they
are allowed to increase rents only when they make physical additions to the property. In
28
The Jawaharlal Nehru National Urban Renewal Mission in 2005 mandated changes to the rent
control laws to avail transfers from the centre. Many states amended their laws after 2011. Between
2011 and 2020, nine states have passed new rent control laws or amended them.
29
The count of districts is 593 in 2001 and 640 in 2011. New districts formed between 2001 and 2011
are mostly the result of one district being broken into two or more. Complete data on vacancy is not
available below district level in the 2001 and 2011 censuses. Therefore, in order to create a balanced
panel, we had to merge 2011 districts to recreate 2001 boundaries. In the end, we dropped 29 districts
from 2001 that had no counterpart in 2011.
30
Assam underwent a complex reorganisation of districts in 2003, when the Bodoland Territorial
Council was formed. We drop the state from our analysis because the boundaries of the districts changed
significantly. We could not find the texts of current or past rent control laws of Andaman and Nicobar
Islands, Dadra and Nagar Haveli, Himachal Pradesh, Lakshadweep, parts of Maharashtra (districts under
the erstwhile Central Provinces and the princely states of Hyderabad and Berar), Manipur, Mizoram,
and Rajasthan. Nagaland has not passed a rent control law, and Arunachal Pradesh passed its first rent
control act in 2014. These states were also dropped from the analysis.
31
These time periods are given in months and fortnights. The variable, number of months of non-
payment, takes the values of 0.5,1,2,3,4,5, and 7.
192001, of the 24 states considered, there was no requirement for a physical addition to raise
rents in 18 states containing 287 districts. We assign these places a value of zero for the
rent revision dummy. In six states consisting of 169 districts, rent increases were allowed
only if the landlord made a physical addition to the premises. We assign these districts a
value of one. A rent revision dummy with a value of one reflects a state with pro-tenant
policy. Karnataka moved from a pro-tenant rent revision clause to a pro-landlord one.
Non-occupancy dummy: This variable looks at whether the landlord can evict the
tenant if they do not occupy the unit. It takes the value 0 if it is pro-landlord, i.e., the
landlord can evict the tenant in case of non-occupancy. In 2001, 15 states, or 236 districts,
had a value of 0. The dummy has the value one if it is pro-tenant. i.e., if the landlord
cannot evict tenants if they do not occupy the unit. Nine states, or 220 districts, take the
value of one. For pro-landlord states, the time stipulated for no occupancy varies from
one month to 12 months. West Bengal changed its non-occupancy clause from pro-tenant
to pro-landlord.
Coverage: We control for coverage of rent control laws as they do not apply to all
properties and areas. The three most common coverage types are geographical, age, and
value of rent. We use a dummy variable for each, wherein the law gets a value of one if
the clause has greater scope and hence is pro-tenant and 0 if it has limited scope and thus
pro-landlord. The age dummy takes the value one if the law does not exclude any premises
based on its age and takes the value 0 if it excludes certain properties. West Bengal and
Gujarat moved from pro-tenant to pro-landlord age coverage. The rent dummy takes the
value one if higher rent properties receive no exemption from rent control and takes the
value 0 if there is such an exemption. The geographical dummy takes the value one if
the law has jurisdiction over all urban areas and takes the value 0 if it excludes some
urban areas. The geographical dummy and the rent dummy do not change between the
two time periods.
204.4 Data for contract enforcement
We consider the number of judges per 1000 people at the district level as an indicator
of effectiveness of courts. Data describing district courts was collected from the National
Judicial Data Grid in December 2019. We used state-level totals of district level judge
strength (available for 2012) to deflate the 2019 values, estimating the 2011 judge strength
with these totals as a base.32
4.5 Data on public goods
For the placebo test defined in eq. (3),we use measures of density for three public goods,
namely educational institutions33 , medical institutions34 , and roads. The first two are
sourced from the houselisting census of 2001 and 2011. The length of paved roads in
a district and its area was sourced from the “District Census Handbook,” published for
each district under the Censuses of 2001 and 2011. The density of educational institutions
(medical institutions) was calculated as the number of educational institutions (medical
institutions) per 1000 urban population in the district. To calculate the density of paved
roads, we use the length of such urban roads in the district divided by its urban area.
This variable is in km. per km.2 as also used in Bird and Venables (2020).35
5 Distortions in the housing market
Rosen and Smith (1983) demonstrated that much as labor markets are characterized by
“natural” unemployment rates, housing markets are characterized by natural vacancy
rates. The natural vacancy rate is the equilibrium rate – that is, it is the rate at which
32
The vacant housing data are from the Census of India 2011. For 2019, we do not have data for
Arunachal Pradesh, Nagaland and parts of Meghalaya. We make use of 2012 state-level data on the
number of tertiary level judges to create deflators. The number of judges for 2012 with and without the
above mentioned three states are 14,432 and 14,393 respectively. The number of judges for the year 2019
omitting the three states is 15,873. We used data on the number of judges by state in 2012 to deflate the
2019 dataset to create an estimate of number of judges for each district in 2012. Our strong assumption
is that within each state, the proportion of judges by district remains constant between 2012 and 2019.
33
The census counts them as “schools/colleges etc.”
34
The census counts them as “hospitals/dispensaries etc.”
35
The length of paved roads and/or the area of the district was not available for 16 observations from
2001 and 3 observations from 2011. Therefore, panels using this variable are unbalanced.
21real rents neither rise nor fall. The natural rate is not zero because the housing market
contains frictions, particularly with regard to search and matching.
Search and match issues increase with turnover – when people move from one housing
unit to another, they create, at minimum, a short period of vacancy, as units rarely fill
the instant they become vacant. A series of papers (eg. Amy et al., 2000; Eric and John,
1996; Komai, 2001; Rosen and Smith, 1983) show that a higher turnover rate leads to
higher natural vacancy. Therefore, one would expect that a well-functioning housing
market would have higher vacancy among renters, whose leases are finite, than owners,
whose “leases” are effectively in perpetuity. Indeed, American Community Survey Data
and Current Population Survey data show that (1) length of tenure in owner-occupied
houses is much longer than in rental units36 and (2) vacancy rates among rental units
are much higher than among owner-occupied units.37 Hence, it would follow that places
that relied more on rental housing would have higher overall housing vacancy rates than
those that relied on owning.
This is not the case in India. Table 4 presents regression results looking at the covari-
ation of rental share and vacancy by district and cities in India. In column (1), at the
district level with no controls, we find no relationship between rental share and vacancy,
and in column (4), at the city level with no controls, we find a negative relationship signif-
icant at the 10% level. In columns (2) and (5), with controls, we find that a 1% increase
in rental housing is associated with 0.11% fall in vacancy rates, with coefficients that are
statistically significant at the 1% level. When we add state dummies in columns (3) and
(6), the coefficient is insignificant for districts but the negative relationship remains for
cities. These results are contrary to the expected positive relationship between rental
share and vacancy. This could reflect the fact that renters protected by the rent control
laws in India have strong tenure security, and hence, lower turnover. While these policies
36
The median renter in the U.S. in 2018 had lived in their unit for less than three years, while
the median owner had lived in their unit for considerably more than 9 years. The categories in
the ACS questionnaire prevent us from expressing the difference more precisely. URL: https:
//data.census.gov/cedsci/table?q=Year%20Householder%20Moved%20Into%20Unit&hidePreview=
false&t=Year%20Householder%20Moved%20Into%20Unit&tid=ACSDT1Y2018.B25038&vintage=2018,
accessed July 19, 2020.
37
See https://www.census.gov/housing/hvs/index.html, accessed July 19, 2020
22Table 4: Relationship between % rental and % vacant housing
(1) (2) (3) (4) (5) (6)
VARIABLES Dep. Variable = % vacant
% rented -0.03 -0.11*** -0.02 -0.05* -0.11*** -0.04***
(0.06) (0.02) (0.02) (0.03) (0.02) (0.01)
Constant 13.1*** -132** -77.5 14.3*** 27.8* 4.24
(1.55) (59.4) (58.4) (1.88) (15.1) (14.1)
Administrative unit Districts Districts Districts Cities Cities Cities
Observations 637 637 637 496 494 494
R-squared 0.01 0.74 0.84 0.08 0.68 0.76
Controls N Y Y N Y Y
State dummies N N Y N N Y
Note: Dependent variable is percent vacant housing. District controls for columns (2) and (3)
include mean household size, the share of households with access to banking services, the pop-
ulation proportions by scheduled castes and tribes, marital status, religion, age groups, level of
education, workforce participation, and gender. We also control for the number of shops, offices,
along with the number of good, livable, and dilapidated buildings per person. Mean household
size and marriage data were unavailable at the city level – these controls are not included for
columns (5) and (6). All regressions are for urban areas only with population weights at the
administrative unit level. Missing districts are Lahul & Spiti, and Kinnaur (Himachal Pradesh),
and Nicobars (Andaman). Vacancy data was available for only 497 of the 7935 cities/towns in
Census 2011. Imphal (Manipur) does not have rental housing data in a neat form and hence
the dependent variable could not be computed for it. Control variables were unavailable for the
cities of Kapurthala (Punjab), Faizabad (Uttar Pradesh) and Imphal (Manipur). The 496 cities
cover 57.0% of the urban population. The suppressed categories for gender, religion, age group,
and education are the share of men, Hindus, people aged 0-4, and illiterates respectively. Robust
standard errors clustered at the state-level in parentheses. *** pnegative and statistically significant at 10% (column 6). The sign and the weakness of the
months of non-payment coefficient may be a reflection of how long it takes for courts to
enforce landlords’ claims, just as in the Madan Mohan and Anr. v. Krishan Kumar Sood
(1993) and E. Palanisamy v. Palanisamy (Dead) (2003) cases. Columns (2), (4), (5), and
(6) show that a limitation on landlords’ ability to raise rent freely significantly increases
vacancy. In the states where rent revision clauses remained pro-tenant, the vacancy rate
increased by 2.78 percentage points (column (2)). When other changes in rent control are
accounted for, this estimate increases to 3.03 to 3.11 percentage points (columns (4), (5),
and (6)). The coefficient for the non-occupancy dummy is negative and not statistically
significantly different from zero in every specification we test. Changes in age coverage
have no significant impact on vacancy. Taken together our results show that, a policy
move that allows landlords to revise rents reduces housing vacancy.
24Table 5: Relationship between percent vacant housing and clauses in rent control laws
(1) (2) (3) (4) (5) (6)
VARIABLES Dep. variable = % vacant
# Months of non-payment allowed -0.35 -1.02 -1.11 -1.11*
(0.63) (0.78) (0.78) (0.58)
Rent revision dummy (1 = pro-tenant) 2.78*** 3.11*** 3.03*** 3.03***
(0.90) (0.92) (0.91) (0.94)
Non-occupancy dummy (1 = pro-tenant) -0.88 -0.11 -1.36 -1.36
(0.91) (1.05) (1.29) (1.26)
Age coverage dummy (1 = pro-tenant) 0.43 0.81 1.09 1.07 1.07
(0.64) (0.51) (0.77) (0.75) (0.78)
Constant 21.4*** 20.1*** 20.0*** 24.6*** 24.6*** 24.6***
25
(3.69) (2.92) (2.94) (3.98) (3.92) (4.15)
Observations 912 912 912 912 912 912
R-squared 0.57 0.58 0.57 0.58 0.58 0.58
Number of districts 456 456 456 456 456 456
Controls Y Y Y Y Y Y
Standard error cluster District District District District District State
Note: Dependent variable is percent vacant housing at the district level. We have a balanced panel with 456 districts
in 2001 and 2011. All data is matched to year 2001 district boundaries. All specifications include district and year
fixed effects. Geographical coverage and rent coverage dummies get dropped as there were no changes in these clauses.
Controls include mean household size, the share of households with access to banking services, the population propor-
tions by scheduled castes and tribes, marital status, religion, age groups, level of education, workforce participation,
and gender. We also control for the number of shops and offices, along with the number of good, livable, and dilapi-
dated buildings per person. All regressions are for urban areas and population weighted at the district level. Robust
standard errors in parentheses are clustered at the district level for columns (1)-(5) and at the state level for column
(6). *** p6.2 Enforcement of contracts
According to the World Bank’s Ease of Doing Business Index, it took an average of
1,445 days to enforce a contract in India in 2019.38 An efficient judiciary is able to
resolve contractual disputes quickly, creating an enabling environment to enter into formal
contracts; an inefficient judiciary reduces the frequency of contracting (Voigt, 2016). One
of the ways to improve the efficiency of the judiciary system is by increasing the number
of judges (Voigt, 2016).39 Hazra and Micevska (2004) look at the Indian legal system
and find that the number of judges at the district level has a significant impact on case
resolution in India and thus reduces congestion in the system.40 Rao (2020) provides
further evidence, finding that every additional judge reduces backlog by 6%. Without
enough judges, the judiciary is burdened with high caseloads, affecting state capacity
to enforce contracts. This makes it expensive and time-consuming to enforce a rental
contract, and hence landlords prefer to avoid renting out their properties, leading to
higher vacancy rates.
In this section, we use judge to population ratio at the district-level tertiary court
as our main explanatory variable as shown in eq. (2). As these courts serve both urban
and rural jurisdictions, we create two different variables – the number of judges per 1000
urban population in the district and the number of judges per 1000 total (urban and
rural) population in the district. We add all rent control variables to the specifications
and these results are in columns (3) and (6) of table 6. In columns (1) through (4) and
column (6) of table 6, we find a significant and negative coefficient of the number of
judges per 1000 population on percent vacant housing.
This result is consistent with the hypothesis that an absence of capacity to enforce
contracts undermines the working of a rental market and incentivizes owners/landlords
to keep their properties vacant. Even if judges uphold landlords’ rights, but it takes
several years for them to do so, potential landlords might prefer to keep their housing
38
See: https://www.doingbusiness.org/en/data/exploretopics/enforcing-contracts
39
Voigt (2016) lists several factors that can improve judicial productivity, one of them being the total
number of judges. Some of the other factors include characteristics of the judges, the complexity of the
law, and the complexity of the judicial system itself.
40
Increasing the number of judges does not increase in the efficiency of the courts in all countries
(Voigt, 2016), but it does in India (Rao, 2020).
26units vacant and avoid the problem of any legal dispute with their tenants. The Model
Tenancy Act, 2021 specifically proposes a parallel judicial system focused exclusively on
landlord-tenant disputes. Our findings imply that such a system, if well-staffed, could
reduce vacancy. In 2012, the average number of judges per 1000 persons (total) was 0.01
(see Appendix 2). A 10% to 50% increase in judges per 1000 persons (total), could reduce
vacancy by 0.1 to 0.4 percentage points (according to column (3) in table 6).41
Table 6: Relationship between vacancy and judge to population ratios
(1) (2) (3) (4) (5) (6)
VARIABLES Dep. variable = % vacant
Judges per 1000 (total) -66.2** -62.9*** -72.7***
(30.3) (17.6) (24.2)
Judges per 1000 (urban) -10.7** -3.20 -10.7**
(4.75) (3.10) (4.72)
Constant -138** -83.4 -109.3* -145.7** -84.3 -112*
(66.5) (57.3) (61.1) (65.7) (58.1) (63.0)
Observations 580 580 571 580 580 571
R-squared 0.74 0.84 0.76 0.73 0.84 0.76
Controls Y Y Y Y Y Y
State dummies N Y N N Y N
Rent control variables N N Y N N Y
Note: Dependent variable is percent vacant housing for the year 2011. Rent control variables
include number of months of non-payment allowed, rent revision dummy, non-occupancy dummy,
age coverage dummy, geographical coverage dummy and rent coverage dummy. District level
controls include mean household size, the share of households with access to banking services,
the population proportions by scheduled castes and tribes, marital status, religion, age groups,
level of education, workforce participation, and gender. We also control for the number of shops,
and offices, along with the number of good, livable, and dilapidated buildings per person. All
regressions are for urban areas only with population weights at the district level. There are 60
missing districts in columns (1), (2), (4), and (5); there was no data available for districts in
Andaman and Nicobar Islands (3), Arunachal Pradesh (16), Bihar (1), Chhattisgarh (2), Dadra
and Nagar Haveli (1), Gujarat (1), Himachal Pradesh (2), Lakshadweep (1), Maharashtra (3),
Manipur (1), Meghalaya (7), Mizoram (6), Nagaland (11), Puducherry (4), and West Bengal
(1). The judicial districts of Andaman and Nicobar Islands, Puducherry, and Mumbai have been
dropped since the data are unavailable at the census district level. There are nine additional
districts from which rent control data are missing from the state of Chandigarh (1) and Manipur
(8). These districts were removed from columns (3) and (6). Robust standard errors clustered at
the state-level in parentheses. *** p7 A placebo test: public goods and vacancy rates
Thus far, we have shown stringent rent controls and weak enforcement of contracts as
predictors of high vacancy rates in Indian cities. In this section, we look at one possible
placebo test for vacancy.
As seen in figures 5 and 6, satellite cities at the peripheries of the core metropolitan
cities of Mumbai and Delhi have high vacancy rates. One hypothesis is that smaller
municipal bodies around the core cities have lower capacity for delivering services (see
Pethe, 2013; Sivaramakrishnan et al., 2014).
In a world where rent control doesn’t bind, service capacity should have no impact on
vacancy, as amenities will be properly priced in rents that will produce the equilibrium
vacancy rate. This is the definition of a placebo (see Eggers et al., 2021).
Table 7 tests these relationships between amenities and vacancy, separately as well
as jointly, as specified in eq. (3). Column (1) implies that the density of educational
institutes has a strong positive and significant impact on vacancy. The density of paved
roads also shows a positive relationship with vacancy, significant at 10%. Column (4)
from table 7, which includes all public goods within one regression, retains these findings.
So while the placebos are significant, they are significant in the wrong direction – better
services produce higher vacancy. This may reinforce our central result – property owners
in rent-controlled areas with good services discern greater opportunity cost for renting
out their properties.
We also add rent control variables in these specifications. The rent revision dummy
remains positive and significant throughout. Number of months of non-payment and the
non-occupancy dummy are not significant.
Our results imply that it is not the presence of high-quality amenities that drive lower
vacancy rates in places with liberalized rent control laws.
8 Welfare implications and housing shortage
Ministry of Housing and Urban Poverty Alleviation, Government of India (2012), esti-
28You can also read