PNB Housing Finance Ltd - Issuer Profile March 2019
←
→
Page content transcription
If your browser does not render page correctly, please read the page content below
PNB Housing Finance Ltd
Issuer Profile
March 2019

About CRISIL Issuer Profile

CRISIL Issuer Profile is part of CRISIL Ratings’ ongoing efforts to enhance lenders’ and investors’
understanding of the credit risk profiles of large and regular issuers in India’s debt market and banking
system

 Krishnan Sitaraman                              Ajit Velonie
 Senior Director, CRISIL Ratings                 Director, CRISIL Ratings
 krishnan.sitaraman@crisil.com                   ajit.velonie@crisil.com

 Subhasri Narayanan                              Rahul Malik
 Associate Director, CRISIL Ratings              Team Leader, CRISIL Ratings
 subhasri.narayanan@crisil.com                   rahul.malik@crisil.com
Contents

About the Company ........................................................................................................................... 4

PNB Housing in comparison with industry ......................................................................................... 6

PNB Housing’s key milestones........................................................................................................... 7

CRISIL-rated debt instruments .......................................................................................................... 8

Board of Directors: ............................................................................................................................ 9

Top Management ............................................................................................................................. 11

Awards and recognition ................................................................................................................... 12

PNB Housing’s Organisation Structure ............................................................................................ 14

Summary Credit Risk Profile ............................................................................................................ 15

Detailed Credit Risk Profile.............................................................................................................. 17

Asset Quality ................................................................................................................................... 19

Resources ........................................................................................................................................ 21

Capitalisation .................................................................................................................................. 24

Earnings .......................................................................................................................................... 25

ALM and Liquidity ............................................................................................................................ 27

Management.................................................................................................................................... 28

Key Financials ................................................................................................................................. 29

Annexures........................................................................................................................................ 31
   Product Overview.......................................................................................................................... 31
   Process overview .......................................................................................................................... 33
   ISO certified operations ................................................................................................................ 35
   Scalable operating model and centralised and streamlined operational structure ....................... 36

About the Company
PNB Housing Finance Ltd (PNB Housing) is among the top five housing finance companies (HFCs) in
terms of assets under management (AUM) and the second largest in terms of depositor outstanding
in India. Its customer-oriented business model enables it to maintain strong growth. It has a pan-India
presence through 96 branches as on September 30, 2018. The company also derives brand-sharing
benefits from the relationship with Punjab National Bank (PNB). The company has a strong
distribution network of over 13,000 channel partners across India.

Shareholding Pattern as on December 31, 2018

                                                                                                                   Promoters

                                                           19.17%                                                  Quality Investment
                                                                                                                   Holdings
                                                                                                                   Foreign Inst. Investors
                                                                                 8.65%
                   32.36%
                                                                                                                   Mutual Funds
                                                                                 4.25%
                                                                                                 1.89%             Public & Others
                                                                                                 0.90%
                                                                                                                   Bodies Corporates

                                        32.79%
                                                                                                                   Financial Institutions /
                                                                                                                   Banks

Other major investors in PNB Housing

    9.91%

                       3.80%

                                        1.71%                 1.47%               1.07%           0.88%            0.78%        0.77%       0.76%          0.72%
                                                                                                                      Invesco
                                                                                   Investments
                                                              Reliance Capital
                                         SBI Mutual Fund

                                                                                                   Motilal Oswal

                                                                                                                                                            Wasatch
    General Atlantic

                                                                                                                                 Vanguard
                       Birla Sun Life
    Singapore Fund

                       Mutual Fund

                                                                                                   Mutual Fund

                                                                                                                                             BNP Paribas
                                                               Mutual Fund

                                                                                     Malabar

4
PNB Housing provides retail housing loans for construction, purchase, repair, and upgrade of houses,
as well as purchase of residential plots. It also provides loans against property (LAP) and loans for
commercial property with focus on mass organised retail segment. On the wholesale side, it provides
construction finance, lease rental discounting (LRD), and corporate term loans (CTL), mainly to real
estate developers.
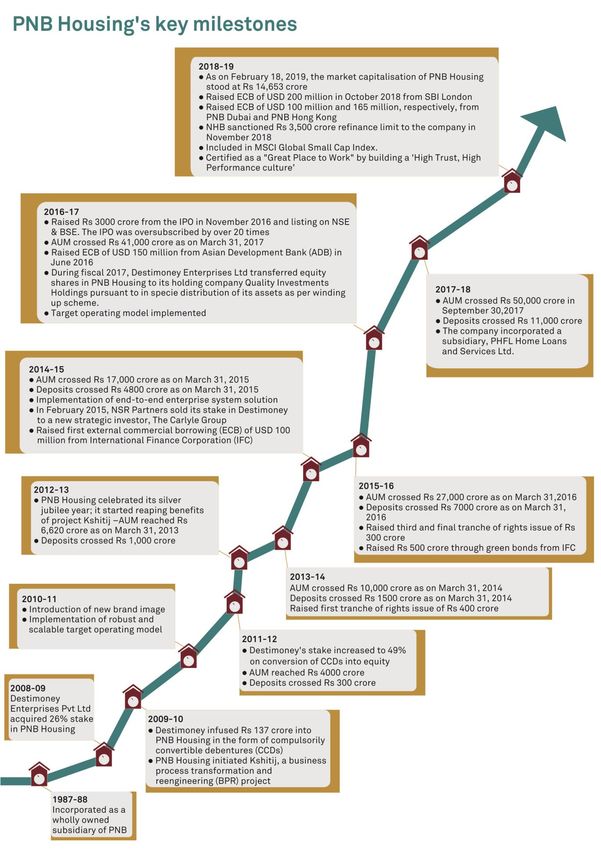
Highlights
1: based on yearly average
5PNB Housing in comparison with industry
Chart 1: Trend in AUM growth rate Chart 2: Trend in gross NPAs
(2 year lagged)*
70% 63% 2.0
59% 1.6
51% 50%
50% 60% 1.5 1.2
1.1 1.0
Per cent
1.0
Per cent
30% 23% 1.0
21% 24% 0.5 0.9
10% 20% 20%
0.6 0.7
0.5 0.5
-10% 2014 2015 2016 2017 2018 0.0
2014 2015 2016 2017 2018
For the year ended March 31, As on March 31
PNBHFL HFC PNBHFL HFCs
Chart 3: Trend in gross NPAs* Chart 4: Trend in return on assets
1.1 2.5
1.2
1.0 2.1 2.2
0.8 0.8 2.0
0.7 0.7 2.0 1.9 1.9
0.8
Per cent
Per cent
0.6
0.3 0.3 1.5
0.4 0.2 0.2 0.2 1.6
0.2 1.3 1.4
1.3 1.3
0.0 1.0
2014 2015 2016 2017 2018 2014 2015 2016 2017 2018
As on March 31 For the year ended March 31,
PNBHFL HFCs PNBHFL HFCs
Chart 5: Trend in adjusted gearing Chart 6: Trend in cost of borrowing
13.0 12.4 10.0 9.7
11.0 10.9 9.9
9.5
11.0 9.1
9.4
Per cent
9.0 9.3 9.3 8.7
8.6
9.0
8.5
Times
8.8 8.7 8.6
7.0 8.3 8.7 7.9
7.7 8.0
6.9 7.9
5.0 7.5
2014 2015 2016 2017 2018 2014 2015 2016 2017 2018
For the year ended March 31, For the year ended March 31,
PNBHFL HFCs PNBHFL HFCs
*based on advances
6PNB Housing’s key milestones 7
CRISIL-rated debt instruments
CRISIL has been rating PNB Housing’s debt instruments since 1995. The rated debt instruments are:

Table 1: PNB Housing’s CRISIL-rated debt instrument details
                             Instruments                          Rs Crore                   Rating
Fixed Deposit Programme                                            18500                   FAAA/Stable
Non-convertible Debentures                                         4600                 CRISIL AA+/Stable
Bonds                                                              1100                 CRISIL AA+/Stable
Lower Tier-II Bonds                                                 500                 CRISIL AA+/Stable
Long-Term Bank Facilities                                          4000                 CRISIL AA+/Stable
Commercial Paper Programme                                         26000                   CRISIL A1+

Rating History
         Date                     Rating           Outlook                         Rating action

June 2018             CRISIL AA+/FAAA/CRISIL A1+    Stable    Ratings reaffirmed

June 2017             CRISIL AA+/FAAA/CRISIL A1+    Stable    Outlook revised

March 2016            CRISIL AA+/FAAA/CRISIL A1+   Negative   Outlook revised

December 2013         CRISIL AA+/FAAA/CRISIL A1+    Stable    Ratings on long-term debt instruments and fixed
                                                              deposit programme upgraded

    July 2013         CRISIL AA/FAA+/CRISIL A1+    Positive   Outlook revised

February 2010         CRISIL AA/FAA+/CRISIL A1+     Stable    Ratings on long-term debt instruments and fixed
                                                              deposit programme downgraded

December 2009                                         -       Ratings on long-term debt instruments and fixed
                      CRISIL AA+/FAAA/CRISIL A1+              deposit programme placed on ‘Ratings Watch with
                                                              Developing Implications’

April 2009            CRISIL AA+/FAAA/CRISIL A1+   Negative   Outlook revised

September 2004        CRISIL AA+/FAAA/CRISIL A1+    Stable    Ratings on long-term debt instruments and fixed
                                                              deposit programme upgraded

September 2003        CRISIL AA/FAA+/CRISIL A1+     Stable    -

August 2002                  CRISIL AA/FAA+           -       -

July 2002                         FAA+                -       Rating on fixed deposit programme upgraded

October 2000                      FAA-                -       Rating on fixed deposit programme upgraded

December 1999                      FA+                -       Rating on fixed deposit programme upgraded

December 1998                      FA-                -       Rating on fixed deposit programme downgraded

September 1995                     FA                 -       -

8
Board of Directors:
The Board constitutes 10 members: three non-executive directors, six independent directors, and the
managing director and chief executive officer (CEO).
Name Designation Profile
Non-executive He is the managing director and CEO of Punjab National Bank. Before that, he
chairperson was the executive director of Corporation Bank. He started his banking career as
an Agriculture Field Officer at Allahabad Bank in 1982 and has worked in various
Mr Sunil Mehta
(PNB nominee; administrative and functional capacities at branches, zonal offices, and the head
office. He has held various important positions in agriculture, retail, credit, and
Since May 12, 2017) planning and development. He has over 35 years of experience in banking.
He is a member of Nomination and Remuneration Committee, Corporate Social
Responsibility Committee, and Risk Management Committee. He is currently the
Non-executive executive director of PNB. Prior to this, he served at Allahabad Bank in various
director capacities at Industrial Finance Branch, Mumbai, Lead District Office, and various
Mr L V Prabhakar
(PNB nominee; Since Zonal Offices. He worked at Corporate Office as the head of various important
August 9, 2018) verticals viz., Information Technology, Retail Banking, Priority Sector Credit,
MSME Credit, Financial Inclusion, Human Resource Development, and Integrated
Risk Management.
He is a member of Risk Management Committee and Nomination and
Non-executive Remuneration Committee. He was the president of Citibank Japan and the
director chairman of CitiCards Japan KK and CitiFinancial Japan KK. He was also the head
of retail banking for Citibank in Asia, the head of international personal banking for
(Carlyle Group Citibank in New York, and the head of Citibank’s global transaction services at
Mr Sunil Kaul
nominee; Citibank, Japan. He is presently the managing director of Carlyle Singapore
Investment Advisors Pte Ltd and the head of South East Asia for the financial
Since: March 5, services sector of the Carlyle Asia Buyout Advisory Team and concurrently heads
2015) the financial services sector for the team in Asia. He has over 30 years of
experience in private equity and corporate and consumer banking.
He heads the Credit Committee of Board. He is also a member of Risk
Independent director Management Committee. He has served as a member of the Beta Gamma Sigma
Mr Shital Kumar
Jain (Since: August 14, Society of the Indiana University chapter. Before joining the PNB Housing board,
2014) he worked with Citibank in Hong Kong, Taiwan, the Philippines, and Canada. He
has more than 31 years of experience in banking.
He is the chairman of the Corporate Social Responsibility Committee and a
Independent director member of Nomination and Remuneration Committee. He has been the executive
Mr R
(Since: October 7, vice chairperson of Cognizant India since December 1, 1994, and earlier worked
Chandrasekaran
2015) with Tata Consultancy Services for over 9 years. He has over 31 years of
experience in information technology.
He is the former president of The Institute of Chartered Accountants of India and
Independent director has been a member since 1985. He is senior partner at Khimji Kunverji & Co.,
Mr Nilesh S Chartered Accountants, Mumbai since 1985. He has over 30 years of experience
Vikamsey (Since: April 22, in auditing, taxation, corporate and personal advisory services, business and
2016) management consulting services, due diligence, valuations, inspections, and
investigations.
9He heads the Risk Management Committee. He is also a member of Audit
Committee of Board. He is a Professor of Finance at The Xavier School of
Management, Jamshedpur, and was a professor at the Management Development
Independent director Institute, Gurugram. He was a director at The Institute of Chartered Accountants
Prof (Dr) Gourav
(Since: April 22, of India. He has worked with the National Institute of Bank Management, a Reserve
Vallabh
2016) Bank of India (RBI) undertaking. He has more than 15 years of industry and
academic experience and has published more than a dozen research papers in
referred academic journals and presented papers in many national and
international academic conferences.
He is a member of the Stakeholders Relationship Committee, Credit Committee of
Board, and Corporate Social Responsibility Committee. He is a member of The
Institute of Chartered Accountants of India, 1977 batch. He has also served as the
Regional Council Member of Central India Regional Council of The Institute of the
Independent director Chartered Accountants of India. He has been a government nominee on the board
Mr Ashwani Kumar
(Since: May 12, of joint sector companies and an RBI nominee on the boards of various banks. He
Gupta
2017) is also associated with various charitable trusts and organisations. He is
experienced in the management of corporate finance, planning, treasury, issue
management, merchant banking, company law matters, taxation, and
implementation of expansion activities. He has over 34 years of experience in
finance, treasury, real estate, and securitisation, and reconstruction of assets.
She is the chairperson of the Audit Committee of Board and Stakeholders
Relationship Committee. She is the former chairperson and managing director of
Allahabad Bank and executive director of Vijaya Bank. She started her stint in
Ms Shubhalakshmi Independent director banking with Bank of Maharashtra. She has undergone trainings and courses at
Panse (Since: July 7, 2017) various prestigious institutes. She has over 38 years of experience in banking,
particularly in corporate credit appraisal, credit monitoring, NPA management,
planning, project appraisal, as well as in economics, finance, and information
technology.
He is the member of Credit Committee of Board, Stakeholders Relationship
Committee, Corporate Social Responsibility Committee, and Risk Management
Committee. Before his current assignment, he worked for large corporate houses
such as HDFC Ltd, ABN Amro Bank NV, and AIG United Guaranty. He is an
Managing director independent director at India Shelter Finance Corporation Ltd, where he also
heads the Audit Committee of the Board and is on the NPS Committee of the PFRA
Mr Sanjaya Gupta (Since: June 25, to advise on investment in the housing sector. He was a nominee director for ADB
2010) on the board of Satin Creditcare Network Ltd and the board of HDFC Maldives. He
is also a Fellow of the Royal Institution of Chartered Surveyors. Throughout his
career of over 32 years, he has contributed to the expansion of the mortgage
industry and allied risk management products across India. He is often consulted
by policymakers for key changes in the sector.
10Top Management
Name Designation Profile
Mr Sanjaya Managing He is the member of Credit Committee of Board, Stakeholders Relationship Committee,
Gupta director Corporate Social Responsibility Committee, and Risk Management Committee. Before his
current assignment, he worked for large corporate houses such as HDFC Ltd, ABN Amro Bank
NV, and AIG United Guaranty. He is an independent director at India Shelter Finance
Corporation Ltd, where he also heads the Audit Committee of the Board and is on the NPS
Committee of the PFRA to advise on investment in the housing sector. He was a nominee
director for ADB on the board of Satin Creditcare Network Ltd. and on the board of HDFC
Maldives. He is also a Fellow of the Royal Institution of Chartered Surveyors. Throughout his
career of over 32 years, he has contributed to the expansion of the mortgage industry and allied
risk management products across India. He is often consulted by policymakers for key changes
in the sector.
Mr Shaji ED- Business Mr Shaji Varghese has more than 23 years of experience in retail assets, liabilities, and wealth
Varghese development management. He has been an integral contributor in setting up large successful businesses
across geographies and managing high performance teams. His forte is retail distribution and
managing sustainable and profitable businesses. Prior to this assignment, he was the senior
vice president and business head of Secured Assets at IndusInd Bank. He has also handled
assignments with leading financial institutions and banks such as ABN AMRO Bank NV, ICICI
Bank Ltd, and Transamerica Apple Distribution Finance Ltd. He holds a Bachelor’s degree in
Law (LLB) and a Master’s degree in Management Science (MMS).
Mr Ajay Gupta ED- Risk Mr Ajay Gupta holds a Bachelor’s Degree in Commerce from the University of Delhi. He is also
management a Chartered Accountant from ICAI. He is an accomplished risk management professional with
over 28 years of experience in credit cycle management across a diverse product group
comprising SME loans, LAP, home loans, builder finance, construction equipment loans,
commercial vehicle loans, business/personal loans, and auto lease. His areas of expertise
include credit policy and underwriting, collection management, fraud control, risk analytics, and
portfolio management. He has worked with Religare Finvest Ltd as director and CRO, India
Bulls Financial Services as risk head, and has also served GE Money, ANZ Grindlays Bank,
and Standard Chartered Bank in various roles.
Mr Kapish Jain Chief financial Mr Kapish Jain is a business-focused, solution-oriented finance professional with more than 21
officer years of experience in the BFSI sector. He has a strong analytical mind and rich experience
across all facets of finance: treasury, business planning and MIS, accounts, audit, secretarial,
and compliance. He is a qualified rank holder Chartered Accountant, Company Secretary, and
Cost Accountant. Previously, he was chief financial officer and principal officer at Xander
Finance. Before that, he has held various assignments with leading finance organisations and
banks such as AU Small Finance Bank, ICICI Prudential Life Insurance, and Deutsche Bank.
Mr Nitant Desai Chief Mr Nitant Desai is an astute professional with more than 34 years of varied and relevant
operations and experience in retail finance with leading banks and financial institutions in India and the Middle
technology East. He has extensive knowledge of operations management, client servicing, quality and
officer compliance, and business process reengineering. Prior to PNB Housing, he worked with
reputed organisations such as HDFC Life Insurance Co Ltd, Union National Bank – Abu Dhabi,
ICICI Bank Ltd, GE Countrywide, TATA Finance Ltd, and HDFC Ltd.
Mr Anshul Chief people Mr Anshul Bhargava is a dynamic and result-oriented HR professional with over 26 years of
Bhargava officer experience. He has excellent understanding and domain expertise in a variety of spheres
relating to human capital. He has keen interest in mentoring and training, performance
management, and cadre building. His last assignment was with Asset Reconstruction Company
(India) Ltd. He has also served the Indian Army.
Mr Sanjay Jain Company Mr Sanjay Jain is a professional with more than 30 years of experience as Company Secretary,
Secretary and in corporate finance, treasury, regulatory compliances, legal issues and internal audit. He has
head of held various positions in PNB Housing in the past two decades. He is a fellow member of
compliance Institute of Companies Secretaries of India and Bachelor of Law from the University of Delhi.
Before joining PNB Housing, he worked for 7 years with a leading construction group.
11Awards and recognition
2013 2016
2017
122018
Conferred bronze award at the SKOCH Awards 2018.
The award was felicitated for uConnect, a Bagged award at Trescon BIG 50 BFSI Leaders
collaboration service platform for underwriting Awards. The award recognises leaders who identify
partners. need of the hour and leverage emerging
technologies to provide holistic solutions
Winner at the Economic Times Innovative Tribe
Awards 2018: Winning trophy in BFSI category for its
innovative digital solution iBox.
2019
PNB Housing Annual Report wins Bronze at 58th
Mr. Gupta recognised as one of the ‘Most Promising PNB Housing Finance bags Gold in ‘Home Loan Annual Awards Nite organised by ABCI
Business Leaders of Asia 2019’ at the Economic Times provider of the year 2018’s
Asian Business Leaders Conclave
1314
Managing Director
Company Secretary & Centralized Finance &
Risk Management Internal Audit Business HR & GAD
Compliance Operations & IT Accounts
Recovery
CSO
Credit Legal Treasury & Accounts, HR GAD
CF - Tech Corporate Planning
CF-Sales Retail - Sales Branch Customer Taxation &
Service & Operations Expense
CF- Ops
L&D CSR
Technical Legal - Retail FD Product & Marketing IT
FCU CF - UW COPs & CPC
Contact Center
Investor
Relations
Analytics Centralized Customer Service Process & Quality
Zonal Credit Manager Internal Zonal Business Head
Auditor
Zonal IT Zonal HR Zonal GAD
Zonal Technical CF- Sales
Manager
Zonal L&D
Internal Legal Zonal Recovery
Counsel Manager Zonal Head - Operations
Zone
& Accounts
Zonal Fraud Control Zonal Manager -
Operations & Accounts
Regional Credit Manager State/Regional Business Head
PNB Housing’s Organisation Structure
Regional Technical
Manager
ACM/BCM
Regional Recovery
Manager
Internal Legal
HUB
Counsel
Area Recovery
Regional Fraud Manager
Control
Branch Business Head
Manager Customer Service and Operations
Branch
Relationship Manager - Customer Service Manager - Customer Service Manager -
Incharge - Recovery Area Sales Manager
Deposit Loans Deposit
S+1 Reporting S+2 Reporting Matrix ReportingSummary Credit Risk Profile
Business Risk Profile Financial Risk Profile
Market Position Capital Adequacy
• Among top five HFCs by AUM and the • Comfortable capitalisation, with networth
second largest HFC by deposit and capital adequacy ratio (CAR) of Rs
outstanding. 6,920 crore and 14.9%, respectively, as on
September 30, 2018.
• AUM grew 43% (y-o-y) to Rs 73,482 crore
as on September 30, 2018; company to • Adjusted gearing increased to 10.2 times
maintain higher-than-industry average (gearing 9.2 times) as on September 30,
growth over the medium term. 2018, from 8.1 times (gearing 7.7 times) a
year earlier. Over the medium term,
• AUM comprised housing loans (58%),
adjusted gearing is expected at 11-12
construction finance (12%), LAP (16%),
times (gearing: 10-11 times) on a steady
LRD (6%), NRPL (3%), and CTL (5%) as on
state basis.
September 30, 2018.
• Comfortable networth coverage of net
• Portfolio is well diversified across India;
non-performing assets (NPAs) provides
with western, northern and southern India
cushion against asset-side risks.
contributing 38%, 32% and 30%,
respectively, as on September 30, 2018
Asset Quality Earnings
• Robust credit underwriting, monitoring, • Average earnings with return on assets
and collection processes. Two-year lagged (RoA, annualised) of 1.5% in the first half
gross NPAs (based on loan assets) were of fiscal 2019. Profitability to remain in
comfortable at 0.93% as on September 30, line with the industry average over the
2018, which is half of the industry average near term.
(HFC average: 1.9%), supported by
• Profitability expected to improve
improved systems and processes.
gradually over the medium term,
• NPA in the wholesale segments, primarily supported by enhanced operating
construction finance and corporate term efficiency with ramp-up of operations.
loans (together accounting for around 17%
• NIMs are expected to benefit from the
of the loan book), is low (nil as on
high proportion of high-yield non housing
September 30, 2018); performance over a
retail loans. However, this will be partially
longer period remains to be seen.
offset by the impact of competition on
• Ability to maintain comfortable asset yields in the salaried housing loan
quality over the medium term as the loan segment.
book seasons will remain a key
monitorable.
15Resources Liquidity
• Well-diversified resource profile • Adequate asset-liability management (ALM)
comprising bank loans, bonds, debentures, profile with no negative cumulative
fixed deposits, NHB refinance, ECBs, and mismatches in up to 1 year bucket.
Securitisation (through DA route). Better
• Policy of maintaining unutilised bank
than peers’ cost of borrowing.
lines/liquid investments.
• Second largest deposit base among HFCs,
• Adequate unutilised lines (including
with deposits constituting 20% of
securitisation, ECB, term loans, and overdraft
borrowings as on September 30, 2018.
lines) of Rs 12,550 crore as on September 30,
• Significant increase in focus on relatively 2018, along with liquid investments of Rs
stable fixed deposits over the past 2 years 4368 crores and SLR investments of Rs 1,281
will lend stability and diversify the investor crores
profile.
Management
• Management has strong domain knowledge and established track record; instrumental in
transformation of PNB Housing into a professionally managed company. Stable management
with attrition in the top 100 employees being 3.2%.
• Successful implementation of Project Kshitij (BPR exercise) to aid high growth and risk
orientation of the management
Brand-sharing benefits from the parentage of PNB
• PNB Housing continues to benefit from branding support from its parent, PNB (33% ownership
currently)
16Detailed Credit Risk Profile
Market Position
Chart 7 – Trend in Disbursement
33,195
20%
20,639
18172
Rs crore
14,456 15179
9,440
5,500
2014 2015 2016 2017 2018 H1 FY18 H1 FY19
PNB Housing’s disbursements surged to 57% between fiscals 2014 and 2018, reaching Rs 33,195 crore
in fiscal 2018 from Rs 5,500 crore in fiscal 2014. This was driven by branch expansion and
technological advancement that helped bring in efficiency by speeding up turnaround time (TAT).
Growth in disbursements has remained healthy in the first half of the current fiscal, growing at 20%
year-on-year. It has also led to a strong growth in AUM in the 5 years through March 31, 2014 to March
31, 2018, with AUM reaching Rs 62,252 crore as on March 31, 2018, and Rs 73,482 crore as on
September 30, 2018, growing by 36% (annualised) September over March. PNB Housing has become
the fastest-growing large HFC in India.
Chart 8 – Trend in AUM
80,000 73,480
70,000 62252
60,000
50,000 41492
Rs crore
40,000 Annualised
30,000 27,555
growth
20,000 17,293 rate: 36%
10,591
10,000
-
Mar- Mar- Mar- Mar- Mar- Sep-
14 15 16 17 18 18
Non-Residential Premises Loans
367 596 1,044 1,451 2,155 2,553
(NRPL)
Corporate Term Loans (CTL) 295 307 909 1,679 2,699 3,578
Lease Rental Discounting (LRD) 273 562 1,198 2,076 3,001 4,039
Construction Finance (CF) 613 1,611 2,465 4,382 7,727 8,696
Retail Loan Against Property (LAP) 2,195 3,392 4,911 7,037 10,120 11,902
Housing 6,848 10,826 17,029 24,868 36,549 42,712
*above LRD including Retail LRD +Wholesale LRD
CRISIL believes PNB Housing will maintain above-industry-average growth over the next few years,
which will result in an increase in its market share in the highly competitive industry.
17Chart 9 – Portfolio Constitution* Chart 10 – Geographical Split*
16%
12%
6% 30%
32%
5%
3%
58%
38%
Housing CF Retail LAP LRD CTL NRPL North West South
*based on AUM as on March 31, 2018
Over the medium term, PNB Housing is likely to maintain the segmental AUM break-up.
• Within the housing loan segment, focus remains on sourcing business from employees of
reputed/medium/large corporates. In the home loan portfolio, salaried segment accounted for
69% of loan book as on September 30, 2018, compared to 67% as on March 31, 2018.
• About 31% of the incremental housing loan business continues to be from self-employed:
higher-income individuals with relatively larger ticket-size loans and better debt servicing
capacity. The company also intends to focus on the mass housing segment given the strong
demand potential and impetus given to the sector by the Government of India.
• In line with target customer and product strategy, PNB Housing expanded its branch network to
96 by September 30, 2018 and opened 12 new branches in the first half of fiscal 2019.
PNB Housing is among the top five and the fastest-growing large HFCs, the second largest by
depositor base, in India. However, it faces intense competition from banks and other HFCs, given
their strong focus on mortgage finance. Nevertheless, CRISIL believes PNB Housing is well poised
to continue to report higher than industry average growth in AUM.
18Asset Quality
PNB Housing’s gross NPAs (GNPAs) have remained better than the industry average, supported by
complete revamp of the business model and strong credit underwriting, monitoring, and collection
mechanisms. Its GNPAs and 2-year lagged GNPAs, at 0.45% and 0.93%, respectively, as on September
30, 2018, were better than the industry average. The 2-year lagged GNPAs for HFCs stood at 1.9%, as
on September 30, 2018
Chart 11 – Trend in Gross NPAs
1.00 0.93
0.85
0.80 0.68
0.56
0.60 0.52 0.52
0.45
%
0.40 0.33
0.32
0.20 0.22 0.22
0.20
-
Mar-14 Mar-15 Mar-16 Mar-17 Mar-18 Sep-18
Gross NPA 2 year Lagged Gross NPA
Chart 12 – Segment wise Gross NPAs
Based on Portfolio
NRPL 0.28% Rs 2,520 crores
CTL 0.00% Rs 3,568 crores
LRD 0.11% Rs 4,027 crores
CF 0.00% Rs 8,696 crores
Retail
0.60% Rs 11,019 crores
LAP
Housing 0.60% Rs 36,963 crores
0.00% 0.20% 0.40% 0.60% 0.80%
Even on a segmental basis, GNPAs remain comfortable. However, the impact of seasoning is yet to be
seen as, given the strong growth in recent years, nearly 78% of the loan book is relatively new, having
been on the books for less than 24 months. Furthermore, given the rising proportion of large-ticket
wholesale loans, asset quality performance in this segment remains to be seen. Strong credit
underwriting, monitoring, and collection mechanisms support its asset quality:
19• Centralised hubs for standardised credit decision-making process.
• Underwriting team strengthened by induction of qualified and experienced subject matter
experts.
• Dedicated team at the head office for underwriting corporate finance.
• Regular review of all large value loans and the delinquent portfolio.
• Focused risk management team for monitoring the portfolio risk characteristics; detailed
portfolio analysis on a regular basis for quality evaluation.
• Regular portfolio review by the Credit Committee of Board to identify early warning signs.
• Streamlined collection process through centralised recovery monitoring, dedicated collection
resources at branches, and regular follow-up in addition to various digitised means implemented
to correct operational risk/frauds, such as know-your-customer norms and Hunter application.
Furthermore, PNB Housing’s average weighted loan-to-value (LTV) ratio across segments is
comfortable.
Chart 13 – Segment wise LTVs
Retail Non-retail*
70% 66% 66% 66%
61%
49%
Housing LAP NRPL CF CTL LRD^
*average security cover of around 1.5-2.5X during the tenure of the loan
^Retail LRD LTV is 41%
CRISIL believes PNB Housing’s focus on strengthening and standardising its systems and processes
has started to yield benefits. On a 2-year lagged basis, GNPAs stood at 0.93%, which is half the
industry average (1.9%). PNB Housing has revamped its business model and has put in place strong
credit underwriting, monitoring, and collection mechanisms to support asset quality. While the
current level of NPA in the corporate finance, primarily construction finance and corporate term
loans (together accounting for around 17% of the loan book), was nil as on September 30, 2018,
performance over a longer period remains to be seen. Hence, PNB Housing's ability to maintain its
comfortable asset quality over the medium term as the loan book seasons will remain a key
monitorable.
20Resources
The company has a well-diversified borrowing mix, both in terms of investors and instrument type. As
of September 30, 2018, PNB Housing met its funding requirement through multiple sources, including
term loans from banks and financial institutions, deposits, ECBs, commercial paper, refinancing from
NHB, non-convertible debentures (NCDs), zero coupon bonds (ZCBs), and unsecured subordinated
debt. The company has built strong relationships with its lenders. Even post September 30, 2018, it
has managed to raise funds including Rs 13,075 crore of commercial paper (for rollover of maturities),
refinance from NHB of Rs 3,500 crore, and ECB of USD 465 million (~Rs 3,325 crore) under automatic
route.
As on September 30, 2018, PNB Housing’s lenders included lending institutions across public, foreign,
and private sector banks, mutual funds, insurance companies, provident funds, gratuity funds,
pension funds, superannuation funds, foreign portfolio investors, and multilateral institutions such
as ADB and IFC.
Chart 14 – Resource profile
10,291 16,751 26,159 35,657 54,268 63,627
4 2 4 3 3
100%
10
9 12 12
19 19
80% 15 11 8 6
8 7
20
60% 27 28 21
41 27
8 22
7
40% 22 8
20% 36 41 42 37
34
27
0%
Mar 14 Mar-15 Mar 16 Mar 17 Mar 18 Sep 18
As on
Bond & Debentures Bank Loans Fixed Deposits
NHB Refinance Commercial Paper ECB
Note: figures in boxes represent total borrowing in Rs crore
A significant proportion of the company’s funding is long term to match the long tenure of its loan
portfolio. It has increased its focus on mobilising stable retail fixed deposits by making significant
investment in building teams, technology, and systems, also enhancing customer service. It is one of
the few HFCs to have a sizeable proportion of stable retail fixed deposits and plans to increase the
share of deposits in the near term.
21Chart 15 – Trend in deposits
12,458
11586
9987
15%
Rs crore
7121 annualised
growth
4897
1712
Mar 14 Mar-15 Mar 16 Mar 17 Mar 18 Sep 18
In fiscal 2019, PNB Housing availed refinance of Rs 3,500 crore (Rs 1,500 crore in the previous fiscal)
from NHB. These are long-term funds raised for 7 to 15 years. The outstanding refinance from the NHB
as on January 31, 2019, was Rs 6,521.57 crore (Rs 2,570 crore a year earlier), all secured by
hypothecation of specific loans/book debts against which refinance has been availed.
The company has ECBs of USD 250 million in the form of term loan facilities from IFC and ADB, raised
under RBI’s low-cost, affordable housing scheme. The proceeds have been utilised for financing
prospective owners of low-cost affordable housing units. The ECBs have an average tenure of 5 years,
and the foreign exchange risk on the principal has been hedged in accordance with the guidelines
prescribed by RBI.
In addition, the company raised ECBs of USD 465 million in the current fiscal year from foreign
branches of Indian Nationalised Banks.
The company also issued ZCBs of Rs 889 crore in fiscal 2018 and Rs 300 crore till September 2018 in
fiscal 2019.
In the current fiscal, PNB Housing down-sold loans amounting to Rs 5,849 crore, comprising a mix of
housing loans and retail LAP loans, under direct assignment route to four large institutions. The
company is likely to continue to explore further down-selling of quality assets, which will help bring
down leverage and cost of funds.
Amid all these efforts, PNB Housing’s cost of borrowing was stable at 7.9% for the first half of fiscal
2019.
22Chart 16– Trend in Cost of Borrowing*
10.0 9.3 9.3
8.7 8.6
9.0
7.9 7.9
8.0
%
7.0
6.0
5.0
2013-14 2014-15 2015-16 2016-17 2017-18 H1FY19
For the period
Borrowing cost
*based on yearly average
Further, PNB Housing has managed to attract a diversified set of investors for the issuances.
Chart 17 – investors in bonds
Central Government 1
Financial Institutions 2
Non Resident Indians 3
Other Bodies Corporate 8
Non Nationalised Banks 8
Nationalised Banks 9
Mutual Fund 17
Insurance Companies 20
Trusts 32
0 5 10 15 20 25 30 35
Chart 18 – investors in CP
Others
7%
Banks
34%
Mutual
Fund
59%
Mutual Fund Banks Others
CRISIL believes PNB Housing will maintain a well-diversified resource profile and competitive
borrowing cost over the medium term.
23Capitalisation
Chart 19 – Trend in Net worth and Net worth to Net NPAs
8,000 14.0
12.4
7,000 11.0 10.9 12.0
10.2
6,000 12.2 9.4 PNB Housing has comfortable
11.0 10.0
10.6 capitalisation metrics: networth,
5,000
6.9 Tier-I, and overall capital
Rs. Crore
9.2 8.0
Times
4,000 8.6
adequacy ratio (CAR) were Rs
6.0
3,000 6.4 6,920 crore, 11.4%, and 14.9%,
4.0 respectively, as on September 30,
2,000
2018.
1,000 2.0
935 1581 2146 5577 6306 6920
- 0.0
Mar-14 Mar-15 Mar-16 Mar-17 Mar-18 Sep-18 Adjusted gearing1 (including
As on securitisation) was 10.2 times as
Adjusted Networth (LHS) Adjusted Gearing (RHS) on September 30, 2018. PNB
Housing plans to maintain
Chart 20 – Trend in Capital Adequacy Ratios adjusted gearing between 11-12
times (gearing of 10-11 times) on a
25.0 steady-state basis over the
21.6
medium term.
20.0 16.7
15.0 13.4 13.8 12.7
14.9 PNB Housing had high networth
%
16.5 coverage of net NPAs at 30 times
11.4 as on September 30, 2018,
10.0 12.8
10.4 providing adequate cushion
10.4
5.0 9.0 against asset-related risks.
0.0
Mar-14 Mar-15 Mar-16 Mar-17 Mar-18 Sep-18
As on
Overall CAR Tier 1 CAR
CRISIL believes PNB Housing’s successful listing has enhanced its ability to raise equity capital and
will regularly support its ambitious growth plan, improve accretion to networth, and maintain
steady-state adjusted gearing at 11-12 times.
1
Gearing: 9.2 times as on September 30, 2018
24Earnings
Chart 21 – Trend in RoA and RoE
2.0 17.5 20.0
16.3 15.6 1.6
1.4 1.5
1.5 15.0
14.0
1.3 15.4
1.0 1.3 1.3 13.6 10.0
%
%
0.5 5.0
0.0 0.0
2013-14 2014-15 2015-16 2016-17 2017-18 H1 FY19
Return on assets (LHS) Return on Equity (RHS)
Chart 22- RoA breakup for first half of fiscal 2019
0.8%
0.3%
0.7%
3.3%
1.5%
NIM Opex* Credit Cost Tax Post-Tax RoA
* Including cost of acquisition
PNB Housing’s return on assets (RoA) stood at 1.5% (annualised) for the first half of fiscal 2019
compared to 1.6% for fiscal 2018 owing to compression in NIMs amidst need for maintaining excess
liquidity and intensifying competition from banks.
Operating expenses are high due to investments in infrastructure, systems and processes, and
people to support its strong growth plan. However, over the medium term, operating costs are
expected to improve as investments in technology and newly opened branches achieve economies of
scale.
25The credit costs for PNB Housing have remained low over the 5 years through fiscal 2014-2018.
Chart 23– Break up of credit costs
33
16
Rs crore
87
4 19 14
5
52 23
1 64
6 63
31 45
25 15
Mar-15 Mar-16 Mar-17 Mar-18 Sep'18
Provision for contingency Standard Asset Provision NPA Provision Others*
* Others includes write offs, provision for diminution in investment value and provision on stock of acquired property
Chart 24– Trend in credit costs
0.37%
0.33% 0.32%
0.31%
0.28%
0.25%
Mar-14 Mar-15 Mar-16 Mar-17 Mar-18 Sep-18
As a prudent measure, PNB Housing’s provision for contingency stood at Rs 146 crore as on
September 30, 2018, as a steady-state provision for unforeseeable macro-economic factors.
CRISIL believes PNB Housing's profitability will improve gradually, with RoA increasing to 1.7-1.8%
over the medium term, driven by economies of scale. However, while credit costs have been low till
date, even including the additional voluntary provisions made by the company, the ability of the
company to manage asset quality, especially in the mass affluent non-retail portfolio, will be a key
determinant of profitability
PNB Housing’s ability to scale up operations to leverage significant upfront investments while
maintaining asset quality, and hence controlling credit costs, will be key to achieving gradual
improvement in earnings.
26ALM and Liquidity
PNB Housing has an adequate ALM profile, with no negative cumulative mismatches in maturity
buckets of up to 1 year as on September 30, 2018. Positive cumulative mismatches in the first maturity
bucket of up to 30 days are supported by liquid investment and unutilised sanctioned overdraft lines
from banks.
The ALM process involves close monitoring of mismatches in asset-liability to ensure that there is no
imbalance or excessive concentration on either side of the balance sheet beyond the permissible and
defined threshold. Being a board-nominated committee, Asset-Liability Committee (ALCO) closely
reviews the external interest rate, liquidity scenario, asset portfolio, lending rates, borrowing profile,
and cost of funds on a periodic basis and provides directions and broad framework of operations to
the treasury and business team.
The ALM position of the company is based on the maturity buckets as per the guidelines issued by
NHB. In computing this, the relevant assumptions, estimates, and adjustments are made by the
management in line with past trends and expected performance of the loan assets currently in the
book. In this regard, an asset is calculated on the basis of behavioural maturity and a liability is
calculated on the basis if contractual maturity. Hence, these shall not be in line with what has been
reported in the audited financials since they are all based on contractual maturities of assets as well
as liabilities.
PNB Housing Finance under direction of its risk management committee also tracks liquidity & ALM
through multiple voluntary ALM & Liquidity Ratios.
PNB Housing has a policy of maintaining unutilised bank lines/liquid investments to meet cash
outflow over the next 2 months.
• PNB Housing had adequate bank line of Rs 4,950 crore as on December 31, 2018, of which Rs 4,412
crore was utilised(Incl. sublimits for short term loans), along with bank balance of Rs 4,740 crore.
• In addition, the company had investment in Statutory Liquidity Ratio (SLR) securities of Rs 1,311
crore against a requirement of Rs 1,280 crore, and current investment of Rs 1,267 crore as on
December 31, 2018.
27Management PNB Housing is managed by an independent and stable management team. The management team, under the leadership of Mr Sanjaya Gupta, has played a key role in transforming PNB Housing's business model and improving its performance over the past 8 years. The top management team has strong domain knowledge and average experience of over 25 years in the mortgage business with leading private sector financial services companies. Experienced professionals from the industry have been inducted to lead business verticals. About 65% of the employees are post graduates or have professional qualifications. PNB Housing’s focus is on building capacity, improving efficiency, and fostering a performance-driven culture across the organisation. Brand-sharing benefits from the parentage of PNB PNB Housing continues to benefit from branding support from its parent, PNB (33% ownership), which has started the process of selling its stake in PNB Housing, whose timelines and subsequent change in promoter shareholder remain key monitorables. The company is managed by an independent management team, comprising professionals with strong domain knowledge and extensive experience in the mortgage business. 28
Key Financials
As at / For the Year ended March 31                                                2018           2017     2016     2015     2014

Total loan disbursements                                             Rs crore    33,195          20,639   14,456    9,440    5,500

Assets under Management                                              Rs crore    62,252          41,492   27,555   17,297   10,591

Loan Assets                                                          Rs crore    57,014          38,531   27,177   16,819   10,591

Off-balance sheet assets                                             Rs crore     5,238           2,961     378      521         -

Equity capital                                                       Rs crore       167            166      127      104       66

Reported networth                                                    Rs crore     6,306           5,577    2,146    1,581     935

Total borrowing (including securitisation)                           Rs crore    59,506          38,618   26,537   17,272   10,289

Total assets                                                         Rs crore    63,799          42,960   29,671   19,033   11,530

Interest income                                                      Rs crore     5,123           3,640    2,544    1,671    1,056

Other Income                                                         Rs crore       394            268      152      106       60

Total income                                                         Rs crore     5,517           3,908    2,696    1,777    1,116

Interest expense                                                     Rs crore     3,531           2,644    1,860    1,265     801

Operating expenses                                                   Rs crore       509            357      248      178      109

Credit costs                                                         Rs crore       199            103       81       38       30

Profit after tax                                                     Rs crore       829            524      326      196      127

Ratios

Interest income/ Average total assets                                  %            9.60          10.02    10.45    10.88    10.82

Interest expense/Average borrowings                                    %            7.90           8.60     8.70     9.34     9.32

Cost to income#                                                        %          25.61           28.24    29.66    34.75    34.50

Cost to income (net of cost of acquisition)*                                        19.5           22.4     25.2     30.9     30.8

Operating expenses/Average total assets                                %            0.95           0.98     1.02     1.16     1.11

PAT/ Average total assets                                              %            1.55           1.44     1.34     1.28     1.30

PAT/ Average adjusted networth                                         %          13.96           13.57    17.49    15.59    16.33

Gross NPA                                                              %            0.33           0.22     0.22     0.20     0.32

Gross NPA ( 2-year lagged)                                             %            0.68           0.52     0.56     0.52     0.85

NNPA                                                                   %            0.25           0.15     0.14     0.07     0.20

Capital adequacy                                                       %          16.67           21.59    12.70    13.76    13.40

Gearing                                                                Times        8.61           6.39    12.19    10.59    11.01

Total adjusted gearing (including securitisation)                      Times        9.44           6.92    12.37    10.92    11.01

#Cost to income ratio is calculated as: operating expense/ (Total Income-Interest Expense)*100
*as reported by the company

                                                                                                                                29
Sep-18 Sep-17 Total Loan Disbursements Rs crore 18,172 15,179 Assets Under Management Rs crore 73,482 51,320 Equity Capital Rs crore 168 167 Reported Net Worth Rs crore 6,920 5,880 Total Adjusted Borrowing (including Securitisation) Rs crore 70,316 47,643 Total Assets Rs crore 73,630 53,740 Interest Income Rs crore 3,136 2,319 Total Income Rs crore 3,457 2,434 Interest Expense Rs crore 2,329 1,589 Total Income (net of interest expenses) Rs crore 1,128 845 Operating Expenses Rs crore 272 218 Provisioning Costs Rs crore 109 143.72 Profit After Tax Rs crore 509 360 Ratios PAT/Average Total Assets % 1.5 1.6 PAT/Average Adjusted Net Worth % 15.4 13.7 Gross NPAs % 0.45 0.34 Net NPAs % 0.35 0.27 Overall Capital Adequacy Ratio % 14.9 18.4 Reported Gearing Times 9.2 7.7 Adjusted Gearing (including Securitisation) Times 10.2 8.1 30
Annexures
Product Overview

•   PNB Housing provides retail housing loans for construction, purchase, repair, and upgrade of
    houses. It also provides retail LAP, loans for commercial property, and loans for purchase of
    residential plots. On the corporate finance front, it provides construction finance to
    builders/developers and LRD/CTLs to corporates.

                                                     Average Ticket Size                                  Residual Tenor
        As on September 30, 2018                                                        Average LTV (%)
                                                           (Rs Crore)                                        (Years)$

Home Loans Retail                                            0.31                             69.8%            19

Salaried                                                     0.28                             72.7%            20

Self-employed                                                0.40                             63.4%            16

Loan Against Property Retail                                 0.48                             48.8%            13

Salaried                                                     0.24                             50.4%            15

Self-employed                                                0.65                             48.4%            12

NRPL Retail                                                  0.50                             60.6%            13

LRD Retail                                                   4.51                             40.7%            10

Corporate finance

Construction Finance                                        67.56                          66.67%^              3

LRD                                                        165.26                          66.67%^             14

Corporate Term Loan                                         80.78                          66.67%^              5

^average security cover of around 1.5X during the tenure of the loan; $: for fully disbursed cases

                                                                                                                           31
Chart 25 – Occupation-wise portfolio break-up as on September 30, 2018*
5%
5%
Housing loan : salaried
12% Housing loan : self employed
40% Retail LAP: salaried
3% Retail LAP: self employed
NRPL
Construction finance
13%
Corporate term loan
LRD
3%
19%
*based on AUM
Incremental sourcing mixs sourcing mix
Third Party
34%
Third Party
Inhouse Channels
Inhouse
Channels
66%
PNB Housing intends to significantly increase its focus on in-house channels for business; direct
sales team and branches/referrals continue to contribute more than 65% to the overall disbursement
in the first half of fiscal 2019. The company also plans to increase construction finance business
through relationship management with real estate developers.
On August 22, 2017, PNB Housing set up a subsidiary, PHFL Home Loans and Services Ltd. The entity
offers distribution doorstep services for housing loans, property search services, and LAP to
individuals and corporate bodies for home purchase, loan for construction, repair, upgrade of home,
loan for compound space, loan against residence and commercial property. Apart from home loan
products and property services, the company provides distribution of financial solutions to
individuals, covering fixed deposits, life insurance, and credit card.
32Process overview
Loan underwriting and risk structure
• The entire loan appraisal and monitoring process happens through enterprise system solutions.
• Underwriting at hubs: To manage the increasing scale of business and for better control and
standardised processes, PNB Housing follows a hub-and-spoke model. It has 22 hubs fully
equipped hubs (Noida, Bengaluru [3], Jaipur, Chandigarh, South Delhi, Chennai, Hyderabad,
Dehradun, Lucknow, Vijaywada, Kolkata, Kochi, Ahmedabad, Pune [2], Indore, Coimbatore,
Mumbai [2], and Surat) to process the business of 84 branches across India. Each hub has a team
of underwriters and subject-matter experts, such as legal, technical, and fraud containment unit
to manage end-to-end credit processing for all branches within their vicinity. Underwriters have
authority limits as per their experience.
• Technical services group: A group of civil engineers formulates policies and processes to
evaluate projects for home loans, conducts periodic reviews of the approved projects, and
undertakes valuation of non-home loans.
• Legal team: There is a team of internal legal experts for legal verification of all cases.
• Fraud control unit (FCU): A team of experts has been set up to identify frauds in the early stages
of loan processing. PNB Housing has empanelled FCU vendors for its branches. Each hub will
have one FCU expert to strengthen the fraud control process.
Furthermore, with ongoing technological innovations in the lending space, PNB Housing has
introduced various digital initiatives to not only replace some of the physical processes in part/full,
but to also mitigate the risk of fraud.
Enterprise Risk Management practices
The company has formulated a comprehensive enterprise risk management policy to take care of
major risks, such as credit risk, market risk, liquidity risk, legal risk, interest rate risk, and operational
risk. PNB Housing has an integrated risk management policy (IRM) in place, which communicates the
risk management strategy, framework, and risk processes across the organisation, and has been
approved by the board. The risk management framework broadly includes governance, risk appetite
approach, risk-specific guidelines, risk measurement, mitigation, monitoring reporting, and key risk
indicators (KRIs). The company has developed a clearly articulated risk appetite statement, functional
policies, and KRIs to explicitly define the level and nature of risk that an organisation willing to take
in order to pursue the articulated mission on behalf of various stakeholders. The board has delegated
the responsibility of risk management to its risk management committee (RMC), which reviews the
efficacy of our risk management framework, provides important oversight, and assesses whether it is
consistent with the risk tolerance levels laid down. The RMC gives directions to executive risk
management committee (ERMC), comprising senior management.
33Collection process
PNB Housing has created a robust collection mechanism. Some of the initiatives are:
• Increased focus on replacing external agencies with in-house collection resources for better
control and cost effectiveness
• New incentive scheme for recovery executives
• Periodical portfolio scrub through credit bureaus to counter early warning signals
• Development of mobile application framework for collection resources for better supervision
0 dpd 1-29 dpd 30-89 dpd 90-179 dpd 180+ dpd
•Telecalling •Telecalling •Soft dunning letter •SARFAESI notice •SARFAESI notice
•Field Visits •Legal notice under section 13(2) under section 13(4)
•Letters •Field Visit •Banking of security •Physical possession
•Follow-up by post dated cheques
collection agency/in- •Publication in news
house team papers
•Field Visit
•Letters to
Builder/Tenant/
Third party property
occupants
•Property valuation
•Initiate section 138
34ISO certified operations
Central Processing Centre of PNB Housing is an ISO 9001:2015 certified unit. ISO 9001:2015 is the
international standard that specifies requirements for a quality management system. The certificate
was awarded on the basis of first stage assessment, process document review, and certification
assessment conducted by an external audit team.
Benefits of this certification:
• Process documentation and standardisation
• Structural framework for all existing processes
• Consistency in processes leading to operational excellence
• Efficient and effective operational activities
• Continual improvement culture
• Reduction of waste and increase in productivity
The system is maintained by ongoing verification activities, together with appropriate training and
education of those involved and the overall improvements sought. These are monitored as part of the
regular management review of the system.
Digitisation has been initiated for title documents of incremental business, which mitigates
operational and transit risk, reduces retrieval cost, increases data security, and helps improve
customer satisfaction by providing the documents over the counter.
Docket is received at All dockets are Scanned Docket is sealed
the CPC for being opened by CPC documents are and sent to the
sent to the team for scanning verified against storage facility
permanent storage and are uploaded the original docket for permanent
facility to DMS by a checker storage
Digitising of documents makes it easy to preserve, access, and share data in an effective and efficient
manner.
35Scalable operating model and centralised and streamlined operational structure The current operating model for PNB Housing is scaleable, with processing hubs designed to support additional branches, which will help deepen the penetration of key geographies in which PNB Housing is currently active by opening new branches. The branches, processing hubs, and CSO are supported by the COPS and CPC, which provide centralised and standardised backend and administrative activities, payments and processing for the business, relying on the new ESS. Furthermore, centralisation of payments and banking enables timely collection of funds, better fund management, stronger control and early, and proactive alerts to the collections department if there is an overdue payment. The ESS is a configurable and flexible system that integrates all activities and functions within the organisation under a single technology and data platform. This single platform utilises automated and standardised processes. The ESS enables stakeholders, including external service providers, to share information with PNB Housing on a real-time basis, which increases the speed with which loans are processed and improves oversight in their activities and reporting. The ESS is scaleable and is utilised across the entire network, making it easy to replicate in new locations. The COPS, CPC, Outbound contact centre, Inbound contact centre and branch operations are certified under ISO 9001:2015, which is a globally accepted standard on quality management. Housed within the CPC is a modern and innovative document digitisation centre. With the help of cost-effective innovations, all property and loan documents are digitised at CPC and are made available to the customers at the click of a button. Scanned security and title documents are stored on a dedicated private cloud. This technology facility has improved the systems in mitigating operational and transit risk, reducing retrieval cost, and increasing data security, thereby resulting in increased customer satisfaction. This streamlined operational structure has resulted in improved TAT for loan applications processed to loans being sanctioned. For fiscal 2018, 84% of housing loans to salaried customers had a TAT of 3 days and 89% of housing loans to self-employed customers had a TAT of 7 days. The inbound contact centre provides a multichannel service platform for a quarter of a million customers. Under Project Anubhav, the CRM system has been upgraded to enable standardised and quicker service delivery to new-age customers, who use toll-free numbers, emails, e-portals (web and mobile), and webchat. An automated IVR system and the mobile portal allow customers to access various services 24 x 7. These e-channels supplement and complement the brick and mortar structure of the 100+ branches. 36
You can also read