Wilkinsburg Business District Market Analysis
←
→
Page content transcription
If your browser does not render page correctly, please read the page content below
Wilkinsburg Business District
Market Analysis
Wilkinsburg, Pennsylvania

Prepared For:

Tracey Evans, Executive Director
Wilkinsburg Community Development Corporation
1001 Wood Street
Wilkinsburg, PA 15221                                                      January 26, 2016

                DiSalvo Development Advisors, LLC | www.DDAdvise.com | 614.260.2501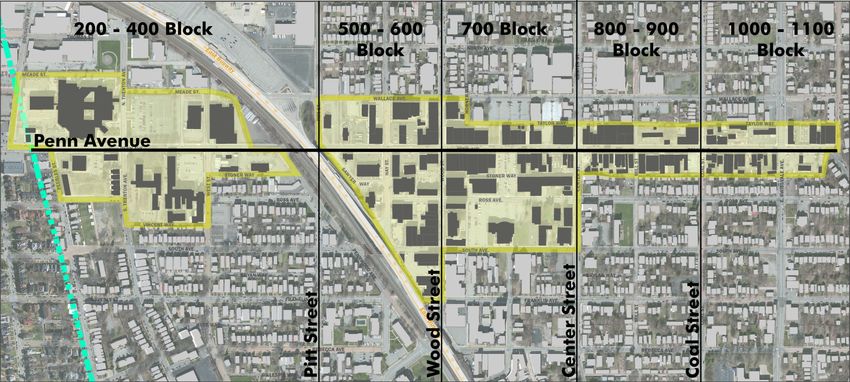
TABLE OF CONTENTS

I.     Executive Summary .................................................................................. 1

II.    Introduction ................................................................................................ 6

       A. Objectives ............................................................................................ 6
       B. Methodology/Approach........................................................................ 6
       C. Uses, Applications and Assumptions .................................................. 8

III.   Findings & Analysis ................................................................................... 9

       A. Retail ................................................................................................... 9

            1.    Inventory ........................................................................................ 9
            2.    Estimated Sales ........................................................................... 14
            3.    Leakage Analysis......................................................................... 15
            4.    Void Analysis ............................................................................... 18

       B. Office ................................................................................................. 20

       C. Residential ......................................................................................... 21

       D. Targeted Area Assessment ............................................................... 24

            1. Building Inventory ........................................................................ 24
            2. Property Tax Rates ...................................................................... 27
            3. Factors That Influence Business Attraction/Retention ................. 28

       E. Demographic & Economic Analysis ................................................... 29

            1.    Population Trends........................................................................ 30
            2.    Household Trends ....................................................................... 30
            3.    Household Income Trends........................................................... 31
            4.    Age and Racial Composition ....................................................... 32
            5.    Employment Trends..................................................................... 33

       F. Final Summary/Next Steps ................................................................ 35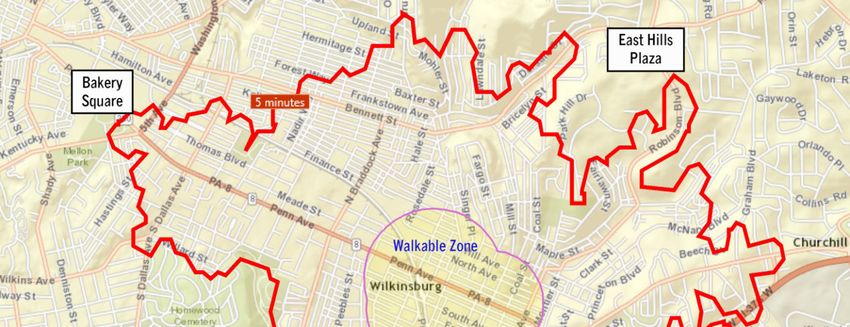
I.     EXECUTIVE SUMMARY

The following summarizes DDA’s key findings, recommendations and conclusions contained
within the market analysis. The purpose of this report is to update and expand upon a market
assessment of the Wilkinsburg Business District completed in 2010; highlight market
opportunities and strategies to attract potential industries; and provide business attraction and
market promotional tools based on the analysis.

Market-Supported Opportunities

Wilkinsburg has retained sufficient market demand fundamentals through the years to fuel a
resurgence of restaurants and retail in the business district. A short-term (5-year) market
potential exists to add 20,000 to 25,000 square feet of retail and restaurants in the Wilkinsburg
Business District; increase sales of existing businesses; and create an environment to add
rental housing, offices and visitor-oriented retail businesses in the long-term (6+ years).

The evolution of retail in a core urban corridor generally starts with food and beverage
establishments, is followed by resident/business services and visitor/tourist-oriented business.
With the Wilkinsburg Trade Area significantly underserved by restaurants, the path to
revitalization of the Wilkinsburg Business District begins with restaurants.

Within the trade area, residents’ and
visitors’ annual spending at restaurants          Local Restaurant Spending (in millions)
is estimated at $50 million. With annual           In Trade Area V. Outside Trade Area
restaurant sales of $12.2 million, there is
$37.8 million in restaurant spending from
residents and visitors leaving the
Wilkinsburg Trade Area each year. The
amount of restaurant spending occuring                                $12.2
outside the trade area, in areas such as
Regents Square and East Liberty,
represents      the    most     significant
opportunity to bring back restaurant
sales to the Wilkinsburg Business District
and support new businesses.
                                                                               Restaurant $ Spent
                                                 $37.8                         in Trade Area
The borough’s new liquor license
ordinance permits the sale of alcohol for
up to five restaurants in the borough, one                                     Restaurant $
of which has already been issued to                                            Leaving Trade Area
Salvatore’s. Now, a greater opportunity
exists to attract patrons who are currently
spending most of their food and
beverage dollars outside the market.
                                                  “…the path to revitalization of the
                                                 Wilkinsburg Business District begins
The area is capable of supporting an
increase in restaurant sales of more than                 with restaurants”.
$5 million in the short term. The existing
restaurant spending and the potential increase in restaurant sales over the next five years will
account for one-third of the total local resident and visitor restaurant spending.

1|P a g e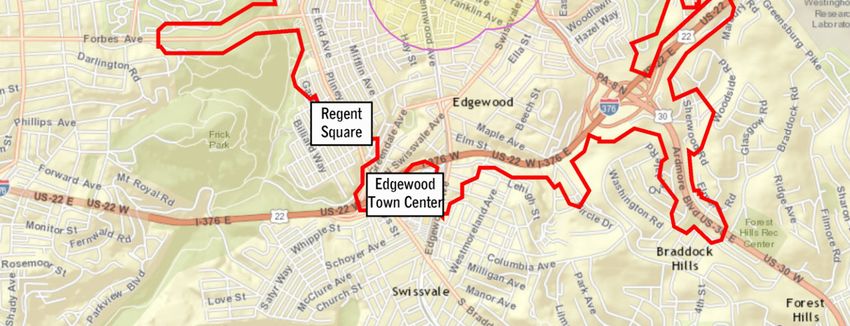
Other key factors that support a focus on adding restaurants to the Wilkinsburg Business
District, include:
Strength of market validated by several local restaurants having gross sales in excess of
industry averages.
Neighborhood restaurants serving alcohol have total
sales 1.5 times that of restaurants without alcohol Median Sales Per Square Foot
(Source: International Council of Shopping Centers).
The increase is not solely from alcohol sales, but the
result of an expanded target market which includes $350
$300
those who may want the option for a drink while $308
$250
dining. $200
Businesses have above average market exposure $150 $199
with an average daily traffic count along Penn $100
Avenue of 19,298 (Source: PennDOT, May 2014). $50
Local population of 21,532 persons within a 1-mile $0
radius of Penn Avenue and Wood Street. Restaurant Restaurant
Wilkinsburg has a stable household base with With Alcohol Without
projected growth of 0.2% from 2015 to 2020. Alcohol
There is a daytime population of approximately
5,000 employees.
Nearby Wilkinsburg Station has daily ridership activity of approximately 3,500.
More than 800 local residents are employed in the retail industry.
Early redevelopment efforts should also focus on attracting retailers who are service-oriented
and would be largely supported by the local resident and workforce population. These retailers,
could include, but are not limited to the following:
Bicycle shop
Dance studios
Fitness
Musical instrument store
Pet store
Refer to the Retail Void Analysis on page 17 for a listing
of additional service-oriented retail businesses.
Any additions of retail and/or restaurants in the short-
term are expected to impact retail sales positively at
existing businesses in the business district as more
patrons visit, dine and shop in the district.
Longer-term opportunities; those out six years and
longer include, visitor/tourist-oriented retail, market-rate
rental housing above ground floor commercial space
and an appreciable increase in office users.
Continued action to improve the environment will remain
an important component in attracting and retaining Bicycle shop in Lawrenceville neighborhood
businesses.
2|P a g e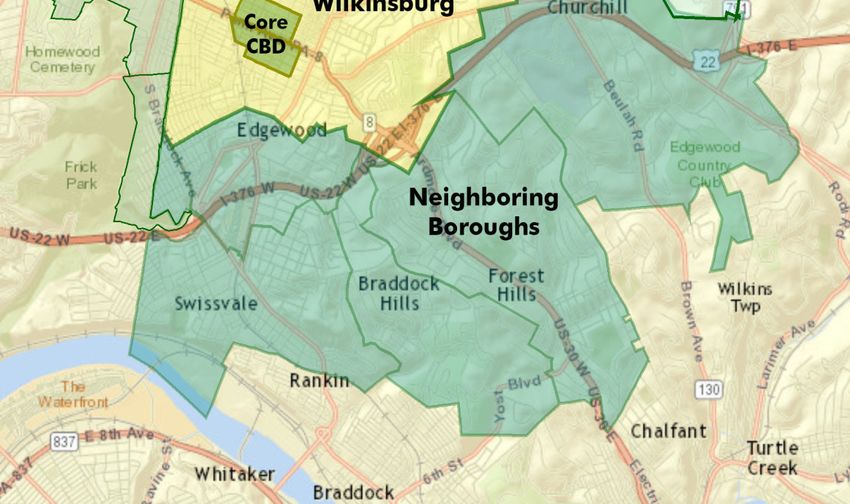
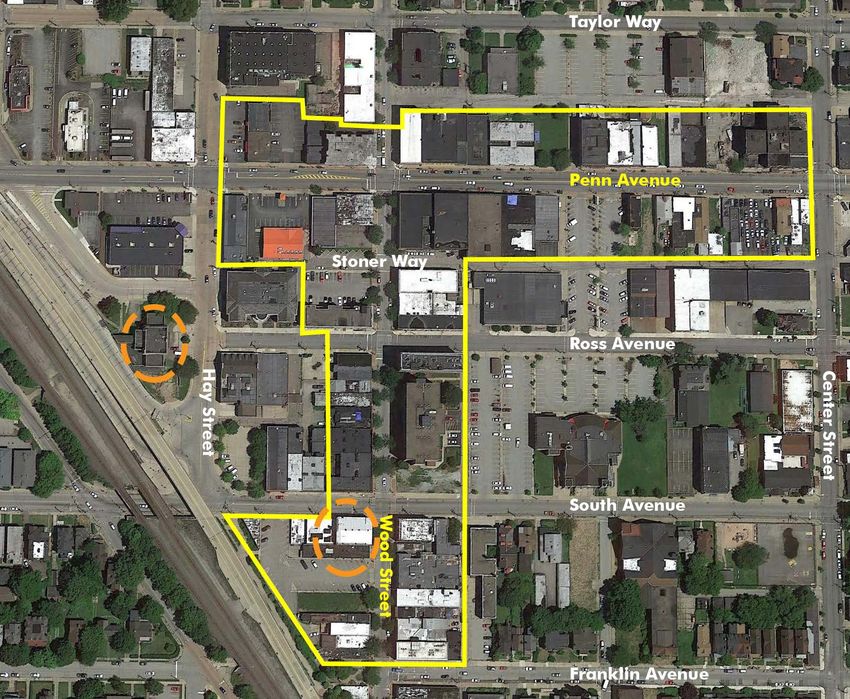
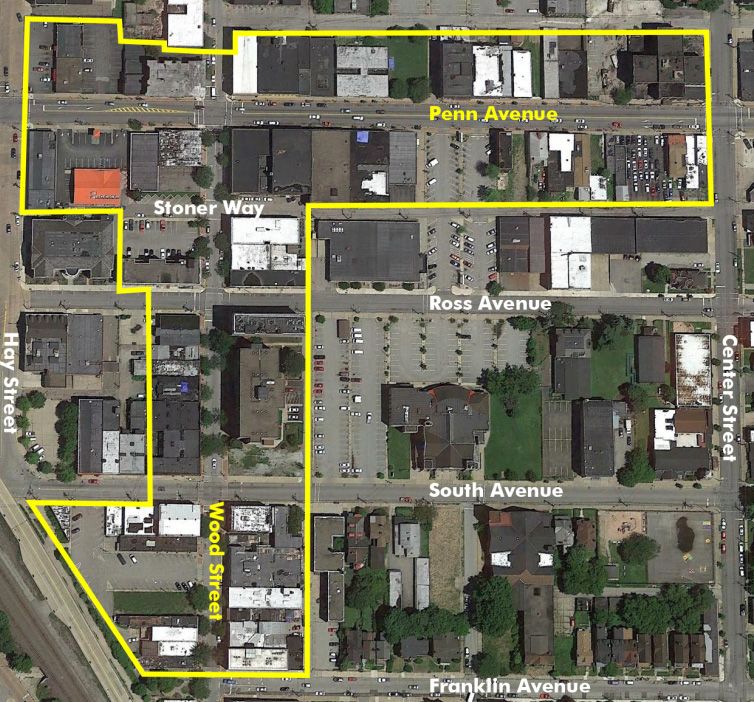
Redevelopment Strategies

Based on current market conditions, existing tenants and other redevelopment efforts
underway, the best opportunity for the market to support additional redevelopment is along the
600 and 700 blocks of Penn Avenue and the 700 to 900 blocks of Wood Street. The target
redevelopment area is illustrated below and highlighted with yellow boundary lines.

Target Redevelopment Area

Redevelopment efforts should occur near existing assets to provide optimal economic impact to
the business district. Buildings near the Penn Avenue/Wood Street intersection should be at the
forefront of redevelopment efforts. This prime intersection is the gateway to the walkable area of
the district.

The scope of short-term opportunities will be redeveloped properties. The rental rates required
for new construction development are not attainable in this market.

Redevelop in secure areas

Most visitors and workers in the area perceive the areas near Salvatore’s and the surface
parking across the street, as a safe and secure environment. The buildings adjacent the surface
parking lots could be attractive locations for new restaurants.

3|P a g e
Provide competitive environment to other urban commercial corridors in the region
Modernize street parking by providing one pay station (accepts credit cards) instead of
multiple old coin operated meters.
Install bike corrals and provide outdoor seating along Wood Street
Consider converting Wood Street to two-way street (in process, WCDC & Borough)
Improve pedestrian’s ability to cross Penn Avenue with “bump outs” or curb extensions at
the Penn Avenue/Wood Street intersection (good example of curb extensions along Penn
Avenue in East Liberty).
Incorporate planters and/or hanging flower baskets
Identify buildings that may be appropriate candidates for reuse as restaurant and service-
oriented retail spaces.
Priority sites for restaurants include existing vacant restaurant space (with ventilation
system).
Buildings with basements may lend themselves to less costly remodel that includes major
plumbing and grease traps work.
Spaces for restaurants of 1,800 to 5,000 total square feet (target size of approximately
2,500 square feet).
Spaces for service-oriented retail generally less than 3,000 square feet.
Spaces that have service access available for delivery and trash pickup.
Buildings with motivated owner(s) to redevelop.
Employ recruitment efforts targeting start-up and established independent and/or regional chain
restaurateurs and retailers.
In-person marketing at food events, such as the upcoming Brew N’ Chew at the Monroeville
Convention Center
Choose established businesses for relocation and/or expansion
One- to two-page marketing flier with key market/property data and available incentives
Install temporary “Restaurant Site Available” façade or window signs on high profile sites
Provide web link to market study
4|P a g e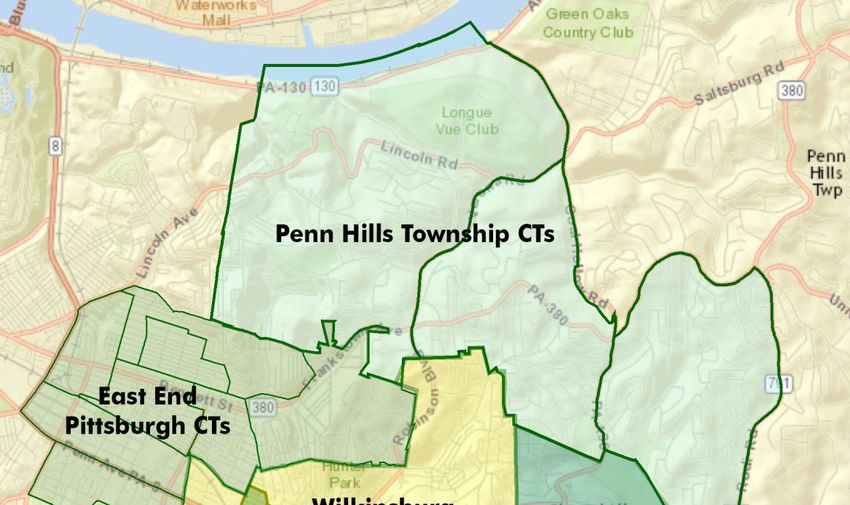
Recommended Improvements
The current environment (aesthetics and perceived crime) hinders the ability of most retailers in
the business district to capture any significant consumer spending outside of the immediate
area of Wilkinsburg. In fact, the largest share of consumers, for many of the retail businesses,
live within walking distance and residents of Wilkinsburg, who have a car, often leave the area
to dine and shop. This is not a sustainable retail model. Without significant improvements to the
environment, we anticipate a continued decline of the area. It is DDA’s opinion that in order to
change current perceptions of the area, we recommend the following actions be taken to fully
realize any redevelopment opportunities to attract and retain businesses.
Stop loitering at the corner of Penn Avenue and Wood Street. The jitneys on this prominent
corner fuels the perception that the area is unsafe and has impacted retail sales and nearby
businesses.
Increase police presence or hire
security guards
Add lighting and security cameras
Improve signage and install awnings
with consistent design
Wilkinsburg has the highest property
taxes in Allegheny County. Efforts
must be made to reduce this burden
(WCDC Enhanced Tax Abatement
program is a positive step).
Protect and winterize vacant
buildings. A significant number of
vacant historic buildings are open to
the elements.
Replace particle board in windows
with Plexiglas or other more Particle boards in the windows are a clear sign of vacancy/neglect
appealing cover.
Get historic designation for buildings
that can be rehabilitated (in process,
WCDC) and provide Historic Tax
Credit eligibility to developers.
There are a number of buildings
along Penn Avenue, especially in the
800 to 1000 blocks that are the
poster-child for blighted properties
that must be removed.
There are other blighted buildings
outside the CBD also in need of
redevelopment and/or demolition
which are in “gateway” locations to Building in 800 block of Penn “Gateway” site outside of CBD, intersection
the community. Avenue of Ardmore and South Avenue
Employing the recommended strategies and improvements, will help revitalize the area into a
more vibrant commercial corridor and pave the way for future redevelopment of market-rate
rental housing and offices in the upper floor spaces.
5|P a g e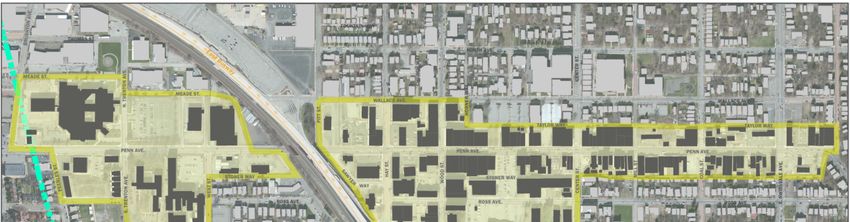
II.    INTRODUCTION

A. Objective

In this report DDA will update and expand upon a market assessment of the Wilkinsburg
Business District completed in 2010; highlight market opportunities and strategies to attract
potential industries; and provide business attraction and market promotional tools based on the
analysis.

The Wilkinsburg Business District, or the area’s Central Business District (CBD), extends nearly
one mile along the Penn Avenue corridor on the west side of the Borough of Wilkinsburg,
Pennsylvania. The central area of the CBD extends several city blocks south from Penn Avenue
along Wood Street.

B. Methodology/Approach

DDA’s conclusions for commercial redevelopment opportunities are based on the identification
and analysis of market conditions within a trade area specific to the CBD.

The identification of an accurate trade area is important to understanding the prevailing market
conditions and potential opportunities that exist for the CBD. The trade area is the specific
geographic area from where DDA anticipates the majority of consumers will be drawn to and
support retail sales within the study area.

The Wilkinsburg Trade Area is a five-minute drive time generally situated between 5th Avenue in
Pittsburgh on the west end and US Highway 22/Interstate 376 to the east (refer to map on
following page). It is important to note, that actual drive times will vary depending on time of day
and the presence of construction. This trade area generally corresponds with the “three-minute”
drive time market area deemed appropriate in the Business District Revitalization Plan.

The trade area is limited by the four outlying commercial competitors: Bakery Square (East
Liberty); Regent Square; Edgewood Town Center; and East Hills Plaza.
6|P a g e
Bakery Square, in the East Liberty neighborhood of Pittsburgh,
offers a wide variety of retail, restaurants and entertainment. This
area is considered a solid trade area buffer. It is not realistic to
expect any appreciable share of residents west of the trade area to
drive by the many commercial offerings in East Liberty to the
Wilkinsburg Business District to shop or do business.

In addition to the trade area, a walkable zone (highlighted in yellow)
was also identified, which pedestrians walk distances of up to one-
third mile to the more vibrant areas of the CBD, and a quarter mile
from areas with fewer retail businesses and higher vacancies. The
industry standard “walkable” distance is a quarter mile. However,
the longer distance is appropriate in this circumstance since there is
a high share of residents in the immediate area surrounding the
CBD who do not have vehicles.
                                                                         Bakery Square tower

Wilkinsburg Retail Trade Area

7|P a g e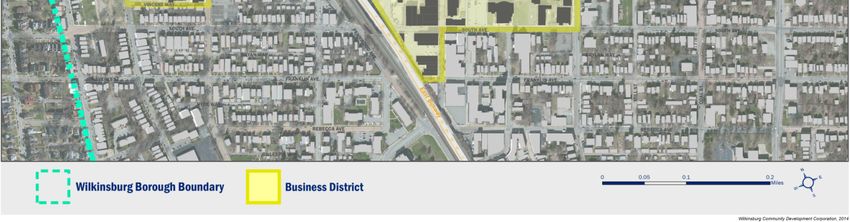
Survey Commercial and Residential Development Development within the CBD and surrounding areas has been surveyed and personally inspected by staff at DiSalvo Development Advisors. Our comprehensive survey reveals the potential for a wide variety of product alternatives for the CBD. A complete analysis of commercial and residential markets requires the following considerations: field survey of ground floor commercial spaces and rental housing; analysis of retailer and business types within the region; analysis of the area economy; and demographic analysis. Supply/Demand Analysis The study includes an analysis of economic, social, and demographic characteristics of the CBD and borough and an analysis of development (supply) relative to consumer needs (demand). Site Analysis The realization of market potential of the CBD is predicated on opportunities strategically placed in an environment conducive to the particular use. DDA will highlight areas which offer the best chance to support additional uses and outline other site characteristics necessary to attract redevelopment and patronage. Consideration will be given to uses that are most complementary to one another; uses that provide the best opportunity for economic development and long-term viability; and how uses can be leveraged to provide a unique and vibrant experience and/or lifestyle. C. Uses, Applications, and Assumptions Although this report represents the best information available for identifying current market status and future market trends, most markets are continually affected by demographic, economic and developmental changes. This analysis has been conducted with respect to a particular client's development objectives, and has been uniquely developed to determine the current market's ability to support those particular objectives. For these reasons, the conclusions and recommendations in this study are applicable only to the Wilkinsburg Business District as outlined in this report. This study represents a compilation of data gathered from various sources, including prior reports, property surveys, local records, interviews with property managers, government officials, real estate professionals, and the use of secondary demographic materials. Although DDA judges these sources reliable, it is impossible to authenticate all data. The analyst does not guarantee the data and assumes no liability for any errors in fact, analysis, or judgment. The conclusions contained in this report are based on the best judgments of the analysts. DDA makes no guarantees or assurances that the projections or conclusions will be realized as stated. 8|P a g e
III.    FINDINGS & ANALYSIS

       A. Retail

           A retail inventory and sales analysis were completed to assess opportunities for the CBD to
           support additional types of retail. Since the CBD stretches nearly one mile, the area has
           been summarized by city blocks. This categorization also enables us to identify likely
           locations for future retail clustering.

           1. Retail Inventory

               DDA identified 64 retail goods and services businesses within the Wilkinsburg Business
               District. A distribution of total retail goods and services businesses and city block
               locations follows.

                                    Total                    Penn Avenue                      Wood Street
Business Type                       Stores   200-400   500-600 700 800-900    1000-1100    700-900     1000
Retail Goods Businesses               37        3         5     16      2         3           7          1
Retail Service Businesses             27        1         0     13      4         5           4          0
                            Total     64        4         5     29      6         8          11          1

               The 700 block of Penn Avenue has the largest concentration of the CBD’s retailers with
               28 of the 64 retailers. The next highest concentration of retailers is in the 700 to 900
               blocks of Wood Street, south of Penn Avenue.

               A further breakdown of retailers by goods and services, retailer types and location
               follows.

       9|P a g e
Retail Goods Businesses
Restaurants comprise one-third of the retail goods offered in the CBD. There are 11
restaurants in the CBD, two of which are fast food, and one establishment is carryout
only (Sister’s Kitchen). The fast food drive-thru restaurants are located in the 200 to 500
blocks of Penn Avenue and include McDonald’s and Kentucky Fried Chicken.
Used merchandise Fire Arms Music Store
3% Auto Parts 3% 3% Bakery
3%
3%
Beverage
Carryout Restaurants
2% 30%
Hardware/Paint
5%
Beauty Supplies
8%
Pharmacy/ Convenience
Store/ General
Merchandise Clothing and Accessories
8% 13%
Cell Phones and
Accessories
8% Grocery/Market
11%
The CBD also offers two grocery stores, atypical in most urban commercial corridors.
The grocery stores have reportedly been supported largely by residents who live within
walking distance. Since the grocery stores offer a limited product assortment, however,
many other residents with vehicles drive to grocery stores on the periphery of
Wilkinsburg, notably the East End Food Co-op and Giant Eagle.
10 | P a g eA detailed breakout of retailer types by block location along Penn Avenue and Wood
Street follows:
Total Penn Avenue Wood Street
Retailer Type Stores 200-400 500-600 700 800-900 1000-1100 700-900 1000
Restaurants 9 1 2 2 4*
Clothing and Accessories 4 3 1
Cell Phones and Accessories 3 3 1
Beauty Supplies 3 1 2
Fast Food with Drive-Thru 2 1 1
Pharmacy/Convenience Store 2 1 1
Grocery 2 2
Convenience store 2 1 1
Hardware/Paint 2 1 1
Auto Parts 1 1
Beverage Carryout 1 1
General Merchandise 1 1
Jewelry 1 1
Used merchandise 1 1
Fire arms 1 1
Music Store 1 1
Bakery 1 1
Total Retail Goods Businesses 37 3 6 15 2 3 7 1
*One of the restaurants is located on South Avenue near the Wood Street intersection.
The highest concentration of retail goods
is in the 500 to 700 blocks of Penn
Avenue and the 700 to 900 blocks of
Wood Street. The 700 block of Penn
Avenue has the most variety of retailers in
the CBD and has attracted chain retailers,
Rainbow Shops, Dollar General and Rent-
A-Center.
The interior of the chain stores is quite a
contrast. Rainbow Shops offers a clean,
well lit, uncluttered space with
sophisticated signage and displays.
Conversely, the Dollar General is poorly Rent-A-Center and Rainbow Shops, Penn Avenue
maintained cluttered and lacks any
window signage.
Loitering at the southeast corner of Penn Avenue and Wood Street, in front of the Dollar
General store, has been noted by retail managers as a deterrent for potential customers
visiting and existing customers revisiting their stores. Undocumented taxi drivers, or
“jitneys”, are a mainstay at the corner. While jitneys provide a public service to area
residents who need transportation, the loitering activity at the corner will continue to
deter shoppers and reinvestment by businesses in the area. Additionally, since this is
11 | P a g ethe prime corner of the CBD, the activity further fosters perceptions of the CBD as an
unsafe area.
The transition of auto-oriented retail (drive thru and/or suburban-style parking lots) to a
more traditional high density urban corridor begins in the 600 block of Penn Avenue.
While several of the auto-oriented retail businesses benefit from pedestrian traffic
coming from the bus stop, sales to this group was noted as limited.
The 800 and 900 blocks of Penn Avenue
include just two establishments which
offer retail goods, Up Beat Records and
Braverman’s Arms. Vacant and
dilapidated buildings dominate the 800
and 900 blocks of Penn Avenue
discouraging pedestrian traffic along
these blocks and dissuading retail goods
businesses from locating in this area.
Instead, the current retail businesses
include auto repair, used car sales and
buy gold/pawn shops (refer to table).
800 block of Penn Avenue
Retail Service Businesses
Hair salons, barber shops and nail salons represent 30% of the service-related retail in
the CBD. As with the retail goods, the 700 block of Penn Avenue has the largest variety
of retail services, including a used car sales lot, Vegas City Motors. Car sales lots are
not complementary to any uses; they deter pedestrian traffic and represent an obstacle
to redevelopment in an urban corridor.
Total Penn Avenue Wood Street
Retailer Type Stores 200-400 500-600 700 800-900 1000-1100 700-900 1000
Hair Salon/Barber 6 2 2 2
Bank 3 2 1
Auto Repair 3 3
Gasoline 2 1 1
Used car sales 2 1 1
Check Cash 2 2
Nail Salon 2 2
Tax Service 2 2
Buy Gold/Pawn Shops 2 1 1
Clothing repair/alterations 1 1
Rental Furniture 1 1
Childcare 1 1
Total Retail Service Businesses 27 1 0 13 4 5 4 0
The 800 to 1100 blocks of Penn Avenue include about twice as many service-oriented
retailers than retailers selling goods. In fact, this area of the CBD includes one-third of all
12 | P a g eof the service-oriented retailers. The 900 block of the CBD is also home to several light
industrial businesses and wholesalers, including Enrich Products.
Retail Lease Rates
Lease rates in the CBD are rarely published and are typically negotiated with the
building owner. Based on our interviews with brokers and select building owners, rental
rates typically average $10 per square foot with a range of $8 to $12 per square foot.
Lease rates at select retail centers in the region are as follows:
Retail Center Community Lease Rate Per Square Foot*
Braddock Hills Shopping Center Braddock Hills $10 to $12
Edgewood Town Center Edgewood $14 to $15
Forest Hills Shopping Center Forest Hills $15
Village of Eastside East Liberty $18 to $22
*Reflects prevailing rate for a non-big box retail store under a triple net rate term.
Wholesale Businesses
Wholesalers represent a significant portion of revenue in the CBD and borough.
According to the 2012 Economic Census, annual sales from wholesalers in 2012 was
$29,048,000.
Stanton Industrial Electric, 521 Penn Avenue Enrich Products, 919 Penn Avenue
13 | P a g e2. Estimated Retail Sales
DDA used multiple resources to estimate and distribute retail sales in Wilkinsburg and
the Trade Area:
Commonwealth of Pennsylvania’s Department of Revenue
International Council of Shopping Centers, Dollars & Cents of Shopping Centers
Investor reports
Allegheny County Assessor/Google Earth Pro (square footage)
2012 Economic Census
Retail managers
Wilkinsburg Borough Finance Department
The estimated annual retail sales for the Borough of Wilkinsburg and the Trade Area are
$47.5 million and $72.5 million, respectively. The retail sales estimate for Wilkinsburg,
net restaurant sales, is $37.6 million or $2 million above the 2012 estimate cited in the
Economic Census. The increase in sales price is largely attributed to the addition of
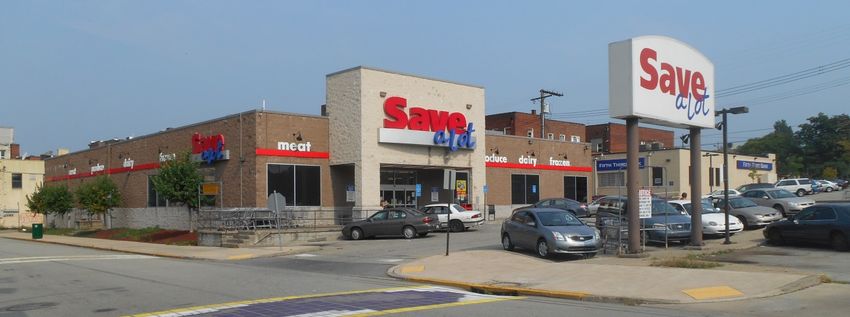
Save-A-Lot since the last Economic Census.
The “other” category represents sales in floral/gift, beauty supplies, hardware and music
stores. The category was not itemized and did not identify specific estimated sales for
any one business. Sales data specific to retail services including hair and nail salons
was not available.
Estimated Annual Retail Sales
Wilkinsburg and Trade Area
Other**
Drinking Places
Clothing & Accessories
General Merchandise
Restaurants
Health
Grocery/ Markets
Gas/Auto
$0.0 $5.0 $10.0 $15.0 $20.0 $25.0 $30.0
Grocery/ General Clothing & Drinking
Gas/Auto Health Restaurants Other**
Markets Merchandise Accessories Places
Total Trade Area $24.2 $15.0 $13.2 $12.2 $4.8 $2.0 $1.8 $1.3
Wilkinsburg $19.2 $4.0 $8.8 $9.9 $2.8 $1.8 $0.0 $1.0
*Excluding wholesale retail sales and sales of firearms and carryout beverages.
**Includes walk-in retail sales in floral/gift, beauty supplies, hardware and music stores.
Note: Retail sales in Wilkinsburg are a subset of CBD Trade Area total sales amounts.
The CBD represents a significant share of the retail sales in the Trade Area for all
categories except, groceries and drinking places.
14 | P a g eThe East End Food Co-op accounts for most of the grocery sales in the Trade Area. All
of the drinking places or taverns are located outside of Wilkinsburg due to a recently
overturned liquor license ban in the borough. However, following the May 2015 primary
election, up to five liquor licenses may be issued to restaurants in the borough.
Salvatore’s is the first restaurant in Wilkinsburg approved to serve liquor. This is a major
addition to the borough and represents new opportunities for the CBD. According to
ICSC, neighborhood restaurants that serve alcohol can increase sales as much as
54.8% from a median of $199 per square foot to $308 per square foot. The increase is
not solely from alcohol sales, but the result of an expanded target market which includes
those who may want the option for a drink while dining.
Median Sales Per Square Foot
$350
$300
$250 $308
$200
$150 $199
$100
$50
$0
Restaurant Restaurant
With Alcohol Without
Alcohol
Salvatore’s – 612 Penn Avenue
3. Retail Leakage Analysis
DDA reviewed consumer spending and estimated retail sales within the trade area to
assess support levels for additional retail in the CBD. It has been our experience that
the best and most immediate opportunity to increase retail in a neighborhood is to focus
future tenancy efforts on underserved retail types. Underserved retail types are those in
which local resident spending well exceeds local retail sales within that particular retail
type. This consumer spending excess, often referred to as leakage, reflects an area’s
lost retail sales being spent outside of the trade area.
The estimated $72.5 million in annual retail sales in the Trade Area, represents just
16.5% of the $438.8 million in resident consumer spending (including auto sales and
gasoline). This is significant leakage and reveals most residents in the Trade Area do
the bulk of their shopping and dining outside the CBD, borough and Trade Area.
We interviewed select retailers in the CBD and found that many businesses attribute
50% to 70% of their sales to residents within walking distance of the commercial
business district. For this reason, estimated consumer spending within a walkable zone
around the CBD has also been included (source: ESRI, Incorporated). The following
comparison of consumer spending versus retail sales does not include estimate retail
sales for select categories with one or two retailers to protect anonimity. Furthermore,
retailers that are unlikely candidates for redevelopment in the corridor, including gas
stations, auto sales and service, building materials and department stores were omitted
from the analysis. The dollar amounts reflect millions.
15 | P a g e2015 Estimated Consumer 2015 Estimated Retail
Spending (in millions) Sales (in millions)
Retail Category Walkable Zone Trade Area Borough Trade Area
Grocery/Market/Specialty $4.2 $80.8 $4.0 $15.0
Restaurants $2.3 $40.0 $9.9 $12.2
Electronics & Appliances $0.6 $21.3 D D
Clothing & Accessories $1.4 $20.5 $1.8 $2.0
Health & Personal Care $1.3 $18.0 $8.8 $13.2
General Merchandise* $1.9 $15.0 $2.8 $4.8
Furniture & Home Furnishings $0.5 $11.8 D D
Sporting Goods/Hobby $.05 $9.8 D D
Office Supplies/Gifts $0.2 $3.8 D D
Book/Periodical/Music $0.2 $2.6 D D
Drinking Places $0.2 $2.3 $0 $1.8
Used MerchandiseClothing and Accessories
Clothing and accessories stores are under represented in the Trade Area. Residents
within walking distance of the CBD are the largest supporters of Rainbows and other
apparel stores along Penn Avenue. With estimated sales of $2 million within this
category and consumer spending of $20.5 million, it is our opinion that the existing
clothing stores are underperforming in terms of revenue because the CBD is not
attracting residents within the Trade Area who are outside a walking distance of the
stores.
Health and Personal Care
The health and personal care
categories are saturated with CVS,
Rite Aid and Walgreens. The
pending Walgreens acquistion of
Rite Aid, however, may result in the
closure of Wilkinsburg’s Rite Aid
store. Nonetheless, this category is
not a likely candidate for the CBD in
the short term.
Drinking Places Rite Aid, 331 Penn Avenue
Drinking places, including bars, taverns or pubs, are on the outskirts of the borough
limits and adequately support consumer spending within this category. Liquor licenses
for this type of retailer are still not permitted in Wilkinsburg.
General Merchandise
Dollar General currently operates at
the corner of Penn Avenue and
Wood Street. The store caters to
residents within walking distance
and does the bulk of sales on days
that residents receive supplemental
income, such as SNAP. The store
lacks any appealing window
signage and a group of jitneys and
others loiter at the front of the store
during most of the businesses’
hours of operation.
Dollar General, 700 Penn Avenue
Furniture/Home Furnishings
New furniture and home furnishings stores are a rarity in commercial corridors, and are
reserved for the most affluent areas. Rent-A-Center and G & E Furniture/Interiors are the
current choices for local residents.
17 | P a g e4. Retail Void Analysis
A retail void analysis is an essential tool for assessing opportunities for additional retail
in the CBD. The analysis also considers more service-oriented retail opportunities that
are not captured within the retail leakage analysis. Following is a composite list of retail
uses within other urban commercial corridors compared with the current offerings in the
CBD.
Typical Urban Retailers Operating in CBD Existing Businesses
Apparel & Shoes X Rainbow Shops, Culture Kicks, King Sportswear
Bakery X Wood Street Bread Company (limited hours)
Banks X PNC, Fifth Third and Citizen’s Bank
Barber Shop X Barber’s Inn, Christyles Barber Shop
Beauty Salon X Christyles, Hair One All One, House of Style
Beauty Supplies X X-Ceptional, Argo Family Beauty Shop, Hair Fair
Cell Phone Store X Boost Mobile, Metro PCS, Budget Mobile
Childcare X MZ. Smiley’s Childcare Center
Clothing repair/alterations X Clayton’s Fashion
Convenience Market X Right Market, Northwood Market
Florist X James Flower & Gift Shoppe
General Merchandise X Dollar General
Jeweler X Kenyon Jewerly
Laundry Service X Pittsburgh Cleaners
Music store X Up Beat Records
Nail Salon X AA Nail Spa, Franco’s Nails
Pharmacy X CVS, Rite Aid
Restaurants X 9, including a carryout restaurant
Tax Preparer X H&R Block, Hewitt Jackson Tax Service
Women’s Boutique X Good Green Fashion
Antique Stores
Art galleries
Bicycle Shop
Book store
Candy Store
Coffee Shop
Consignment Shop
Dance Studios
Deli
Financial Advisor
Fitness
Gift Shop
Ice Cream/Yogurt Shop
Musical instrument store
Performance Theater
Pet Store
Tattoo Shop
Taverns/Arcade Bar Only permitted if meet a minimal food requirement
Toy Store
Vintage Shops
18 | P a g eThere are a total of 20 retail uses that are often found in other urban commercial districts
that are not present in Wilkinsburg’s CBD. Of the 20 retail types, approximately half are
present in area’s with high shares of visitors (11) and the remaining are resident-oriented
goods and services, some of which also are frequented by visitors.
Visitor-Oriented Retail
The visitor-oriented retailers typically require a vibrant commercial corridor that has
significant pedestrian activity. The addition of these types of uses are most common
after the urban district has been established with restaurants and other resident-oriented
services.
Antique Stores
Art galleries
Book store
Candy Store
Consignment Shop
Financial Advisor
Gift Shop
Ice Cream/Yogurt Shop
Performance Theater
Tattoo Shop
Toy Store Small performing arts theater in Grove City, Ohio
Vintage Shops
Resident-Oriented Retail
Early redevelopment efforts should focus on
attracting retailers that are service-oriented
and largely supported by the local resident
population.
Services such as a bike shop, pet store and
coffee shop are prime candidates in the short
term.
Bicycle Shop
Coffee Shop
Dance Studios
Deli
Fitness
Musical instrument store
Pet Store
Taverns and arcade bars, while popular in
most urban districts, are prohibited within the
borough unless they meet a minimal food
Bicycle shop in Lawrenceville neighborhood
requirement of having enough food to serve
30 patrons.
19 | P a g eB. Offices
Demand for office space in an urban environment is largely predicated on having a safe
environment with a variety of commercial offerings, particularly restaurants, within walking
distance.
Office users in the CBD are typically owner
occupants; many of which have been in the
community for many years. Based on
interviews with select office users, many of their
employees reside outside the borough and
perceive the CBD as unsafe, especially at
night. Patronage of restaurants in the CBD, by
office workers is limited and those who do
venture out of the office for lunch typically walk
no farther than one block. Many of the workers
who leave the office for lunch will drive to a
Verizon Wireless office building on Hay Street in the CBD
nearby drive-thru restaurant.
Any increase in for-lease office redevelopment opportunities, will require improvements being
made to the environment (aesthetics and perceived crime) along Penn Avenue and the addition
of restaurants to the CBD.
The largest groups of office users in the area are institutional and governmental, including the
LifeCare Hospital and the Borough of Wilkinsburg. The primary focus of these users is one of
being in a location that best serves the community and less of the quality of nearby amenities,
such as restaurants.
Medical practitioners and service providers occupy the majority of private-sector office space in
the CBD. Several of the medical offices are located in prime retail locations which are visible
and easily accessible from Penn Avenue. The medical businesses have staffing levels below
that of a typical office user (4 to 5 employees per 1,000 square feet of office space), but often
require more parking spaces to accommodate their patients.
Magee-Women’s Hospital of UPMC, Neighborhood Women’s Star Optical/Davis Eye Group, 929 Wood Street
Health Center, 720 Penn Avenue
20 | P a g eOffice Lease Rates
Similar to retail lease rates in the CBD, office lease rates are rarely published and are typically
negotiated with the building owner. Based on our interviews with brokers and select building
owners, lease rates typically average $10 to $12 per square foot. Unlike retail leases that are
often net of utilities, office rates typically included utility expenses. Published and quoted lease
rates in the neighboring communities are as follows:
Community Lease Rate Per Square Foot*
Swissvale $12 to $14
Braddock Hills $14
Forest Hills $14 to $18
Penn Hills $14 to $16
Pointe Breeze $16
East Liberty $20 to $25
*Includes varying terms.
C. Residential
A survey of conventional apartment developments was conducted to establish the overall
strength of the rental housing market and to identify prevailing rental rates among apartment
developments in the Wilkinsburg area. Properties with income restrictions were not included in
this analysis.
DDA was able to gather rental information on 35 market-rate apartment properties within the
Wilkinsburg area and surrounding areas totaling 1,737 units. At 96%, the area occupancy rate
is extremely high in all of Wilkinsburg and the neighboring communities.
Properties Units Surveyed Occupancy
Survey Area Surveyed Number Percent Rate
Wilkinsburg 17 1,280 73.7% 96%
Point Breeze/Point Breeze North 7 142 8.2% 99%
Swissvale 2 86 5.0% 96%
Edgewood 9 229 13.1% 97%
Overall 35 1,737 100.0% 96%
Regent Square* 3 83 4.8% 96%
*Regent Square is a neighborhood that includes portions of Wilkinsburg, Swissvale, Edgewood and Pittsburgh.
On-site management is not available for many of the smaller rental housing developments
within the area. DDA staff interviewed three management companies with significant rental
housing inventory in the Wilkinsburg area (many included in our survey), summarized as
follows.
Regent Square Rentals manages nearly 470 apartment and single-family rental units within
the Regent Square and Frick Park areas of the survey area, with an estimated 400 of these
housing units within the Wilkinsburg Borough. Given the small and scattered nature of the
individual properties, few were included in our rental housing survey. Management
indicates that the units are typically 100% occupancy, and were 99% occupied at the time of
our survey.
21 | P a g e Mozart Management manages 27 apartment properties in five Pittsburgh neighborhoods. It
manages nearly 120 units within seven properties near Frick Park. Most are located within
the Point Breeze/Point Breeze North neighborhoods, with one located in the Wilkinsburg
area. Management notes that these units are generally 100% occupied, and they were 99%
occupied at the time of our survey with a lone vacancy due to normal tenant turnover.
Steiner Realty manages a number of properties throughout the Pittsburgh area and 13
within the subject study area. Most are located within the Edgewood submarket; however,
some properties are in the Wilkinsburg and Swissvale submarkets. Management reported
that it generally maintains a 97% occupancy rate among their properties in the general
Wilkinsburg area.
As the table below indicates, rents in the western portion of the study area, near Pittsburgh’s
neighborhoods of Point Breeze/Point Breeze North and Edgewood, have significantly higher
rents than Wilkinsburg and Swissvale. Rents have been adjusted for comparison purposes,
with all rents including landlord-paid water/sewer and trash removal services. The local housing
authority’s utility allowance worksheet has been used to adjust rents that include different
landlord-paid utilities.
Median Net Rent - 4th Quarter 2015
Studio One-Bedroom Two-Bedroom
Rent/ Rent/ Rent/
Net Square Sq. Net Square Sq. Net Square Sq.
Survey Area Rent Feet Ft. Rent Feet Ft. Rent Feet Ft.
Wilkinsburg $554 489 $1.13 $705 726 $0.97 $873 944 $0.92
Point Breeze/
Point Breeze North $641 503 $1.27 $821 625 $1.31 $982 909 $1.08
Swissvale $540 550 $0.98 $623 675 $0.92 $652 750 $0.87
Edgewood $620 411 $1.51 $736 650 $1.13 $862 849 $1.02
Overall $587 481 $1.22 $732 683 $1.07 $896 924 $0.97
Regent Square* Unit Type Not Surveyed $898 750 $1.20 $995 913 $1.09
The average one-bedroom effective rent per square
foot is highest in Point Breeze/Point Breeze North
($1.31) and lowest in Swissvale ($0.92). While the
Regent Square neighborhood doesn’t have the
highest one-bedroom rent per square foot, it does
offer the highest average effective one-bedroom rent
($898). Many of the rentals within the Regent Square
neighborhood are managed by Regent Square
Rentals. A spokesperson for Regent Square Rentals
indicated that generally they do not market to the local
population. They pride themselves in providing
quality, renovated units which they can aggressively
price to market to professionals working at nearby
major employers. Apartment in Regent Square neighborhood
22 | P a g eMost properties in the area include the following unit and project amenities: • Range • Air Conditioning • Refrigerator • Intercom Entry • Dishwasher • Laundry Room • Disposal Many of the older buildings also offer hardwood flooring. Most properties do not offer an on-site office, or any significant project amenities other than a laundry room. Much of this has to do with the apartment base comprised of a significant share of smaller properties which do not have the revenue to support other common area expenses. Few properties offer covered parking; those that do, charge $35 to $60 per month for garage spaces and $15 to $30 for carport spaces. The majority of rental housing found in the CBD and immediate surroundings areas are income- restricted properties (Sperling Building, Crescent Apartments, Shields Building and Woods Towers), available only to low-income households. Management companies of rental housing scattered throughout the CBD indicated most rents were well below prevailing rental rates in Wilkinsburg. In other instances, rent levels were set to accommodate low-income tenants with a HUD Section 8 Housing Choice Voucher. The Crescent Apartments, low-income housing The Shields Building, Section 8 housing The commercial environment is an important factor in providing a unique lifestyle and attracting persons to live in an urban corridor. The number of household types that would consider living in the urban district increases when there is a more developed and safe commercial environment. The Wilkinsburg Business District is currently perceived by many as unsafe and offers a limited commercial environment. The current environment largely attracts low-income households whose primary concern is affordability. And, while we are aware of Ergo Management’s small- scale apartment renovation occurring at the 1000 block of Wood Street, we are also aware of other apartment renovation projects in the business district that were canceled because the achievable market rent could not support the cost of renovation. Rent levels for the apartments along Wood Street were not provided; however, Ergo Management does participate in the HUD Section 8 Housing Choice Voucher program and could subsidize rents for low-income renters. It is DDA’s opinion that improvements to the commercial environment are necessary before market-rate rents are achievable in any appreciable amount of housing units. 23 | P a g e
D. Targeted Area Assessment

Redevelopment efforts should occur near existing assets to provide the optimal economic
impact to the business district. Based on current market conditions, existing tenants and other
redevelopment efforts underway, the best opportunity for the market to support additional
redevelopment is along the 600 and 700 blocks of Penn Avenue and the 700 to 900 blocks of
Wood Street.

Note: The dashed circles represent current redevelopment efforts at the train station (left circle) and the Lohr
Building at 725 Wood Street building (right circle).

    1. Building Inventory

        There are 55 parcels within the target redevelopment area with buildings totaling
        742,816 square feet (source: Allegheny County Assessor). The amount of building
        square footage on Penn Avenue and Wood Street is almost identical at 372,021 and
        370,795, respectively. However, the buildings on Penn Avenue have slightly more
        ground floor space because two senior high-rise buildings are included in the Wood
        Street area.

24 | P a g e
Penn Avenue – 600 & 700 Blocks
Of the 30 building parcels along Penn Avenue, six have vacant storefronts. The gray
highlighted rows represent buildings with vacant ground floor space. The average
ground floor space for a building along Penn Avenue is 4,095 square feet, which is
considered large for an urban commercial corridor. On average, most urban commercial
corridors have storefronts averaging about 2,500 total square feet. However, a number
of the ground spaces are multi-tenant with a stairwell in between.
Square Footage
Street Address Building Ground Floor Business(es)
600 Penn Ave. 13,822 6,000 Flynn Construction (office building)
601 Penn Ave. 5,428 5,100 Wilkinsburg Beverage
612 Penn Ave. 4,640 4,640 Salvatore's Pizza
616 Penn Ave. 9,402 4,701 X-Ceptional Beauty Supplies
619 Penn Ave. 23,280 7,650 WCDC/2 Vacant Storefronts/Vacant Boarding House
701 Penn Ave. 19,980 4,995 PNC Bank
705 Penn Ave. 34,334 6,866 Asian Merchandise Inc.
708 Penn Ave. 28,512 4,906 Vacant/Dollar General
710 Penn Ave. 23,760 6,500 Rainbow Shops
711 Penn Ave. 6,060 2,020 Kenyon Jewelers
713-715 Penn Ave. 8,800 4,400 Culture Kicks & Clothing/Scott Advertising/
Linda's Imprinted
716 Penn Ave. 25,232 8,410 Magee Women's Hospital of UPMC/Rent-A-Center
722 Penn Ave. 24,924 8,308 Christyles/Ace Checks Cashed
723 Penn Ave. 23,792 7,930 King Sportswear/H&R Bock
732 Penn Ave. 6,580 4,000 Fifth Third Bank
745 Penn Ave. 20,025 4,005 Argo/Crickett/Vacant Storefront
755 Penn Ave. 22,500 4,500 G&E Furniture/Interiors
756 Penn Ave. 3,600 1,200 Jackson Hewitt Tax Service
757 Penn Ave. 7,200 1,800 Vacant
759 Penn Ave. 13,500 2,700 W.S. Radcliffe Co., Inc.
762 Penn Ave. 4,239 2,120 Café & More BBQ/Boost Mobile
766 Penn Ave. 6,675 4,000 AA Nail Spa/Budget Mobile
767 Penn Ave. 3,118 3,118 Franco's Nails
771 Penn Ave. 7,392 3,696 Hair Fair
774 Penn Ave. 9,864 2,400 Metro PCS/Leona’s Ice Cream Sandwiches
776 Penn Ave. 910 910 Vacant (former candy store)
782 Penn Ave. 506 506 Vegas City Motors
792 Penn Ave. 6,768 2,256 Clayton's Fashion
796 Penn Ave. 3,508 2,000 Fireside Caribbean American Restaurant
798 Penn Ave. 3,670 1,223 Money Mart
Total 372,021 122,860
The building at 616 Penn Avenue, a former lodge, is currently used as a beauty supply
store. This is a highly visible space that demands a tenant with higher revenue and
pedestrian traffic.
25 | P a g eAccording to PennDOT, traffic volumes along this stretch of Penn Avenue averaged
19,298 cars per day in May 2014. Truck traffic represented 3.8% of the total daily traffic,
which is relatively low. However, on a number of occasions, DDA staff observed
emergency vehicles racing through the CBD with sirens on. Some business owners
along Penn Avenue noted that the noise is too loud to extend business activities
outdoors for sidewalk sales or outdoor seating.
Wood Street – 700 - 900 Blocks
The 700 through 900 blocks of Wood Street include 25 parcels and a total of 94,276
square feet of ground floor space. The spaces are slightly smaller than Penn Avenue at
3,771 square feet and development along this corridor is much more pedestrian-
oriented. There are more vacancies along Wood Street than the 600 and 700 blocks of
Penn Avenue.
Square Footage
Address Street Building Ground Floor Business(es)
929 Wood St. 8,912 4,456 Star Optical, Davis Eye Group
902-908 Wood St. 35,532 10,000 House of Style/Good Green Fashion/Media Studio/
Wood & Penn Restaurant & Tobacco
901 Wood St. 17,901 4,475 Citizen's Bank
900 Wood St. 9,072 3,600 Vacant (former Subway)
829 Wood St. 9,942 3,314 R.C. Lin Building (medical offices)
827 Wood St. 4,376 2,188 Brother-In-Law's Place/not open for long time
825 Wood St. 10,424 2,800 Lucky Chinese Restaurant
822 Wood St. 31,200 3,900 Barber's Inn
817 Wood St. 10,424 3,475 Soul Food Connection/2 Vacant Storefronts
811/813 Wood St. 18,393 5,400 Vacant
810 Wood St. 77,454 8,606 Senior High-Rise/Yee Ho MD/Mz. Smiley's Childcare Ctr
805 Wood St. 15,488 3,872 Vacant
801 Wood St. 9,183 2,295 Vacant
725-727 Wood St. 12,707 3,177 Slated for redevelopment (office use)
723 Wood St. 5,856 2,928 Wood Street Bread Company
722/724 Wood St. 14,019 2,803 Pennwood Paint & Supply/Vacant
720 Wood St. 1,000 1,000 RiCarla's Creations
714-718 Wood St. 26,722 6,680 Milestone (office space)
712 Wood St. 11,880 3,960 James Flower and Gift Shoppe
708/710 Wood St. 5,808 1,936 Vacant
707 Wood St. 3,200 1,600 Vacant (former child care center)
703 Wood St. 2,112 2,112 Challenge Printing
702 Wood St. 8,950 4,475 Word of Mouf/Wilkinsburg Comm. Ministries
701 Wood St. 3,920 1,960 Ergo Mgt/A & B Demolition/Barak Plumbing
700 Wood St. 16,320 3,264 Generations Building (Supportive services and 15
transitional housing units targeting the homeless)
Total 370,795 94,276
26 | P a g eThe building at the southwest corner of
Penn Avenue and Wood Street (929 Wood
St.) is currently used as an
optometrist/optical center. As with the
beauty supplies store on Penn Avenue, it
is our opinion that this is a key location in
the CBD and the current business is not
the “highest and best” use of the property.
Notably, the Wood Street parcels are one
city block east of the soon-to-be revitalized
Wilkinsburg Train Station which is planned
to include a mix of uses. Farmers Market along Ross Avenue in CBD
Each of the corridors have small pocket parks integrated between buildings and both
have accessibility to the local farmer’s market.
2. Property Tax Mileage Rates
The affordability of property taxes is essential to redeveloping any commercial corridor,
especially one that has so much deferred maintenance and high vacancies. Properties
within the Borough of Wilkinsburg (and school district) have the highest property taxes in
Allegheny County.
Property Tax Mileage Rate Annual Taxes
School Per $100,000 Building
Area Municipal District County Assessed Value**
Wilkinsburg/CBD 14.0000 32.6300 4.7300 $5,136
Penn Hill Township 5.4440 24.8061 4.7300 $3,498
Neighboring Boroughs 6.9670* 22.4000 4.7300 $3,410
East End Pittsburgh 8.0600 9.8400 4.7300 $2,263
*Average rate, actual mileage ranges from 5.4800 (Churchill) to 8.0000 (Forest Hills and Swissvale)
**Does not include Homestead Act deduction for homeowner’s primary residence.
As the example of annual taxes per $100,000 assessed value shows, property taxes on
buildings in Wilkinsburg (residential and commercial) are more than twice the property
taxes paid in the City of Pittsburgh.
The WCDC’s recent Tax Abatement program is an important step in motivating
redevelopment of properties in the CBD. However, long-term these uncompetitive rates
will continue to make doing business or living in the borough difficult and will continue to
force some existing businesses and residents to move out of the borough.
27 | P a g e3. Factors that Influence Business Attraction/Retention
Based on the retail analysis, the CBD has the potential to redevelop into a vibrant
commercial corridor given the following factors:
High consumer spending
Above average market exposure with high volumes of traffic
Available space
Presence of national chain retailers
Ease of access
Historic character of select buildings
Low rental cost for startups
Retail categories unfilled in market
Stable household base (refer to demographic in Section E of this report)
The current environment (aesthetics and perceived crime), however, hinders the ability
of most retailers in the business district to capture any significant consumer spending
outside of the immediate area of Wilkinsburg. In fact, the largest share of consumers for
many of the retail businesses live within walking distance and residents of Wilkinsburg
who have a car often leave the area to dine and shop. This is not a sustainable retail
model. Without significant improvements to the environment, we anticipate a continued
decline of the area. It is DDAs opinion that it is essential for the following actions to be
taken to change perceptions of the area and fully realize any redevelopment
opportunities to attract and retain businesses:
Stop loitering at the corner of Penn Avenue and Wood
Street
Increase police presence or hire security guards
Provide lighting along the target area
Improve signage and install awnings
Reduce property taxes (WCDC Tax Abatement program
is a positive step)
Protect and winterize vacant buildings
Replace particle board in windows with Plexiglas or other
more appealing cover
Get historic designation for buildings that can still be
rehabilitated (in process, WCDC) so developers can use
Historic Tax Credit incentive
Modernize street parking by providing one pay station
(accepts credit cards) instead of multiple old coin
operated meters.
Install bike corrals and provide outdoor seating along
Wood Street
Consider converting Wood Street to two-way street
Improve pedestrian’s ability to cross Penn Avenue with
“bump outs” or curb extensions at the Penn
Avenue/Wood Street intersection (good example of curb
extensions along Penn Avenue in East Liberty). Outdoor bike corral and restaurant
seating in Regent Square
neighborhood
28 | P a g eE. Demographic & Economic Analysis This section includes a comparison of demographic and economic data for the following communities: Borough of Wilkinsburg East End Pittsburgh Census Tracts (CTs) Penn Hills Township Census Tracts (CTs) Boroughs of Swissvale, Edgewood, Braddock Hills, Forest Hills and Churchill Core CBD represented by two Census Block Groups The East End and Penn Hills selected CTs represent portions of their respective municipalities. The source of the demographic data is ESRI, Incorporated; the same demographic data provider used for the 2010 Business District Revitalization Plan. 29 | P a g e
1. Population Trends

        The population within each of the areas, except the East End of Pittsburgh, has declined
        from 2010 to 2015. A slight decline is projected for these areas over the next five years.
        The population for 2010, 2015 (estimated) and 2020 (projected) are summarized as
        follows:

                                               2010         2015                   % Change        2020        % Change
          Area                               (Census)   (Estimated)                2010-2015    (Projected)    2015-2020
          Wilkinsburg                         15,930       15,712                    -1.4%        15,665         -0.3%
                         Core CBD                 1,075        1,045                                   1,030
          Penn Hill Township CTs              13,083       12,910                   -1.3%         12,863        -0.4%
          Neighboring Boroughs                23,510       23,075                   -1.9%         22,919        -0.7%
          East End Pittsburgh CTs             15,595       15,748                   +1.0%         15,943        +1.2%

        Since 2010, the population in the East End Pittsburgh area has increased 1.0% and is
        projected to increase another 1.2% by 2020.

    2. Household Trends

        Household counts are a better indication of housing demand. From 2010 through 2020,
        the household base in all areas is projected to remain relatively stable. Household trends
        in Wilkinsburg and the region are summarized as follows:

                                               2010          2015                  % Change        2020        % Change
          Area                               (Census)    (Estimated)               2010-2015    (Projected)    2015-2020
          Wilkinsburg                          8,152         8,144                   -0.1%         8,160        +0.2%
                         Core CBD                    600           592                  -1.3%            588         -0.7%
          Penn Hill Township CTs               5,763         5,776                  +0.2%          5,792        +0.2%
          Neighboring Boroughs                11,496        11,423                   -0.6%        11,401         -0.2%
          East End Pittsburgh CTs              7,010         7,151                  +0.2%          7,266        +1.6%

        Within the next five years, the Borough of Wilkinsburg is projected to have a slight
        increase in households. In this same period, the Core CBD area is projected to lose four
        households.

        Households by tenure are distributed as follows:

                                             Share of Renter Households                  Share of Homeowner Households
          Area                              2010 Census    2015 Estimated                 2010 Census   2015 Estimated
          Wilkinsburg                          62.3%           65.1%                         37.7%           34.9%
                         Core CBD                  84.7%            86.7%                         15.3%          13.3%
          Penn Hill Township CTs               24.6%           27.2%                         75.4%           72.8%
          Neighboring Boroughs                 34.9%           37.4%                         65.1%           62.6%
          East End Pittsburgh CTs              52.0%           55.2%                         48.0%           44.8%
        Source: Ribbon Demographics; ESRI; DDA
        NOTE: Ribbon Demographics data was adjusted to ESRI household estimates.

30 | P a g e
You can also read