Corporate Presentation - Vinhomes

Page created by Kent Lane
 
CONTINUE READING
Corporate Presentation - Vinhomes
where happiness lives

Corporate Presentation       May 2021
Corporate Presentation - Vinhomes
Disclaimer

Disclaimer
  IMPORTANT: The information contained herein is preliminary and subject to change without notice, its accuracy is not guaranteed, has not been independently verified and may not contain all
  material information concerning Vinhomes Joint Stock Company (the “Company”) and its subsidiaries (the “Group”). You should not rely upon it or use it to form the basis for any investment
  decision or commitment whatsoever.

  None of the Company, its shareholders, or any of their respective affiliates, directors, officers, employees, agents, advisers or any other person makes any representation or warranty (express or
  implied) or accepts any responsibility or liability for the accuracy or completeness of this presentation or any or all of the information in this presentation or otherwise made available. It is not the
  intention to provide, and you may not rely on these materials as providing, a complete or comprehensive analysis of the financial or trading position or prospects of the Group. No part of this
  presentation shall form the basis of or be relied upon in connection with any contract or commitment whatsoever. Further, nothing in this presentation should be construed as constituting legal,
  business, tax or financial advice. You should conduct such independent investigations and analysis of the Group as you deem necessary or appropriate in order to make an independent
  determination of the suitability, merits and consequences of investment in the Company.

  This presentation contains “forward-looking statements”. These forward-looking statements involve known and unknown risks and uncertainties, many of which are beyond the Company’s control
  and all of which are based on management’s current beliefs and expectations about future events. Forward-looking statements are sometimes identified by the use of forward-looking terminology
  such as “believe”, “expects”, “may”, “will”, “could”, “should”, “shall”, “risk”, “intends”, “estimates”, “aims”, “targets”, “plans”, “predicts”, “continues”, “assumes”, “positioned” or “anticipates” or the
  negative thereof, other variations thereon or comparable terminology. These forward-looking statements include all matters that are not historical facts. Forward-looking statements are not
  guarantees of future performance. These forward-looking statements speak only as at the date of this presentation, and none of the company, its shareholders, or any of their respective affiliates,
  directors, officers, employees, agents, advisers or any other person undertakes to update or revise any forward-looking statements as a result of new information or to reflect future events or
  circumstances.
Corporate Presentation - Vinhomes
where happiness lives

Key Business Highlights
Corporate Presentation - Vinhomes
Vinhomes’ Unique Investment Proposition

                                                                                   1        Proxy to Vietnam and a Key Beneficiary of Attractive Macro and Sector Tailwinds
                                                                                       •     Vietnam posting 4.48% GDP growth in 1Q2021 amid regional peers’ economic contractions and expected to achieve above
                                                                                             7% in 2021, among the highest in the world
                                                                                       •     Fastest growing middle-income population in SEA, with attractive fundamentals for multi-year property growth cycles

                                                                                   2        Dominant Real Estate Developer with Unrivalled Land Bank
                                                                                       •     Clear market leader with dominant (1) market share in the mid and high-end segments
                                                                                       •     Unrivalled land bank sufficient for c.30 (2) years of development, expected to deliver sustainable growth

                                                                                   3        Ability to Harness Vingroup Ecosystem, Providing a Sustained Competitive Advantage
                                                                                       •     Integration of complementary product suite creates unique mixed-use developments and enhances value creation
                                                                                       •     Community and lifestyle creator with the ability to leverage on the Vingroup platform and comprehensive ecosystem

                                                                                   4        Proven Execution Track Record, with Business Strategies Aligned to Market Environment
                                                                                       •     Proven execution track record with rapid cash flow cycle from on-time construction and bulk sales strategy
                                                                                       •     Active strategic management with the ability to pivot and roll-out strategies aligned to market environment

                                                                                   5        Superior Operational Performance, Coupled with Robust Balance Sheet and Access to Capital
                                                                                       •     Continues to achieve superior operational and financial performance, delivering on earnings growth with robust margins
                                                                                       •     Well-positioned to withstand market challenges with robust balance sheet supported by long term blue chip investors and
                                                                                             partners

                                                                                   6        Experienced Management Team and Robust Corporate Governance
                                                                                       •     Senior leadership with significant depth of experience and pedigree
                                                                                       •     Highly committed to robust corporate governance standards in line with global best practices

                                                                                   7        Portfolio Diversification into Industrial Real Estate as The Next Growth Engine
                                                                                       •     Strong tailwinds within the industrial sector with accelerating inbound FDI and supportive government initiatives
                                                                                       •     Enhances recurring income stream and buffers the cyclical nature of residential earnings

Note:   (1) Based on accumulated sold units from 2016 to 1Q2021 across mid-end and high end segments in the residential markets of HCMC and Hanoi, according to CBRE
        (2) Based on 164 million sqm total residential GFA for sale divided by average residential GFA sold annually from 2020 – 2022E
                                                                                                                                                                                                                       3
Corporate Presentation - Vinhomes
1            Attractive Fundamentals For Multi-Year Property Growth Cycles

The Fastest Recovering and Growing Economy In SEA Region                                                                               Strongest Middle Income Growth
Real GDP growth(1) (%)                                                                                                                 Middle Income Population(2) Growth, 2020 – 2025E CAGR (%)

                  7.0                                                                                                        7.0 6.4
                                                                                                                                                                                                                        13.9%
                        6.0                                                       6.0 5.5
                                                             4.7                                               5.3                                                                                                      12.5%
                                       4.5 4.0                                                          4.5
                                                                    3.5                                               2.9
                                                                                                                                                                                                          9.4%
                                                                                                                                                                                           8.0%
                                                                                                                                                                             6.4%

                                                                                                (2.3)                                                          3.6%

                                                                          (6.0)                                                                 1.7%
                                                     (6.3)
                               (7.0)

         (10.0)
           Philippines             Thailand            Singapore             Malaysia             Indonesia              Vietnam              Singapore     Malaysia       Thailand     Philippines     Indonesia      Vietnam

                                                           2020            2021             2022

Vietnam Targets To Spend Highest Level Of Public Investment As % Of                                                                    Significantly Underpenetrated Mortgage Market
GDP And Has Made Strongest Rate Cuts in 2020                                                                                           Total Home Mortgage Loans Outstanding as % of GDP in 2020
                                                                                                                                                                                                                      51.9%
Public investment as % of GDP (2020 Target)
                                                                                                                                                                                              48.1%

YTD                                                                                                                                         Average 41.7%
policy rate          200                 180                  147                  75                   116                 125
cuts (bps)
                   10.4%
                                                                                                                                                                         25.0%

                                         6.6%

                                                             3.9%                 3.9%                  3.8%
                                                                                                                            2.6%                    6.4%

                  Vietnam           Philippines          Singapore             Thailand            Malaysia             Indonesia                 Vietnam              Thailand              Malaysia               Singapore

                              Vinhomes Offers The Best Proxy to Tap Growth of Vietnam’s Middle Class and Consumer Demand
 Source: Euromonitor, MPI
 Note: (1) Euromonitor, Jan 2021 (2) Middle income population defined as households with income of more than US$10,000 per annum
                                                                                                                                                                                                                                 4
Corporate Presentation - Vinhomes
2 Dominant Residential Real Estate Developer

                                                     Dominance of Vietnam Residential Market by a                                                                     Largest Land Bank Expected to Deliver Sustainability and
                                                                                                                                                                       Growth
                                                     Significant Margin

                       where happiness lives
                                                     
                                                     • 146,492 Residential Units Pre-sold Since 2010                                                   Land bank (mm sqm)
                                                                                                                                                                             (3)
                                                                                                                                                                                                              Translates to 164mm sqm of
                                                     
                                                     • US$19Bn Contracted Sales Since 2010                                                                              168                                       residential GFA (3)(4)

                     Significant (2)                                                           Dominant (1)
     Residential market share in Vietnam across                                     Residential market share in Vietnam                                                                          ~24x the land bank of next largest competitor
            ALL condominium segment                                                across MID-END condonium segment

                                                                                                                                                                                                               7                                       7                                   6
                                                     Vinhomes
                                                                                                                             Vinhomes
                                                                                                                                                                                                                           (5)                                   (5)                                   (5)
                                  25%                Developer A                                                                                                   Vinhomes                           Developer A                            Developer B                          Developer C
                                                                                                              33%            Developer A

                                      3%
                                                     Developer B

                                                     Developer C                  56%
                                                                                                                             Developer B
                                                                                                                                                                        Capturing the Huge Middle Income Opportunity with the
                                                                                                                                                                         Vinhomes Sapphire Brand
                                      3%                                                                                     Developer C
         65%                         2%                                                                     3%
                                     2%              Developer D                                           2%
                                                                                                          2%                 Developer D
                                                                                                         4%
                                                     Others
                                                                                                                             Others                                                                                          where happiness lives

                                               (2)                                             Significant             (2)
                        Dominant                                                                                                                                  Happy                             Vinhomes                                  Vinhomes                       Vinhomes
       Residential market share in Vietnam across                               Residential market share in Vietnam across
           HIGH-END condominium segment                                              LANDED PROPERTIES segment                                                    Town                               Sapphire                                   Ruby                         Diamond

                                                     Vinhomes                                                                Vinhomes
                                                                                                                                                                 Affordable                             Mid-End                                      High-End                     Luxury
                                                                                                           21%
                                                     Developer A                                                             Developer A
        38%                                          Developer B
                                                                                                                                                                                                             18%(3)
                                                                                                                                                             Residential
                                    44%                                                                                      Developer B

                                                     Developer C
                                                                                                                 6%                                              Strongmarket
                                                                                                                                                                          Trackshare
                                                                                                                                                                                Record    of Historical Sales Value
                                                                                                                                                                                     in Vietnam across ALL segments
                                                                                   59%                                       Developer C
                                                                                                                6%
                                                     Developer D                                            4%
                                                                                                                             Developer D
             3%                                                                                            3%
               4%4% 6%                               Others                                                                                                                         Unbilled bookings of US$2.4Bn(6) as of 31 Mar 2021
                                                                                                                             Others

                                                                                                                                                          US$Bn                                       2010 – 2015                2016          2017         2018          2019           2020         1Q21
  Complete Ecosystem of Complementary Offerings at Each Site with an Emphasis on Quality
                                                                                                                                                          Historical Sale
                                                                                                                                                                                                                    2.9            2.7               3.0       2.9           3.9           2.8               2.4
                                                                                                                                                          Value
                                                                                                                            Hospitality /
   Retail Property             Consumer Retail                     Medical                        School                   Entertainment

Source: CBRE, Company Filings. Notes: Based on USDVND of 21,095 for 2013; 21,388 for 2014; 22,485 for 2015; 22,761 for 2016; 22,698 for 2017 and 23,240 for 2018, 23,270 for 2019, 23,035 for 2020, 23,070 for 1Q21. (1) Based on accumulated sold units from 2019 to 1Q21 across mid-end segment in the
residential market of HCMC and Hanoi, according to CBRE. (2) Based on accumulated sold units in the high-end, luxury condominium, all condominium and landed segments in HCMC and Hanoi from 2016-1Q21, according to CBRE. (3) As of 31 March 2021 (4) Including apartments, officetel, shophouses,
shop office, villa, commercial for sale, beach villa and condo-tel. Excludes completed projects. 164 mm sqm of residential GFA converts into c. 146 mm sqm of NSA. Not including GFA from Vinhomes Hoc Mon and Industrial land bank. (5) Residential land bank of next largest residential development        5
competitors based on latest available public filings (6) Include retail and bulk sales value. Doesn’t include certain bulk sales transactions at advanced stage of discussion at the time of reporting.
Corporate Presentation - Vinhomes
2 Unrivalled Land Bank in Strategic Locations Forms Pillar of Growth

        Land Bank by Site Area                                                                                                                                      Gross development value (2)(3)
        (mm sqm)
                                                                                                                                                                                       ~60% of GDV is attributable to key cities of Hanoi and HCMC

                              Translates to 164mm sqm of residential GFA(1)(2)

                                                                                                                                                                                                                   Others                                      Hanoi:
                                                                                                                                                                                                                    14%
                                                                                                                                                                                                                                                               US$15.6 bn
                                                                                                             6                                                                                                                      Hanoi
                                                                                                                                                                                                                                    32%
                                                                                                                                                                                                  Hung Yen 19%

                                                                                                                                                                                                                              HCMC
                                                                                                                                                                                                     Quang Ninh
                                                                                                                                                                                                                               26%
                                                                                                                                                                                                                                                               Ho Chi Minh City:
                                                                                                                    (1)                                                                                 8%
                                                                                                                                                                                                                                                               US$12.6 bn
                                                                                                          155
                                                                                                                                                                                                                                                      Total GDV (up to 2025): US$48.2bn

                                       13
                                                                                                                                                                    Land bank by GFA for sale (mm sqm) (1)(2)(3)

                               Launched                                                    Pipeline Projects                                                                      ~50% of residential GFA is located in key cities of HCMC and Hanoi

                       Additional projects under feasibility studies
                                                                                                                                                                                                                                                                      Hanoi
                                                                                                                                                                                                                                                                      GFA: 14.7mm sqm
                                                                                                                                                                                                                  Others
                                                                                                                                                                                                                   19%              Hanoi
                                                                                                                                                                                                                                    20%

                      6 million sqm is under feasibility study                                                                                                                                 Hung Yen 16%
                                                                                                                                                                                                                                    HCMC
                                                                                                                                                                                                                                                                     Ho Chi Minh City
                                                                                                                                                                                                                                     31%                             GFA: 22.3mm sqm
                                                                                                                                                                                                        Quang Ninh
                                                                                                                                                                                                           14%

                                                                                                                                                                                                                                   Total Residential GFA (up to 2025) 73mm sqm

Notes: (1) As of 31 December 2020. (2) Including apartments, officetel, shophouses, shop office, villa, commercial for sale, beach villa and condo-tel. Excludes completed projects. 164 mm sqm of residential GFA converts into c. 146 mm sqm of NSA. Not including GFA from Vinhomes Hoc Mon. (3) Represents
residential GDV only, excluding other for-sales components such as hospital, school, etc which may be sold to other third parties; for projects to be launched up to 2025 only.
                                                                                                                                                                                                                                                                                                                 6
Corporate Presentation - Vinhomes
3             Ability to Harness Vingroup Ecosystem
   Vingroup has established itself as a market leader across the full breadth of consumer related sectors from essentials
                                                       to aspirational

                                                                                       Residential                                                                                                  Retail Leasing

                                                                                                             where happiness lives

                                                                                                 Integrated residential                                                                         Retail mall owner, developer and
                                                                                                 developer in Vietnam                                                                                  operator in Vietnam

                                  Consumer Retail
                                                                                                                                                                                                                                           Hospitality
                                                                            (2)

                                  Comprehensive multi-format                                                                                                                                                                                          Hospitality and
                                       retail operator                                                                                                                                                                                            entertainment operator

                     Social Infrastructure                                                                                                                                                                                                        Industrials/Technology

                  Healthcare and education provider

                                                                                                                                                                                                                                                   Automobile manufacturer, mobile
                                                                                                                                                                                                                                                   devices and technology ventures

                                                                                              #1 loyalty program in Vietnam with c.11 million members(1)

                                                                                      Vingroup is The Largest Listed Company in Vietnam

Source: CBRE, McKinsey, Vietnam National Administration of Tourism, Health Statistics Yearbook, Company estimates. Note: (1) As of 31 March 2021 (2) Non-controlling interest in a subsidiary of Masan Group which owns Masan Consumer Holdings, the largest manufacturer of consumer products by revenue,
and VinCommerce, the largest consumer retail network in terms of number of grocery retail stores
                                                                                                                                                                                                                                                                                                             7
Corporate Presentation - Vinhomes
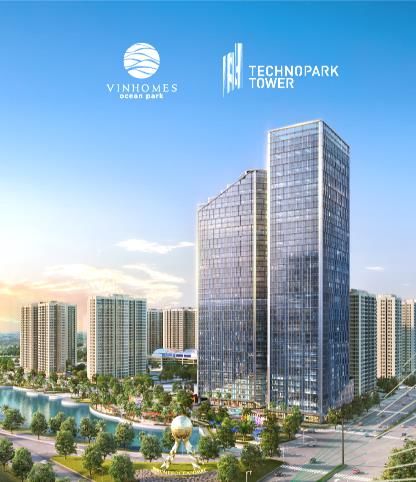
3 Vinhomes – Not Just a Homebuilder but a Community Creator

                                                                                                                                                                                                                (1)

                                                                                                                           Residential /                                                                                                                                   Hospitality /
                                  where happiness lives                                                                      Office                       Retail / Office               Consumer retail                       Medical                          School     Entertainment
                                                                                                                       • Vinhomes                      • Vincom Center                • Vincommerce                   • Vinmec                        • Vinschool        • 5-star Vinpearl
                      #1 dominant integrated                                                                            Central Park:                   Central Park                                                   Central Park                    K-12 education     Hotel Landmark
                       residential and commercial                                                                                                                                       − 7 VinMart +                   International                                      81
                       developer                                                                                         − The Central                 • Landmark 81                                                    Hospital
                                                                                         Central                                                         commercial                     − 1 VinMart                                                                       − 223 hotel
                                                                                         Park                            − The Park                      space                                                                                                              rooms
                      Ecosystem of complementary                                        (HCMC)
                                                                                                                         − Landmark 81
                       consumer service offerings at
                       each project                                                                                      − > 11,000 units

                      Active in mega project
                                                                                                                       • Vinhomes                      • Vincom                       • Vincommerce                   • Vinmec Times                  • Vinschool        • Vinpearl Land
                       developments and pioneers in
                       partnerships with sub-developers                                                                  Times City &                    Mega Mall                                                      City                            Kindergarten       Aquarium
                                                                                                                         Park Hill                       Times City                     − 6 VinMart +                   International                                      Times City
                       on projects                                                                                                                                                                                                                      − 5 schools
                                                                                                                                                                                                                        Hospital
                                                                                         Times                           − c.13,000 units • Vincom Office                               − 1 VinMart
                                                                                         City                                               Times City                                                                                                • Vinschool
                      Nation-wide operation and first                                   (Hanoi)                                                                                                                                                        Elementary,
                                                                                                                                                                                                                                                        Secondary and
                       mover advantage in several
                                                                                                                                                                                                                                                        High School
                       second-tier cities and satellite
                       project developments

                                                                           Ecosystem of Complementary Products and Services At Each Site

Note: (1) Non-controlling interest in a subsidiary of Masan Group which owns Masan Consumer Holdings, the largest manufacturer of consumer products by revenue, and VinCommerce, the largest consumer retail network in terms of number of grocery retail stores

                                                                                                                                                                                                                                                                                           8
Corporate Presentation - Vinhomes
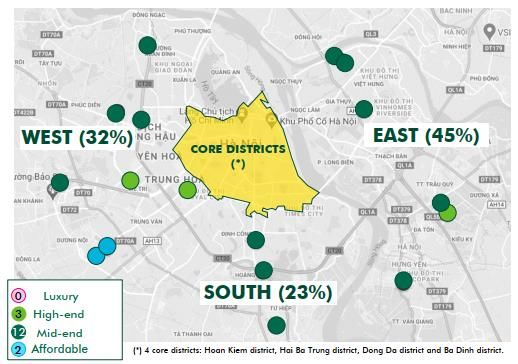
4 Proven Track Record and Rapid Cash Flow Cycle Leading to Superior Returns
Vinhomes’ Superior End-to-end Value Chain                                                                                                                                  Award Winning Developments
                                            Ability and track record in securing the best land bank in Vietnam
                                            Continuously search for and acquire new sites through project                                                                                Best Mixed-Use
                                             development
                                                                                                                                                                                                                                                                Best Township
     Land Acquisition                                                                                                                                                                      Development
                                                                                                                                                                                                                                                                 Development
                                                                                                                                                                                             Vietnam
                                            Master planning ability in developing and designing integrated projects                                                               Vinhomes Ocean Park                                                   Vinhomes Smart City
                                             with ecosystems
  Master Planning and
        Design
                                            Effectively assists Vietnamese state agencies in identifying land rights                                                                       Worth Living                                                      Vietnam Urban
                                             holders and facilitating resettlements on the government’s behalf                                                                                Project                                                        Planning Awards
                                            Successfully shortens land clearance process from c. 2—3 years
      Land Clearance                         per project to c. 9—12 months                                                                                                                                                                                   Vinhomes/
                                                                                                                                                                                   Vinhomes Ocean Park
                                                                                                                                                                                                                                                        Vinhomes Ocean Park
                                           Significant de-risking of model through Vingroup’s ecosystem of
                                            complementary offerings such as hospitals, schools and retail                                                                  Industry Leading Operational Metrics
    Infrastructure and                                                                                                                                                     Return-on-Equity(1) (%)
        Ecosystem
                                            Ability to get customers to pay 70% upfront, reducing Vinhomes’
                                                                                                                                                                                        Vinhomes                                                                                         30.4%
                                             reliance on credit financing
      Pre-sales, Sales                      High take-up rate of 95% achieved for cumulative units launched
       Research and                          until 31 December 2020 at three mega projects (2)                                                                                           Novaland                                                                    22.4%
         Marketing
                                            Ability to control costs, quality and deadlines to ensure efficient
                                             delivery of superior quality properties                                                                                           Land & Houses                                                                18.8%
    Construction and
     Quality Control
                                                                                                                                                                                      Ayala Land                               7.4%
                                            Comprehensive range of after-sales services to ensure Vinhomes’
                                             buyers needs are met
         Property                           Ancillary facilities such as gyms, pools, meeting areas, barbeque pits,                                                                            BSD                 3.2%
        Management                           parks and waterways at Vinhomes properties

                                                           Vinhomes’ Unique Execution Capabilities Translate to Significant Competitive Advantage

      Secures Land at
       Competitive Rates
                          Effective Cost and Quality
                           Controls to Maintain Margins  Unique  Selling Strategies
                                                          De-risk Development Outlays                                                                                                                                  After-Market Service Offering Captures
                                                                                                                                                                                                                        Customer & Enhances Loyalty to Vinhomes

Source: Company filings
Notes: (1) LTM as of Dec 2020; net profit after minority interests divided by shareholder’s equity (2) Including bulk sales units. Three mega projects are Vinhomes Ocean Park, Vinhomes Smart City and Vinhomes Grand Park, which are the key growth driver for Vinhomes in 2018, 2019, 2020.
                                                                                                                                                                                                                                                                                                 9
4 Business Initiatives Aligned to Market Environment
  1                                                                                                   2                                               3
             Driving Growth Through
                                                                                                                        Bulk Sales Strategy                 Innovative Sales Channel
               Vinhomes Sapphire

      • Capitalize on the huge potential                                                                  • Well defined wholesale strategy to            • Transition towards a direct/online
           of Vietnam’s rapidly growing                                                                       further enhance execution and                sales model as the primary
           middle-class                                                                                       pull forward cash flows, further             distribution channel
                                                                                                              strengthening liquidity
      • Robust ecosystem helps                                                                                                                            • Enhanced customer experience
           Vinhomes to successfully execute                                                               • Shorter project development                    with transparent pricing and direct
           large township projects                                                                            period with secondary developers             communication with a single point
                                                                                                              concurrently building up the                 of contact
      • Maximize income streams by
                                                                                                              project
           offering additional ancillary                                                                                                                  • Vin3S platform introduced as a
           products, and value-added                                                                      • Leverage on Vinhomes’ track                    one stop shop for all products and
           services                                                                                           record and financial capacity to             services within the Vingroup’s
                                                                                                              conduct large scale infrastructure           ecosystem, providing cross-selling
                                                                                                              development                                  and marketing opportunities

                   Dominant (1)
          Market Share in Mid-End Segment                                                                               Reputable Project Partners

Note: (1) Based on accumulated sold units from 2016 to 4Q2020 across mid-end segment in the residential market of HCMC and Hanoi, according to CBRE

                                                                                                                                                                                                 10
5 Consistently Delivered Since IPO

                                       Maintaining Dominant Leadership                                                                                                                     Successfully Expanding into Mid-End Segment

Landbank (MM sqm)                                                             PATMI (VND Bn)
      At IPO (2017)                             FY2020                               At IPO (2017)                            FY2020
           21x                                   21x                                      6x                                    7x                                            Dominant (2)                                                                 33%
                                                                                                                                                                              Residential market
                                                                                                                                                                               share in Vietnam
      164                                 168                                      11,319                              27,351                                                   across mid-end                                 56%
                                                                                                                                                                                   segment                                                                3%
                     ~8                                  ~8                                     ~ 2,000                              ~ 3,900                                                                                                             2%
                                                                                                                                                                                                                                                        2%
                                                                                                                                                                                                                                                       4%
  Vinhomes           Next             Vinhomes           Next                    Vinhomes          Next               Vinhomes          Next
                  largest VN                          largest VN                                largest VN                           largest VN                            Vinhomes              Developer A              Developer B              Developer C    Developer D      Others
                  Developer (1)                       Developer
                                                                 (1)
                                                                                                Developer
                                                                                                           (1)
                                                                                                                                     Developer
                                                                                                                                                (1)

 Vinhomes continues to be the dominant platform with unmatched
      landbank                                                                                                                                                     Successfully introduced the Vinhomes Sapphire product targeting
                                                                                                                                                                        mid-end segment
 Provides visibility on earnings and superior financial performance

                                            Delivering Growth Promise…                                                                                                                                          …While Improving Margins

Revenue (VND Bn)                                                                                                                                                 Gross Profit from property sales (VND Bn)
                                                                                          Next Largest VN Developer                      (1)
                        Vinhomes                                                                                                                                                      31%                                               55%                                 37%

                                              89,184                                                                                                                                                                                  35,979
                                                                                                                                                                                    22,425                                                                                25,095
                                                                                         ~12,000
           46,798
                                                                                                                            ~ 5,000
                                                                                                                                                                                      2018                                             2019                                2020
             2017                               2020                                        2017                               2020                                        Gross Profit from property sales                                        Gross Profit Margin from property sales

 Continued to deliver on earnings growth, significantly                                                                                                           Unparalleled scale and superior end-to-end execution capabilities
      outperforming peers                                                                                                                                               leading to robust margin

             Successful Execution and Strong Track Record Led to Investment from New Long-term Shareholders (e.g. KKR, Temasek in June 2020)

Notes: (1) Next largest Vietnam developer by market capitalization; information obtained from public filings (2) Based on accumulated sold units from 2019 to 1Q21 across mid-end segment in the residential market of HCMC and Hanoi, according to CBRE

                                                                                                                                                                                                                                                                                            11
5 Well-positioned To Withstand Market Challenges

Balance
  Total Assets
              Sheet Overview                                                                                                                             Total Cash & Cash Equivalents(1) and Total Borrowings
       VND Bn                                                                                                                                            VND Bn

                                                                                       215,326                           210,096                            31,909
                                                     197,241
                                                                                                                                                                                    26,505
                                                                                                                                                                                                       24,955
                                                                                                                                                                                                                           23,096
                                                      57,686                           113,014                           113.671
                   119,689
                                                                                                                                                                                             13,693             15,768
                    28,486
                                                                                                                                                                                                                                    9,542
                                                     139,555
                                                                                       102,312                            96.425                                     4,525
                    91,203

                 31-Dec-18                         31-Dec-19                         31-Dec-20                          31-Mar-21                             31-Dec-18               31-Dec-19          31-Dec-20           31-Mar-21

                                              Current Assets                  Non-current Assets                                                                             Total Borrowings         Cash and Cash Equivalents

      Net Debt(2) / Equity
                                                                                                                                                            Supported by Blue-Chip
                                                                                                                                                                                                        Reputed Project Partners
                                                                                                                                                            Long-Term Shareholders

                          20%

                                                                                                                     14%

                                                                       10%

                     31-Dec-19                                     31-Dec-20                                     31-Mar-21

                                  Robust Balance Sheet Position Supported by Prudent Risk Management Practices and Superior Access to Capital

Note: Based on VAS Audited Consolidated Financial Statements for 2017, 2018, 2019, 2020 and VAS Unaudited Consolidated Financial Statements for 1Q2021
(1) Cash and cash equivalents includes short-term investments. (2) Net Debt = (Short-term Borrowings + Long-term Borrowings) – Cash & Cash Equivalent.
                                                                                                                                                                                                                                            12
6 Experienced Management Team and Robust Corporate Governance
  Vinhomes is led by a team of highly experienced board of directors who are supported by a experienced management team with average 23 – 24 years of experience

                       Nguyen Dieu Linh                                                       Pham Nhat Vuong                                     Pham Thieu Hoa
                       Executive Chairwoman                                                   Non-Executive Director                              Executive Director cum CEO
                        >17 years with Vingroup                                               >27 years experience                               >17 years with Vingroup
                        >24 years experience                                                  Founder of Vingroup, formerly known as             >33 years experience
                        Vice Chairwoman of Vingroup since 2008,                                Technocom Corporation in 1993                      CEO of Vinhomes, previously Project
                          previously Deputy CEO of Vingroup                                    Chairman of Vingroup since 2011                     Development Director of Vingroup since
                                                                                                                                                    2005

                       Ashish Sashtry                                                         Cao Thi Ha An                                       Tran Kien Cuong
                       Non-Executive Director                                                 Executive Director                                  Executive Director
                        >25 years experience                                                  >29 years experience                               >6 years with Vingroup
 Board of               Currently Partner of KKR, Co-Head of Asia                             Project Development Director at Vingroup           >35 years experience
 Directors               Pacific Private Equity and Head of                                     since 2016                                         Currently Senior Director at Vinhomes
                         Southeast Asia                                                        Previously Deputy CEO and Director of
                                                                                                Military Insurance JSC
                       Mueen Uddeen                                                           Varun Kapur                                         Hoang D. Quan
                       Independent Non-Executive Director                                     Independent Non-Executive Director                  Independent Non-Executive Director
                        >42 years experience                                                  >29 years experience                               >25 years experience
                        Currently Managing Director of Arcpoint                               Currently also Managing Partner of                 Currently Founder & Chairman, FinSafe
                         Associates Advisory                                                    Indgrowth Capital                                   JSC.
                                                                                               Previously Partner and Managing Director           Previously Deputy CEO, PVI Asset
                                                                                                at TPG                                              Management

                                                                                              Pham Thieu Hoa
                                                                                              Executive Director cum CEO
                                                                                               >17 years with Vingroup
                                                                                               >33 years experience
                                                                                               Previously Project Development Director at
                                                                                                Vingroup since 2005

                       Nguyen Thu Hang                                                        Douglas Farrell                                     Nguyen Duc Quang
Management             Standing Dy CEO                                                        Dy CEO, Finance and Investment                      Dy CEO, Sales and Marketing
   Team                 >12 years of experience in auditing, risk                             >17 years experience in financial services         >6 years with Vingroup
                         management and banking                                                Appointed Deputy Chief Executive of                >15 years experience
                        Previously Director of DCM at VietinBank &                             Finance and Investment of Vinhomes in              Previously Sales and Marketing Director at
                         Board Member of IVB                                                    2018                                                Mercedes Benz An Du Autohaus
                        Member of CPA Australia since 2009                                    Chartered Accountant
                       Pham Van Khuong                                                        Mai Thu Thuy                                        Nguyen Vu Hung
                       Dy CEO, Construction                                                   Dy CEO, Support                                     Dy CEO, Security, Safety and Fire Prevention

                        >18 years with Vingroup                                               >15 years with Vingroup                            15 years with Vingroup
                        >37 years experience                                                  Previously Dy CEO of Vincommerce,                  Previously held directorship in Vincom
                        Previously Dy CEO of Vingroup                                          Director at Vingroup and Vinpearl                   Security since 2018

                                                                                                                                           
                                                                                                          Proven on-the-grounds management
 
     Committed to robust corporate                          Senior leadership with                                                               Proven ability to hire, train and
     governance standards in line with                      significant depth of experience               team supporting nation-wide            retain talent across business
     global best practices                                  and pedigree                                  operations                             lines

                                                                                                                                                                                             13
6     Institutional Level Corporate Governance
Corporate governance principles emphasize a quality Board, sound internal controls, transparency and accountability to all
shareholders

Controls put in Place

• All transactions must be entered into on commercially reasonable basis as a statutory requirement                    No conflict of
• Significant
   Shareholders
               related party transactions must be approved by the Board of Directors or the General Meeting of
                                                                                                                     interest in decision
• Interested parties must abstain from voting                                                                             making

• Vinhomes to undertake Vingroup residential and office mixed-use development going forward                             No direct
• Vingroup
   Vietnam
            to continue holding non-residential and non-office mixed used development real estate properties in       competition with
                                                                                                                         Vingroup

• Entire project development team of Vingroup has been transferred to Vinhomes to ensure alignment of interest       Clear distinction of
• InVinhomes
       addition, Vinhomes has ROFR on land that can be used for residential from Vingroup at cost. This ROFR gives
               economies of scale in land sourcing and leverage of the Vingroup brand in site acquisition
                                                                                                                     scope for Vinhomes

• Management   service fees and construction EPC contracts are calculated based on comparable third-party service
   providers and Vingroup fees are allocated based on number of man hours and assets under management
                                                                                                                         Fair market
• Helps Vinhomes to manage expansion with minimum overhead as it can share resources and costs with the rest of
   Vingroup                                                                                                               practices
• Governed by related party rules

                                                                                                                                             14
7 Industrial Real Estate As A New Growth Driver
       Industrial Real Estate in Vietnam is an Attractive Investment Proposition
      Vietnam’s FDI and PMI Achieved Highest Levels Over The Last 12 Months                                                                                 Top Provinces in Drawing Investment 1Q21
         Expansion into Industrial Real Estate
      Despite Covid-19 Outbreak In 1Q21                                                                                                                     Registered FDI (US$ Bn), 1Q21(2)
      Registered FDI (US$ Bn)(1)                                                                  Registered FDI                       PMI Index1,000            946                                             Accumulated Registered Capital 1Q21
                                                                                                                                                                                                                 $10.13bn                +18.5%YoY
6.0                                                                        52         52                   52        51         52         54      60
                                            51                                                  50
                                                      48         46
5.0         42                   43                                                                                                                50                             679            649
4.0                   33                                                                                                                           40
                                                                                                                                                                                                                    446             431        420
3.0                                                                                                                                                30

2.0                                                                                                                                                20

1.0                                                                                                                                                10
           2.1        3.7       1.6        1.8       3.1        0.7       1.7        2.3       2.9        2.1        2.0       3.5        4.7
0.0                                                                                                                                                -    0
          Mar        Apr       May        Jun        Jul       Aug        Sep        Oct       Nov       Dec        Jan        Feb       Mar                 Hai Phong            HCMC         Bac Giang         Binh Duong    Daklak       Tay Ninh

                                                                                                                                                            Despite The 3rd Wave Of Covid, Rent Reached A New High While Occupancy
      Structural Drivers for Increasing Manufacturing in Vietnam (3)
                                                                                                                                                            Rate Remained Healthy Across Industrial Parks In 1Q21
       EU-Vietnam Free Trade Agreement (EVFTA) came into effect in August 2020 after 10                                                                    Industrial Land & Ready-built Factory Market   (3)

           years of negotiation, and is set to boost manufacturing activity. The EVFTA is
           expected to increase GDP by 4.6% and EU bound exports by 42.7% by 2025                                                                                                                                     Lease price
                                                                                                                                                            Economic Zone                                                                  Occupancy rate
                                                                                                                                                                                                                      YoY growth
       Shifting of manufacturing supply chains to Vietnam due to US-China trade war, low
           labour costs and government incentives to drive FDI (e.g. LG, Samsung, Kyocera,
                                                                                                                                                            Northern:
           Nintendo etc.)
                                                                                                                                                                                                                                    5.8%             75% - 98%
       Large headroom for growth in manufacturing contribution to Vietnam GDP                                                                              Hanoi, Hai Phong, Bac Ninh, Hung Yen and
       One of the most cost-efficient markets for industrial building costs, and one of the                                                                Hai Duong
           most competitive tax regimes in Asia
                                                                                                                                                            Southern:
       Abundant land supply to facilitate incoming manufacturing projects
                                                                                                                                                                                                                                    3.1%             82% - 86%
       Diversification due to COVID-19 disruption                                                                                                          HCMC, Binh Duong, Dong Nai, Ba Ria –
       The New Law on Investment and Law on Enterprise came into effect on 1 Jan 2021,                                                                     Vung Tau and Long An
           providing further incentives for foreign investment

           PMI rebounding to 54 in Mar 2021 reflective of swift return to positive business conditions                                                                     (4)

           10% growth in industrial production in Apr 2021                                                 (4)

      Source: (1), (2) CBRE, World Bank, MPI, FIA and Company research, Exclusive LNG projects in Long An, Can Tho (3) JLL (4) Trading Economics

                                                                                                                                                                                                                                                          15
where happiness lives

1Q2021 Operational Updates
Key Messages

                       COVID-19 outbreak well-contained, bolstering market confidence and economic recovery
                       • The COVID-19 outbreak in 1Q 2021 was quickly contained. Vietnam’s economy continued its upward climb, surging ahead with a
                         4.48% GDP growth (YoY) for 1Q 2021
                       • Vietnam’s Manufacturing Purchasing Managers’ Index (PMI) reached 53.6 in March 2021 and saw USD 4.7 billion in registered
        1                FDI, the highest monthly print in the past 12 months, reflecting a strong rebound in manufacturing and business confidence
                       • New orders increased for the seventh consecutive month at its fastest pace since July 2019. Public investment improved
                         significantly in 1Q, increasing 7.5% YoY and at its highest rate since 2011
                       • The accelerating trend of urbanization, coupled with a low-interest rate environment, are expected to drive a strong growth cycle
                         in Vietnam’s real estate

                       Robust pre-sales despite the impact of COVID-19 and Lunar New Year
                       • Nearly 1,600 units presold to retail customers in 1Q 2021 with a total contracted value of VND 6 trillion (+97% YoY)
        2
                       • Condominiums contributed VND 3 trillion (50%) in pre-sales, maintaining a balanced mix of high- and low-rise sales in 1Q
                       • Approximately 92% high-rise units sold in 1Q 2021 attributable to Vinhomes Ocean Park and Smart City project

                       Healthy backlog maintain revenue and profit recognition momentum
        3              • Around 2,900 retail units delivered in 1Q2021 mostly from mega projects
                       • Total converted revenue(1) and profit after tax in 1Q2021 reaching VND 15.6 trillion and VND 5.5 trillion

Note: (1) Converted revenue includes revenue recognition from retail sales, bulk sales sales of BCC projects and revenue from other activities.
Source: IHS Markit, VnEconomy, Company Information.
                                                                                                                                                        17
1Q2021 Highlights

                       Retail Units Pre-sold
                          and Deposits                                                                                          New Retail Booking(1)                                                                                    Unbilled Bookings(2)
                            secured(1)
                         1Q20                                       1Q21                                                          1Q20                                      1Q21                                                              1Q20                                   1Q21

                     1,216                                       1,592                                                          VND                                       VND                                                               VND                                    VND
                     units                                       units                                                        3.1 tn                                     6.0 tn                                                         79.6 tn                                  55.4 tn
                                                         31% yoy                                                                                                 97% yoy                                                                                                   30% yoy

                              Revenue from                                                                                                                                                                                                  Profit after Tax &
                                                                                                                                          Gross Profit(3)
                             Property Sales(3)                                                                                                                                                                                              Minority Interest
                        1Q20                                        1Q21                                                          1Q20                                         1Q21                                                     1Q20                                         1Q21

                     VND                                        VND                                                            VND                                          VND                                                      VND                                          VND
                     5.7 tn                                    10.0 tn                                                         2.8 tn                                       5.6 tn                                                   6.8 tn                                       5.4 tn
                                                          75% yoy                                                                                              103% yoy                                                                                                      21% yoy

Note: Based on Vinhomes JSC VAS 1Q2021 unaudited consolidated financial statements. (1) Estimated pre-sale under SPAs and pre-sale bookings under deposits, including BCC projects deposits; (2) Include retail and bulk sales value. Doesn’t include certain bulk sales transactions at advanced stage of
      discussion at the time of reporting; (3) Represents gross profit of property sales only, does not include BCC projects and bulk sales in form of share transfer transactions.
                                                                                                                                                                                                                                                                                                             18
Roll-out of Innovative Platforms to Drive Digital Transformation

                                                               Launch of the Online                         Introduction of O2O
                   VHM Sales Agent App                           Leasing Platform                             Business Model

  • The VHM Sales Agent App equips                     • In March 2021, Vinhomes launched its       • In January 2021, Vinhomes
        sales agents with a smart, convenient            e-commerce leasing website                   announced its Online-to-Offline (O2O)
        and transparent platform to access               https://stay.vinhomes.vn/                    business model
        updated information about new                  • Attractive promotions offered for first-   • An important milestone in the digital
        launches and existing projects                   time customers to lease Vinhomes’            transformation of the Company’s
                                                         serviced apartments through this             ecosystem covering sale, lease, and
                                                         platform                                     transfer

                               Vinhomes’ digital transformation to create an ecosystem that will enhance customer
                                                       engagement and build brand loyalty
Source: Company Information.

                                                                                                                                         19
Sales Mobile App as Supporting Tools for Agents

             Intuitive UI         Real Time        Unit Description
               Design          Inventory Display   (e.g. floor plan)
                                                                       • Better experience not only for the
                                                                         end-buyers but also for sales
                                                                         agents

                                                                       • VHM Sales Agent App is a smart
                                                                         and convenient platform to provide
                                                                             o   News and information
                                                                                 about new launches and
                                                                                 existing projects
                                                                             o   Real-time availability of
                                                                                 inventory and prices

                                                                       • Building a sustainable and
                                                                         transparent market, benefitting all
                                                                         stakeholders

                                    2021 Target number of users
                                    120 Agencies
                                    20,000 Salespersons
Source: Company Information.

                                                                                                               20
Promoting Green Initiatives and Sustainability within the Vinhomes Community

                                                                                                          Technopark
                      VinBus Operations                        Charging Stations                      Green Office Building

  • The very first electric bus Vinbus                • Development of charging stations for   • Technopark, our newest 43-storey
        manufactured by VinFast started test-           electric vehicles at Vinhomes’ urban     office building in Ocean Park was
        running in Vinhomes Ocean Park                  areas                                    designed and operated according to
        (Hanoi)                                                                                  the most rigorous criteria of LEED
                                                                                                 Platinum certification, focusing on
                                                                                                 Green – Smart – Wellness

                               Vinhomes remain committed towards green initiatives and sustainable development

Source: Company Information.

                                                                                                                                       21
Implementing Connected Smart City Solutions

                               Transportation                                                                     Security
                               •    Electric public Buses                                                         •       Smart Traffic
                                                                                                                  •       Smart Fire Alarm System
                                                                                                                  •       Smart Camera
                                                                                                                  •       Smart Access control
                                                                                                                  •       Air Quality Monitoring

                                   Community                                                                          Management
                                   •   VinID Resident App                                                             •    Smart Intercom
                                   •   AI Camera Facial                                                               •    Smart Parking
                                       Recognition                                                                    •    Smart City Hub
                                   •   Cashless Payment via                                                           •    Smart Staff Management
                                       App
                                                                                                                      •    Central Command Centre
                                                                      Home and Devices
                                                                      •   Smart Home

       • Highly advanced comprehensive smart city solutions developed by VinSmart integrated into Vinhomes existing mega projects
       • Pioneer of the smart city concept, first in SEA to implement comprehensive smart city of this scale, providing an unrivalled experience
             to residents

Source: Company Information.

                                                                                                                                                    22
Exciting Sales & Marketing Activities and Recent Awards

                                                                            Vinhomes Maintains its
                                         Handover of the Manhattan’s       Position as Vietnam’s Most
  Lunar New Year Festival at               First Units at Vinhomes            Reputable Property             Vinhomes Grand Park
    Vinhomes Smart City                           Grand Park                       Developer                Honored Excellent Agents

 • In Jan 2021, a Spring                  • On 20 Mar 2021, the first      • In Mar 2021, Vietnam           • In Jan 2021, all 61 agents of
   festival was held at                     villa and shophouse units at     Report published the list of     the Vinhomes Grand Park
   Vinhomes Smart City                      The Manhattan – Vinhomes         Top 10 most reputable            project were invited to an
 • Residents and visitors                   Grand Park project – were        companies in the real            year end party
   enjoyed entertainment                    delivered to their owners        estate sector in 2021          • An award ceremony was
   activities representing                • The Manhattan was sold out                                        held to celebrate top
   different Asian national                 within only 8 days and         • Vinhomes once again was          performance amongst all
   cultures: Vietnam, Japan,                completed in only 10             ranked No. 1, marking the        Vinhomes agents nation-
   Korea, and Hong Kong                     months.                          company’s 7th consecutive        wide
                                                                             year at this position

                   Strong commitment to delivery and smart and healthy lifestyle bolster Vinhomes reputation, gaining market
                                                                recognition
Source: Company Information.

                                                                                                                                           23
Overview of Launched Projects

                    Project Name                                                     Vinhomes Ocean Park                                                         Vinhomes Smart City                              Vinhomes Grand Park

               Total NSA (sqm) (1)                                                                  3,500,000                                                                  2,601,000                                     3,241,000

                                                                                                                       47,200                                                                       47,000                                45,500
                                                                                           31,300                                                                                                                        39,300
   Cumulative Units Sold and
                                                                                                                                                                      26,800                                              8,600
  Delivered / To Be Delivered as                                                           2,600
                                                                                                                                                                       5,300
       of 31 March 2021 (2)
                                                                                                                                                                                                                         30,700
                                                                                           28,700                                                                      21,500

                                                                                         Units sold                 Total units                                     Units sold                    Total units           Units sold      Total units

                                                                                                                                    Delivered                                   To be delivered                 Total

                 Unbilled Sales (3)
                                                                                                        13,435                                                                     10,110                                      29,405
                  (VND billion)

          Construction progress                                                                            63%                                                                       38%                                          57%

Notes: (1) Numbers are rounded to the nearest ’000 (2) Numbers are rounded to the nearest ’00 and subject to design change in bulk sales transactions (3) Numbers are rounded to the nearest ’0

                                                                                                                                                                                                                                                      24
Moving into 2Q 2021

     Market optimism       • Smooth political leadership transition dispels market uncertainty and provides confidence to investors
     amidst new            • Availability of Covid-19 vaccines both in Vietnam and globally as catalysts to restore consumer
     government              confidence and business activities
     leadership and        • Adjustment to the Master plan for Tier 1 cities which includes new urban areas planned and continued
     the availability of     infrastructure investment to increase the rate of urbanization
     COVID-19
     vaccines              • Industrial real estate to further benefit from continued inflows of FDI inflow and supply
                             chain/manufacturing diversion into Vietnam

     Vinhomes’ new         • Vinhomes’ new launches, most notably Dream City (Ocean Park 2) and Wonder Park in 2H 2021, are
     projects to             well-timed to take advantage of the market recovery
     leverage market       • 3 mega projects (Ocean Park, Smart City, Grand Park) to continue their sales momentum to the end of
     tailwind and            2021
     drive sales
     performance

     Rolling out of        • O2O (online to offline) sales model roll out offers a seamless customer journey across multiple platforms
     O2O sales               as Vinhomes strives to deliver a best-in-class customer experience
     model and             • Promoting a green and smart ecosystem with the introduction of Vinbus and EV charging stations at
     creating a smart        Vinhomes projects
     and sustainable       • Technopark in Vinhomes Ocean Park to apply LEED premium certification for sustainability
     ecosystem               achievement, welcoming tenants in 2Q 2021

                                                                                                                                         25
where happiness lives

Key Project Updates
New Project Launches in 2021
    Vinhomes Dream City (Ocean Park 2)                                                     Vinhomes Wonder Park

                                                                                            Located at West of Hanoi and connected rapidly with My Dinh, Cau Giay,
    Vinhomes Dream City is conveniently located next to Vinhomes Ocean
                                                                                            Ba Dinh, Hoan Kiem by metro line. The project will include parks complex
    Park and will create a lively suburban community served by a complete
                                                                                            with high-end residential villas and townhouses – a model for ecological
    ecosystem of life-essential products and services
                                                                                            urban living

     Description                           Mega mixed-use integrated residential and       Description                 Mega mixed-use integrated residential and commercial
                                            commercial project                                                           project
     Location                              Van Giang, Hung Yen                             Location                 Dan Phuong, Hanoi
     Total project area (including
     infrastructure)
                                           ~460ha                                          Site Area                ~133ha
     Total Residential GFA(1)                                                               Key Components              Apartments/Villas /Townhouses /Schools /Shopping Mall/
                                           7,853,000 sqm
                                                                                                                         Eco-parks/Swimming Complex
     Key Components                        Apartments / Villas / Shophouses / Schools /                                16ha grand ecological park
                                            Hospitals / Shopping Malls                                                  Vietnam’s biggest swimming pool complex (indoor and
                                                                                                                         outdoor)

                                                                                                                                           
            Conveniently Located                        Ecosystem of Life-
           next to Vinhomes Ocean
            Park
                                                       essential Products And
                                                        Services
                                                                                                  Fast Track Connect
                                                                                                   with Core Districts
                                                                                                                                                  Model for Ecological
                                                                                                                                                  Urban Living

.

                                                                                                                                                                                27
where happiness lives

Financial Highlights
1Q2021 Highlights

                                                                                     Vinhomes Projects (Consolidated)                                                                                             BCC Projects (Equity Accounting)

                                                               • Total: VND 10.0 tn                                                                                                        • Total amount: VND 0.2 tn
                     Revenue from                              • Key contributors:                                                                                                         • Key contributors:
           1
                     Property Sales                              − VH Ocean Park: VND 6.1 tn                                                                                                 − VH Star City:    VND 0.1 tn
                                                                 − VH Grand Park: VND 1.5 tn                                                                                                 − VH Imperia:      VND 0.1 tn
                                                                 − VH Smart City: VND 1.3 tn
                                                                 − VH Symphony: VND 0.5 tn

                    Gross Profit &                             • Gross profit: VND 5.6 tn                                                                                                  • Gross profit: VND 0.1 tn
            2        Margin from
                   Property Sales (1)                          • Gross profit margin: 56%                                                                                                  • Gross profit margin: 56%

                                                               • Profit before tax was VND 7.1 tn, -30% yoy, in which VND 7 tn (2) was Vinhomes projects and VND 0.1 tn was from BCC projects
                         PBT, PAT &                            • Consolidated profit after tax was VND 5.5 tn, -28% yoy
            4
                           PATMI                               • Consolidated PATMI was VND 5.4 tn, -21% yoy

                                                               • Total number of pre-sold units : 1,566 units                                                                              • Total number of pre-sold units: 26 units
            5            Pre-sales             (3)
                                                               • Pre-sales value: VND 5.7 tn                                                                                               • Pre-sales value: VND 0.3 tn
                                                               • Unbilled pre-sales: VND 54.3 tn                                                                                           • Unbilled pre-sales: VND 1.1 tn

Notes: Based on Vinhomes JSC VAS 1Q2021 consolidated financial statements. YoY comparison is with Vinhomes JSC VAS 1Q2020 consolidated financial statements. (1) Represents gross profit of property sales only (2) Includes the recognition of bulk sales at Vinhomes Grand Park project (3) Estimated pre-
       sale under SPAs and pre-sale secured under non-cancellable deposits under both retail and bulk sales.
                                                                                                                                                                                                                                                                                                               29
Financial Performance 1Q2021 vs 1Q2020

         Figures in VND bn                                                       1Q2020(1)             1Q2021 (1)              Change (%)                                                                     Key Commentary
                                                                                                                                                         • Sale of inventory properties increase 75% thanks to great number of
                                                          (2)                                                                                                  apartments handed over at Vinhomes Ocean Park and Vinhomes Grand Park
         Sale of Inventory Properties                                                5,717                10,016                     75%
                                                                                                                                                               projects in 1Q2021 and a recognition of VND 2,900 billion bulk sale
                                                                                                                                                               transaction with a local developer

         Other Revenue                                                                802                  2,971                    270%

         Total Revenue                                                               6,519                12,986                     99%

         Gross Profit                                                                2,949                 6,212                    111%

         % Margin                                                                     45%                   48%                   260 bps
                                                                                                                                                         • Profit distribution from BCC projects is contributed by Vinhomes Star City and
                                                                                                                                                               Vinhomes Imperia
         Profit sharing from BCC projects                                             411                     93                     -77%
                                                                                                                                                         • Profit distribution reduced as BCC projects completed their hand-over
                                                                                                                                                               process

         Other finance income                                                        8,180                 2,214                     -73%                • 1Q2020 recognized a significant gain of bulk sales at Vinhomes Grand Park

         Operating Profit                                                           10,128                 7,054                     -30%

         Profit before Tax                                                          10,124                 7,085                     -30%

         Profit After Tax                                                            7,645                 5,478                     -28%

         Profit after Tax and Minority Interest                                      6,844                 5,396                     -21%

Note: (1) Based on Vinhomes JSC VAS 1Q2021 consolidated financial statements. YoY comparison is with Vinhomes JSC VAS 1Q2020 consolidated financial statements; (2) Does not include BCC projects which is recorded as finance Income

                                                                                                                                                                                                                                            30
Financial Performance 1Q2021 (Vinhomes Projects & BCC Projects)

      Summary BCC Project Performance and Reconciliation

                                                                                                The Harmony                                Imperia              Thanh Hoa                                                       Skylake
     Figures in VND bn                                                                         (Hanoi, low-rise)                     (Hai Phong, low-rise) (Thanh Hoa, Low-rise)                                            (Hanoi, High-rise)                     Total BCC projects
     Revenue                                                                                                                    -                                      61                                      155                                            -                                   216
     Cost of Sale                                                                                                               -                                   (24)                                      (71)                                            -                                   (95)
     Gross Profit                                                                                                               -                                      37                                         84                                          -                                   121
     % Margin                                                                                                                   -                                   61%                                      54%                                              -                                  56%
     SG&A                                                                                                                       -                                      (4)                                        (7)                                         -                                   (11)
     Profit attributable                                                                                                        -                                      33                                         61                                          -                                     94
     Profit attributable to Vinhomes (99%)                                                                                      -                                      33                                         60                                          -                                     93

      Adding Performance of BCC into Vinhomes P&L Assuming Full Consolidation

     Figures in VND bn                                                                                   Adjusted 1Q2021 VHM                                                               1Q2021 BCC Projects                                               Total Adjusted 1Q2021
                                                                                                                                    (1)
     Sale of Inventory Properties                                                                                      12,424                                                                               216                                                             12,640
     Other Revenue                                                                                                       2,971                                                                                -                                                              2,971
     Total Revenue                                                                                                      15,395                                                                              216                                                             15,611
     Cost of Sale                                                                                                       (7,486)                                                                             (95)                                                            (7,581)
     Gross Profit                                                                                                        7,909                                                                              121                                                              8,030
     Profit sharing from BCC projects                                                                                       93                                                                              (93)                                                                 -
     Operating Profit                                                                                                    7,054                                                                                -                                                              7,060
     Profit before Tax                                                                                                   7,085                                                                                -                                                              7,085
     Profit for the Period                                                                                               5,478                                                                                -                                                              5,478
     Profit after Tax and Minority Interest                                                                              5,396                                                                                -                                                              5,396
    (*) Due to delays in regulatory approval processes, a number of pipeline projects may have to be developed under BCC format.

Note: Based on Vinhomes JSC VAS 1Q2021 unaudited consolidated financial statements and management accounts of the BCC projects. (1) Adjusted finance performance includes gain from bulk sales in the form of share transfer transaction, which was recognized as financial income in financial statements.

                                                                                                                                                                                                                                                                                                              31
1Q2021 Financial Performance Overview

Financial Performance Overview
       Total Revenue                                                                                                                                           Gross Profit and Gross Profit Margin

       (VND bn)                                                                                                                                                (VND bn)                                                                                    45%                             46%
                                                                         71,548                                                                                                                                                                            48%                             56%
                                                                          3,340                                                                                                                   27,456                       25,936
                                              51,627
                 38,664                                                    898
                                                                                                                                                                                                     191                        346
                                              2,352
                                                                                                                                                                                                     603                        495
                  2,079                       1,114
                                                                         67,310                                                                                       10,061
                    816                                                                                                           12,986                                                                                                                                               6,212
                                             48,162                                                    6,519                                                            290                       26,662                                                    2,949
                                                                                                                                   2,616                                                                                       25,095                                                     457
                35,769                                                                                  524                                                            244                                                                                   74
                                                                                                                                    354                                                                                                                                                  163
                                                                                                        278                                                            9,527                                                                                 124
                                                                                                       5,717                      10,016                                                                                                                    2,751                       5,592
                  2018                        2019                         2020                      1Q2020                      1Q2021                                2018                        2019                         2020                     1Q2020                       1Q2021
                                                                                                                                       (1)                                                                                                   (1)       Margin for Sale of
                             Sale of inventory property                                    Leasing                           Others                                Sale of inventory property                    Leasing            Others             Inventory Properties
                                                                                                                                                                                                                                                                                         Margin for Leasing

       Profit before Tax                                                                                                                                       Profit after Tax and Minority Interest
       (VND bn)                                                                                                                                                (VND bn)

                                                                         36,517
                                             29,746                                                                                                                                                                          27,351
                                                                                                                                                                                                 21,747
                19,719
                                                                                                                                                                     14,284
                                                                                                      10,124
                                                                                                                                   7,085                                                                                                                  6,844                        5,396

                  2018                        2019                         2020                      1Q2020                      1Q2021                               2018                        2019                         2020                      1Q2020                      1Q2021

Note: Based on VAS Audited Consolidated Financial Statements for 2018, 2019, 2020 and Unaudited Consolidated Financial Statements for 1Q2021 (1) Includes revenue from general contractor services, shared profit from VCR, Vinschool, Vinpearl (until such components are completely transferred to those
respective Vingroup’s subsidiaries) and others
                                                                                                                                                                                                                                                                                                             32
1Q2021 Financial Performance Overview

Financial Performance Overview (adjusted)
        Total Adjusted Revenue                                                                                                                                    Adjusted Gross Profit and Gross Profit Margin
        (VND bn)                                                                                                                                                  (VND bn)

                                                                                                                                                                             30%                          54%                          55%                         45%                          46%

                                                                                                                                                                             31%                          54%                          46%                         61%                          59%
                                                                           98,746
                                                                                                                                                                                                                                    43,928
                  74,863                                                    3,340                                                                                                                     35,281                         346
                                              67,084                         898                                                                                                                                                     495
                  2,079                                                                                                                                                                                  191
                                                                                                                                                                         22,959
                   816                         2,352                                                                                                                                                     603
                                               1,114                                                   18,535                                                               290                                                                                 11,013
                                                                          94,508                                                    15,611                                                                                                                                                    8,027
                                                                                                                                                                            244                                                    43,087
                 71,968                                                                                  524                         2,617                                                            34,487                                                       74
                                              63,618                                                                                                                                                                                                               124                         455
                                                                                                        278                           354                                22,425                                                                                                                163
                                                                                                       17,733                       12,640                                                                                                                      10,815                        7,409
                  2018                   2019                2020                                  1Q2020                        1Q2021                                  2018               2019 (1)                             2020            1Q2020                                     1Q2021
                                                                                                                                                                                                                                             (2)
                             Sale of Inventory Properties (1)                                  Leasing                          Others (2)                              Sale of Inventory Properties                       Leasing    Others
                                                                                                                                                                                                                                                           Margin for Sale of
                                                                                                                                                                                                                                                                                              Margin for Leasing
                                                                                                                                                                                                                                                           Inventory Properties
        Adjusted EBITDA and Margin                                                                                                                                Adjusted PATMI
        (VND bn)                                                                                                                                                  (VND bn)

  Margin            30%(3)                      47%                         41%                           59%                        51%

                                                                                                                                                                                                                                     27,351
                                                                                                                                                                                                       21,747
                                                                          40,060
                                              32,475                                                                                                                      14,284
                 22,363
                                                                                                       10,834                                                                                                                                                       6,844                        5,396
                                                                                                                                     7,941
                   2018                        2019                         2020                      1Q2020                       1Q2021                                  2018                          2019                         2020                        1Q2020                       1Q2021
                                          EBITDA                                       Adjusted EBITDA Margin

Notes: The financials as presented above are illustrative and based on the arithmetic aggregation of (i) Vinhomes JSC audited general purpose financials for FY2018-2020, (ii) Excluded Projects financials for FY2018-2010 and (iii) Unaudited Consolidated Financial Statements 1Q2021. (1): Adjusted for Revenue
and Gross profit of BCC projects and bulk sales recognized as finance income. (2) Others principally comprises revenue from general contractor services, shared profit from VCR, Vinschool and Vinpearl and others
                                                                                                                                                                                                                                                                                                                      33
Balance Sheet Overview

       Total Assets                                                                                                                             Inventory
Balance Sheet Overview
       VND bn                                                                                                                                   VND bn
                                                                                         215,326
                                                     197,241                                                               207,714
                                                                                                                                                                      60,297
                                                      57,686
                                                                                        113,014
                                                                                                                          113,671
                   119,689                                                                                                                                                        42,984      41,596
                                                                                                                                                          36,858
                    28,486

                                                     139,555
                    91,203                                                              102,312                            94,043

                 31-Dec-18                          31-Dec-19                         31-Dec-20                          31-Mar-21                       31-Dec-18   31-Dec-19   31-Dec-20   31-Mar-21

                                             Current Assets                   Non-current Assets

       Total Cash & Cash Equivalents(1) and Total Borrowings                                                                                    Total Equity

       VND bn                                                                                                                                   VND bn

              31,909
                                                                                                                                                                                              94,605
                                                26,505                                                                                                                            89,130
                                                                                   24,955
                                                                                                                     23,096
                                                                                                                                                                      64,715
                                                                                               15,768                                                     48,145
                                                             13,693
                                                                                                                                   9,542
                            4,525

                 31-Dec-18                          31-Dec-19                         31-Dec-20                          31-Mar-21                       31-Dec-18   31-Dec-19   31-Dec-20   31-Mar-21

                                              Total Borrowings                           Cash and Cash Equivalents

Note: Based on VAS Audited Consolidated Financial Statements for 2018, 2019, 2020 and Unaudited Consolidated Financial Statements for 1Q2021.
(1) Cash and cash equivalents includes short-term investments.
                                                                                                                                                                                                         34
Key Credit Metrics

       Net Debt(1) / (Total Assets – Cash & Cash Equivalent(2))                                                                                                 Net Debt(1) / Equity

                           7.0%                                                                                           6.8%
                                                                                                                                                                                   19.8%

                                                                           4.6%                                                                                                                                                   14.3%

                                                                                                                                                                                                              10.3%

                       31-Dec-19                                      31-Dec-20                                       31-Mar-21                                                31-Dec-19                     31-Dec-20           31-Mar-21

       Total Debt / Total Assets                                                                                                                                Interest Coverage Ratio(3)
                                                                                                                                                                                                               Times

                          13.4%                                                                                                                                                                 17.4
                                                                          11.6%                                           11.1%
                                                                                                                                                                                                                          12.9

                       31-Dec-19                                      31-Dec-20                                       31-Mar-21                                                              1Q2020                      1Q2021

Notes: Based on VAS Audited Consolidated Financial Statements for 2019, 2020 and Unaudited Consolidated Financial Statements for 1Q2021
(1) Net Debt = (Short-term Borrowings + Long-term Borrowings) – Cash & Cash Equivalent. (2) Cash and cash equivalents includes short-term investments. (3) Interest coverage ratio = EBIT/Interest Expense
                                                                                                                                                                                                                                             35
Debt Profile

           01            Total debt breakdown by funding sources                                 02    Total debt breakdown by currency                Total debt breakdown by interest rate
                                                                                                                                                03

                                                                                                      VND
                                                                                                      99.4%                                                                                Fixed
                                                                                   Domestic                                                                                                28.7%
                                                                                                                                                 Floating
                                                                                     bond
                                                                                                                                                  71.3%
                                                                                    68.7%

                                                  VND23 tn                                                       VND23 tn                                               VND23 tn

                        Other
                        26.2%
                                                                                                                                      USD
                                                                                                                                      0.6%
                                                                        Bank loans
                                                                          5.1%
                                  Domestic bond                       Bank loans         Other                   VND         USD                                        Floating   Fixed

                                                                                                          Debt maturity (VNDbn)
           04

                                                                                     13,534                              Corporate bond      Bank borrowings & others

                                        9,365
                                                                                       6,136                                                     Average debt
                                          898                                                                                                      maturity:
                                                                                                                                                  1.34 years
                                         8,467                                         7,398
                                                                                                                   196
                                                                                                                     –
                                Less than 1 year                                     1-3 years                   3-5 years

Source: Unaudited VAS Consolidated Financial Statements for 1Q2021.
.
                                                                                                                                                                                                   36
where happiness lives

Appendix
Additional Materials
Hanoi – High Absorption Rate Affirms Robust Recovery

                                                               ASP trending higher in 1Q 2021, signaling improving market sentiment

                 Sold units: 4,156                                                                                                                                    Launched units: 4,421
                          -44%                  +94%                                 Sold Units         Launched Units                                                     -39%    +170%
                          QoQ                    YoY                                                                                                                       QoQ       YoY
     15,000
                                                                                                       15,000

     10,000
                                                                                                       10,000

       5,000                                                                                            5,000

             0                                                                                              0
                    Q1 Q2 Q3 Q4 Q1 Q2 Q3 Q4 Q1 Q2 Q3 Q4 Q1 Q2 Q3 Q4 Q1                                          Q1 Q2 Q3 Q4 Q1 Q2 Q3 Q4 Q1 Q2 Q3 Q4 Q1 Q2 Q3 Q4 Q1
                             2017                        2018            2019       2020      2021                 2017              2018                 2019                 2020         2021

Hanoi Condominium Market – Average Selling Price (1)                                                                             Affordable      Mid-end         High-end

                                                                                  2,500
                                                                    9% QoQ
            High-end                                                              2,000
                                                                    18% YoY
                                                                                  1,500

                                                                                  1,000
                                                                    1% QoQ
              Mid-end                                                              500
                                                                    5% YoY
                                                                                     -
                                                                                           Q1 Q2 Q3 Q4 Q1 Q2 Q3 Q4 Q1 Q2 Q3 Q4 Q1 Q2 Q3 Q4 Q1 Q2 Q3 Q4 Q1 Q2 Q3 Q4 Q1
                                                                    5% QoQ                    2015          2016          2017                2018               2019               2020         2021
          Affordable
                                                                    10% YoY                          High-end                     Mid-end                             Affordable
Source: CBRE Research, 1Q 2021                                                                                                                                            HIGH-END: US$2,000 – 4,000 psm
(1) Selling price: US$ psm (excluding VAT and quoted on NSA)                                                                                  MID-END: US$1,000 – 2,000 psm AFFORDABLE: < US$1,000 psm
                                                                                                                                                                                                           38
Hanoi – Thriving Secondary Market and Expansion of New Supply in Suburban Areas

   Increasing Secondary Prices in the Affordable Segment                                                                        Strong Price Increases in Infrastructure Development Areas

                                                   Q1 2019            Q1 2020           Q1 2021

                                                   Change 1-3% YoY
     US$ psm

                                                                                                            7% comp   8% comp
                                                                                                             2019      2019

    Strong YOY Growth in Supply in Outer Districts

                                                              +270%                                    The East region was             Price in suburban areas and projects near close-to-
                                                               YoY                                   the leading contributor
                                                                                                     to new supply, followed            completion infrastructure picked up rapidly in the
                                                                                                      by the West and South
                                                                                                             regions
                                                                                                                                        secondary market
                                                                                                                                       New supply concentrated at locations outside of
                                                                                                                                        core districts

Source: CBRE Research, 1Q 2021
Note: (1) Average secondary price, including land and construction cost, excluding VAT, and quoted on NSA
                                                                                                                                                                                              39
HCMC – Supply Shortage Across All Segments

                   HCMC Condominium units sold in 1Q2021 outstripped launched units, depleting the current market supply

        Sold units: 2,624                                                        Sold Units               Launched Units                                        Launched units: 1,709
                 -48%                  -30%                                                                                                                              -74%           -53%
                 QoQ                    YoY                                                                                                                              QoQ             YoY
   15,000
                                                                                                         15,000

   10,000
                                                                                                         10,000

     5,000                                                                                                5,000

            0                                                                                                0
                  Q1 Q2 Q3 Q4 Q1 Q2 Q3 Q4 Q1 Q2 Q3 Q4 Q1 Q2 Q3 Q4 Q1                                              Q1 Q2 Q3 Q4 Q1 Q2 Q3 Q4 Q1 Q2 Q3 Q4 Q1 Q2 Q3 Q4 Q1
                            2017                           2018       2019    2020       2021                          2017              2018               2019               2020         2021

      HCMC Condominium Market – Average Selling Price (1)                                                                   Affordable        Mid-end       High-end          Luxury

                                                                                 8,000
                                                                  -2.4% QoQ
                                                                                 7,000
                    Luxury                                         4.7% YoY      6,000
                                                                                 5,000
                                                                  2.2% QoQ       4,000
                  High-end
                                                                  0.6% YoY       3,000
                                                                                 2,000
                                                                  1.6% QoQ       1,000
                   Mid-end
                                                                  6.4% YoY           0
                                                                                         Q1     Q2   Q3     Q4    Q1   Q2     Q3   Q4    Q1     Q2   Q3    Q4      Q1    Q2    Q3     Q4    Q1
                                                                                                 2017                   2018                     2019                      2020            2021
                                                                  2.1% QoQ
                Affordable
                                                                  1.6% YoY                      Luxury                 High-end                  Mid-end                   Affordable
Source: CBRE Research, 1Q 2021                                                                                                               LUXURY: >US$4,000 psm HIGH-END: US$2,000 – 4,000 psm
(1) Selling price: US$ psm (excluding VAT and quoted on NSA)                                                                             MID-END: US$1,000 – 2,000 psm AFFORDABLE: < US$1,000 psm
                                                                                                                                                                                                    40
HCMC – Ongoing Development in Neighbor Provinces and New Thu Duc City

 Strong Secondary Price Increases in New Development Areas                                                                               HCMC Landed Property Prices Over the Years

                     6,000                         1Q 2019              1Q 2020          1Q 2021
                                                                                                                                                                      6,500                                                              ▲ 7% y-o-y
                                             Change 1-10% YoY
                     5,000                                                                                                                                            5,500

                                                                                                                                            Primary price (US$ psm)
                     4,000                                                                                                                                            4,500                                                              ▲ 2% y-o-y
           US$ psm

                                                                                                                                                                      3,500
                     3,000
                                                                                                      128% comp        21% comp                                       2,500                                                              ▲ 5% y-o-y
                                                                                                         2019            2019
                     2,000
                                                                                                                                                                      1,500

                     1,000                                                                                                                                             500

                                                                                                                                                                      (500)   Q1    Q2     Q3      Q4      Q1      Q2       Q3      Q4      Q1
                        0
                                District 1           Binh Thanh                District 2            District 9      Nha Be                                                            2019                           2020                 2021

                                                                                                                                                                                   Villa        Townhouse             Shophouse

 New Supply Locations

                                                                                                                   New supply is still                                 New development areas had a large step up in
                                                                                                                  concentrated in the
                                                                                                                     East driven by                                     secondary prices over the years, notably District 9
                                                              EAST                           1
                                                                                                         5
                                                                                                                        ongoing
                                                                                                                      urbanization                                     Townhouses and Shophouses are the preferred
                                                                                                     3            projects in Thu Duc,                                  landed property formats as opposed to villas
                                                                                         1
                                                                                                 2                 Dong Nai and Binh
                                                                                                                         Duong                                         Similar to Hanoi, HCMC’s new supply also
                                                                               6

                                                               7
                                                                                                                                                                        originates from projects located outside of core
                                                                                                 4                                                                      districts, particularly in the East

     Landed Properties: 1                                     Luxury: 3 projects                              Mid-end: 2 projects
     project                                                  High-end: 2 projects                            Affordable: NA

Source: CBRE Research, 1Q 2021                                                                                                                                                                    LUXURY: >US$4,000 psm HIGH-END: US$2,000 – 4,000 psm
Note: (1) Average secondary price, including land and construction cost, excluding VAT                                                                                                        MID-END: US$1,000 – 2,000 psm AFFORDABLE: < US$1,000 psm
                                                                                                                                                                                                                                                         41
Master Plans Continue to Drive Ongoing Development Plans
                                                   Red River Master Plan                                                             Chu Phan- Trang Viet

                                                                                                                                       Thuong Cat – Lien Mac
                                                                                                                                                                                    DISTRICTS
                                                                                                  HONG HA BRIDGE
                                                                                                                                                  Vong La – Hai Boi

                •    12 bridges across Red River                                                                                 Me Linh
                                                                                                                                                        Tam Xa - Xuan Canh
                •    6-lane riverside road                                                                                                 Dong Anh
                                                                                                                                                                    Bac Cau
                •    6 riverside areas with total area of 1,998 ha for new urban                 Dan Phuong

                     area/public construction
                                                                                                                         North Tu Liem Tay Ho
                •    Tentative approval: June 2021                                                                                                                    Bo De

                                                                                                                                                                  Long Bien
                                                                                                                                              Ba Dinh
                        Moving out from Core Districts                                                                                          Hoan Kiem
                                                                                                                                                                          Long Bien – Cu Khoi

                                                                                                                                                Hai Ba Trung

                                                                                                                                                        Hoang Mai              Dong Du – Bat Trang

                                                                                                       Red River                                                              Kim Lan – Van Duc
                                                                                                        Not develop urban area
                                                                                                                                                                          Gia Lam
                •    Move residences and State Agencies offices at Old Quarter,                         To develop urban area

                                                                                                                                                 Thanh Tri                         Hoang Mai,
                     universities, hospitals out of Hanoi center                                        Bridge
                                                                                                                                                                              Thanh Tri 1,Thanh Tri 2
                                                                                                        6 lane road along with
                •    Develop new area at North of Red River, East of Ring Road 4 for                    the river
                                                                                                                                                        Thuong Tin
                     relocation
                                                                                                                                                             ME SO BRIDGE

                                                                                                                                              Northwestern Urban
                                                                      HCMC Review Master Plan
                                                                                                                                                Area Attraction

                                                                  •   Propose infrastructure development plan for
                                                                      new areas: Thu Duc City, Hiep Phuoc Port,
                                                                      North West Urban area, Binh Quoi- Thanh
                                                                      Da, Can Gio
                                                                  •   Relocate industrial facilities outside of city,
                                                                      promoting high technology industry
Source: CBRE Research, 1Q 2021

                                                                                                                                                                                                        42
Pipeline in Close Proximity to Upcoming Metro / Highway Infrastructure

  Significant boost in connectivity is anticipated to accelerate demand for pipeline projects

  Ho Chi Minh City                                                                                                            Hanoi

                                                                               New Eastern Bus Station
                                                                                                                                                                           Project E

                                                                                        Suoi Tien                 Long Binh
                                                                                                                                Vinhomes Wonder Park
                                                                                                                    Depot
                                                                           Hi-Tech Park
                                                        Thu Duc District                                251 ha

                                                                                       Thu Duc      Vinhomes                                                                      Vinhomes
                                                                                                    Grand Park                                                   Project D        Riverside
                                                                                                                                                                                          Vinhomes Symphony
                                 Go Vap
                                                                                                                                               Vinhomes
                                 District                                        Binh Tho          District 9                                  Metropolis               CBD               Vinhomes
                                                                                                                              Vinhomes Skylake           Vinhomes Nguyen Chi Thanh        The Harmony
                                                                               Phuoc Long
                                        Bin Thanh                                                                                   Vinhomes                  Project A
                    Phu Nhuan            District
                                                                              Rach Chiec                                            West Point                           Vincom Ba Trieu
                      District                           New Port                                                                      Vinhomes             Vinhomes
                                                                                                                                                                          Vinhomes Times City
                                  Van Thanh                       An Phu                                                               Green Bay            Royal City
                                                        Thao Dien                                   Project B
                          District 3   CBD                  Vinhomes Central Park                                              Vinhomes     Project C Project B
                                                                                                                               Smart City                                                                            Vinhomes
                                                    Vinoffice Dong Khoi
                             Opera House                                            District 2                                                                                                                      Ocean Park
                                                Ba Son
                          Ben Thanh
      Project A           District 1                Vinhomes Golden River

                                                                                                                                                                                                                           Project F

                                                Vinhomes Properties             City Centre                                                                 Vinhomes Properties                   City Centre

                          HCMC Metro Line 1            Upcoming Metro Lines            Under development and pipeline                                Upcoming Hanoi Metro Lines        Under development and pipeline
                                                       (before 2030)

Source: CBRE, Company Information.

                                                                                                                                                                                                                                   43
Infrastructure Development Underway – Hanoi

           Visible and meaningful progress on infrastructure developments is expected to boost real estate capital values
           and greatly increase connectivity for Vinhomes projects

                                                                                                                          Hanoi

                                                                               Road                                   Metro Line # 2                         Metro Line # 3
                                                                             Expansion                              Cat Linh – Ha Dong                    Nhon – Hanoi Station
        Vinhomes Projects in Close                           •   Vinhomes Riverside                      • Vinhomes Galaxy                       • Vinhomes Metropolis
        Proximity                                            •   Vinhomes The Harmony                    • Vinhomes Gallery                      • Vinhomes Gallery
                                                             •   Vinhomes Times City
                                                             •   Vinhomes Royal City
                                                             •   Vinhomes Ocean Park
        Development Status                                   • Various projects under construction       • Completed construction, received      • About 45% completed
                                                                 include elevated Ring road #2,             safety certification and ready for   • Commercial operation for the 8.5km
                                                                 segments of Ring road #3, Vinh Tuy 2       commercial run in 2021                  sky train to start by end of 2021
                                                                 bridge overpasses in CBD areas
                                                             • Projects under development include
                                                                 Ring road #3.5 and #4
        Other Commentary                                     • Overall improvement to Vinhomes
                                                                 projects from enhanced infrastructure

Source: Ministry of Transport Portal, Company Information.

                                                                                                                                                                                        44
Infrastructure Development Underway

                       Visible and meaningful progress on infrastructure developments is expected to boost real estate capital values
                                                  and greatly increase connectivity for Vinhomes projects

                                                                   Quang Ninh                                                           HCMC

                                                               Van Don – Mong Cai            HCMC – Moc Bai highway                Metro Line # 1                  Connecting the
                                                                    highway                                                    Ben Thanh – Suoi Tien             Old to the New City
        Vinhomes Projects in                            • Vinhomes Green Ha Long           • Vinhomes Golden River          • Vinhomes Golden River        • Central Park
        Close Proximity                                                                    • Vinhomes Central Park          • Vinhomes Central Park        • Golden River
                                                                                           • Leman Golf
        Development Status                              • Expected completion in 2021 • Expected approval in 2021      • About 56% completed               • Projects under development
                                                                                      • Expected construction to start • Sky train testing to start by        include
                                                                                              in 2023                         end of 2021                     Metro Line #2, Thu Thiem 4
                                                                                                                                                              bridge
                                                                                           • Expected completion in 2025 • Commercial operation to start
                                                                                                                              in 2022
        Other Commentary                                • Overall improvement to           • Overall improvement to                                        • Key projects improving
                                                             Vinhomes projects and local      Vinhomes projects and local                                     infrastructure to and within
                                                             economy from enhanced            economy from enhanced                                           District 2 (the new city)
                                                             connections                      connections                                                     include Thoi Dai bridge
                                                                                                                                                              (completed), My Thuy
                                                                                                                                                              Intersection (completed),
                                                                                                                                                              Metro Line #1 (under
                                                                                                                                                              construction)

Source: Ministry of Transport Portal, Company Information.

                                                                                                                                                                                             45
Update On Transformational Projects In The Pipeline

  Green Ha Long Project                                                                                                        Vinhomes Long Beach Can Gio

     Strategically located to benefit from infrastructure development and                                                        Located in the only coastal district of Ho Chi Minh City, situated neatly in
     economic expansion driven by industrial production and tourism                                                              the southern special economic zone of the country. It will be a “3 in 1”
     development                                                                                                                 destination of “classy living, working, and leisure tourism”

                                                                                                                                                            Ho Chi Minh City

                                                                                                                                                                           District 1

   Description                                 Mega mixed-use integrated residential, commercial and
                                                hospitality project
                                                                                                                                                                  Vinhomes
   Location                                    Ha Long City and Quang Yen district                                                                          Long Beach Can Gio
   Total project area                          Total site area: 4,109.64 ha
   (including                                  (Quang Yen district: 3,186 ha)                                                  Location                   Can Gio District, Ho Chi Minh City
   infrastructure)                             (Ha Long City: 923.64 ha)
   Total Residential GFA                       ~81.3 million sqm                                                               Site Area                  2,870 ha
   Key Components                              Apartments / Villas / Shophouses / Schools / Shopping                           Key Components             Villas / Townhouses / Schools / Hospitals / Hospitality
                                                Malls / Amusement Park                                                                                      Facilities / Entertainment Facilities

                Robust                                                                                      Close to Key                                                                “3 in 1” Destination Of
                                                                                                                                                                               
                                                                                                                                       Within the Southern
            Infrastructure
               Support
                                                            Strong Tourism
                                                               Potential
                                                                                                             Economic
                                                                                                               Zones
                                                                                                                                      Special Economic
                                                                                                                                               Zone
                                                                                                                                                                                        Classy Living, Working,
                                                                                                                                                                                         And Leisure Tourism

Note: Subject to change. GFA figures are based on company estimate and subject to market conditions and regulatory approval.

                                                                                                                                                                                                                      46
You can also read