Market and Trade Profile: Denmark - Denmark - March 2020 - VisitBritain
←
→
Page content transcription
If your browser does not render page correctly, please read the page content below

Market and Trade Profile Denmark

Market and
Trade Profile: Denmark

Denmark – March 2020
Market and Trade Profile Denmark

Overview
•   ‘Chapter 1: Inbound market statistics’ provides insights on key statistics about
    Danish travellers, where they are going, and who they are. It also takes a look at
    Britain as a destination and its competitive set.
•   ‘Chapter 2: Experiences and perceptions’ features details about what visitors
    from Denmark are likely to do in the UK, how they felt during their visit to the UK,
    and whether they would recommend a stay there to their acquaintances.
    Perceptions of Britain held by the Danish in general are also highlighted.
•   ‘Chapter 3: Understanding the market’ takes a close look at consumer trends
    in Denmark, and the booking, planning and further travel behaviour of this source
    market. Some details on how to best reach Danish consumers are laid out.
•   ‘Chapter 4: Access and travel trade’ shows how the Danish travel to the UK,
    how to best cater for their needs and wants during their stay and gives insights
    into the travel trade in Denmark.
•   Further ways of working with VisitBritain and other useful research resources are
    pointed out in the appendix.

                                                                                                    2
Market and Trade Profile Denmark

Contents (1/2)
Executive summary (page 5)

Chapter 1: Market statistics
 1.1 Key statistics (page 11)
 Tourism context, UK inbound overview, key figures on journey purpose, seasonality, duration of stay,
 accommodation trends, travel companions, repeat visits, and visit types
 1.2 Getting around Britain (page 18)
 Where visitors stayed in the UK, places they visited, and internal modes of transport
 1.3 Visitor demographics (page 23)
 Demographic profile of Danish visitors (age, gender)
 1.4 The UK and its competitors (page 27)
 How visits to the UK compare to main competitor destinations, and long-term trend and forecasts

Chapter 2: Experiences and perceptions
 2.1 Inbound activities (page 30)
 What activities Danish visitors undertook in the UK
 2.2 Welcome and recommending Britain (page 37)
 How welcome departing visitors felt in Britain, and how likely they were to recommend a visit
 2.3 Perceptions of the UK (page 38)
 How people in this source market see the UK, and how it compares to other destinations

                                                                                                                       3
Market and Trade Profile Denmark

Contents (2/2)
Chapter 3: Understanding the Market
3.1 Structural drivers (page 41)
Key demographic, social, economic indicators and exchange rates influencing the outbound travel market
3.2 Consumer trends (page 45)
General and travel-related trends in this source market
3.3 Booking and planning (page 49)
How Danish travellers plan and book their trips to the UK, and their holidays in general
3.4 Reaching the consumer (page 54)
An overview of the media landscape in this source market, and main sources of influences for holiday planning

Chapter 4: Access and Travel Trade
4.1 Access (page 60)
How visits to the UK were made, and an overview of the air connections between this source market and the UK
4.2 Travel trade (page 64)
What the travel trade in market looks like and useful tips to work with travel agents and other main players
4.3 Caring for the consumer (page 68)
Tips to understand Danish travellers and best cater to their needs

Appendix:
Working with VisitBritain (page 70)
Useful resources (page 73)
Definitions, sources and information on this report (page 75)

                                                                                                                      4
Market and Trade Profile Denmark

Executive summary

                                                       5
Market and Trade Profile Denmark
1: Inbound market statistics
Chapter summary
• The Danish outbound market is forecasted to account for more
than 19.6 million trips abroad with at least one overnight stay
2018:
by 2028. The UK was the fourth most popular destination
globally for such trips in 2018.
£379m
• Danes rank globally in 33rd place for international tourism spend in
expenditure with US$10.5bn.
• Denmark was the 15th largest inbound source market for the UK
UK for volume and 21st most valuable in 2018.
• Holiday visits set a new record in 2018 with 412,000 such visits
and £243m of visitor spending in the UK. 64% of total Danish
visitor spending came courtesy of holiday visits in 2018.
• Short trips of 1-3 nights and 4-7 nights are the most popular
durations of stay amongst Danish visitors and both set volume
records, visits lasting 1-3 nights also a spend record in 2018.
Source: International Passenger Survey by ONS, Oxford Economics (overnight trips), UNWTO, VisitBritain/IPSOS 2016
6Market and Trade Profile Denmark
2: Experiences and perceptions
Chapter summary
• About three quarters of Danish visits feature
eating out in restaurants and more than two in
five enjoy a visit to a pub.
• Sightseeing is the third most popular activity
among Danish holiday visitors, and often
Cultural
includes visits to castles or historic houses,
or museums and art galleries.
attractions
• Danes on holiday in the UK also often like are the biggest draw for
to spend time outdoors with half of them Danish holiday visitors
visiting parks or gardens and more than a
quarter include a walk in the countryside. About
33,000 Danish visits per annum feature time
watching football. Danish holiday visits have an
above-average propensity to visit the performing
arts or a literary/film/music/TV site.
• 96% of Danish visitors are either ‘Very’ or
‘Extremely’ likely to recommend the UK for a
holiday or short-break.
Source: International Passenger Survey by ONS, Ipsos-Anholt Nation Brands Index 2019
7Market and Trade Profile Denmark
3: Understanding the market
Chapter summary
• Denmark has a population of about 6 million. Family, friends
and colleagues
• Three out of four Danes went on holiday in 2018, making a total of
Most important
8.1 million holiday trips. The Danish spent a total of approximately influence for Danes
DKK40bn on holidays abroad in 2018. on destination
choice
• About two in five Danish holiday visitors tend to start thinking about
their trip to Britain as early as half a year in advance or more.
• 39% of holiday bookings to Britain were made within two months of
arrival and 40% booked between three to six months prior to arrival.
• Friends, family and colleagues are by far the most important
influence on the holiday destination choice for seven in ten Danes,
followed by online source including price comparison websites and
search engines.
Source: Oxford Economics, VisitBritain/IPSOS 2016, The Danish Holiday Travel Survey 2019 by Epinion
8Market and Trade Profile Denmark
4: Access and travel trade
Chapter summary
• Access to Britain is easy. 97% of Danish visits arrive by plane.
• Airline seat capacity from Denmark peaked in 2016 but declined
in 2017 and has remained stable since. Most flights come in via
97%
the Copenhagen – London corridor. of visits to the UK from
Denmark came by plane
• Ryanair and SAS lead among airlines serving routes between
Denmark and the UK providing over half of seat capacity in 2019.
British Airways ranks third, ahead of Norwegian and easyJet.
• The travel industry in Denmark is made up of charter operators,
business travel and MICE operators, online operators and retail
travel agents. Copenhagen is the hub for most of them; some are
spread across the country, but distances are short.
• The planning cycle varies, so it is possible to do business in
Denmark throughout the year.
• Some operators are pan-Nordic as well, so it is possible to reach
the whole region via a single contact.
Source: International Passenger Survey, Apex 2019 non-stop flights only
9Market and Trade Profile Denmark
Chapter 1:
Inbound market
statistics
10Market and Trade Profile Denmark
Chapter 1.1: Key statistics
Key insights
Denmark is Britain’s 15th largest source market in terms of
visits and 21st most valuable for visitor spending (2018).
The UK was the
64% of spending came from holiday trips and 19% from
4th most popular
business visits in 2018. destination for
Holiday visits set a new record in 2018 with 412,000 such Danish outbound
visits and £243m was spent by these visitors in the UK. travel (2018)
London is the leading destination for a trip to the UK but the
South East and Scotland are also popular (based on average
nights spent in the UK in 2016-2018).
Danish visits to the UK between April and June also set a new
volume record at 236,000 visits in 2018, making it the time of
year when the UK receives the most visits from the market.
Short trips of 1-3 nights and 4-7 nights are the most popular
durations of stay amongst Danish visitors. Both set volume
records and visits lasting 1-3 nights also set a spend record in
2018.
Source: International Passenger Survey by ONS, Oxford Economics overnight trips
11Market and Trade Profile Denmark
1.1 Key statistics: global context and 10 year trend
Global context Inbound travel to the UK overview
Measure 2018 Measure Visits Nights Spend
(000s) (000s) (£m)
10 year trend +31% +19% +61%
International tourism
10.5 2008 560 2,602 236
expenditure (US$bn)
2009 614 2,894 300
Global rank for 2010 550 2,883 245
international tourism 33
expenditure 2011 614 2,832 287
2012 636 2,830 303
Number of outbound 2013 696 3,111 436
11.9
overnight visits (m)
2014 662 2,646 295
2015 756 3,507 356
Most visited destination Sweden
2016 730 3,689 368
2017 730 3,037 359
2018 735 3,101 379
Share of UK total
1.9% 1.2% 1.7%
in 2018
Source: International Passenger Survey by ONS, UNWTO, Oxford Economics
12Market and Trade Profile Denmark
1.1 Key statistics – volume and value
Inbound volume and value Nights per visit, spend
Measure 2018 Change Rank out of Averages by Nights Spend Spend
vs. 2017 UK top journey purpose per per per
markets in 2018 visit night visit
Visits (000s) 735 +1% 15 Holiday 4 £146 £589
Business 2 £241 £540
Nights (000s) 3,101 +2% 20
Visiting Friends/
6 £50 £283
Relatives
Spend (£m) 379 +6% 21
Miscellaneous** 7 £63 £440
The UK welcomed 448,000 Danish visits in Jan-
Sep 2019 (down 18% on Jan-Sep 2018). Danish
All visits 4 £122 £516
visitors spent a total of £214m in the first nine
months of 2019 (down 22% on the first nine
months in 2018).*
Source: International Passenger Survey by ONS, *provisional data for January-September 2019
**small base of less than 100
13Market and Trade Profile Denmark
1.1 Key statistics: journey purpose
Journey purpose 2018 Journey purpose trend (visits 000s)
56% 500
40% 400 412
31% 300
22% 20%
18% 200 147
5% 5% 100 131
1% 1% 39
0 7
2008
2013
2005
2006
2007
2009
2010
2011
2012
2014
2015
2016
2017
2018
Holiday Business VFR Study Misc.
Denmark All markets Holiday Business VFR Study Misc.
In 2018, more than half of all Danish visits to the UK Holiday visits have long led in terms of volume of visits
were made for holidays, followed by 20% as visits to from the market and peaked in 2018. Danish business
friends/relatives residing in the UK and 18% as visits set a record for volume at 197,000 such visits in
business visits. 2016. While they declined in 2017 and 2018, they stood
Danish holiday visits to the UK set a new record in slightly higher than the 2018 total in Jan-Sep 2019.
2018 for both volume with 412,000 visits and value 92% of Danish residents coming to the UK (excl. expats)
with £243m. 64% of total inbound visitor spend by for business visits had been to the UK before as had 90%
Danes in the UK came courtesy of holiday visits in of those coming to visit friends/relatives who live in the
2018, 19% from business visits and 11% from visits UK.
to friends/relatives who live in the UK. Visits to friends and/or relatives who reside in the UK
Source: International Passenger Survey by ONS
peaked at 180,000 in 2015 and have also not matched
these levels since.
14Market and Trade Profile Denmark
1.1 Key statistics: seasonality
Seasonality 2018
32% In 2018, almost a third of Danish visits to the UK were
27% 28%
22% 26% 24% made in the second quarter between April and June. Just
20% 21% over a quarter of Danish visits here were made between
October and December, followed by 22% in the summer
between July and September (much lower than many
other markets) and 20% in the first three months.
Looking at the seasonality trend over time, there have
Jan-Mar Apr-Jun Jul-Sep Oct-Dec been ups and downs, but over the ten year period (2008-
Denmark All markets 2018), the periods between April and June and October
to December recorded the strongest growth with 58%
and 52% respectively. The second quarter of 2018 set a
Seasonality trend (visits 000s) new volume record at 236,000 visits.
250 236
200 189
150 164
146
100
50
0
2005 2006 2007 2008 2009 2010 2011 2012 2013 2014 2015 2016 2017 2018
Source: International Passenger Survey by ONS Jan - Mar Apr - Jun Jul - Sep Oct - Dec
15Market and Trade Profile Denmark
1.1 Key statistics: length of stay and accommodation
Accommodation stayed in, 2018 Duration of stay trend (visits 000s)
(nights, %share) 1% 400 366
1% 0%
300 290
5%2% 200
9% 100 51
0 22
47% 7
Nil nights 1-3 nights 4-7 nights
35%
8-14 nights 15+ nights
Short trips of 1-3 nights and 4-7 nights are the most
popular duration of stay amongst Danish visitors and
Hotel/guest house Free guest with relatives or friends both set volume records; 1-3 night visits also set a spend
record in 2018. Over the past decade these two durations
Hostel/university/school Bed & Breakfast of stays also recorded the strongest growth of 43% (1-3
nights) and 37% (4-7 nights) between 2008 and 2018.
Rented house/flat Own home
Two forms of accommodation dominate the picture with
Camping/caravan Holiday village/Centre almost half of Danish visitor nights spent staying at a
hotel/guest house and more than a third as a free guest
Source: International Passenger Survey by ONS
with relatives or friends. Hostel/university/school
accommodation follows at some distance with 9%.
16Market and Trade Profile Denmark
1.1 Key statistics: repeat visits and package tours
Proportion of overnight holiday visitors to Proportion of visits that are bought as part
the UK who have been to the UK before* of a package or all-inclusive tour in 2018**
82% 19%
79% 78% 76%
67% 63% 13%
11% 12%
8%
6%
3%
0%
Business Holiday VFR All journey
purposes
Denmark All markets
78% of holiday visits from Denmark to the UK in 2015 (excl. UK nationals) were made by repeat visitors. These repeat
visitors came on average between three and four times in the past ten years (a high visit frequency) and spent £1,888
in the UK in total whilst the average European holiday repeat visitor spent £1,626 in the same time frame.
92% of those coming to the UK for business visits (excl. expats) had been to the UK before as had 90% of those
coming to visit friends or relatives who live in the UK.
Sources: International Passenger Survey by ONS. *2015, excluding UK nationals; **See definition of a package holiday in appendix (p.83)
17Market and Trade Profile Denmark
1.2 Getting around Britain Nights
(% share, 2016-2018)
Average annual visits to the UK (2016-2018)
Region Nights stayed Visits Spend
(000) (000) (£m)
Total 3,275 732 368
Scotland (SC) 346 72 33
Wales (WA) 30 9 3
Northern Ireland (NI) 8 1 1
London (LDN) 1,586 424 222
North East (NE) 90 8 4
North West (NW) 184 51 23
Yorkshire (YO) 75 18 5
West Midlands (WM) 126 22 8
East Midlands (EM) 48 14 4
East of England (EoE) 160 35 9
South West (SW) 145 28 12
South East (SE) 470 87 39
Nil nights (Nil) N/A 28 3
Source: International Passenger Survey by ONS
18Market and Trade Profile Denmark
1.2 Getting around Britain: regional spread and top towns and cities
Top towns and cities visited London is the leading destination for a trip to the UK,
accounting for 48% of visitor nights, but South East and
Town Visits (000s, 2016-2018 average) Scotland are also popular based on the average nights
spent in the UK (2016-2018).
London 424
Danes have a below average propensity to visit rural and
Edinburgh 56 coastal areas of the UK. Holiday visits by Danes in the
UK are the most likely to feature this activity.
Manchester 23
On average, Edinburgh and Manchester received 56,000
Oxford* 17 and 23,000 visits respectively (based on 2016-2018
Liverpool 14 average), ranking second and third behind London.
Regional spread (2018, % nights)
55%
42% 46%
30%
14%
9%
1% 2% 0% 1%
Scotland Wales London Rest Of Northern
England Ireland
Denmark All markets
Source: International Passenger Survey by ONS, VisitBritain/IPSOS 2016, base: visitors, *small base below 50
19Market and Trade Profile Denmark
1.2 Getting around Britain visits to coast, countryside and villages
Propensity to visit coast, countryside and villages
5%
VFR: Went to the coast or beaches
13%
9%
VFR: Went to countryside or villages
17%
13%
Holiday: Went to the coast or beaches
14%
12%
Holiday: Went to countryside or villages
18%
8%
All journey purposes: Went to the coast or beaches
10%
7%
All journey purposes: Went to countryside or villages
13%
Source: International Passenger Survey by ONS 2016 Denmark All markets
20Market and Trade Profile Denmark
1.2 Getting around Britain: use of internal modes of transport
Propensity to use internal modes of transport
Ferry/boat 0%
1%
Car/vehicle you/group brought to the UK 0%
1%
Hired self-drive car/vehicle 4%
5%
Private coach/minibus (for group only) 4%
2%
Public bus/coach (outside town/city) 4%
5%
Uber or similar app 6%
9%
Taxi 25%
27%
Train (outside town/city) 33%
23%
Bus, Tube, Tram or Metro Train (within town/city) 49%
48%
Domestic flight 1%
1%
Denmark All markets
Source: International Passenger Survey by ONS 2018; most lorry drivers were not asked this question, and as a consequence, are not taken into account in the results for
‘car/vehicle you/group brought to the UK’
21Market and Trade Profile Denmark
1.2 Getting around Britain: purchase of transport
Transport services purchased before or
during trip (%)
Danish visitors tend to be comfortable with
using public transport, with an above-
52% average proportion using public transport
50%
during their stay in the UK.
The majority of Danish visitors buy their
36% transport tickets, whether for transport within
31% 32% London or train tickets, after arriving in
30% 29% 27% 28%
26% 27%
24% 25% Britain rather than booking in advance.
17%
20% Around one in three Danish visitors buy
15%
12% airport transfers before their trip and around
12%
9% one in three during their visit. Hardly any
6% 6%
2% 3% 0%
Danish visitors buy tickets to domestic flights
within the UK.
Pre During Pre During Pre During Pre During Pre During Pre During
Transport Train travel Airport transfer Coach travel Car hire Flights within
within London the UK
Denmark All markets
International Passenger Survey by ONS, VisitBritain/IPSOS 2016, base: visitors
22Market and Trade Profile Denmark
1.3 Visitor demographics
Visitor characteristics
Danish men on business visits outnumber women about
two-to-one with holiday visitors also skewing male.
Almost four in five of those holidaying in the UK are 78%
of Danish
making a repeat trip (excl. British nationals).
holiday visitors
Most of visits from Denmark to the UK were made by have been to the
Danish nationals (90%), while 16% of those visiting UK before*
friends/relatives were Britons.
About one fifth of Danish visits to the UK were made by
45-54 year-olds, followed by almost as many aged 35-44
year-olds and 16% by 25-34 year-olds in 2018.
More than a third of Danish visits are made by travellers
with their partner/spouse and 29% travel on their own.
The Danish have a higher propensity to travel with adult
friends than the average visitor to the UK.
Source: International Passenger Survey by ONS, *2015, excluding British nationals
23Market and Trade Profile Denmark
1.3 Visitor demographics: gender and age groups
Gender ratio of visits (2018) Age group trend (visits in 000s)
2018 25 103 119 129 154 91 49 33
All markets 41% 57%
2017 18 102 141 160 141 121 47 0
2016 35 98 136 173 155 94 41
Denmark 42% 54%
2015 27 92 159 157 160 103 56 1
Female Male 2014 43 50 140 146 172 70 39 1
2013 18 87 123 151 170 92 54
Gender ratio of visits from Denmark 2012 28 92 122 144 146 66 38
by journey purpose (2018) 2011 33 67 128 142 138 66 38 1
2010 30 70 95 138 115 67 35
Misc. 53% 45% 2009 15 79 115 158 126 82 38 1
2008 26 55 113 144 117 75 30
VFR 44% 56% 2007 24 65 124 147 104 65 33
2006 25 45 120 146 89 78 22
Holiday 54% 39%
2005 31 49 123 115 102 90 28
Business 67% 32% 2004 31 44 112 113 78 64 35
0 -15 16-24 25-34 35-44
Male Female
Source: International Passenger Survey by ONS, %-share of ‘don’t know’ for gender 45-54 55-64 65+ Not Known
ratio not displayed – these visits are also excluded from the age group trend
24Market and Trade Profile Denmark
1.3 Visitor demographics: travel companions
Who have Danish visitors to the UK travelled with?
43%
34%
29% 28%
14% 13%
13% 12% 12%
9%
6%
5% 4%
3%
Travelling on Spouse/partner Adult friend(s) Adult family Business Part of a tour Child(ren) - any
own member(s) colleague(s) group
Denmark All markets
Source: International Passenger Survey by ONS, 2017, Who accompanied you on your visit to the UK, excluding UK residents you may have visited during your trip?
25Market and Trade Profile Denmark
1.3 Visitor demographics: origin
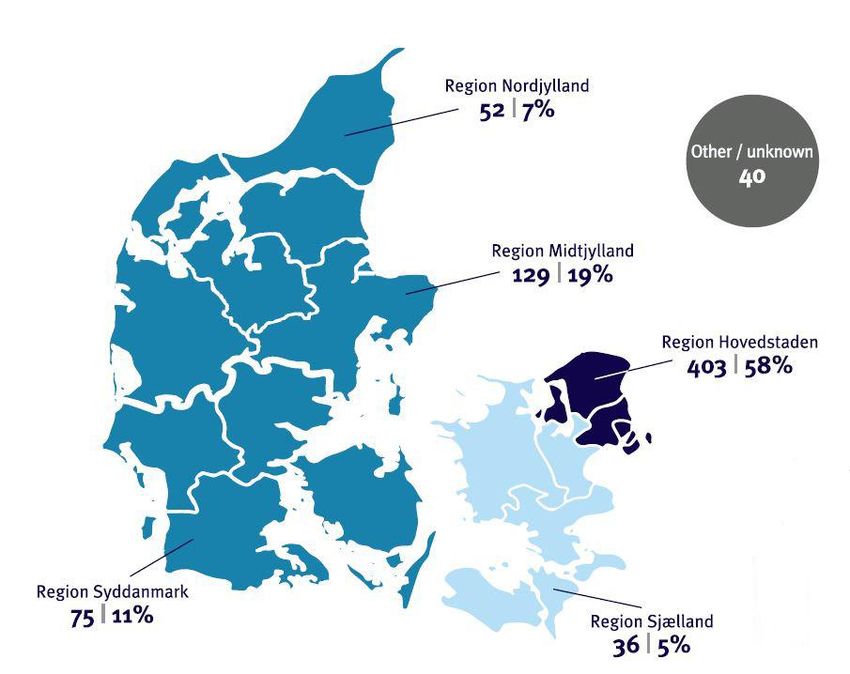
Visits to the UK in (000) 2018
• The largest proportion of Danish visitors to
Britain reside in the region Hovedstaden
which includes Copenhagen.
• The areas in Denmark with the most
inhabitants are coastal areas, particularly
in Copenhagen and the Eastern parts of
Denmark’s mainland.
Visits in 000s | % share of visits
High
Medium
Low
Source: International Passenger Survey by ONS, CIA World Factbook 2019
26Market and Trade Profile Denmark
1.4 The UK and its competitors
Market size, share and growth potential
The UK was the 5th most visited destination by
Danish travellers on overnight trips in 2018, behind
Sweden, Germany and Spain, ahead of Italy and
France.
Forecasts suggest there is the potential for 25% The UK
growth in the number of visits to the UK over the next
decade (2018 to 2028). ranks 4th
Sweden held just under a third of the share of Danish for Danish outbound
destinations by volume
arrivals in the competitive set and remained the most
travelled-to destination in 2018. Within the competitor
set, the United States is projected to see the
strongest growth in Danish market share between
2018 and 2028.
61% of Danes who went on holiday in 2018 spent
one or more holiday trips in Denmark. Families with
children especially like to holiday in their own country:
65% in 2018 (up from 56% in 2017).
Source: Oxford Economics forecasts with VisitBritain adaptations, Dansk Kyst & Natur Turisme & Visit Denmark 2019
27Market and Trade Profile Denmark
1.4 The UK and its competitors
The UK’s market share of Danish visits Historic and potential visits to the UK (000s)
among competitor set
1,000 916
28%
Sweden 33% 900
33% 800
25%
Germany 24% 700
19% 600
11% 500
Italy 10%
11% 400
United 10% 300
11%
Kingdom 9% 200
United 9% 100
5%
States 4% 0
8%
Norway 8%
10%
8%
France 8%
12%
1% Note: these forecasts do not take the potential
Ireland 1% impact of COVID-19 into account. The future effect
1%
of the outbreak on UK inbound tourism from the
2028 2018 2008 region is unknown at present.
Source: Oxford Economics for competitor set based on overnight visits,
‘Historic and potential visits‘ displays total visits based on International Passenger Survey historic data and Oxford Economics forecasts with VisitBritain adaptations
28Market and Trade Profile Denmark
Chapter 2:
Experiences and
perceptions
29Market and Trade Profile Denmark
2.1 Inbound activities
Top 10 activities for Danish visitors during
their visit to the UK
Eating out in restaurants is the most
popular activity which features in about 1. Dining in restaurants
three quarters of Danish visits; more than
two in five enjoy a visit to a pub. 2. Going shopping
Sightseeing is the third most popular 3. Going to the pub
activity among Danish holiday visitors, and
often includes visits to castles or historic 4. Sightseeing famous monuments/ buildings
houses, or museums and art galleries.
Danes on holiday in the UK also often like 5. Visiting parks or gardens
to spend time outdoors with half of them
visiting parks or gardens and more than a 6. Socialising with locals
quarter include a walk in the countryside.
About 33,000 Danish visits per annum 7. Visiting museums and art galleries
feature time watching football.
8. Visiting castles or historic houses
Danish holiday visits have an above-
average propensity to visit the performing 9. Walking in the countryside
arts or a literary/film/music/TV site.
96% of Danish visitors are either ‘Very’ or 10. Going on a guided tour
‘Extremely’ likely to recommend the UK for
For more information on activities, please consult:
a holiday or short-break.
visitbritain.org/activities-undertaken-britain
Source: International Passenger Survey by ONS, rankings based on 2007-2017 data
*VFR stands for visiting friends and/or relatives
30Market and Trade Profile Denmark
2.1 Inbound activities
Propensity to visit museums and art Propensity to visit built heritage sites
galleries
13%
VFR: visited religious buildings
24% 18%
VFR: visited museums and art
galleries VFR: visited castles/historic 18%
23% houses 23%
Holiday: visited religious 26%
buildings 35%
43%
Holiday: visited museums and
Holiday: visited castles/historic 43%
art galleries
48% houses 48%
All journey purposes: visited 16%
religious buildings 20%
26%
All journey purposes: visited All journey purposes: visited 25%
museums and art galleries castles/historic houses
28% 28%
Denmark All markets Denmark All markets
Source: International Passenger Survey by ONS, 2016
31Market and Trade Profile Denmark
2.1 Inbound activities
Propensity to attend the performing arts Number who went to watch sport live
during trip (000s)
15%
Holiday: attended a live music event 33
10%
All journey purposes: attended a live 10%
music event 7%
All journey purposes: went to the 12%
theatre/musical/opera/ballet 9%
VFR: went to the 8%
theatre/musical/opera/ballet 8%
Holiday: went to the 21%
theatre/musical/opera/ballet 2 1
14%
Denmark All markets Football Golf Rugby
Source: International Passenger Survey by ONS, 2016 (performing arts) and 2013 (watch sport live). NB data for watching individual sports is based on a small sample size.
32Market and Trade Profile Denmark
2.1 Inbound activities
Propensity to go for a walk Propensity to visit a park or garden,
or a national park
9% Holiday: Visiting a National 7%
Holiday: Walking along the coast
11% Park 11%
26%
Holiday: Walking in the countryside All journey purposes: Visiting a 4%
26%
National Park 7%
8%
VFR: Walking along the coast
11% 26%
VFR: Visiting parks or gardens
22% 32%
VFR: Walking in the countryside
28%
Holiday: Visiting parks or 50%
All journey purposes: Walking along 6% gardens 50%
the coast 8%
All journey purposes: Visiting 30%
All journey purposes: Walking in the 18%
countryside parks or gardens 32%
20%
Denmark All markets Denmark All markets
Source: International Passenger Survey by ONS, 2016 (visiting parks and gardens and a national park), 2010 (walking along the coast) and 2007 (walking in the countryside)
33Market and Trade Profile Denmark
2.1 Inbound activities
Propensity to go to a pub, and to Propensity to go to restaurants, or bars
socialise with locals and night clubs
VFR: socialising with the locals 37% 12%
45% VFR: went to bars or night clubs
14%
VFR: went to pub 46% 59%
VFR: dining in restaurants
49% 62%
33% Holiday: went to bars or night clubs 10%
Holiday: socialising with the locals 15%
32%
51% Holiday: dining in restaurants 87%
Holiday: went to pub 70%
48%
11% Business: went to bars or night clubs 7%
Business: socialising with the locals 6%
15%
24% Business: dining in restaurants 66%
Business: went to pub 49%
24%
All journey purposes: socialising with All journey purposes: went to bars or 10%
29%
the locals 32% night clubs 12%
All journey purposes: dining in 74%
All journey purposes: went to pub 43%
restaurants 61%
42%
Denmark All markets Denmark All markets
Source: International Passenger Survey by ONS, 2008 (dining in restaurants) and 2017 (all other activities)
34Market and Trade Profile Denmark
2.1 Inbound activities
Propensity to go shopping Propensity to purchase selected items
None of these 36%
38%
All journey purposes: went 54% 13%
Other holiday souvenir (not… 16%
shopping
54% Items for your home e.g. furnishing 4%
3%
Electrical or electronic items e.g.… 3%
3%
62% 5%
VFR: went shopping CDs, DVDs, computer games etc 5%
61% 17%
Food or drink 24%
Games, toys or gifts for children 8%
68% 9%
Holiday: went shopping Books or stationery 10%
13%
69% 16%
Cosmetics or toiletries e.g. perfume 12%
Bags, purses etc 7%
15% 9%
Business: went shopping Personal accessories e.g. jewellery 12%
10%
21%
Clothes or shoes 45%
41%
Denmark All markets Denmark All markets
Source: International Passenger Survey by ONS, 2017 (shopping) and 2013 (purchase of selected items)
35Market and Trade Profile Denmark
2.1 Inbound activities
Propensity to participate in an English Propensity to visit a literary, music, TV
language course during a visit to the UK or film location
3%
15%
Holiday: visited literary, music, TV,
or film locations
2% 9%
2%
1% 1% 1%
8%
All journey purposes: visited
literary, music, TV, or film locations
5%
% of all visits
Denmark Norway Sweden
Germany France All markets Denmark All markets
Source: International Passenger Survey by ONS, 2017 (literary, music, TV or film location) 2018, Did you go on any English language courses during this visit?
Displayed as % of all visits to the UK from each country that included participation in an English language course.
36Market and Trade Profile Denmark
2.2 Welcome and recommending Britain
Feeling of ‘welcome’ in Britain Likelihood to recommend Britain
80% 82% 81% 82%
17% 15% 15% 15%
2% 2% 0% 0% 0% 0% 3% 2% 1% 0% 0% 0%
Very Welcome Neither Unwelcome Very Extremely Likely Neutral Unlikely Not likely
Welcome Unwelcome likely at all
Denmark All market average Denmark All market average
Source: International Passenger Survey by ONS, 2017
37Market and Trade Profile Denmark
2.3 Perceptions of the UK
Cultural attractions play a key role in attracting Danes
to holiday in Britain for almost two-in-three visitors.
About a third of Danish holiday visitors are motivated by Cultural
the ease of access to Britain, to get around while here
on holiday and vibrant cities and over-index on these attractions
motivations in comparison to the all-market average. are the biggest draw
Being a destination where English is spoken, the ease for Danish holiday
to plan and organise a holiday in Britain as well as visitors
Britain’s contemporary culture, trying local food and
drink and visiting friends and/or relatives are also stated
as reasons to holiday in Britain by an above-average
share of Danish visitors.
Danes were less likely than average to state
motivations like the wide variety of places to visit in
Britain and the climate/weather.
Source: VisitBritain/IPSOS 2016
38Market and Trade Profile Denmark
2.3 Perceptions of the UK
Motivations for choosing Britain as a holiday destination
63%
Cultural attractions 42%
8%
Wide variety of places to visit 25%
16%
Wanted to go somewhere new 23%
33%
Vibrant cities 22%
18%
Countryside/natural beauty 22%
33%
Easy to get around 22%
28%
Somewhere English-spoken 22%
24%
Visiting friends or relatives 22%
34%
Ease of getting to the country 21%
13%
A culture different from own 19%
21%
A mix of old and new 19%
23%
Contemporary culture 18%
22%
Try local food and drink 18%
15%
A good deal 18%
4%
Security / safety 17%
7%
Accommodation (variety & quality) 16%
26%
Easy to get plan/organise 16%
14%
Meeting locals 13%
6%
Wide range of holiday activities 13%
2%
The climate / weather 12%
9%
Cost of staying in the destination 12%
7%
Watching sport 10%
6%
Visit a film/TV location 9%
7% Denmark All markets
Easy to visit with children 8%
Source: VisitBritain/IPSOS 2016, adjusted data, base: visitors (Market scores have been adjusted so that the
sum of all motivations for each market is equivalent to the global total, to enable meaningful comparisons)
39Market and Trade Profile Denmark
Chapter 3:
Understanding
the market
40Market and Trade Profile Denmark
3.1 Structural drivers
Demographics & society
Population of about 6 million.
There are 5 regions: Sjaelland, Hovedstaden, Midtjylland,
Syddanmark and Nordjylland.
5.8m
Danish
The areas in Denmark with the most inhabitants are coastal areas, population
particularly in Copenhagen and the Eastern parts of Denmark‘s
mainland. This explains the smaller share of visitors sourced from
other areas.
The official language is Danish along with Faroese, Greenlandic (an
Inuit dialect) and German (small minority). English is taught as a
second language. Danes often have a good command of English and
usually enjoy speaking English when in Britain.
Danish employees are usually entitled to 25 days of annual leave
and there are 9 public holidays per year.
Source: Oxford Economics, CIA World Factbook 2019
41Market and Trade Profile Denmark
3.1 Structural drivers: general market overview
General market conditions
Denmark is the UK’s fifteenth largest source market in The Danish labour market is going strong and wages are
terms of visits and twenty-first most valuable in terms of set to remain solid with low inflation, albeit low consumer
visitor spending in 2018. confidence might mean that the additional income could
The Danish economy’s performance was boosted by the be going towards savings - a downside risk for private
strong performance of its exports despite the weak global consumption.
trade picture. The pace of growth for the Danish GDP is NB these forecasts were run in late February 2020 so
forecast to slow in 2020, while it is expected to pick up in predate the escalation of economic damage due to
2021 again in line with a gradually recovering European COVID-19. We expect the 2020 outturn to be below
economy. these forecasts, perhaps significantly below.
Key demographic and economic data Economic indicators (%)
Measure (2019 data) Denmark Eurozone Indicator 2018 2019 2020 2021
Population (m) 5.8 338.9
Real GDP growth 2.4 2.1 1.3 1.5
GDP per capita PPP (US$) 51,056 43,995
Annual average GDP growth Real consumer
1.8 1.4 2.6 1.4 1.3 1.6
over past decade (%) spending growth
Annual average GDP growth
2.1 1.2 Unemployment rate 3.8 3.7 3.7 3.6
in 2019 (%)
Source: Oxford Economics
42Market and Trade Profile Denmark
3.1 Structural drivers: demographic and social indicators
Population dynamics
The country has a population of about 6 million with a
median age of 42.
Measure 2019
estimate Most people in Denmark are well-educated and enjoy a
very high standard of living with real GDP per capita in
purchasing power parity terms of more than US$51,000
Total population (m) 5.8
- above the Eurozone average and forecasted to
increase in the years to come.
Median age (2020 est.) 42 years old
88% of Danish people live in cities (World Bank est.).
Overall growth rate (2019-2023) 1.7% Exchange rate: comparing January 2015, when GBP was
very strong vs. DKK, and January 2020, the cost of GBP
was 14% more affordable for Danish visitors to the UK.
Indicator 2010 2020 2030 2040
Median age
40.6 42.3 42.3 43.4
(in years)
Source: Oxford Economics, CIA World Factbook 2020, Statista 2019, Bank of England, World Bank
43Market and Trade Profile Denmark
3.1 Structural drivers: exchange rate trends
Exchange rate trends (cost of GBP in DKK)
14.00
12.00
10.00
8.80
8.00
6.00
4.00
2.00
0.00
2001 2002 2003 2004 2005 2006 2007 2008 2009 2010 2011 2012 2013 2014 2015 2016 2017 2018 2019 2020
Please find the most up-to-date exchange rate trend based on monthly averages at visitbritain.org/visitor-economy-facts.
Source. Bank of England
44Market and Trade Profile Denmark
3.2 Consumer trends
Three out of four Danes went on holiday in 2018, making
a total of 8.1 million holiday trips. The Danish spent a total
of approx. DKK40bn on holidays abroad in 2018.
61% of Danes who went on holiday in 2018 spent one or
more holiday trips in Denmark. In particular, families with
3 out of 4
children chose to holiday in their home country with a Danes go on at least
share of 65% in 2018 (up from 56% in 2017). one holiday per year
Whilst for most Danes sustainability considerations have (2018)
not filtered through into changed behaviour when on
holiday, 15% state that it is likely to affect their choices for
their next trip and 17% of Danes consider to reduce
travelling abroad due to environmental reasons.
Among leisure visitors, the UK is particularly popular for
short Danish holiday trips ranking 4th for such trips.
The sharing economy is a growing trend in Denmark, in
line with other European markets, and the Danes are
familiar with companies like AirBnB and Uber.
Source: Dansk Kyst & Natur Turisme & Visit Denmark 2019 , Statistics Denmark, The Danish Holiday Travel Survey 2019 by Epinion
45Market and Trade Profile Denmark
3.2 Consumer trends: overall travel trends
Travel trends
Three out of four Danes went on holiday in 2018, making of their next holiday. 17% of Danes are considering
a total of 8.1 million holiday trips. The Danish spent a total reducing travelling abroad due to environmental reasons.
of approximately DKK40bn on holidays abroad in 2018. Knowledge about sustainability was found to influence
Danes spent a total of DKK7bn on city breaks, making it attitudes towards holiday travel: four times as many of
the largest and most valuable segment in the market. those who consider themselves as having some
61% of Danes who went on holiday in 2018 spent one or knowledge about sustainability plan to travel less for this
more holiday trips in Denmark. Particularly families with reason.
children chose to holiday in their home country with a The UK ranks 4th among destinations for Danish holiday
share of 65% in 2018 (up from 56% in 2017). trips of less than four nights in 2018, behind Germany,
Domestic stays amounted to a total of almost 12 million Sweden and Norway, ahead of Spain and France, making
nights in the three summer months of 2018 alone which it a top destination for shorter breaks. When it comes to
account for 45% of Danish domestic visitor nights in the Danish holiday trips of more than four nights the UK
whole year. ranks in 10th place among the most popular destinations
Whilst the majority of Danes have not changed their travel for such trips in 2018.
behaviour with regards to sustainability so far, but 11% of
them say that sustainable and environmentally-friendly
considerations have been an influence on recent travel
decisions and 15% state that it will influence their choices
Source: Dansk Kyst & Natur Turisme & Visit Denmark 2019, Dansk ERHVERV/Statistics Denmark, Statistics Denmark, The Danish Holiday Travel Survey 2019 by Epinion
46Market and Trade Profile Denmark
3.2 Consumer trends: motivation and attitudes to holidays
Favourite holiday destinations for Danes in 2018 Motivation and attitudes to holidays
The majority of Danes said that they were unlikely to
Rank Holidays abroad: Holidays abroad:
amend their holiday plans due to the economic situation
fewer than four four nights or
(74%) and only 10% said that they go on holidays in 2016
nights more
but were likely to spend less (Flash Eurobarometer 432
1 Germany Spain by EC). This shows holiday plans are very important to
Danes and a tendency of a much lower impact of the
2 Sweden Italy economic situation on their planning than the European
3 Norway Greece average.
The use of the sharing economy is a growing trend in
4 United Kingdom Germany Denmark in line with other European markets. The Danes
5 Spain France are familiar with companies like AirBnB and Uber and
price is the main reason to choose these services. Uber
6 France Sweden has, however, been banned in Denmark which could
7 Netherlands Turkey impact the readiness to use the company‘s services
abroad.
8 Hungary USA
9 Czech Republic Poland
10 Poland United Kingdom
Source: Statistics Denmark, Flash Eurobarometer 432 by EC 2016: During 2015, how many times did you travel for professional or personal reasons where you were away from home for a minimum of one
night?, Danmarks Radio 3 August 2017
47Market and Trade Profile Denmark
3.2 Consumer trends: reasons for holidays
Main reasons for going Reasons to return to the same destination
on holiday (%) for a holiday (%)
Sun/beach 36% 45%
39% The natural features
45%
Visiting family/ friends / 33%
relatives 38% The quality of the accommodation 29%
32%
Nature 33%
31% Cultural and historical attractions 39%
25% 31%
City trips
27% 17%
The general level of prices
33% 24%
Culture
26% 21%
Wellness/Spa/health 7% How tourists are welcomed
21%
treatment 13%
The activities/services available 24%
Sport-related activities 12% 20%
12%
10% Accessible facilities for people 5%
Specific events with special needs 6%
9%
Denmark EU28 Denmark EU28
Amongst the main reasons for going on a holiday for Danish Asked for reasons which would make them come back, 45%
travellers are: sun/beach, visiting family/friends/relatives, of Danes value natural features and about two in five stated
nature and culture followed by city trips. cultural and historical attractions, followed by the quality of the
accommodation and the activities/services available.
Source: Flash Eurobarometer 432 by EC 2016: What were your main reasons for going on holiday in 2015? Firstly? And then? and Which of the following would make you go back to the same
place for a holiday? Firstly? And then?
48Market and Trade Profile Denmark
3.3 Booking and planning
A large proportion of Danish holiday visitors tend to
start thinking about their trip early with 37% doing
this as early as half a year or more in advance.
Over half
40% of bookings were made in the three to six of Danish visitors booked
month window before the arrival to Britain; 39% of their trip at least 3 months
Danish bookings happened within three months of before their arrival in
the trip. Britain
Danes tend to book their trip further in advance
than many other visitors. Compared to the all-
market average, 10% fewer make their booking
within two months of arrival in Britain.
Most bookings to Britain were made online;
however, when travel and accommodation are
booked together, about one in ten visitors made the
booking over the phone and only 4% face-to-face.
Source: VisitBritain/IPSOS 2016
49Market and Trade Profile Denmark
3.3 Booking and planning: booking channels and ticket sales
How trips to Britain were booked: travel only How trips to Britain were booked: accommodation only
Booking method Denmark All markets Booking method Denmark All markets
Online 92% 85% Online 75% 70%
Face-to-face 2% 10% Face-to-face 2% 7%
By phone 4% 4% By phone 2% 3%
Don’t know 3% 1% Did not book/stayed 16% 17%
with friends/relatives
Don’t know 6% 2%
Danish visitors tend to be very comfortable with
booking their trips to Britain online. Almost all
How trips to Britain were booked: travel and
Danes booked their travel (i.e. transport to
Britain) on the Internet. accommodation (holiday)
Booking method Denmark All markets
Only 4% of bookings were made face to face
Online 82% 64%
when they booked a holiday package (i.e. travel
and accommodation combined). This compares Face-to-face 4% 27%
to the global average of 27%.
By phone 11% 8%
Don’t know 4% 1%
Source: VisitBritain/IPSOS 2016, base: visitors (online survey)
50Market and Trade Profile Denmark
3.3 Booking and planning: booking channels and ticket sales
Propensity to make a purchase before or during trip
42% 41%
30% 28% 28% 31%
22% 23% 24% 22% 19% 16%
14%
11% 11%
6% 6% 4%
3% 5%
Pre During Pre During Pre During Pre During Pre During
Theatre / Musical / Sporting event Guided sightseeing Guided sightseeing Tickets / passes for
Concert tickets tickets tours in London tours outside of other tourist
London attractions
Denmark All markets
Prior to trip: Danes are less likely to buy any of the above items before their trip than the all-market average.
Theatre/musical or concert tickets are the most likely to be bought in advance of the trip to Britain.
During the trip: a similar picture is true after arrival in Britain, with Danes less likely to buy the above products than the
average visitor. The only exception are tickets / passes for other tourist attractions which were in line with the all market
average and are by some distance the mostly likely to be purchased here.
Source: VisitBritain/IPSOS 2016, base: visitors (online survey)
51Market and Trade Profile Denmark
3.3 Booking and planning: lead-times (1/2)
Decision lead-time for visiting Britain
Starting to think about trip Deciding on the destination
Lead time Denmark All markets Lead time Denmark All markets
6+ months 37% 45% 6+ months 34% 32%
3-6 months 34% 38%
3-6 months 34% 31%
1-2 months 20% 19%
1-2 months 19% 13%
Less than 1 month 6% 5% Less than 1 month 5% 7%
Don’t know 5% 3% Don’t know 7% 3%
Looking at options/prices Booking the trip
Lead time Denmark All markets Lead time Denmark All markets
6+ months 21% 21% 6+ months 13% 14%
3-6 months 41% 37% 3-6 months 40% 32%
1-2 months 25% 27% 1-2 months 30% 28%
Less than 1 month 6% 12% Less than 1 month 9% 21%
Don’t know 8% 4% Don’t know 9% 5%
Source: VisitBritain/IPSOS 2016, base: visitors
52Market and Trade Profile Denmark
3.3 Booking and planning: lead-times (2/2)
Decision lead-time for visiting Britain: commentary (see tables on previous slide)
Almost two in five Danish visitors start thinking early about their trip to Britain, i.e. half a year or more in advance of their
journey; about one in three did this three to six months in advance.
69% made their decision to travel to Britain at least three months prior to the actual journey.
About two in five Danish visitors looked at options and prices between three and six months ahead of the trip and 40% also
made the booking in the same time frame. One in four were more spontaneous and looked at options between one and two
months before the trip and 6% within one month.
Many Danes book their trip earlier than the average visitor; compared to the all-market average, 10% fewer make their
booking to Britain within two months of arrival.
Most of the Danish visitors who booked travel separately booked their transport directly with the service provider (77%). 59%
of those who booked accommodation separately purchased it directly from the accommodation provider and 34% from a
travel agent/tour operator or travel comparison website.
Source: VisitBritain/IPSOS 2016, base: visitors
53Market and Trade Profile Denmark
3.4 Reaching the consumer and perceptions of Britain
The most influential information source for Danes
when making a holiday destination choice is, by
far, friends, family and colleagues followed by price
comparison websites and information from search
engines. Travel agent or tour operator websites Cultural
and talking to friends and family on social networks attractions
also feature among some of the most important
Biggest draw for Danish
influences on where to go for a holiday.
holiday visitors for
Whilst online sources are popular for researching choosing Britain
and making a destination choice, about one in five
Danes state that they also consult a travel
guidebook, travel features and special deals in
magazines, newspapers or on TV.
On average, Danes watch about 2 hours and 30
mins. of TV per day with habits shifting away from
traditional TV to streaming services for all areas of
consumption apart from news broadcasts.
Sources: VisitBritain/IPSOS 2016 (adjusted data), DR Medieforskning 2018, DR Medieforskning 2020
54Market and Trade Profile Denmark
3.4 Reaching the consumer: broadcast media, radio and papers
Broadcast media Newspapers
Public service television Danmarks Radio broadcasts Newspapers reached almost two in five Danes overall,
through 6 main channels: DR1, DR2 (Documentary), with a much lower share among young readers
DR3 (Young Adult), DRK (Culture), DRUltra (Teens) (roughly one in five between 12 and 34 years of age,
and DRRamasjang (Children), which make up about about a third of those aged 35-54, and more than half
24% of the Danish television market. Main commercial and more among the more senior age groups in 2017.
TV channels: TV2 (23% market share in 2018). The biggest dailies are Politiken (Biggest newspaper in
About 61% of all Danes watch television daily Denmark), Jyllands-Posten, Børsen & Berlingske
(average of 2.5 hours). Compared to other European Tidende. The tabloids: EkstraBladet and BT. Both
countries, Danes spend less time watching traditional published daily with focus on entertainment, sports,
television. The decrease should be viewed in culture and opinion pieces.
connection with the growing market for smart TVs Regional and local subscription morning papers:
amongst Danish consumers (53%). published at least 3x/week with the biggest being
JydskeVestkysten, Sjællandsgruppen and
Radio SjællandskeMedier.
Danmarks Radio is the dominant player with the largest Low frequency papers published 1x or 2x/week include
share of the radio audience market. 3 national channels: local papers in the metropolitan areas and small
P1/P2 (news, culture and public affairs), P3 (Youth) and regional and local papers, Jysk-Fynske Medier owning
P4 (Pop Music + regional target 40+) along with many the majority.
DAB digital niche stations; New public channel
Freely distributed newspapers: around 100, distributed
Radio24syv (talk radio); Local commercial radio: Bauer
often on weekly basis, the biggest is MX distributed
Media + Jysk/Fynske Medier. 73% of Danes listen to the
5x/week. (Now part of BT as BTMX).
radio daily but streaming is increasing.
Many of the newspapers have travel sections e.g.
Sources: DR Medieforskning, TNS Gallup, Danmarks Statistik, Media Develpment 2018 by the Danish Politiken publishes a travel section every Saturday.
Agency for Culture and Palaces
55Market and Trade Profile Denmark
3.4 Reaching the consumer: magazines and online media
Magazines Online media
Many Danish magazines are beginning to transform The Internet is now seen as the most important
from paper based to digital with applications such as information source for Danes ahead of TV, daily
Flipp, Pling and Wype providing a digital subscription newspapers and radio. The smartphone is becoming
model to read magazines and periodicals on digital increasingly important among Danes in this context,
devices. particulary when they are looking to stream news.
Aller is the largest conglomerate of magazines with a Social Media: 53% of Danes use Facebook daily,
70% market share on weekly magazines and a 20% followed by Snapchat and Instagram with 19% of Danes
share on monthly editions. 2.3 million Danes read an respectively using them every day in 2018. Facebook is
Aller magazine once a month. Other big players are forecast to have 3.1 million Danish users by 2022.
Egmont and Benjamin. Streaming gaining steam: three out of four Danes have
Vagabond is currently the only dedicated travel-only tried streaming and more than half of the adult population
magazine in Denmark, although many lifestyle streams weekly in 2019. Opting for streaming services is
magazines have travel sections. particularly popular among younger age groups.
Many unions still print magazines for their members, In 2019, the streaming market at home is dominated by six
and there is no data available for the amount of niche services: Netflix, DRTV, YouTube, TV 2 Play, Viaplay and
magazines. HBO Nordic
Sources: Aller, Bladkiosken.dk, Media Develpment 2018 by the Danish Agency for Culture and Palaces, Statista, DR Mediaforskning 2020 and 2018
56Market and Trade Profile Denmark
3.4 Reaching the consumer: social media on holiday
Use of social media on holiday The social media channels most used in the Danish
market are Facebook, Youtube, Google+, Instagram,
Snapchat and Twitter.
To keep in touch with people at home 35% Almost half of Danes have not used social media at all on
44%
holidays abroad, which is the highest proportion of all 20
24%
To post / upload photos of my holiday
39% countries included in the survey. More than one in three
18% like to keep in touch with people at home.
Look for recommendations for places to eat or drink
30%
50% like to stay connected whilst they are on holiday and
I have not used social media at all on this type of 49%
holiday 29%
51% regard a smartphone as essential whilst they are on
Share with others where you are / what you are doing 17% holidays, both below the all market average.
while on holiday 29% Although 63% of Danish travellers love to take photos
To let people know where I am at a given moment 12%
(e.g. checking in on Facebook) 25%
when they are on holiday, this is a lower proportion than
To help you plan / decide where to go or what to see 10%
in many other markets, similar to the other Nordics.
or what to do 23% 57% of Danish travellers have shared holiday photos
Ask for advice on where to go or what to do 6% online or would like to do so and 29% have shared
20%
Share my own advice or recommendations about
holiday video content or would like to do so (lowest
5%
visiting where I am 19% proportion out of all markets). 47% of Danes have used
location technology to find places to visit and a 22% are
Denmark All markets interested in using it. Only 8% enjoy writing reviews on
social media of places they have been to on holiday and
trust in reviews is lower (34%) than in most markets.
Source: VisitBritain/IPSOS 2016, base: all respondents: Have you used social media in any of the following ways whilst on your last holiday to Britain (visitors) /on your last holiday to a foreign
destination (considerers)?
57Market and Trade Profile Denmark
3.4 Reaching the consumer: influences
Influences on destination choice
Talking to friends / relatives / colleagues 70%
40%
Information from search engines [e.g. Google] 48%
33%
Looking at prices of holidays/flights on price comparison websites 50%
31%
Websites providing traveller reviews of destinations [e.g. TripAdvisor] 26%
30%
Talking to friends or family in your social network (e.g. via Facebook / Twitter) 38%
26%
An accommodation provider/ hotel website 32%
26%
A travel guidebook 21%
25%
Travel agent or tour operator website 40%
25%
Travel blogs / forums 12%
22%
Travel programme on TV 7%
19%
A special offer or price deal you saw advertised online 26%
19%
Travel agent or tour operator brochure 14%
18%
An official tourist organisation website or social media site for the country or destination 23%
18%
An official tourist brochure for the country / city / region 11%
17%
A travel feature / article in a magazine or newspaper 20%
16%
Direct advice from a travel agent/tour operator (face-to-face, over the phone) 10%
16%
Images or videos your friends or family have posted to social media 9%
15%
Images / information in online adverts 9%
15%
A special offer or price deal you saw advertised offline e.g. in a newspaper, magazine or on TV 20%
15%
Images or videos from a photo/video sharing social network site 4%
14%
Travel app 5%
14%
Images / information in adverts in a magazine or newspaper 10%
12%
Articles on an online encyclopaedia e.g. Wikipedia, Wikitravel 6%
12%
Images / information in TV adverts 3%
11%
Seeing social media posts from celebrities talking about their holiday destinations 3%
9%
Images / information on billboards / poster adverts 2%
9%
Travel programme on radio 2%
6%
Information in radio adverts 0%
6%
Denmark All markets
Source: VisitBritain/IPSOS 2016, base visitors & considerers. Which of the following sources influenced your choice of destination? (Market scores have been adjusted so that the sum of all influences
for each market is equivalent to the global total, to enable meaningful comparisons)
58Market and Trade Profile Denmark
Chapter 4:
Access and travel
trade
59Market and Trade Profile Denmark
4.1 Access: key facts
97% of Danish visits to the UK were made by plane. It is
a short non-stop flight: usually between just under 2hrs
and 4 hrs flight time, depending on where in the UK the Almost all of Danish
flight goes to.
Most flights come in through the Copenhagen – London visitors travel to the
corridor.
Annual seat capacity has increased sharply over the last
UK by plane.
few years leading up to 2016 when it peaked, then stood
slightly lower in 2017 and remained broadly stable since.
Ryanair and SAS lead among airlines serving routes
between Denmark and the UK providing over half of seat
capacity in 2019. British Airways ranks third with almost a
Access to Britain
fifth of annual seat capacity, ahead of Norwegian and
easyJet. Measure 2019
Danish visitors departing Britain by air pay £13 in Air Weekly aircraft departures 280
Passenger Duty.
Weekly aircraft seat capacity 43,622
A very small proportion of Danish inbound visits came to
the UK via the Channel Tunnel or across the sea in 2018. Airports with direct routes in Denmark 6
Airports with direct routes in Britain 16
Source: International Passenger Survey by ONS, Apex 2019 non-stop flights
60You can also read