Acute Lymphoblastic Leukemia Detection from Microscopic Images Using Weighted Ensemble of Convolutional Neural Networks
←
→
Page content transcription
If your browser does not render page correctly, please read the page content below
Acute Lymphoblastic Leukemia Detection from Microscopic Images
 Using Weighted Ensemble of Convolutional Neural Networks
 Chayan Mondala,d , Md. Kamrul Hasana,1,∗, Md. Tasnim Jawada , Aishwariya Duttab , Md.
 Rabiul Islama , Md. Abdul Awalc , Mohiuddin Ahmada
 a
 Department of Electrical and Electronic Engineering (EEE), Khulna University of Engineering &
 Technology, Khulna-9203, Bangladesh
 b
 Department of Biomedical Engineering (BME), Khulna University of Engineering & Technology,
 Khulna-9203, Bangladesh
 c
 Electronics and Communication Engineering (ECE) Discipline, Khulna University, Khulna-9208,
arXiv:2105.03995v1 [eess.IV] 9 May 2021

 Bangladesh
 d
 Department of Electrical and Electronic Engineering (EEE), Bangabandhu Sheikh Mujibur Rahman
 Science & Technology University, Gopalganj-8100, Bangladesh

 Abstract

 Acute Lymphoblastic Leukemia (ALL) is a blood cell cancer characterized by numerous
 immature lymphocytes. Even though automation in ALL prognosis is an essential aspect of
 cancer diagnosis, it is challenging due to the morphological correlation between malignant
 and normal cells. The traditional ALL classification strategy demands experienced pathol-
 ogists to carefully read the cell images, which is arduous, time-consuming, and often suffers
 inter-observer variations. This article has automated the ALL detection task from micro-
 scopic cell images, employing deep Convolutional Neural Networks (CNNs). We explore
 the weighted ensemble of different deep CNNs to recommend a better ALL cell classifier.
 The weights for the ensemble candidate models are estimated from their corresponding met-
 rics, such as accuracy, F1-score, AUC, and kappa values. Various data augmentations and
 pre-processing are incorporated for achieving a better generalization of the network. We
 utilize the publicly available C-NMC-2019 ALL dataset to conduct all the comprehensive
 experiments. Our proposed weighted ensemble model, using the kappa values of the ensem-
 ble candidates as their weights, has outputted a weighted F1-score of 88.6 %, a balanced
 accuracy of 86.2 %, and an AUC of 0.941 in the preliminary test set. The qualitative re-
 sults displaying the gradient class activation maps confirm that the introduced model has a
 concentrated learned region. In contrast, the ensemble candidate models, such as Xception,
 1
VGG-16, DenseNet-121, MobileNet, and InceptionResNet-V2, separately produce coarse
and scatter learned areas for most example cases. Since the proposed kappa value-based
weighted ensemble yields a better result for the aimed task in this article, it can experiment
in other domains of medical diagnostic applications.
Keywords: Acute lymphoblastic leukemia, Deep convolutional neural networks, Ensemble
image classifiers, C-NMC-2019 dataset.

1. Introduction

1.1. Problem presentation

 Cancer, a group of uncommon and distinctive diseases, is one of the deadliest diseases
[17], which is abnormal and uncontrolled cell growth. In 2020, World Health Organization
(WHO) claimed that approximately 19.3 million people were diagnosed with cancer, caused
a death of 10 million people, which is almost 1.6 times greater than in 2000 [81]. The affected
number is expected to be around 50 percent higher in 2040 than now [81]. Among various
types of cancer, one of the most common types of childhood cancer is Acute Lymphoblastic
Leukemia (ALL), which affects the White Blood Cells (WBCs) [6]. ALL patients have an
excessive amount of premature WBCs in their bone marrow and can spread to other organs,
like the spleen, liver, lymph nodes, central nervous system, and testicles [1]. Although the
leading causes of ALL are unknown yet, several representatives, like contact with severe
radiation and chemicals, such as benzene and infection with T-cell lymphoma, can boost
the possibility of generating ALL [5]. Almost 55.0 % of total worldwide ALL cases are caused
in the Asia Pacific region [69]. According to WHO, ALL’s total cases are 57377, which is
21.9 % of the worldwide total childhood cancer cases in 2020 [80].

 ∗
 I am corresponding author
 Email addresses: chayan.eee@bsmrstu.edu.bd (Chayan Mondal), m.k.hasan@eee.kuet.ac.bd (Md.
Kamrul Hasan), jawad1703006@stud.kuet.ac.bd (Md. Tasnim Jawad), aishwariyadutta16@gmail.com
(Aishwariya Dutta), rabiulnewemail@gmail.com (Md. Rabiul Islam), m.awal@ece.ku.ac.bd (Md. Abdul
Awal), ahmad@eee.kuet.ac.bd (Mohiuddin Ahmad)
 1
 Department of EEE, KUET, Khulna-9203, Bangladesh.

Preprint submitted to Informatics in Medicine Unlocked May 11, 2021
Generally, the doctors suspect ALL patients through specific symptoms and signs, where
different clinical inspections authenticate the ALL diagnosis [2]. The blood examinations are
frequently performed on the suspected ALL patients in the preliminary stage. The complete
blood count and peripheral blood smear inspections are accomplished to monitor the changes
in the numbers and appearances of WBC in blood cells, respectively [2]. The diagnosis of
ALL with higher accuracy is achieved by utilizing chromosome-based tests, such as cytoge-
netics, fluorescent in situ hybridization, and polymerase chain reaction, where chromosomes
are observed to recognize unusual blood cells [2]. An image-based automated Computer-
aided Prognosis (CAP) tool with negligible false-negative rates is a crying requirement to
accelerate ALL patients’ diagnosis in early stages, as the survival rate is as high as 90.0 %
with early detection [7]. Different image-based prognoses are being applied to diagnose ALL
patients [2], utilizing Computed Tomography (CT) & Magnetic Resonance Imaging (MRI)
scans, X-rays, and Ultrasound (US). However, the collections of those imaging modalities
are costly and time-consuming, requiring an expert pathologist, or hematologist, or oncol-
ogist [17]. Moreover, the scanners of those images are still unavailable in under-developed
and developing countries, especially in rural regions, according to a report published by
WHO in 2020 [82]. Currently, a microscopic image-based CAP system for ALL analysis can
overcome these limitations because these can be fully automated and do not require highly
trained medical professionals to run the tests [17]. In the last ten years, the efficiency of
Deep Learning (DL)-based methods for automating CAP systems increased dramatically,
and their performances seem to outperform conventional image processing methods in im-
age classification tasks [4]. However, the DL-based strategies have superior reproducibility
than the Machine Learning (ML)-based approaches; the latter methods require handcrafted
feature engineering [55]. Different DL-based methods have already proven their tremendous
success in varying fields of automatic classification, detection, or segmentation, such as skin
lesion [12, 23, 29, 30], breast cancer [27, 70], brain tumor [36, 77], diabetic retinopathy
[26], COVID-19 pandemic [22, 24, 48, 57], minimally invasive surgery [28], and others [72].
This article will explore and perform an in-depth study of the value of DL methods for the
image-based ALL prognoses. Different ways of ALL predictions are briefly reviewed in the
 3
following section.

1.2. Literature Review

 This section presents the review of current CAP methods for the analysis of ALL, where
we first discuss the ML-based systems, then subsequently DL-based approaches.

ML-based methods. Mohapatra et al. [56] proposed a fuzzy-based color segmentation
method to segregate leukocytes from other blood components, followed by the nucleus shape
and texture extraction as discriminative features. Finally, the authors applied a Support
Vector Machine (SVM) [15] to detect leukemia in the blood cells. The k-means Cluster-
ing (KMC)-based segmentation [51] was employed by Madhukar et al. [52] to extract the
leukocytes’ nuclei using color-based clustering. Different types of features, such as shape
(area, perimeter, compactness, solidity, eccentricity, elongation, form-factor), GLCM [58]
(energy, contrast, entropy, correlation), and fractal dimension were extracted from the seg-
mented images. Finally, they applied the SVM classifier, utilizing K-fold, Hold-out, and
Leave-one-out cross-validation techniques. Joshi et al. [38] developed a blood slide-image
segmentation method followed by a feature extraction (area, perimeter, circularity, etc.)
policy for detecting leukemia. The authors utilized the k-Nearest Neighbor (KNN) [21]
classifier to classify lymphocyte cells as blast cells from normal white blood cells. Mishra
et al. [55] proposed a discrete orthonormal S-transform [71]-based feature extraction followed
by a hybrid Principal Component Analysis (PCA) and linear discriminant analysis-based
feature reduction approach for a lymphoblastic classification scheme. Finally, the author
classified those reduced features using an AdaBoost-based Random Forest (ADBRF) [25]
classifier. The authors in [53] aimed at four machine learning-based algorithms, such as
classification and regression trees (CART), RF, Gradient Boosted (GM) engine [18], and
C5.0 decision tree algorithm [45]. Their experiment demonstrated the superior performance
of the CART method. Fathi et al. [14] produced an integrated approach combining PCA,
neuro-fuzzy, and GMDH (group method of data handling) to diagnose ALL, which helps
to detect two types of leukemia, such as ALL and acute myeloid leukemia. Kashef et al.

 4
[39] recommended different ML algorithms, such as decision tree [25], SVM, linear discrimi-
nant analysis, multinomial linear regression, gradient boosting machine, RF, and XGBoost
[25], where the XGBoost algorithm exhibited the best results. Authors in [16] developed a
K-means image segmentation and marker controlled segmentation-based classification and
detection algorithms, where multi-class SVM was used as a classifier. Table 1 shows a sum-
mary of several ML-based models for ALL classification with their respective pre-processing,
utilized datasets, and classification results in terms of accuracy.

Table 1: Summary ML-based methods for ALL classification, including publication year, pre-processing &
classification techniques, used datasets, and corresponding results in accuracy (Acc).

 Years Pre-processing Features Classifier Datasets Acc
 2011 [56] Median filtering & unsharp Hausdorff dimension, contour sig- SVM ALL-IGH [56] 93.0 %
 masking nature, fractal dimension, shape,
 color, and texture features
 2012 [52] KMC, color correlation, and Shape, GLCM, and fractal dimen- SVM ALL-FS [64] 93.5 %
 contrast enhancement sion features
 2012 [73] No Twelve size-, color-, and shape- KNN ALL-HUSM [73] 80.0 %
 based features
 2013 [38] Threshold-based segmentation Shape-based (area, perimeter, and KNN ALL-IDB [47] 93.0 %
 circularity) features
 2014 [49] Color correction, conversion, Texture, geometry, and statistical SVM and ALL-UCH [49] 92.0 %
 and KMC features KMC
 2015 [79] Contrast enhancement and Texture, geometry, color and sta- Fuzzy ALL-IDB [47] 98.0 %
 morphological segmentation tistical features cluster
 2019 [55] Color conversion and thresh- Morphological, textural, and ADBRF ALL-IDB1[47] 99.7 %
 olding for segmentation colour-based features
 2021 [16] Resizing, contrast enhance- Texture, geometry, and color fea- SVM ALL-JUSH [16] 94.6 %
 ment, and KMC tures

DL-based methods. Honnalgere and Nayak [32] proposed a VGG-16 [67] network, which
was fine-tuned with batch normalization and pre-trained on the ImageNet dataset [9]. A
DL-based framework was developed by Marzahl et al. [54], using the normalization-based
pre-processing step and two augmentation methods. They used ResNet-18 [31] network and
an additional regression head to predict the bounding box for classification. In [65], the
authors introduced a DCT-based ensemble model, a combination of Convolutional and Re-
 5
current Neural Networks (CNN-RNN) for the classification of normal versus cancerous cells.
In their hybrid model, pre-trained CNN was employed to extract features, whereas the RNN
was utilized to extract the dynamic spectral domain features. This ensemble-based model,
the combination of DCT-LSTM and its fusion with a pre-trained CNN architecture (AlexNet
[44]), made this classifier robust and efficient. The pre-processing scheme with crop contour
and data augmentation technique increased the aforementioned proposed architecture’s ac-
curacy. Ding et al. [10] presented three different deep learning-based architectures, such as
Inception-V3 [76], DenseNet-121 [35], and InceptionResNet-V2 [74] for white blood cancer
microscopic images classification model. Also, they proposed an ensemble neural network
model and demonstrated that their developed stacking model performed better than indi-
vidually any other single classification model employed in their experiment. In [66], the
authors recommended an ensemble of state-of-the-art CNNs (SENet and PNASNet) clas-
sification models. They adopted the Grad-CAM technique to scrutinize the CNN model’s
stability and visualize each cell’s most prominent part. Prellberg and Kramer [60] conferred
a leukemia cell classification model using ResNeXt [84] model with Squeeze-and-Excitation
modules [34]. The authors in [46] produced an automated stain-normalized white blood cell
classifier that can classify a malignant (B-ALL) cell or a healthy (HEM) cell. They used the
same ResNeXt (50 and 101) model’s ensemble technique and showed that the ResNeXt vari-
ants are performed best accordingly. Pan et al. [59] introduced the Neighborhood-correction
Algorithm (NCA) for normal versus malignant cell classification for microscopic images. The
authors combined ResNet [31] architecture’s advantages (ResNet-50, ResNet-101, ResNet-
152) and constructed a fisher vector [63]. According to weighted majority voting, they
corrected the initial label of the test cell images. Authors in [3] proposed a ten-layer CNN
architecture to detect ALL automatically. In [62], the authors compared three different deep
learning-based algorithms, such as AlexNet, GoogleNet [75], and VGG classifier model, to
detect lymphoblast cells. Recently, Gehlot et al. [17] developed the SDCT-AuxNetθ classifier
that uses features from CNN and other auxiliary classifiers. Rather than traditional RGB
images, stain deconvolved quantity images were utilized in their work. Table 2 summarizes
several DL-based models for ALL classification with their respective pre-processing, utilized
 6
datasets, and classification results in terms of F1-score.

Table 2: Summary DL-based methods for ALL classification, including publication year, pre-processing &
classification techniques, used datasets, and corresponding results in F1-score (FS).

 Years Pre-processing and augmentations Features Classifier Datasets FS
 2017 [11] Normalization, segmentation, random ro- No AlexNet and Texture-based BRAIRCH 95.4 %
 tations, and vertical flipping CNN [11]
 2019 [54] Normalization, flipping, rotation, scaling, No ResNet-18 for classification C-NMC [19] 87.5 %
 contrast enhancement, and tilting and detection
 2019 [10] Center crop, random affine transforma- No Ensemble of Inception- C-NMC [19] 86.7 %
 tion, normalization, rotation, scaling, hor- V3, Densenet-121, and
 izontal, and vertical flipping InceptionResNet-V2
 2019 [66] Pixel-wise normalization, randomly re- No Ensemble of SENet-154 and C-NMC [19] 86.6 %
 sized & rotated, and center cropping PNASNet
 2019 [46] Vertical and horizontal flipping, shearing, No Different variants of ResNeXt C-NMC [19] 85.7 %
 distortion, zooming, cropping, and skew-
 ing
 2019 [50] Region segmentation, stain normalization, No Deep bagging ensemble of In- C-NMC [19] 84.0 %
 random flipping, rotation, Gaussian noise ception and ResNet
 addition, contrast, and color adjustment
 2019 [78] Center cropping, normalization, and resiz- No MobileNet-V2 C-NMC [19] 87.0 %
 ing
 2019 [41] Center cropping, random flipping, and ro- No Ensemble of ResNet-34, C-NMC [19] 81.7 %
 tation ResNet-50, and ResNet-101
 2019 [32] Center cropping, CLAHE, random flip- No Modified VGG-16 C-NMC [19] 91.7 %
 ping, and rotation
 2019 [60] Center cropping, random flipping, rota- No ResNeXt with Squeeze-and- C-NMC [19] 89.8 %
 tions, and translations Excitation modules
 2019 [59] Center cropping, resizing, random rotation No Fine-tuned ResNet C-NMC [19] 92.5 %

1.3. Contributions

 The above discussions in Section 1.2 on the automatic ALL detection from the micro-
scopic images recommend that different CNN-based DL methods are most widely adopted
nowadays, as they alleviate the necessity of handcrafted feature extraction (see details in
Table 1 and Table 2). Although many articles have already been published, there is still
room for performance improvements with better genericity of the trained model. Moreover,
the CNN-based approaches experience data insufficiency to avoid overfitting, where the en-

 7
semble of different CNN architectures relieves the data scarcity limitations, as demonstrated
in various articles [10, 20, 41, 50, 66, 83]. With the aforementioned thing in mind, this article
intends to contribute to the exploration of building a robust ensemble model for the ALL
classification, incorporating different pre-processing. We propose to aggregate the outputs
of the ensemble candidate models, considering their corresponding achievements. Therefore,
we proposed a weighted ensemble model, where we conduct an ablation study to determine
the best weight metric. We perform the center-cropping of the original input images to en-
hance the detection results. A center-cropping enables the classifier to discover the abstract
region and detailed structural information while bypassing neighboring background areas.
Additionally, we develop five different pre-trained CNN models, such as Xception, VGG-16,
DenseNet-121, MobileNet, and InceptionResNet-V2, to compare the proposed model with
the same dataset and experimental settings. Our proposed weighted ensemble model out-
performs the above-mentioned pre-trained models and several recently published articles on
the same dataset, named C-NMC-2019 (see details in Section 2.1.1), to our most trustworthy
knowledge.
 The article’s remaining sections are arranged as follows: Section 2 describes the dataset
and recommended methodologies. Section 3 reports the achieved results from various ex-
tended experiments with a proper analysis. Finally, Section 4 concludes the article with
future working directions.

2. Materials and Methods

 This section illustrates the materials and methodology employed for the ALL classifi-
cation. Section 2.1 describes the proposed framework. The utilized datasets, image pre-
processing, adopted CNN architectures with ensemble techniques are explained in Sections
2.1.1, 2.1.2, and 2.1.3, respectively. After that, the training protocol and evaluation metrics
are explained in Sections 2.2 and 2.3, respectively.

 8
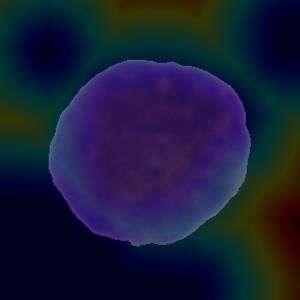
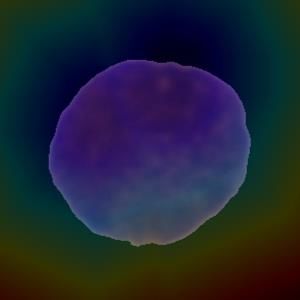
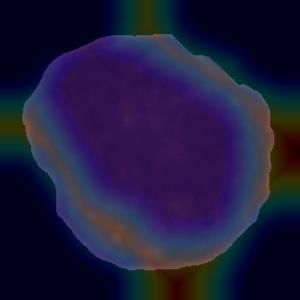
2.1. Proposed Framework Fig. 1 represents the block exhibition of the proposed framework. The C-NMC-2019 datasets are utilized as input images for a binary ALL classification task for both training and evaluation. The image pre-processing, including rebalancing and augmentations, is integrated into the networks for the training stage. Five different well-known networks are trained with the processed images to build an ensemble classifier as it ensures better performance in the other domain of medical image classifications [10, 41, 66]. We have adopted the pre-trained weights on the ImageNet dataset for all the networks to utilize the transfer learning policy. In the end, those five trained weights are ensembled employing soft weighted aggregation to obtain the final prediction. However, the following sections explain the essential parts of the proposed framework. CNN-1 Augmentation ALL Hem CNN-2 ALL Rebalancing Training CNN-3 ALL Hem Hem ROI extraction CNN-4 Ensemble ALL Hem C-NMC-2019 dataset Pre-processing Testing CNN-5 Figure 1: The illustration of the proposed framework, where the proposed pre-processing is the crucial integral step. The Region of Interest (ROI) is applied to both the training and testing dataset. The final categorization result is the ensemble of the different probabilities (P ) of five different CNNs. 2.1.1. Datasets The utilized datasets were released in the medical imaging challenge, named C-NMC- 2019 [19], organized by IEEE International Symposium on Biomedical Imaging (ISBI), which contains 118 subjects with 69 ALL patients and 49 Hem patients. The detailed information of the datasets is represented in Table 3. In our proposed model, the training dataset is split into train and validation sets, and final prediction is made throughout only the preliminary test set, as shown in Table 3. The resolutions of the dataset’s image size are 450 × 450 9
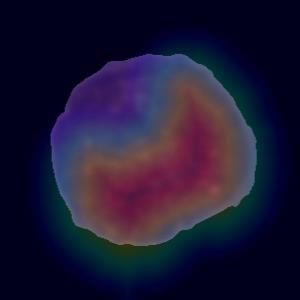
Table 3: The utilized dataset, composed of different subjects and their corresponding microscopic cell images,
where we split the given training samples to obtain training and validation samples.

 Subjects Cell Images
 Phases Dataset categories ALL Hem ALL Hem
 (Cancerous) (Normal) (Cancerous) (Normal)
 Training 32 19 5822 2703
 1st Training samples
 Validation 15 7 1450 686
 2nd Preliminary Test − 13 15 1219 648
 3rd Final test − 9 8 1761 825
 Total 69 49 10252 4862

pixels. Several sample images of the C-NMC-2019 dataset are displayed in Fig. 2. Table
3 shows that the dataset is imbalanced, and cancer cell images of training are around 2.15
times more than normal cell images, making the classifier biased towards the ALL class.
Such a biasness due to data imbalance is alleviated in the proposed framework by applying
two following techniques (see details in Section 2.1.2).

Figure 2: Sample images of the utilized C-NMC-2019 dataset, showing that there are unnecessary black
regions around the region of interest.

2.1.2. Pre-processing
 Our proposed system’s crucial integral pre-processing strategies are briefly described,
ensuring the better ALL prognosis system.
 Almost every image in the utilized dataset contains the region of interest in the center
position with black background (see in Fig. 2). Therefore, we have cropped the images
 10
centrally as the size of 300 × 300 pixels to decrease the overall dimension of the input
data, making learning a classifier faster and easier by providing the region of interest [60].
The class imbalance is a common phenomenon in the medical imaging domain as manually
annotated images are very complex and arduous to achieve [20, 23]. Such a class imbalance
can be partially overcome using different algorithmic-level approaches. We have used the
random oversampling technique, which involves replicating the samples of minority class
randomly and adding to training samples for balancing the imbalanced datasets. In our
proposed model, the Hem class was oversampled to 5822 images, and a total of 11644
images were trained during the training process. Different data augmentation techniques,
such as horizontal and vertical flipping, rotation, zooming, and shifting, are applied during
the training process for enhancing the model’s performance and building a generic model.

2.1.3. Classifier
 As mentioned earlier in Section 1.2 that the CNN-based methods outperform ML-based
methods and the radiologists with high values of balanced accuracy as proven in [40, 61].
However, single CNN may be obliquely limited when employed with highly variable and
distinctive image datasets with limited samples. Transfer learning technique from a pre-
trained model, which was trained on a large dataset previously, is becoming popular day
by day for its advantage of using learned feature maps without having a large dataset. In
this circumstance, we adopted five pre-trained networks, such as VGG-16 [67], Xception [8],
MobileNet [33], InceptionResNet-V2 [74], and DenseNet-121 [35] for using transfer learning
application and building an ensemble classifier to categorize ALL and Hem white blood cell
images.

VGG-16 (CN N1 ). In 2014, Simonyan and Zisserman [67] proposed a deep CNN model
consisting of 16 layers, improving the earlier AlexNet model by replacing large kernel filters.
VGG-16 is a deeper network (roughly twice as deep as AlexNet) by stacking uniform convo-
lutions. The image is transferred through a stack of convolutional layers, where the filters
were used with tiny receptive filters (3 × 3). Such a configuration allows the network to
capture more excellent information with lesser computational complexity. In VGG-16, five
 11
max-pooling layers carry out spatial pooling consists of (2 × 2) kernel size, which downsam-
ples the input by a factor of 2, bypassing the maximum value in a neighborhood of (2 × 2)
to the output. The VGG-16 ends with three fully connected layers followed by a 2-node
softmax layer.

Xception (CN N2 ). Xception Chollet [8] is an adaptation from the Inception network, re-
placing the Inception modules with depthwise separable convolutions. It is the introduction
of CNN based network entirely with the depthwise separable convolution layers. Such a
construction of the CNN model is computationally more efficient for the image classification
tasks. It has 36 convolutional layers, structured into fourteen modules, forming the feature
extraction base of the network. The Xception top layers consist of a global average pooling
layer for producing a 1 × 2048 vector. The authors of the Xception network kept a number
of the fully connected layer as optional as they used their model exclusively for investigating
classification tasks, and that’s why a logistic regression layer followed their convolution base.

MobileNet (CN N3 ). In 2017, Howard et al. [33] proposed the MobileNet, a streamlined
version of the Xception architecture, a small and low-latency CNN architecture. It also
applies depthwise separable convolution for developing a lightweight deep neural network.
Furthermore, MobileNet provides two parameters allowing to reduce its number of oper-
ations, which are width multiplier and resolution multiplier. The former parameter (α)
thins the number of channels, producing α × N channels instead of making N channels for
handling a trade-off between the desired latency and the performance. The latter channel
scales the input size of the image as the MobileNet uses a global average pooling instead
of a flatten. Indeed, with a global pooling, the fully connected classifier at the end of the
network depends only on the number of channels, not the feature maps’ spatial dimension.

InceptionResNet (CN N4 ). The InceptionResNet is a deep neural network designed by He
et al. [31] in 2016, combining the Inception architecture [74] with the residual connection. It
has a hybrid inception module inspired by the ResNet, adding the output of the convolution
operation of the inception module to the input. In this network, the pooling operation inside
the main inception modules is replaced in favor of the residual connections.
 12
DenseNet (CN N5 ). The DenseNet is a memory-saving architecture with high computa-
tional efficiency, which concatenates the feature maps of all previous layers for the inputs to
the following layers [10]. DenseNets have remarkable benefits, such as they can alleviate the
vanishing gradient problem, encourage feature reuse, strengthen feature propagation, and
significantly reduce the number of parameters. DenseNets consists of Dense blocks, where
the dimensions of the feature maps remain constant within a block, but the number of fil-
ters changes between them and Transition layers, which takes care of the downsampling,
applying batch normalization, 1 × 1 convolution, and 2 × 2 pooling layers.

Ensemble’s Strategies. Esteva et al. [13] proved that CNNs could outperform a human
expert in a classification task after an exhausting learning phase on a huge annotated training
set. However, in many cases, a sufficient number of annotated images (ground-truth) is not
available, so we should improve the accuracy by other approaches. The fields of decision
making and risk analysis, where information derived from several experts and aggregated by
a decision-maker, have well-established literature [37, 43]. In general, the aggregation of the
opinions of the experts increases the precision of the forecast. To achieve the highest possible
accuracy considering our image classification scenario, we have investigated and elaborated
an automated method considering the ensemble of CNNs. To perform the aggregation for
building an ensemble classifier, the outputs of the classification layers have been considered,
which use the output of the fully-connected layers to determine probability values for each
class (n = 2). A CNN ascribes n probability values Pj ∈ R to an unseen test image, where
Pj ∈ [0, 1], ∀j = 1, 2, and nj=1 Pj = 1. In ensemble modeling, we have to find out the
 P

probabilities Pj0 , where Pj0 ∈ [0, 1], ∀j = 1, 2, and nj=1 Pj0 = 1 for each test image from the
 P

probability values of the individual CNN architecture. The possible ensemble’s approaches
are discussed in the following paragraphs.

Simple Averaging of Probabilities (SAP). Averaging of the individual class confidence
value is considered as one of the most commonly used ensemble model [20, 25], which can

 13
be expressed as in Eq. 1. PN
 k=1 Pjk
 Pj0 = Pn PN , ∀j = 1, 2., (1)
 j=1 k=1 Pjk
where Pjk and N stand for the probability of CN Nk that a test image belongs to a particular
class and the number of CNN models (N = 5). Unluckily, an image may be misclassified
through the SAP technique if a model with low overall accuracy treats a test image with
high confidence, while the other models also provide low but non zero confidence values to
the same wrong class [20].

Weighted Ensemble of Networks (WEN). To overcome the aforementioned limita-
tions in the SAP method, we apply the weighted ensemble approach, which is an extension
of SAP where the performance of the individual network weights the contribution of each
network to the final ensemble prediction. The probabilities Pj0 of each class using weighted
ensemble can be derived as in Eq. 2.
 Pm
 k=1 Wk Pjk
 Pj0 = P m , ∀j = 1, 2., (2)
 k=1 Wk

where Wk denotes the weighted value of each CN Nk , ∀k ∈ N = 5. We have used four
evaluation score, such as accuracy, AUC, F1-score, and Cohen’s Kappa, as weighted values
denoted as Wkacc , Wkauc , Wkf 1 , and Wkkappa , respectively. The term m
 P
 k=1 Wk normalizes the

Pj0 to ensure that Pj0 ∈ [0, 1], ∀j = 1, 2 and nj=1 Pj0 = 1.
 P

2.2. Training Policy
 We employ the adamax optimizer [42] with an initial learning rate of 0.0002 to train all
five different CNN models. The values of β1 and β2 are set to 0.9 and 0.999, respectively.
Sometimes, monotonic reduction of learning rate can lead a model to stuck in either local
minima or saddle points. A cyclic learning rate policy [68] is used for cycling the learning
rate between two boundaries, such as 0.0000001 and 0.002. The “triangular2” policy shown
in Fig. 3 is applied, and the step size is set to StepSize = 6 × IterP erEpoch, where
IterP erEpoch denotes the number of iterations per epoch. Categorical cross-entropy is
employed as a loss function, and accuracy is chosen as the metric to train our models.
 14
Max LR

 1Τ Max LR
 2

 1Τ Max LR
 4
 1Τ Max LR
 8

 Base LR

 Step Size Cycle

Figure 3: Illustration of a triangular2 type cyclic learning rate scheduler, where Base LR and Max LR are
the minimum and maximum learning rate boundaries. After every cycle, the maximum learning rate is
bound in half of it.

2.3. Hardware and Evaluation

 Our proposed system is executed with the python programming language with various
python and Keras APIs. The examinations are carried on a windows-10 machine with the
following hardware configurations: Intel® Core™ i7-9750H CPU @ 2.60 GHz processor
with Installed memory (RAM): 16GB and NVIDIA® GeForce® GTX 1660 Ti GPU with
6 GB GDDR6 memory. We have utilized Weighted Precision (WP), Weighted Recall (WR),
F1-score (FS), Weighted FS (WFS), Balanced Accuracy (BA), and Area Under the Curve
(AUC) to evaluate the overall performance of our ALL & Hem classifier. The following
mathematical formulations describe the corresponding metric.

 prcision × recall
 FS = 2 ×
 prcision + recall

 specif icity + recall
 BA =
 2

 P1
 i=0 n(ci )F S(ci )
 WFS = ,
 N
where F S(ci ) is the F1-score of ith class, n(ci ) is the number of test images in ith class, and
N is the total number of unseen test images.

 15
3. Results and Discussion

 This section demonstrates and interprets the obtained results from comprehensive ex-
periments. Firstly, we explain the effect of input resolutions, such as original (450 × 450)
vs. center cropping (300 × 300), on the training of different CNN architectures, as enlisted
and described in Section 2.1.3, applying various image pre-processing techniques, such as
random oversampling and image augmentation. Secondly, we have aggregated the outputs
of five different CNN models to enhance the ALL classification performance in terms of
various evaluation metrics (see in Section 2.3). In the end, we compare our obtained results
with several recent results for the same dataset and task.
 The sample images have been center-cropped using the nearest neighbor interpolation
technique to eliminate the black border regions and provide a better area of interest, as pic-
torially illustrated in Fig. 4. Such a center-cropping to the size of 300×300 pixels reduces the
surrounded black background without distorting the original texture, shape, and other pieces
of information (see in Fig. 4). Table 4 manifests the ALL classification results for these two

 (a) (b) (c) (d)

 (e) (f) (g) (h)

Figure 4: The demonstration of center-cropping of several sample images displaying no distortion of the
region of interest, where (a)-(d) represents the original images with the sizes of 450 × 450 pixels, and (e)-(h)
depicts the center-cropped images with the dimensions of 300 × 300 pixels.

 16
different input resolutions from various classifiers, incorporating random oversampling and
image augmentations. In both the cases of input resolutions (see in Table 4), it is noteworthy
that the Xception model provides better results for the ALL classification. However, such a
highest classification result from the Xception model is expected as it has maximum accuracy
(Top-1 79.0 %) among all the available pre-trained models. Table 4 demonstrates that the
Xception model inputted with the sizes of 300 × 300 pixels has outperformed the other indi-
vidual CNN models, such as VGG-16, MobileNet, InceptionResNet-V2, and DenseNet-121,
outputting 86.0 %-WFS, 85.9 %-BA, and 93.9 %-AUC. Those metrics beat the second-best
metrics with the margins of 1.7 %, 1.1 %, 1.2 %, 1.1 %, 2.6 %, and 1.8 % concerning the WP,
WR, WFS, ACC, BA, and AUC, respectively. The experimental results (from the first ten
rows in Table 4) also confirm that all the individual CNN model enhances their respective
performance, while the center-cropped images are utilized as an input. The ROC curves in
Fig. 5 also reveals the benefits of the center-cropping (as 300 × 300), providing the higher
AUCs for all the single CNN models than the original input image (as 450 × 450). Since the
center-cropped images supply a better region of interest about the microscopic cell images
to the networks, it empowers the CNN models to learn the most discriminating attributes,
as it is experimentally validated in Table 4.

 (a) (b)

Figure 5: The ROC curves of five different CNN models and different proposed ensemble models, where (a)
for the raw input image having the size of 450 × 450 and (b) for the center-cropped input image with the
size of 300 × 300.

 17
Table 4: Experimental classification results on a preliminary test set representing two input image sizes
of 450 × 450 and 300 × 300. The best results from each type, such as the individual CNN model and the
ensemble CNN model, are depicted in bold font, whereas the second-best results are underlined for those
two types.

 Classifier WP WR WFS ACC BA AUC
 VGG-16 0.775 0.779 0.776 0.779 0.744 0.825
 Original Images

 Xception 0.848 0.848 0.848 0.848 0.833 0.921
 Individual CNN models

 MobileNet 0.837 0.830 0.820 0.830 0.774 0.898
 InceptionResNet-V2 0.784 0.784 0.772 0.784 0.722 0.844
 DenseNet-121 0.816 0.818 0.815 0.818 0.784 0.891
 VGG-16 0.843 0.844 0.843 0.844 0.825 0.898
 Center-cropped

 Xception 0.865 0.859 0.860 0.859 0.859 0.939
 MobileNet 0.835 0.837 0.835 0.837 0.812 0.894
 InceptionResNet-V2 0.848 0.848 0.843 0.848 0.809 0.909
 DenseNet-121 0.827 0.829 0.826 0.829 0.795 0.884
 SAP 0.859 0.858 0.854 0.858 0.820 0.925
 Original images
 Our proposed ensemble models

 W EN acc 0.861 0.860 0.855 0.860 0.822 0.925
 W EN auc 0.861 0.860 0.856 0.860 0.823 0.925
 W EN f 1 0.860 0.859 0.854 0.859 0.820 0.925
 kappa
 W EN 0.863 0.862 0.858 0.862 0.826 0.926
 SAP 0.886 0.886 0.884 0.886 0.859 0.940
 Center-cropped

 acc
 W EN 0.886 0.886 0.884 0.886 0.859 0.940
 W EN auc 0.885 0.885 0.883 0.885 0.856 0.941
 f1
 W EN 0.886 0.886 0.884 0.886 0.859 0.940
 W EN kappa 0.887 0.888 0.886 0.888 0.862 0.941

 The ALL detection results have been further enhanced by proposing a weighted ensemble
of those individual CNN models (see details in Section 2.1.3), where the weights of the WEN
are estimated from the particular model’s performances, such as accuracy (acc), auc, F1-
score (f1), and kappa value (kappa). The WEN models applying those weights are named as
W EN acc , W EN auc , W EN f 1 , and W EN kappa , respectively. Four different WENs are aimed
to accomplish the complete ablation studies. Table 4 demonstrates the complete results of

 18
the proposed WEN and SAP to find the efficacy of WEN over the SAP techniques. The
last ten rows of Table 4 tell that the SAP and WEN methods exceed the former individual
models comparing the same input types for single and ensemble models. Taking the original
image of 450 × 450 pixels, it is seen from Table 4 that the highest Xception’s results in
a single model are behind the ensemble results. The SAP and WEN results outperform
Xception’s results with some margins for the same inputted images. Similar superiority of
the SAP and WEN are noticed for the center-cropped inputs having the sizes of 300 × 300.
Again, it is noteworthy that the WEN methods perform better than the SAP method,
comparing to all the ensemble models in Table 4. It is also observed that kappa value-
based ensemble model (W EN kappa ) with center-cropped input has 88.7 %-WP, 88.8 %-WR,
88.6 %-WFS, 88.8 %-ACC, 86.2 %-BA, and 94.1 %-AUC, which outperforms all the other
proposed ensemble models. Although the W EN auc method gains the same AUC (94.1 %) as
in W EN kappa method for the center-cropped image, the latter method exceeds the former
process in terms of other metrics (see in Table 4). For the same input resolution of 300 × 300
pixels, the best performing W EN kappa model beats the single Xception model by the margins
of 2.2 %, 2.9 %, 2.6 %, 2.9 %, 0.3 %, and 0.2 % concerning the WP, WR, WFS, ACC, BA, and
AUC, respectively. The W EN kappa model, inputted with 300 × 300 pixels, also outperforms
the W EN kappa model, inputted with 450 × 450 pixels by the margins of 2.4 %, 2.6 %, 2.8 %,
2.6 %, 2.9 %, and 1.5 % concerning the same metrics (serially).
 Further investigation on the obtained results for two different input resolutions and
various proposed and developed models are displayed in Fig. 5, conferring the ROC curves
and their corresponding AUC values. Both the figures in Fig. 5 point that all the pre-trained
single models perform better when they are fine-tuned with center-cropped images with the
resolution of 300 × 300. The pre-trained VGG-16, Xception, MobileNet, InceptionResNet-
V2, and DenseNet-121 networks outperform themself by the margins of 7.3 %, 1.8 %, −0.4 %,
6.5 %, and −0.7 % concerning the AUC values, when trained with center-cropped 300 × 300
pixels. Although the center-cropped defeats with the low margins in two cases, it wins in the
other three cases with the greater margins. However, the proposed ensemble models’ ROC
curves confirm that they better the individual CNN model, whatever the input resolutions,
 19
either center-cropped or not. In both the cases of input resolutions, the proposed W EN kappa
beats all the remaining models, providing the best ROC curve with the maximum AUC value.
In the end, the proposed W EN kappa model has outputted the best ALL categorization results
when inputted with the 300 × 300 pixels (center-cropped), as experimentally verified in the
ROC curves in Fig. 5.
 The detailed class-wise performances of ALL classification by the two best-performing
classifiers with the center-cropped inputs, such as Xception from individual CNN and kappa-
based weighted ensemble (W EN kappa ) from the proposed fusion models, are exhibited in
Table 5 (left) and Table 5 (right), respectively.

Table 5: The confusion matrix with 1867 unseen test samples (1219-ALL and 648-Hem samples) with the
resolutions of 300 × 300 pixels, where the left table is for individual model (Xception) and the right table is
for the proposed W EN kappa model.

 Predicted Predicted
 Hem ALL Hem ALL
 557 91 502 146
 Hem Hem
 85.96% 14.04% 77.47% 22.53%
 Actual

 Actual

 173 1046 64 1155
 ALL ALL
 14.19% 85.81% 5.25% 94.75%

 Table 5 (left) depicts that out of 648-Hem samples, 85.96 % (557) images are correctly
recognized, whereas 14.04 % (91)-Hem samples are recognized as ALL type (false positive). It
also discloses that, 85.81 % (1046)-ALL samples are rightly classified, whereas only 14.19 %
(173) samples are improperly classified as Hem type (false negative). Contrastingly, the
confusion matrix of the W EN kappa model (see in Table 5 (right)) notes that the proposed
ensemble method essentially improves the true-positive rates by a margin of 8.94 %, with
only 64 (5.25 %)-ALL samples are improperly recognized as Hem (false negative). The dis-
cussion on the confusion matrix tells that the true-positive rate and true-negative rate are
similar in the single Xception model. In contrast, those two crucial metrics in the medical
diagnostic application are essentially improved by a margin of 8.94 %, while we employ the
 20
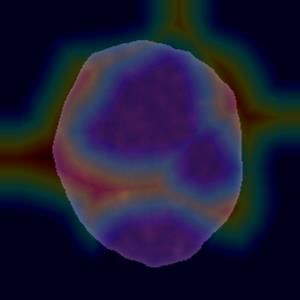
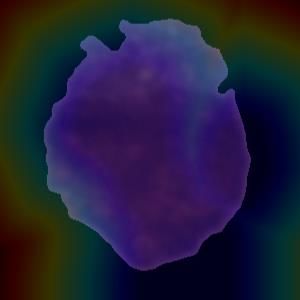
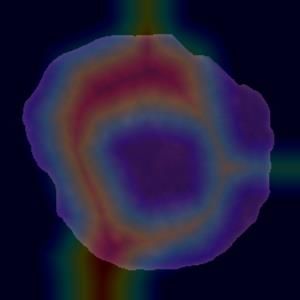
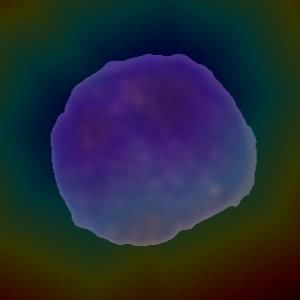
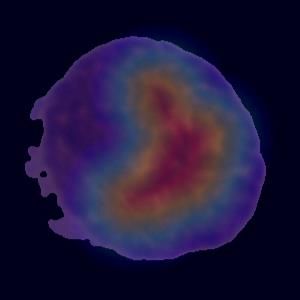
proposed W EN kappa model. The obtained results tell that out of a total of 1867 samples (
648-Hem and 1219-ALL samples), the VGG-16, Xception, MobileNet, InceptionResNet-V2,
and DenseNet-121 have recognized 495 (76.4 %), 557 (86.0 %), 473 (73.0 %), 442 (68.2 %), and
442 (68.2 %) samples as the Hem class correctly, respectively. Those values are 1080 (88.6 %),
1046 (85.8 %), 1089 (89.3 %), 1141 (93.6 %), and 1106 (90.7 %) for the ALL class, respec-
tively. Those categorization results from the proposed W EN kappa model are 502 (77.5 %)
and 1155 (94.8 %) for the Hem and ALL-classes, showing the lowest false-negative rate of
5.25 % (type-II error).
 For the qualitative assessment of the contribution, we present several examples of Hem
and ALL samples in Fig. 6 and Fig. 7, respectively, with the class activation map overlaying
(Grad-CAM), where for each instance, one of the single CNN models fails to classify. Still,
our proposed best-performing W EN kappa model is capable of categorizing it. The quali-
tative results in Fig. 6 and Fig. 7 expose that any single CNN may miss to recognize the
target class in some examples. Still, the ensemble model successfully detects those cases,
as it takes the benefits from all the candidate models to provide a final decision. It is also
visible from those two figures that the Grad-CAM in the single model is coarse in most of
the cases for most of the models. However, the Grad-CAM obtained from the proposed
W EN kappa has concentrated regions in the images. For more qualitative evaluation of those
concentrated Grad-CAM, additional images of the ALL class from all the single models and
our W EN kappa are displayed in Fig. 8. However, the close inspection of all the classification
results, as discussed above, concludes the superiority of the weighted ensemble techniques
over the single CNN models. Such supremacy of the ensemble of methods for the same task
is also proven in the earlier articles [10, 41, 50, 66] but employing a different approach with
the lower outcomes.
 Fig. 9 demonstrates the comparison of our proposed best performing W EN kappa method
and other published methods on the same task and dataset, where we have shown the WFS
for all the techniques. It is observed from Fig. 9 that our proposed model outperforms the
second-best [85] with a lower margin, but it exceeds the third-best [54] with a more significant
margin of 1.14 %. It is also noteworthy that our method beats the recent technique of Khan
 21
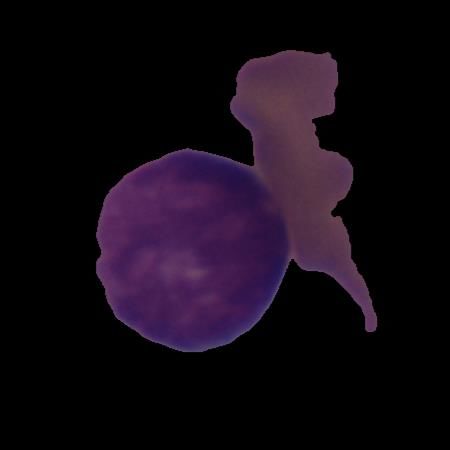
Query image Xception VGG-16 InceptionResNet DenseNet-121 MobileNet Our ensembling

Figure 6: The visualization of gradient class activation maps (Grad-CAM) of the Hem class from different
CNN architectures and our proposed weighted ensemble model (W EN kappa ). The Xepception, VGG-16,
InceptionResNet-V2, DenseNet-121, and MobileNet fail to detect the target class, respectively, for the
example in the first to fifth rows. In contrast, the proposed W EN kappa successfully identifies the target
class in all the example cases.

and Choo [41] with a very significant margin of 6.9 %.

4. Conclusion

 This article proposed and developed an automated CNN-based acute lymphoblastic
leukemia detection framework for the early diagnosis, combining center-cropping, image aug-
mentations, and class rebalancing. It was experimentally certified that the center-cropped
images rather than the whole images contribute higher salient and discriminative features
from the CNNs, leading to increased ALL detection. The ensemble model for the image
 22
Query image Xception VGG-16 InceptionResNet DenseNet-121 MobileNet Our ensembling

Figure 7: The visualization of gradient class activation maps (Grad-CAM) of the ALL class from different
CNN architectures and our proposed weighted ensemble model (W EN kappa ). The Xepception, VGG-16,
InceptionResNet-V2, DenseNet-121, and MobileNet fail to detect the target class, respectively, for the
example in the first to fifth rows. In contrast, the proposed W EN kappa successfully identifies the target
class in all the example cases.

classification with the significantly fewer training sample numbers outperforms its single
candidate model. Furthermore, the weighting of the individual model in accordance with its
performance enhances the aggregation results in the ensemble model. Despite the promising
results of the microscopic cell image classification, it necessitates more improvement in the
results, especially for the Hem class. The adversarial network can be employed to generate
synthetic samples for overcoming the imbalance problems in the future. The future research
direction will also focus on investigating the effect of data imbalance and accounting for
the subject information fully, assuming that DL models can be adopted in more and more

 23
Query image Xception VGG-16 InceptionResNet DenseNet-121 MobileNet Our ensembling

Figure 8: The additional visualization results for the qualitative evaluation, showing the gradient class
activation maps of the ALL class from different CNN architectures and our proposed weighted ensemble
W EN kappa model.

situations of medical image interpretation.

Author Contributions

 C. Mondal: Methodology, Validation, Investigation, Data Curation, Writing- Original
Draft; M. K. Hasan: Conceptualization, Methodology, Software, Formal analysis, Writing-
Review & Editing, Supervision; M. T. Jawad: Investigation, Writing- Review & Editing;
A. Dutta: Investigation, Writing- Original Draft; M. R. Islam: Writing- Original Draft;
M. A. Awal: Methodology, Writing- Review & Editing; M. Ahmad: Supervision.

 24
88.54% 88.60%
 87.46% 87.02% 86.90% 86.74% 86.60%
 85.70%

 84.00%
 WFS

 81.70%

 Xie et al. Marzahl et Verma and Shi et al. Ding et al. Shah et al. Kulhalli et Liu and Khan and Our
 [84] al. [53] Singh [77] [65] [9] [64] al. [45] Long [49] Choo [40] Classifier
 WFS 88.54% 87.46% 87.02% 86.90% 86.74% 86.60% 85.70% 84.00% 81.70% 88.60%

Figure 9: The comparison of several ALL detection methods (our proposed and recently published) on the
same C-NMC dataset and the same task, showing the weighted F1-score (WFS).

Acknowledgements

 None. No funding to declare.

Conflict of Interest

 There is no conflict of interest to publish this article.

References

 [1] American Cancer Society, . About Acute Lymphocytic Leukemia (ALL). https://tinyurl.com/
 sbn9rut6 [Accessed: 17 October, 2020].
 [2] American Cancer Society,2018, . Acute lymphocytic leukemia detection and diagnosis. https:
 //tinyurl.com/3dayesuy [Accessed: 17 October, 2020].
 [3] Anwar, S., Alam, A., 2020. A convolutional neural network–based learning approach to acute lym-
 phoblastic leukaemia detection with automated feature extraction. Medical & Biological Engineering
 & Computing 58, 3113–3121.
 [4] Asiri, N., Hussain, M., Al Adel, F., Alzaidi, N., 2019. Deep learning based computer-aided diagnosis
 systems for diabetic retinopathy: A survey. Artificial intelligence in medicine 99, 101701.
 [5] Cancer.org, . Causes, risk factors, and prevention. https://tinyurl.com/3cxb36bp [Accessed: 20
 November, 2020].

 25
[6] Cancer.org, ACS, . Types of Cancer that Develop in Children. https://tinyurl.com/2pne2757 [Ac-
 cessed: 20 November, 2020].
 [7] Children Research Hospital,2018, . Acute Lymphoblastic Leukemia (ALL). https://tinyurl.com/
 4uhrzuk9.
 [8] Chollet, F., 2017. Xception: Deep learning with depthwise separable convolutions, in: Proceedings of
 the IEEE conference on computer vision and pattern recognition, pp. 1251–1258.
 [9] Deng, J., Dong, W., Socher, R., Li, L.J., Li, K., Fei-Fei, L., 2009. Imagenet: A large-scale hierarchical
 image database, in: 2009 IEEE conference on computer vision and pattern recognition, IEEE. pp.
 248–255.
[10] Ding, Y., Yang, Y., Cui, Y., 2019. Deep learning for classifying of white blood cancer, in: ISBI 2019
 C-NMC Challenge: Classification in Cancer Cell Imaging. Springer, pp. 33–41.
[11] Duggal, R., Gupta, A., Gupta, R., Mallick, P., 2017. Sd-layer: stain deconvolutional layer for
 cnns in medical microscopic imaging, in: International Conference on Medical Image Computing and
 Computer-Assisted Intervention, Springer. pp. 435–443.
[12] Dutta, A., Hasan, M.K., Ahmad, M., 2020. Skin lesion classification using convolutional neural network
 for melanoma recognition. medRxiv .
[13] Esteva, A., Kuprel, B., Novoa, R.A., Ko, J., Swetter, S.M., Blau, H.M., Thrun, S., 2017. Dermatologist-
 level classification of skin cancer with deep neural networks. nature 542, 115–118.
[14] Fathi, E., Rezaee, M.J., Tavakkoli-Moghaddam, R., Alizadeh, A., Montazer, A., 2020. Design of an
 integrated model for diagnosis and classification of pediatric acute leukemia using machine learning.
 Proceedings of the Institution of Mechanical Engineers, Part H: Journal of Engineering in Medicine
 234, 1051–1069.
[15] Furey, T.S., Cristianini, N., Duffy, N., Bednarski, D.W., Schummer, M., Haussler, D., 2000. Support
 vector machine classification and validation of cancer tissue samples using microarray expression data.
 Bioinformatics 16, 906–914.
[16] Gebremeskel, K.D., Kwa, T.C., Raj, K.H., Zewdie, G.A., Shenkute, T.Y., Maleko, W.A., 2021. Auto-
 matic early detection and classification of leukemia from microscopic blood image. Abyssinia Journal
 of Engineering and Computing 1, 1–10.
[17] Gehlot, S., Gupta, A., Gupta, R., 2020. Sdct-auxnetθ: Dct augmented stain deconvolutional cnn with
 auxiliary classifier for cancer diagnosis. Medical image analysis 61, 101661.
[18] Greenwell, B., Boehmke, B., Cunningham, J., Developers, G., 2019. gbm: Generalized boosted regres-
 sion models. R package version 2.
[19] Gupta, A., Gupta, R., Gehlot, S., Mourya, S., 2019. Classification of normal vs malignant cells in b-all
 white blood cancer microscopic images, in: IEEE International Symposium on Biomedical Imaging

 26
(ISBI)-2019 Challenges Internet.
[20] Harangi, B., 2018. Skin lesion classification with ensembles of deep convolutional neural networks.
 Journal of biomedical informatics 86, 25–32.
[21] Hasan, M., Ahamed, M., Ahmad, M., Rashid, M., et al., 2017. Prediction of epileptic seizure by
 analysing time series eeg signal using-nn classifier. Applied bionics and biomechanics 2017.
[22] Hasan, M., Jawad, M., Hasan, K.N.I., Partha, S.B., Masba, M., Al, M., et al., 2021a. Covid-19 identifi-
 cation from volumetric chest ct scans using a progressively resized 3d-cnn incorporating segmentation,
 augmentation, and class-rebalancing. arXiv:2102.06169 .
[23] Hasan, M., Roy, S., Mondal, C., Alam, M., Elahi, M., Toufick, E., Dutta, A., Raju, S., Ahmad, M.,
 et al., 2021b. Dermo-doctor: A web application for detection and recognition of the skin lesion using
 a deep convolutional neural network. arXiv:2102.01824 .
[24] Hasan, M.K., Alam, M.A., Dahal, L., Elahi, M.T.E., Roy, S., Wahid, S.R., Marti, R., Khanal, B.,
 2020a. Challenges of deep learning methods for covid-19 detection using public datasets. medRxiv .
[25] Hasan, M.K., Alam, M.A., Das, D., Hossain, E., Hasan, M., 2020b. Diabetes prediction using ensem-
 bling of different machine learning classifiers. IEEE Access 8, 76516–76531.
[26] Hasan, M.K., Alam, M.A., Elahi, M.T.E., Roy, S., Martı́, R., 2021c. Drnet: Segmentation and local-
 ization of optic disc and fovea from diabetic retinopathy image. Artificial Intelligence in Medicine 111,
 102001.
[27] Hasan, M.K., Aleef, T.A., Roy, S., 2020. Automatic mass classification in breast using transfer learning
 of deep convolutional neural network and support vector machine, in: 2020 IEEE Region 10 Symposium
 (TENSYMP), pp. 110–113.
[28] Hasan, M.K., Calvet, L., Rabbani, N., Bartoli, A., 2021d. Detection, segmentation, and 3d pose
 estimation of surgical tools using convolutional neural networks and algebraic geometry. Medical Image
 Analysis 70, 101994.
[29] Hasan, M.K., Dahal, L., Samarakoon, P.N., Tushar, F.I., Martı́, R., 2020. Dsnet: Automatic dermo-
 scopic skin lesion segmentation. Computers in Biology and Medicine 120, 103738.
[30] Hasan, M.K., Elahi, M.T.E., Alam, M.A., Jawad, M.T., 2021e. Dermoexpert: Skin lesion classification
 using a hybrid convolutional neural network through segmentation, transfer learning, and augmentation.
 medRxiv .
[31] He, K., Zhang, X., Ren, S., Sun, J., 2016. Deep residual learning for image recognition, in: Proceedings
 of the IEEE conference on computer vision and pattern recognition, pp. 770–778.
[32] Honnalgere, A., Nayak, G., 2019. Classification of normal versus malignant cells in b-all white blood
 cancer microscopic images, in: ISBI 2019 C-NMC Challenge: Classification in Cancer Cell Imaging.
 Springer, pp. 1–12.

 27
[33] Howard, A.G., Zhu, M., Chen, B., Kalenichenko, D., Wang, W., Weyand, T., Andreetto, M.,
 Adam, H., 2017. Mobilenets: Efficient convolutional neural networks for mobile vision applications.
 arXiv:1704.04861 .
[34] Hu, J., Shen, L., Sun, G., 2018. Squeeze-and-excitation networks, in: Proceedings of the IEEE confer-
 ence on computer vision and pattern recognition, pp. 7132–7141.
[35] Huang, G., Liu, Z., Van Der Maaten, L., Weinberger, K.Q., 2017. Densely connected convolutional
 networks, in: Proceedings of the IEEE conference on computer vision and pattern recognition, pp.
 4700–4708.
[36] Işın, A., Direkoğlu, C., Şah, M., 2016. Review of mri-based brain tumor image segmentation using deep
 learning methods. Procedia Computer Science 102, 317–324.
[37] Jacobs, R.A., 1995. Methods for combining experts’ probability assessments. Neural computation 7,
 867–888.
[38] Joshi, M.D., Karode, A.H., Suralkar, S., 2013. White blood cells segmentation and classification to
 detect acute leukemia. International Journal of Emerging Trends & Technology in Computer Science
 (IJETTCS) 2, 147–151.
[39] Kashef, A., Khatibi, T., Mehrvar, A., 2020. Treatment outcome classification of pediatric acute lym-
 phoblastic leukemia patients with clinical and medical data using machine learning: A case study at
 mahak hospital. Informatics in Medicine Unlocked 20, 100399.
[40] Kermany, D.S., Goldbaum, M., Cai, W., Valentim, C.C., Liang, H., Baxter, S.L., McKeown, A., Yang,
 G., Wu, X., Yan, F., et al., 2018. Identifying medical diagnoses and treatable diseases by image-based
 deep learning. Cell 172, 1122–1131.
[41] Khan, M.A., Choo, J., 2019. Classification of cancer microscopic images via convolutional neural
 networks, in: ISBI 2019 C-NMC Challenge: Classification in Cancer Cell Imaging. Springer, pp. 141–
 147.
[42] Kingma, D.P., Ba, J., 2014. Adam: A method for stochastic optimization. arXiv:1412.6980 .
[43] Kittler, J., Hatef, M., Duin, R.P., Matas, J., 1998. On combining classifiers. IEEE transactions on
 pattern analysis and machine intelligence 20, 226–239.
[44] Krizhevsky, A., Sutskever, I., Hinton, G.E., 2012. Imagenet classification with deep convolutional
 neural networks. Advances in neural information processing systems 25, 1097–1105.
[45] Kuhn, M., Weston, S., Coulter, N., Quinlan, R., 2014. C50: C5. 0 decision trees and rule-based models.
 R package version 0.1. 0-21, URL http://CRAN. R-project. org/package C 50.
[46] Kulhalli, R., Savadikar, C., Garware, B., 2019. Toward automated classification of b-acute lymphoblas-
 tic leukemia, in: ISBI 2019 C-NMC Challenge: Classification in Cancer Cell Imaging. Springer, pp.
 63–72.

 28
You can also read