Trade-Offs between Urban Green Space and Densification: Balancing Outdoor Thermal Comfort, Mobility, and Housing Demand - mediaTUM
←
→
Page content transcription
If your browser does not render page correctly, please read the page content below
Urban Planning (ISSN: 2183–7635)
                                                                                       2021, Volume 6, Issue 1, Pages 5–19
                                                                                              DOI: 10.17645/up.v6i1.3481

Article
Trade-Offs between Urban Green Space and Densification: Balancing
Outdoor Thermal Comfort, Mobility, and Housing Demand
Sabrina Erlwein * and Stephan Pauleit

Chair for Strategic Landscape Planning and Management, Technical University of Munich, 85354 Freising, Germany;
E-Mails: sabrina.erlwein@tum.de (S.E.), pauleit@tum.de (S.P.)

* Corresponding author

Submitted: 15 July 2020 | Accepted: 23 September 2020 | Published: 26 January 2021

Abstract
Urban green spaces reduce elevated urban temperature through evaporative cooling and shading and are thus promoted
as nature-based solutions to enhance urban climates. However, in growing cities, the supply of urban green space often
conflicts with increasing housing demand. This study investigates the interplay of densification and the availability of green
space and its impact on human heat stress in summer. For the case of an open-midrise (local climate zone 5) urban rede-
velopment site in Munich, eight densification scenarios were elaborated with city planners and evaluated by microscale
simulations in ENVI-met. The chosen scenarios consider varying building heights, different types of densification, amount
of vegetation and parking space regulations. The preservation of existing trees has the greatest impact on the physical
equivalent temperature (PET). Construction of underground car parking results in the removal of the tree population. Loss
of all the existing trees due to parking space consumption leads to an average daytime PET increase of 5°C compared to
the current situation. If the parking space requirement is halved, the increase in PET can be reduced to 1.3°C–1.7°C in
all scenarios. The addition of buildings leads to a higher gain in living space than the addition of floors, but night-time
thermal comfort is affected by poor ventilation if fresh air circulation is blocked. The protection of mature trees in urban
redevelopment strategies will become more relevant in the changing climate. Alternative mobility strategies could help to
reduce trade-offs between densification and urban greening.

Keywords
densification; ENVI-met simulations; green infrastructure; outdoor thermal comfort

Issue
This article is part of the issue “Urban Planning and Green Infrastructure” edited by Paul Osmond (University of New South
Wales, Australia) and Sara Wilkinson (University of Technology Sydney, Australia).

© 2021 by the authors; licensee Cogitatio (Lisbon, Portugal). This article is licensed under a Creative Commons Attribu-
tion 4.0 International License (CC BY).

1. Introduction                                                    Dense, foliated tree crowns reduce the transmissivity
                                                                   of direct solar radiation to 1%–5% (Konarska, Lindberg,
In the past decade, green and blue spaces in cities                Larsson, Thorsson, & Holmer, 2014), reducing daytime
have been promoted as no or low regret adaptation                  Ta by up to 3°C, the mean radiant temperature by up
measures to climate change (European Commission,                   to 37°C and the physical equivalent temperature (PET)
2016). Bodies of water and vegetated areas regulate                directly beneath the tree crown by up to 16°C (Lee,
air temperature (Ta ) and radiative heat load and thus             Mayer, & Kuttler, 2020). However, ongoing urbanisation
improve outdoor human thermal comfort through evap-                and population growth lead to high pressure on open
orative cooling and shading (Bowler, Buyung-Ali, Knight,           spaces in cities. Therefore, urban areas undergoing den-
& Pullin, 2010). Among these, trees are the most effec-            sification by the addition of buildings or the increase
tive in reducing incoming shortwave radiation (Erell,              in the size of existing buildings often exhibit a lack of
2017; Zölch, Maderspacher, Wamsler, & Pauleit, 2016).              urban green space (Haaland & van den Bosch, 2015).

Urban Planning, 2021, Volume 6, Issue 1, Pages 5–19                                                                         5
Reduced amounts of green space, an increase of imper-          solutions in a densely built-up area, Zölch et al. (2016)
vious surfaces, altered albedo and geometry are all con-       emphasised that the qualities of urban greening and the
tributing factors to the Urban Heat Island phenomena           placement of street trees have a decisive influence on
(Oke, 1982). Such infill development is likely to further      outdoor thermal comfort. The effects of densification on
increase urban heat load, exacerbating existing outdoor        existing vegetation were not investigated. In their review
heat stress (Emmanuel & Steemers, 2018).                       of challenges and strategies for densifying cities, Haaland
     Confronted with the need to meet the housing              and van den Bosch (2015) noted that there is a lack of
demand on one hand and the challenge to adapt cities to        studies that consider the interplay of urban infill and the
climate change on the other, city planners require infor-      qualities of the existing green space, as well as the plan-
mation about the effects of densification on urban micro-      ning advice to deal with both.
climate, green space availability and its ecosystem ser-           In reference to the microscale, the aim of this study
vices. The factors that influence urban climate and urban      is therefore to answer the following research ques-
heat have been studied from the city level (e.g., Akbari &     tions: i) How is urban green space (especially urban
Kolokotsa, 2016; Deilami, Kamruzzaman, & Liu, 2018) to         trees) affected by densification and what are the conse-
the neighbourhood scale (Pacifici, Marins, Catto, Rama,        quences for human heat stress? ii) How can the trade-
& Lamour, 2017) and single urban facets (e.g., Jamei           offs between densification and greening be effective-
& Rajagopalan, 2018; Lee et al., 2020). While climate          ly minimised? Based on an actual planning case in the
adaptation planning needs to adopt a multiscale perspec-       city of Munich (Germany), we compare different devel-
tive to address the Urban Heat Island as well as local         opment scenarios to quantify the effects of densifica-
thermal hotspots (Demuzere et al., 2014), the microcli-        tion on the existing green space and human heat stress.
matic level is the reference scale for outdoor human           In a first step, we derive key parameters for the develop-
thermal comfort investigations (Hirashima, Katzschner,         ment of realistic densification scenarios by planning in
Ferreira, Assis, & Katzschner, 2018; Mayer & Höppe,            exchange with city planners. Second, we create densifi-
1987). The urban layout and geometry, as well as abun-         cation scenarios that portray different planning options
dance of vegetation, are some of the most important            for the open midrise redevelopment area. Finally, micro-
parameters governing urban microclimate and outdoor            meteorological simulations (ENVI-met model) are car-
thermal comfort (Erell, Pearlmutter, & Williamson, 2011;       ried out to compare the densification alternatives with
Jamei, Rajagopalan, Seyedmahmoudian, & Jamei, 2016).           the current situation and to discuss the implications for
Altered aspect ratios and sky view factors affect the short-   urban planning.
and long-wave radiation as well as the wind speed (Erell
et al., 2011). For instance, higher aspect ratios due to       2. Study Area
taller buildings are likely to lead to lower daytime and
higher night-time air temperature (Jamei et al., 2016).        Munich, located in the south of Germany (48°8’N,
Wide E–W oriented streets are more prone to thermal            11°24’E, elevation 519 m a.s.l.), is one of the fastest-
discomfort than narrow and N–S oriented street canyons         growing cities in Germany and is expected to reach 1.85
due to longer times of solar exposure (Ali-Toudert &           million inhabitants by 2035 (Landeshauptstadt München,
Mayer, 2006); thus vegetation plays an important role,         2011). With an annual average Ta of 9.7°C and an average
especially for E–W oriented streets (Sanusi, Johnstone,        precipitation of 944 mm (reference period 1981–2010;
May, & Livesley, 2016).                                        German Meteorological Service, 2018), Munich’s climate
     Differing from these studies that concentrate on sin-     corresponds to the Cfb category of the Köppen-Geiger
gle urban street canyons, other investigations have com-       classification. The characteristics of the city’s climate
pared city quarters with different amounts of vegeta-          include warm summers, an absence of dry seasons
tion, built area coverages and building heights (Yahia,        and highest precipitation rates during the summertime
Johansson, Thorsson, Lindberg, & Rasmussen, 2018) or           (Mühlbacher, Koßmann, Sedlmaier, & Winderlich, 2020).
have altered these characteristics for a specific setting           While housing demand in Munich is high (accord-
to study their micrometeorological impacts (Perini &           ing to an estimate, there is an annual requirement for
Magliocco, 2014). Yahia et al. (2018) found the strongest      the building of 8,500 flats per year; Landeshauptstadt
relationship (R2 0.97) to be between sky view factor and       München, 2011), the potential for the development of
PET at 2 pm, and shading to be more important than ven-        new residential areas outside the city and through the
tilation. Simultaneously increasing the building height        conversion of disused land has become scarce. One
and the green coverage provided the best thermal com-          of the city’s strategies for dealing with this scarcity is
fort for pedestrians (Lee et al., 2020; Perini & Magliocco,    “qualified densification” in the stock (Landeshauptstadt
2014). In this regard, increasing building height is pre-      München, 2011). This is especially the case with housing
ferred over increasing built area coverage (Emmanuel &         estates from the 1950s to the 1980s, which account for a
Steemers, 2018); however, in these studies green cover-        quarter of all residential areas in Munich and offer great
age was rather treated as a quantitative parameter with        potential for gaining new residential space. The urban
disregard of the impact of densification on the qualities      redevelopment area in Munich’s city district, Moosach,
of the existing vegetation. Investigating nature-based         is characterised by free-standing multistorey blocks from

Urban Planning, 2021, Volume 6, Issue 1, Pages 5–19                                                                     6
the 1950s. Free-standing multistorey blocks have a high          tion. To do so, a profound mobility concept has to be pro-
potential for densification due to the presence of gener-        vided, in which required criteria and alternative mobility
ous green spaces and, often, uniform ownership struc-            solutions have to be stated. Reductions below a 0.8 ratio
tures, that simplify planning and communication process-         require extensive compensation measures, while 0.3 rep-
es. Furthermore these multistorey blocks represent one           resents the maximum reduction ratio (Landeshauptstadt
of the most common building types in Munich (Pauleit             München, 2020).
& Duhme, 2000) and, more generally, in German cities
(Zentrum für Stadtnatur und Klimaanpassung, 2017). The           3. Methodology
study area comprises 10-row buildings with pitched roofs
of 14 m in height (four floors including the attic floor;        3.1. Development of Densification Scenarios
Figure 1). There are large green spaces between the
building rows—some with a high tree cover, some rather           To gain insights in current planning policy into Munich
open—that result in a vegetation cover of 50%. Thus,             and to derive realistic densification scenarios, we inves-
the area can be characterised as local climate zone 5            tigated all the local plans that have come into force
(open midrise). Local climate zones represent univer-            in recent years (1 January 2014–28 March 2019). Local
sal climate-based classifications of urban and rural sites       plans are legally binding planning instruments that con-
that share similar characteristics regarding surface cover,      cretise the possible use of a certain area and provide
building structure, materials and human activity (Stewart        guidelines for possible structural development. Since
& Oke, 2012).                                                    inner-city development and residential areas were partic-
     A particular challenge for developing green and             ularly of interest for this study, we excluded all the local
dense city quarters in Munich lies in providing sufficient       plans relating to outdoor, special and industrial areas
car parking space. According to Bavarian planning regu-          from further analysis (25 out of 60 plans). The remain-
lations, one parking space has to be provided for each           ing 35 plans were categorised regarding their location,
residential unit (Art. 47 BayBO). Based on a resolution          type of development, permissible floor space and floor
by the City Council of Munich, this ratio can be reduced         area, building height, planned residential units and plan
when access to public transport and local amenities is suf-      layouts. Of further interest were the regulations dealing
ficient or in the case of subsidised residential construc-       with parking space and green space provision.

Figure 1. Spatial assignment of investigation area. Location of the city district Moosach within Munich (a); map of the
study site’s wider neighbourhood (b); aerial image of the study site (c); row buildings and the middle street in the study
site (d). Source: Sabrina Erlwein (with basic geographical data provided by the Bavarian State Office for Survey and
Geoinformation 2018).

Urban Planning, 2021, Volume 6, Issue 1, Pages 5–19                                                                        7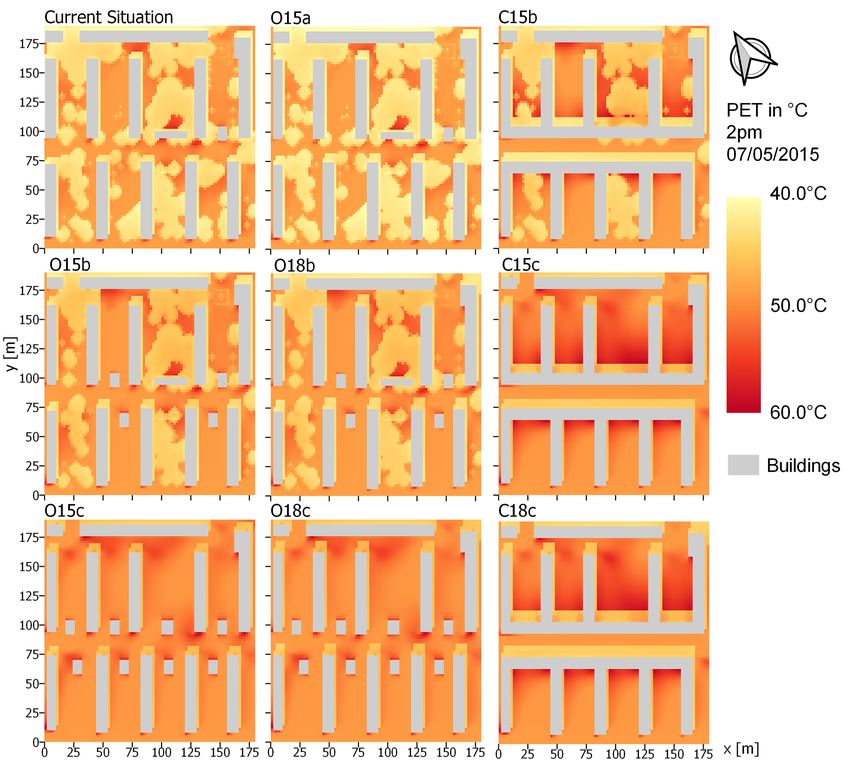
Although most of the areas were well connected to            tion, the last two were used to discuss and refine the
transport nodes and thus qualified for a parking space           developed densification scenarios.
reduction, the ratio of parking spaces per residential unit          The scenarios are distinct by i) type of densifica-
was reduced from 1 to 0.6 only in three out of 35 local          tion, ii) building height and iii) number of underground
plans. Moreover, in 91.5% of the plans analysed, the             car parks (Figure 2). The category ‘type of densification’
required parking spaces had to be provided by under-             distinguishes between the addition of floors, in which
ground car parks. The areas designated for underground           the buildings’ free-standing form is retained (O = open
parking usually extended over the entire green space             blocks), and the addition of buildings, whereby the exist-
between the buildings. Therefore, parking space provi-           ing buildings are closed alongside the road (C = closed
sion was identified as one key parameter affecting green         rows). The building height varies between one and two
space provision.                                                 additional floors (in total 15/18 m). Furthermore, we var-
    Additionally, four workshops were held with city plan-       ied the number of underground car parks (a = 1, b = 4,
ners involved in the redevelopment of the study area             c = 8) to reflect the different parking space policies. For
(24 June, 25 July, 10 October, 16 December 2019). The            instance, the additional housing units gained by adding
participants included personnel from the Department of           one floor (Table 1) could be supplied by the existing
Urban Planning and Building Regulations (overall project         underground car park (a), if the parking space key was
management and green planning) and the Department                reduced to 0.3. If the current regulation was applied or if
of Health and Environment (climate change mitigation             the ratio was even increased, four (b) or more (c) under-
and adaptation). While the first two meetings focussed           ground car parks would be necessary. The construction
on planning challenges and goals for the development             of underground car parks causes the removal of exist-
area and identification of key parameters for densifica-         ing trees from the designated areas. In case b (four

Figure 2. Scheme for all densification scenarios with basic categories of densification type, building height and mobility
solution; locations of underground car parks are marked with dashed lines. Source: Sabrina Erlwein.

Urban Planning, 2021, Volume 6, Issue 1, Pages 5–19                                                                       8
Table 1. Overview of the basic parameters of the densification scenarios.
                       Built             Floor area            Building           Number              Number               Underground
Scenario              surface               ratio               height            of trees            of flats*              parking
Status Quo             24.1%                 0.8               13 m**                158                376                    1
O15a                   24.1%                 1.3               15 m                  158                427                    1
O15b                   24.1%                 1.3               15 m                  102                427                    4
O15c                   24.1%                 1.3               15 m                    0                427                    8
C15b                   31.1%                 1.7               15 m                   84                552                    4
C15c                   31.1%                 1.7               15 m                    0                552                    8
O18b                   24.1%                 1.6               18 m                  102                512                    4
O18c                   24.1%                 1.6               18 m                    0                512                    8
C18c                   31.1%                 2.5               18 m                    0                663                    8
Notes: * = Calculation of flats: Current status 46,5 m2 per flat, after redevelopment 67,5 m2 per flat; ** = Saddle roof

underground car parks), the underground car parks were                    Höppe, 1987), constitutes one of the recommended ther-
preferably assigned to lawns with a few trees to preserve                 mal comfort indices for human bio-meteorological inves-
as many trees as possible.                                                tigations (Staiger, Laschewski, & Matzarakis, 2019), and is
    Further modification of supply of greenery included                   frequently used and thus further developed (Hirashima
the removal of all the trees that were closer than 4 m                    et al., 2018). In a recent calibration for the German cities
to the buildings since they would not survive the con-                    Kassel and Freiburg, PET values above 35°C were per-
struction works. The name of the scenario indicates the                   ceived as hot and PET values above 38°C as very hot
parameters used (e.g., O15b = open rows, 15 m height                      (Hirashima et al., 2018), while Holst and Mayer (2010)
and four underground car parks). Since the chosen sce-                    suggest a PET transition value of 35°C toward warm
narios reflect planning scenarios, not all twelve conceiv-                and 40°C toward hot based on investigations in Freiburg.
able combinations were simulated but only those that                      Recently, Zölch, Rahman, Pfleiderer, Wagner, and Pauleit
could occur in reality. For instance, in the case of the                  (2019) evaluated the model performance of ENVI-met
most extreme densification (C18), parking demand trig-                    for Munich and found an underestimation of Ta dur-
gered by new flats would be too high to be covered                        ing the evening hours of 1.0–1.5 K. However, the over-
by just four underground car parks, thus only scenario                    all model performance was found to be satisfactory
C18c was simulated. To calculate the number of new                        (R2 of 0.94). Therefore ENVI-met is regarded as a suitable
apartments for each scenario, we used actual data from                    micrometeorological investigation tool for this study.
the housing association. After the renovation, the living
space per residential unit would increase from the cur-                   3.3. Model Configuration and Meteorological Input Data
rent 46.5 to 67.5 m2 .
                                                                          The required meteorological data for the ENVI-met sim-
3.2. Urban Micrometeorological Simulation Model                           ulation were extracted from the weather station of the
ENVI-Met                                                                  German Meteorological Service, City-Station ID 3379,
                                                                          located approximately 2.8 km from the study area. The
All simulations in this study were performed with the                     weather data for the past 10 years were analysed to
three dimensional microscale model ENVI-met (Bruse                        select two running days (4 and 5 of July 2015) that repre-
& Fleer, 1998; Simon, 2016), version 4.4.3. ENVI-met                      sentes typical hot days. Hot days are characterised by day-
is one of the most widely used simulation tools, being                    time maximum Ta above 30°C and a nightly Ta not below
successfully applied in various contexts and geographi-                   20°C, with clear skies and low wind speed (up to 2 m/s;
cal zones for micrometeorological investigations (Tsoka,                  Mühlbacher et al., 2020). This focus was chosen as the
Tsikaloudaki, & Theodosiou, 2018). ENVI-met considers                     number and intensity of hot days is likely to increase due
complex interactions of building structures, atmosphere,                  to climate change (Mühlbacher et al., 2020). Heat stress
soil and vegetation processes (Simon et al., 2018), with                  negatively affects human health leading to a lack of con-
a typical resolution of 0.5–10 m in space and up to 2 s                   centration, exhaustion, dehydration, heat stroke, hyper-
in time. Numerous studies have assessed the model’s                       thermia and eventually death (Ward Thompson, Lauf,
accuracy and have testified it to be well suited to out-                  Kleinschmit, & Endlicher, 2016). ENVI-met version 4.4.3
door comfort investigations, especially during daytime                    allows full forcing of wind speed and wind direction.
(Acero & Arrizabalaga, 2018; Lee, Mayer, & Chen, 2016).                   However, if the wind direction changes too fast, the simu-
The ENVI-met application BIOMET allows the calculation                    lation is aborted. Thus, the most common wind direction
of several thermal comfort indices, such as Universal                     for each hour during summertime was statistically identi-
Thermal Comfort Index and PET. The PET was chosen for                     fied based on the German Meteorological Service weath-
this study as it is adapted for outdoor settings (Mayer &                 er station data (1985–2018) and used as model input.

Urban Planning, 2021, Volume 6, Issue 1, Pages 5–19                                                                                  9
A figure presenting all the meteorological input variables           for each tree to sort it into either spherical or cylindrical
can be found in S1 of the Supplementary File.                        crown form. However, all the small trees were grouped
    The chosen horizontal and vertical resolution of                 into one category since differences among their crown
2 × 2 m represents a compromise between sufficient geo-              shapes were small. ENVI-met uses the leaf area density
metric detail and sufficient computational speed (Zölch              (LAD) to define the foliage density. The LAD values of pre-
et al., 2016). For higher accuracy of surface interactions,          defined species in ENVI-met’s tree manager Albero range
the lowest vertical cell was further divided into five sub-          from 0.4 (populus alba) to 2.0 (e.g., acer platanoides). For
boxes. The grid was rotated 32° from the north to rectify            new tree configurations, Albero offers LAD 0.3 m2 /m3
the building structure. The building heights and dimen-              and LAD 1.1 m2 /m3 as standard values. Since foliage
sions were derived from the GIS-Data provided by the                 density also varies within species due to the growing
City of Munich. The pavement and building materials                  season and the tree’s age (Rahman, Stratopoulos et al.,
were identified by visits to the site (for configuration             2020), which complicates representation by categories
details see Table 2).                                                and tree parametrisation not being the aim of this study,
    Recent tree inspection data (including tree species,             the medium LAD of 1.1 m2 /m3 was chosen for all tree
tree height and crown dimensions) from the municipal                 categories. The final five tree categories including their
company were available for most of the study area. The               parameters are presented in Table 3.
data were supplemented by on-the-spot visits to include                  Simulations were launched at 6 am for a total mod-
missing trees and to identify unclear tree locations. Out            el time of 48 hours (Table 2). We excluded the first
of 158 trees, 27 different tree species were identified in           24 hours from the analysis to overcome initial transient
the study area and were sorted into five different cate-             conditions. Simulation outcomes were analysed for the
gories for the sake of simplification. As the main cool-             hottest (2 pm) and coolest hour (4 am), to detect possible
ing effect of trees is attributed to shading (Erell et al.,          trade-offs between daytime and night-time at a pedestri-
2011), the focus was set on tree characteristics that influ-         an level of 1.4 m height (approximating to the human-
ence the reduction of radiation load, namely tree height,            biometeorological reference height; Mayer & Höppe,
canopy shape and foliage density (Rahman, Stratopoulos               1987). In addition, we computed and mapped the aver-
et al., 2020). Based on the inspection data and on defini-           ages from 10 am to 4 pm to better depict the design
tions of the City of Munich from local plans, we defined             parameters’ influence on the shadow cast during the day
three different tree heights (small = 6 m, medium = 15 m,            (Holst & Mayer, 2011). Compared to an analysis of just
large = 22 m), into which the existing trees were classi-            one point in time, this makes it possible to derive more
fied. The crown height to diameter ratio was calculated              robust design implications (Lee et al., 2016).

Table 2. ENVI-met model setup and meteorological input data.
Start of simulation                                            4 July 2015, 6 am
Duration of simulations                                        48 h
Modell grid size/resolution                                    90 × 95 × 25/2 × 2 m
Building materials                                             Brick (wall), tile (roof)
Wind speed (10 m above ground)                                 0.7 m-s–2.0 m/s
Wind direction                                                 240°–310°
Max/min Ta                                                     35.4°C/21.7°C
Cloud cover                                                    cloud-free
Lateral boundary conditions                                    Full forcing
Initial soil temperature                                       Upper layer (0–0.2 m): 23.85°C, middle layer (−0.5 m): 23.9°C,
                                                               deep layer (−2 m): 19.9°C
Relative soil humidity                                         Upper layer: 50%; middle and deep layer: 60%

Table 3. Tree categories used in the ENVI-met simulation (base case).
Category                 Size                             Height                 Diameter               LAD                Count
   K1                    Small (all forms)                  6m                       5m                 1.1                 44
   K2                    Medium, spherical                 15 m                     11 m                1.1                 19
   K3                    Medium, cylindrical               15 m                      9m                 1.1                 50
   K4                    Large, spherical                  22 m                     17 m                1.1                 12
   K5                    Large, cylindrical                22 m                     11 m                1.1                 34

Urban Planning, 2021, Volume 6, Issue 1, Pages 5–19                                                                            10
4. Results additional shadow cast from the elevated buildings fur-
ther reduced the short-wave radiation densities and thus
4.1. Comparison of Day-Time Thermal Comfort for the improved the thermal comfort compared to the base
Current Situation and Densification Scenarios case. The impact of additional underground car parks
becomes visible in the remaining scenarios: The higher
Simulation results for the current situation reveal over- the number of removed trees, the greater the penetra-
all very hot thermal conditions for pedestrians at 2 pm tion of solar radiation and the higher the median PET
(Figure 3). Nearly 100% of the study area experi- (Figure 4a). Remarkably, at noon the median difference
ences extreme heat stress (PET mean value of 46.9°C). between 100% trees and 65%–53 % trees is larger than
The coolest locations were found in the shadows of that between the latter and zero trees (PET median differ-
trees and buildings (PET 41°C–43°C), whereas the ther- ence of 2.0°C–2.1°C compared to 0.5°C–0.6°C). However,
mal hotspots were found in front of the sun-facing while in scenarios with 65%–53% trees, 75 % of all loca-
façades (SE orientation) and the poorly ventilated areas tions were cooler than 50°C (PET), nearly half of the
(PET 55°C–56.6°C). This pattern was mainly attributed study area in the tree-less scenarios was hotter than 50°C
to the impact of solar radiation as expressed by the (PET; Figure 3, Figure 4). The variety of cooler and hotter
mean radiant temperature. On cloudless summer days, grid cells is higher in scenarios with trees (PET interquar-
the mean radiant temperature is the dominating factor tile range of 5.9°C–5.4°C to 3.2°C–1.3°C) but also in sce-
for outdoor human thermal comfort in Central Europe narios with a more closed building arrangement com-
(Ali-Toudert & Mayer, 2007; Holst & Mayer, 2011; Lee pared to the default arrangement of free-standing blocks.
& Mayer, 2018). All densification scenarios except for Building heights have only a marginal impact on noon
scenario O15a, were, on average, hotter than the base simulation outcomes.
case. In scenario O15a, the buildings were raised by one The closure of the building rows has two opposing
storey, but the existing vegetation was completely pre- effects: On the one hand, the newly introduced buildings
served. There, the full tree canopy combined with the shade one side of the street and a portion of the northern
Figure 3. Simulated PET values at 2 pm on 5 July 2015 for the current situation and the eight densification scenarios (1.4 m
height). Notes: O = open rows, C = closed rows; 15/18 = 15/18 m building height; a/b/c = 1/4/8 underground car parks.
Source: Sabrina Erlwein.
Urban Planning, 2021, Volume 6, Issue 1, Pages 5–19 11A
55
PET in °C, 2 pm
50 +2.6 +2.6 +2.6 +2.6
+2.0 +2.0 +2.1
45 –0.5
O15a SQ C15b O18b O15b C18c C15c O18c O15c
B 55
PET in °C, 10 am–4 pm
50 +4.9 +5.0 +5.2 +5.4
+1.3 +1.3 +1.7
45
–0.9 100% trees
40 65–53% trees
No trees
O15a SQ C15b O18b O15b C18c C15c O18c O15c
Figure 4. Boxplots of the PET values for all densification scenarios at 2 pm (A) and 10 am–4 pm (B) on 5 July 2015. The colours
refer to the number of trees in the respective scenario. The dashed line marks the median value of the current situation;
the numbers in the boxes indicate the respective deviation from the base case (= SQ) median. Source: Sabrina Erlwein.
yards. On the other hand, heat accumulates especially in in slightly lower PET temperature averages (0.1°C–0.4°C),
the northern yards, enlarging the total area with PET val- both for the open row and closed row configuration. This
ues above 51°C to nearly 40% (compared to 7% in the is because higher buildings cast more shadows and thus
current situation and 23%–25% in the open row simu- reduce the mean radiant temperature. The hottest over-
lations; see S2 of the Supplementary File). At the same all thermal conditions are observed for scenario O15c,
time, wind speed in the enclosed yards is—0.6 m s-1 low- without trees, open rows and lower building heights,
er compared to the open row configuration, whereas ele- while scenario O15a (all trees preserved) is the coolest
vated wind speed in the middle street indicates a chan- one. For the spatial distribution of PET values, see S4 of
nelling effect (Figure 5). the Supplementary File.
If not only the hottest hour, but the time period from
10 am to 4 pm is considered, the contrast between 100% 4.2. Comparison of Night-Time (4 am) Thermal Comfort
(category c) and 50% (category b) tree removal becomes for the Current Situation and Densification Scenarios
more prominent (Figure 4, A). The removal of all existing
trees leads to an increase in average PET by 4.9°C–5.4°C In contrast to the daytime situation, in the early morn-
compared to the current situation. This increase can ing (4 am) green spaces with high tree cover are slightly
be considered as a significant deterioration of ther- warmer (+0.9°C for PET) than only grassed areas. Tree
mal comfort under a human-biometeorological perspec- canopies reduce the amount of out-going longwave radi-
tive. In contrast, average increase in PET is reduced to ation and retain daily heat, while high sky view fac-
1.3°C–1.7°C if only half of the trees are removed. While tors are beneficial for nocturnal cooling. The warmest
the largest differences in thermal comfort are again spots are located in the vicinity of NE oriented build-
attributed to the presence of trees and their blocking ing facades, whereas non-disclosed areas are the coolest
of direct solar radiation, higher building heights result ones (Figure 6). The PET averages 18.8°C for the base
Urban Planning, 2021, Volume 6, Issue 1, Pages 5–19 12y [m] Open rows (O15c), 2 pm Closed rows (C15c), 2 pm
175 Wind speed
in m/s
150 1.7
125
1.3
100
0.9
75
50 0.5
25
0.05
0 25 50 75 100 125 150 175 0 25 50 75 100 125 150 175 x [m]
Main wind direction
Figure 5. Wind speed at 1.4 m height for two different building configurations without trees on 5 July 2015. Source: Sabrina
Erlwein.
Figure 6. Simulated PET values at 4 am for the current situation and the eight densification scenarios (1.4 m height). Notes:
O = open rows; C = closed rows, 15/18 = 15/18 m building height, a/b/c = 1/4/8 underground car parks. Source: Sabrina
Erlwein.
Urban Planning, 2021, Volume 6, Issue 1, Pages 5–19 13case (Figure 7). In the absence of solar radiation, the PET as being the most efficient in heat mitigation due to their
range between the warmest and the coolest spot is just shading potential (Chatzidimitriou & Yannas, 2016; Erell,
4.1°C PET (and 0.8°C for Ta ). Only scenario C15b (closed 2017; Lee et al., 2016;). Open spaces with high sky view
rows, trees in every 2nd courtyard) is on average warmer factors cool down faster during the night-time as heat dis-
(+0.1°C for PET) than the current situation (Figure 7). sipation is not hindered by obstacles (Erell et al., 2011).
However, differences in average PET are small (18.4°C Tree canopies trap radiant heat at night, retaining day-
to 18.9°C). Unlike during the day, the number of trees time heat (Bowler et al., 2010). Thus, most of the den-
and the sky view factor in the respective set-up are not sification scenarios are hotter during daytime and cool-
the most influential factors for thermal comfort. Instead, er during night-time, due to their reduced number of
building arrangements with open rows that permit infil- trees; however, free flows of cooling wind are equally
tration of airflow are cooler than the ‘closed rows’ design important. The four coolest scenarios at 4 am were those
scenarios. Similar to the daytime observations, the north- with open row buildings as south-westerly airflow can
ern courtyards are more affected by an elevated tem- penetrate into the green spaces between the buildings.
perature than the southern ones (18.7°C vs 20.0°C for With closed rows, these wind flows are blocked (reducing
PET). In the warmest scenario, combining closed rows wind speed by 0.6 m/s), this being especially detrimental
with longwave radiation retaining tree canopies (C15b), for the northern courtyards. There, night-time PET (4 am)
45% of the area is warmer than 19°C, while it is 12% for is up to 2.0°C warmer and daytime PET (2 pm) is as much
the coolest scenario O18c (open rows, no trees; S3 of the as 4.8°C–6.8°C warmer.
Supplementary File). Higher buildings heights are associ- While a large number of studies have shown
ated with a lower overall PET. how adding green infrastructure can help to mitigate
For side-by-side comparison of all the modelling increased summer temperature (Lee et al., 2016; Perini
results for daytime and night-time, Figure 8 depicts the & Magliocco, 2014; Zölch et al., 2016), this study stresses
average PET deviations of all the densification scenario that preservation of fully grown and high quality green
outcomes from the current situation. infrastructure elements in urban redevelopment sites
is equally important. The cooling capacity of trees is
5. Discussion not uniform, but depends on tree species, growing con-
ditions (Rahman, Moser, Rötzer, & Pauleit, 2019), geo-
When comparing eight densification scenarios for an graphical location, season (Jamei et al., 2016), place-
urban redevelopment site, preservation of the existing ment of trees and individual tree parameters (e.g., tree
vegetation was identified as the most important param- height, healthiness; Rahman, Stratopoulos et al., 2020).
eter in reducing diurnal outdoor heat stress. All treeless In fact, several authors argue that a lower number of
scenarios were significantly hotter regardless of densifi- urban green spaces in growing cities might be substi-
cation type and building height, followed by those sce- tuted by improving their quality (Artmann, Inostroza, &
narios featuring a reduced amount of vegetation. These Fan, 2019; Haaland, & van den Bosch, 2015). Similarly,
findings are in line with other studies that identified trees a loss of urban green space might be acceptable if the
21 100% trees
65–53% trees
No trees
PET in °C, 4 am 07/06/2015
20
+0.1
19
–0.1 –0.1
–0.2 –0.1
–0.3
–0.4 –0.4
18
O15a SQ C15b O18b O15b C18c C15c O18c O15c
Figure 7. Boxplots of PET values for all the densification scenarios at 4 am on 5 July 2015. Notes: The colours refer to the
number of trees in the respective scenario. The dashed line marks the median value of the current situation; the numbers
in the boxes indicate the respective deviation from the base case (= SQ) median. Source: Sabrina Erlwein.
Urban Planning, 2021, Volume 6, Issue 1, Pages 5–19 14Scenario SQ Δ 4 am Δ 2 pm Δ 10 am–4 pm
O15c
O18c
C15c
C18c
O15b
O18b
C15b
O15a
–1 0 1 2 3 4 5 6
Figure 8. Deviations (in °C) from the average PET of the current situation for daytime (5 July 2015) and 4 am (6 July 2015)
for all the densification scenarios. Notes: O = open rows; C = closed rows, 15/18 = 15/18 m building height, a/b/c = 1/4/8
underground car parks. Source: Sabrina Erlwein.
existing qualities are preserved. However, newly planted might have been caused by the limited availability of soil
trees are unlikely to be fully grown trees, but rather small moisture. Nevertheless, the findings of this study are still
trees with limited crown volumes. Growing conditions considered valid, as the main focus of the study was set
for urban trees are often harsh due to limited growth on comparing the relative differences between the inves-
volumes, compacted soils and reduced water availabil- tigated densification scenarios rather than on reporting
ity (Moser, Rötzer, Pauleit, & Pretzsch, 2015). As the the absolute PET values. All the simulation runs were per-
replanting of trees is time-consuming and often associat- formed under the same meteorological and identical full
ed with high costs, the loss of old shade-giving trees can- forcing conditions in the ENVI-met model.
not be easily compensated in the short or medium term. The model outcomes are representative for similar
Where construction of underground car parks was limit- building geometries, that are widespread in German
ed to 50% and yards with fewer or smaller trees were cities. However, the impacts of building geometry alter-
selected for that purpose (‘b’-scenarios) the PET increas- ations on the mean radiant temperature and subse-
es through densification could be limited to +1.3°C for quently PET are dependent on axis orientation and main
the daytime average (10 am to 4 pm). wind directions (Chatzidimitriou & Axarli, 2017; Holst &
Mayer, 2011). Due to the row building’s NE–SW orien-
5.1. Limitations of the Methodological Approach tation, only a small part of the area benefitted from
the enlarged shadow cast due to the increased build-
The presented study focused on an extreme weather ing height during the hottest hours of the day. With an
condition of severe summer heat and low wind speed E–W orientation, additional shade due to higher building
to compare different densification impacts. This focus is height might have made a more important contribution.
due to the fact that climate change is likely to exacerbate For improved transferability of results, more axis orienta-
already elevated urban heat. As a result, PET values for tions and main wind directions would need to be studied.
the chosen heat stress situation were very high; even in In light of climate change, we investigated thermal
the shade of trees, thermal comfort levels remained on comfort situations for daytime and night-time for a hot
an extreme heat stress level. Since a heatwave with no summer situation. However, if planners seek to opti-
rain preceded the modelling day, the soil humidity was mise thermal comfort throughout the year, potential
decreased from 75% to 50% according to the available trade-offs between different seasons should be consid-
measurement data. Bande et al. (2019) found an over- ered. For instance, although detrimental in the sum-
estimation of the mean radiant temperature values in mertime, wind-blocking by trees in winter might be
ENVI-met due to the soil properties and report limits in beneficial especially in colder climates to reduce wind
the vertical moisture transfer with the top layer drying chill effects (Sjöman, Hirons, & Sjöman, 2016). However,
out too quickly. Thus, the exceptionally high PET values from a climate change perspective, the situation of heat
Urban Planning, 2021, Volume 6, Issue 1, Pages 5–19 15waves during hot summertime is of particular concern the increased housing demand can be achieved while
for climate-sensitive urban planning in Central European green quality is increased.
cities such as Munich.
6. Conclusions
5.2. Implications for Urban Planners
This study investigated the impact of densification on
This study showed that trees play a pivotal role in urban green space availability and outdoor thermal com-
heat stress mitigation and that preservation of existing fort for an open midrise development site in Munich.
trees is the most efficient and most affordable mea- Densification scenarios for a typical housing area of free-
sure for climate change adaptation. In practice, the pro- standing multistorey blocks in Munich were developed
vision of new apartments leads to an increased need alongside planners and were thus considered to be real-
for parking spaces, resulting in tree removals. To bal- istic. We showed that the construction of parking space
ance housing demand and preservation of urban green and the loss of existing trees have the greatest impact
space, the following recommendations can be given to on PET outcomes. Replacing large trees is not only costly
urban planners. and time-consuming but is also ineffective in the short
First, particularly in the case of inner-city locations to medium term. Maintaining existing and mature veg-
that are usually well connected to public transport, park- etation reduces PET increase by 4°C compared to the
ing space ratios should be reduced by the employment base case (10 am to 4 pm). Thereby, the cooling effect
of mobility concepts. Car-sharing and bike-sharing sta- during daytime outweighs the slight warming due to
tions guarantee individual mobility, whereby strengthen- heat trapping at night. Wind blocking by buildings and
ing of public transport is not only beneficial for the resi- trees reduces thermal comfort even in low wind con-
dents, but also for the entire neighbourhood (Stevenson ditions (References heat island effect: A systematic review of spatio-
temporal factors, data, methods, and mitigation mea-
Acero, J. A., & Arrizabalaga, J. (2018). Evaluating the per- sures. International Journal of Applied Earth Observa-
formance of ENVI-met model in diurnal cycles for tion and Geoinformation, 67, 30–42. https://doi.org/
different meteorological conditions. Theoretical and 10.1016/j.jag.2017.12.009
Applied Climatology, 131(1-2), 455–469. https://doi. Demuzere, M., Orru, K., Heidrich, O., Olazabal, E.,
org/10.1007/s00704-016-1971-y Geneletti, D., Orru, H., . . . Faehnle, M. (2014).
Akbari, H., & Kolokotsa, D. (2016). Three decades Mitigating and adapting to climate change: Multi-
of urban heat islands and mitigation technolo- functional and multi-scale assessment of green
gies research. Energy and Buildings, 133, 834–842. urban infrastructure. Journal of Environmental Man-
https://doi.org/10.1016/j.enbuild.2016.09.067 agement, 146, 107–115. https://doi.org/10.1016/
Ali-Toudert, F., & Mayer, H. (2006). Numerical study on j.jenvman.2014.07.025
the effects of aspect ratio and orientation of an urban Emmanuel, R., & Steemers, K. (2018). Connecting the
street canyon on outdoor thermal comfort in hot and realms of urban form, density and microclimate.
dry climate. Building and Environment, 41(2), 94–108. Building Research & Information, 46(8), 804–808.
https://doi.org/10.1016/j.buildenv.2005.01.013 https://doi.org/10.1080/09613218.2018.1507078
Ali-Toudert, F., & Mayer, H. (2007). Thermal comfort in Erell, E. (2017). Urban greening and microclimate modi-
an east–west oriented street canyon in Freiburg (Ger- fication. In P. Y. Tan & C. Y. Jim (Eds.), Greening cities
many) under hot summer conditions. Theoretical and (pp. 73–94). Singapore: Springer Singapore. https://
Applied Climatology, 87(1/4), 223–237. https://doi. doi.org/10.1007/978-981-10-4113-6_4
org/10.1007/s00704-005-0194-4 Erell, E., Pearlmutter, D., & Williamson, T. (2011). Urban
Artmann, M., Inostroza, L., & Fan, P. (2019). Urban microclimate: Designing the spaces between build-
sprawl, compact urban development and green cities. ings. London: Earthscan.
How much do we know, how much do we agree? Eco- European Commission. (2016). Assessing adaptation
logical Indicators, 96, 3–9. https://doi.org/10.1016/ knowledge in Europe: Ecosystem-based adaptation
j.ecolind.2018.10.059 (Project No. DESNL16057). Brussels: European
Bande, L., Afshari, A., Al Masri, D., Jha, M., Norford, L., Commission. Retrieved from https://ec.europa.eu/
Tsoupos, A., . . . Armstrong, P. (2019). Validation of clima/sites/clima/files/adaptation/what/docs/
UWG and ENVI-met models in an Abu Dhabi District, ecosystem_based_adaptation_en.pdf
based on site measurements. Sustainability, 11(16). German Meteorological Service. (2018). Vieljährige
https://doi.org/10.3390/su11164378 Stationsmittelwerte für die Klimareferenzperiode
Bayerische Staatskanzlei. (2020). Bayerische Bauord- 1981–2010, für aktuellen Standort und Bezugsstan-
nung (BayBO) in der Fassung der Bekanntmachung dort: Stations-ID 3379 Muenchen-Stadt [Multi-year
vom 14. August 2007 [Bavarian building regulation station mean values for the climate reference period
in the version of the announcement of 14th August 1981–2010, for current location and reference site:
2007] (GVBl. S. 588, BayRS 2132-1-B). Munich: Bay- Station ID 3379 Munich city]. DWD. Retrieved from
erische Staatskanzlei. https://opendata.dwd.de/climate_environment/
Bowler, D. E., Buyung-Ali, L., Knight, T. M., & Pullin, A. S. CDC/observations_germany/climate/multi_annual/
(2010). Urban greening to cool towns and cities: A sys- mean_81-10
tematic review of the empirical evidence. Landscape Haaland, C., & van den Bosch, C. K. (2015). Challenges
and Urban Planning, 97(3), 147–155. https://doi.org/ and strategies for urban green-space planning in
10.1016/j.landurbplan.2010.05.006 cities undergoing densification: A review. Urban
Bruse, M., & Fleer, H. (1998). Simulating surface- Forestry & Urban Greening, 14(4), 760–771.
plant-air interactions inside urban environments Hansen, R., & Pauleit, S. (2014). From multifunctionality
with a three dimensional numerical model. Envi- to multiple ecosystem services? A conceptual frame-
ronmental Modelling & Software, 13(3/4), 373–384. work for multifunctionality in green infrastructure
https://doi.org/10.1016/S1364-8152(98)00042-5 planning for urban areas. Ambio, 43(4), 516–529.
Chatzidimitriou, A., & Axarli, K. (2017). Street canyon Hirashima, S. Q. d. S., Katzschner, A., Ferreira, D. G.,
geometry effects on microclimate and comfort; a Assis, E. S. d., & Katzschner, L. (2018). Thermal
case study in Thessaloniki. Procedia Environmen- comfort comparison and evaluation in different cli-
tal Sciences, 38, 643–650. https://doi.org/10.1016/ mates. Urban Climate, 23, 219–230. https://doi.org/
j.proenv.2017.03.144 10.1016/j.uclim.2016.08.007
Chatzidimitriou, A., & Yannas, S. (2016). Microclimate Holst, J., & Mayer, H. (2010). Urban human-
design for open spaces: Ranking urban design effects biometeorology: Investigations in Freiburg (Ger-
on pedestrian thermal comfort in summer. Sustain- many) on human thermal comfort. Urban Climate
able Cities and Society, 26, 27–47. https://doi.org/ News, 38, 5–10.
10.1016/j.scs.2016.05.004 Holst, J., & Mayer, H. (2011). Impacts of street design
Deilami, K., Kamruzzaman, M., & Liu, Y. (2018). Urban parameters on human-biometeorological variables.
Urban Planning, 2021, Volume 6, Issue 1, Pages 5–19 17Meteorologische Zeitschrift, 20(5), 541–552. https:// Mühlbacher, G., Koßmann, M., Sedlmaier, K., & Winder- doi.org/10.1127/0941-2948/2011/0254 lich, K. (2020). Stadtklimatische Untersuchungen Jamei, E., & Rajagopalan, P. (2018). Effect of street der sommerlichen Temperaturverhältnisse und des design on pedestrian thermal comfort. Architec- Tagesgangs des Regionalwindes (“Alpines Pumpen”) tural Science Review, 28(455), 1–20. https://doi.org/ in München. Berichte des Deutschen Wetterdienstes: 10.1080/00038628.2018.1537236 Vol. 252 [Urban climatic studies of summer tempera- Jamei, E., Rajagopalan, P., Seyedmahmoudian, M., & ture conditions and the diurnal cycle of the region- Jamei, Y. (2016). Review on the impact of urban al wind (“Alpine Pumping”) in Munich. Reports of geometry and pedestrian level greening on outdoor the German Weather Service: Vol. 252]. Offenbach: thermal comfort. Renewable and Sustainable Ener- Deutscher Wetterdienst. gy Reviews, 54, 1002–1017. https://doi.org/10.1016/ Oke, T. R. (1982). The energetic basis of the urban heat j.rser.2015.10.104 island. Quarterly Journal of the Royal Meteorologi- Konarska, J., Lindberg, F., Larsson, A., Thorsson, S., & cal Society, 108(455), 1–24. https://doi.org/10.1002/ Holmer, B. (2014). Transmissivity of solar radiation qj.49710845502 through crowns of single urban trees: Application for Pacifici, M., Marins, K. R. d. C., Catto, V. d. M., Rama, outdoor thermal comfort modelling. Theoretical and F., & Lamour, Q. (2017). Morphological and climate Applied Climatology, 117(3/4), 363–376. https://doi. balance: Proposal for a method to analyze neighbor- org/10.1007/s00704-013-1000-3 hood urban forms by way of densification. Sustain- Landeshauptstadt München. (2011). Langfristige able Cities and Society, 35, 145–156. https://doi.org/ Siedlungsentwicklung: Kongressinformation [Long 10.1016/j.scs.2017.07.023 term settlement development: Congress infor- Pauleit, S., & Duhme, F. (2000). Assessing the envi- mation]. Munich: Landeshauptstadt München. ronmental performance of land cover types Retrieved from https://www.muenchen.de/rathaus/ for urban planning. Landscape and Urban Plan- Stadtverwaltung/Referat-fuer-Stadtplanung- ning, 52(1), 1–20. https://doi.org/10.1016/S0169- und-Bauordnung/Projekte/Langfristige- 2046(00)00109-2 Siedlungsentwicklung/Projekt/Verdichtung.html Perini, K., & Magliocco, A. (2014). Effects of vegetation, Landeshauptstadt München. (2020). Mobilitätskonzept urban density, building height, and atmospheric con- [Mobility concept]. Landeshauptstadt München. ditions on local temperatures and thermal comfort. Retrieved from https://www.muenchen.de/rathaus/ Urban Forestry & Urban Greening, 13(3), 495–506. Stadtverwaltung/Referat-fuer-Stadtplanung-und- https://doi.org/10.1016/j.ufug.2014.03.003 Bauordnung/Lokalbaukommission/Kundeninfo/ Rahman, M. A., Hartmann, C., Moser-Reischl, A., Strach- Mobilitaetskonzept.html witz, M. F., von Paeth, H., Pretzsch, H., . . . Rötzer, Lee, H., & Mayer, H. (2018). Maximum extent of human T. (2020). Tree cooling effects and human thermal heat stress reduction on building areas due to urban comfort under contrasting species and sites. Agricul- greening. Urban Forestry & Urban Greening, 32, tural and Forest Meteorology, 287. https://doi.org/ 154–167. 10.1016/j.agrformet.2020.107947 Lee, H., Mayer, H., & Chen, L. (2016). Contribution of Rahman, M. A., Moser, A., Rötzer, T., & Pauleit, S. trees and grasslands to the mitigation of human (2019). Comparing the transpirational and shad- heat stress in a residential district of Freiburg, South- ing effects of two contrasting urban tree species. west Germany. Landscape and Urban Planning, 148, Urban Ecosystems, 22(4), 683–697. https://doi.org/ 37–50. https://doi.org/10.1016/j.landurbplan.2015. 10.1007/s11252-019-00853-x 12.004 Rahman, M. A., Stratopoulos, L. M. F., Moser-Reischl, A., Lee, H., Mayer, H., & Kuttler, W. (2020). Impact of the Zölch, T., Häberle, K.-H., Rötzer, T., . . . Pauleit, S. spacing between tree crowns on the mitigation of (2020). Traits of trees for cooling urban heat islands: daytime heat stress for pedestrians inside E–W urban A meta-analysis. Building and Environment, 170. street canyons under Central European conditions. https://doi.org/10.1016/j.buildenv.2019.106606 Urban Forestry & Urban Greening, 48. https://doi. Sanusi, R., Johnstone, D., May, P., & Livesley, S. J. (2016). org/10.1016/j.ufug.2019.126558 Street orientation and side of the street greatly influ- Mayer, H., & Höppe, P. (1987). Thermal comfort of man ence the microclimatic benefits street trees can pro- in different urban environments. Theoretical and vide in summer. Journal of Environmental Quality, Applied Climatology, 38(1), 43–49. https://doi.org/ 45(1), 167–174. https://doi.org/10.2134/jeq2015.01. 10.1007/BF00866252 0039 Moser, A., Rötzer, T., Pauleit, S., & Pretzsch, H. (2015). Simon, H. (2016). Modeling urban microclimate: Devel- Structure and ecosystem services of small-leaved opment, implementation and evaluation of new and lime (Tilia cordata Mill.) and black locust (Robinia improved calculation methods for the urban micro- pseudoacacia L.) in urban environments. Urban climate model ENVI-met (Doctoral dissertation). Forestry & Urban Greening, 14(4), 1110–1121. Johannes Gutenberg-University, Mainz. Retrieved https://doi.org/10.1016/j.ufug.2015.10.005 from https://openscience.ub.uni-mainz.de/handle/ Urban Planning, 2021, Volume 6, Issue 1, Pages 5–19 18
20.500.12030/4044                                             Yahia, M. W., Johansson, E., Thorsson, S., Lindberg, F., &
Simon, H., Linden, J., Hoffmann, D., Braun, P., Bruse, M.,            Rasmussen, M. I. (2018). Effect of urban design on
    & Esper, J. (2018). Modeling transpiration and leaf               microclimate and thermal comfort outdoors in warm-
    temperature of urban trees: A case study evaluat-                 humid Dar es Salaam, Tanzania. International Journal
    ing the microclimate model ENVI-met against mea-                  of Biometeorology, 62(3), 373–385. https://doi.org/
    surement data. Landscape and Urban Planning, 174,                 10.1007/s00484-017-1380-7
    33–40. https://doi.org/10.1016/j.landurbplan.2018.            Ward Thompson, C., Lauf, S., Kleinschmit, B., & Endlich-
    03.003                                                            er, W. (2016). Heat waves and urban heat islands
Sjöman, J. D., Hirons, A., & Sjöman, H. (2016). Branch                in Europe: A review of relevant drivers. The Science
    area index of solitary trees: Understanding its signif-           of the Total Environment, 569/570, 527–539. https://
    icance in regulating ecosystem services. Journal of               doi.org/10.1016/j.scitotenv.2016.06.119
    Environmental Quality, 45(1), 175–187. https://doi.           Zentrum für Stadtnatur und Klimaanpassung. (2017).
    org/10.2134/jeq2015.02.0069                                       Teilprojekt 1: Klimaschutz und grüne Infrastruktur
Staiger, H., Laschewski, G., & Matzarakis, A. (2019). Selec-          in der Stadt: Abschlussbericht [Subproject 1: Cli-
    tion of Appropriate thermal indices for applications              mate protection and green infrastructure in the
    in human biometeorological studies. Atmosphere, 10.               city: Final report]. Munich: Zentrum für Stadtnatur
    https://doi.org/10.3390/atmos10010018                             und Klimaanpassung. Retrieved from https://www.
Stevenson, M., Thompson, J., Sá, T. H. d., Ewing, R.,                 landschaftsentwicklung.wzw.tum.de/fileadmin/
    Mohan, D., McClure, R., . . . Woodcock, J. (2016).                w00bds/www/Bilder/Projekte/ZSK/ZSK_TP1_
    Land use, transport, and population health: estimat-              Schlussbericht_20170731_mitUnterschriften_
    ing the health benefits of compact cities. The Lancet,            aktJan18.pdf
    388, 2925–2935. https://doi.org/10.1016/S0140-                Zölch, T., Maderspacher, J., Wamsler, C., & Pauleit,
    6736(16)30067-8                                                   S. (2016). Using green infrastructure for urban
Stewart, I. D., & Oke, T. R. (2012). Local climate zones for          climate-proofing: An evaluation of heat mitigation
    urban temperature studies. Bulletin of the American               measures at the micro-scale. Urban Forestry & Urban
    Meteorological Society, 93(12), 1879–1900. https://               Greening, 20, 305–316. https://doi.org/10.1016/
    doi.org/10.1175/BAMS-D-11-00019.1                                 j.ufug.2016.09.011
Tsoka, S., Tsikaloudaki, A., & Theodosiou, T. (2018).             Zölch, T., Rahman, M. A., Pfleiderer, E., Wagner, G.,
    Analyzing the ENVI-met microclimate model’s per-                  & Pauleit, S. (2019). Designing public squares with
    formance and assessing cool materials and urban                   green infrastructure to optimize human thermal
    vegetation applications: A review. Sustainable Cities             comfort. Building and Environment, 149, 640–654.
    and Society, 43, 55–76. https://doi.org/10.1016/j.scs.            https://doi.org/10.1016/j.buildenv.2018.12.051
    2018.08.009

About the Authors

                     Sabrina Erlwein is a PhD Candidate at the Chair for Strategic Landscape Planning and Management
                     at the Technical University of Munich. She has studied Geography and Environmental Planning in
                     Marburg, Utrecht and Munich and has work experience as a city planner. Her research interest lies
                     in investigating the possibilities of adapting the climate of growing cities through urban greenery and
                     in interdisciplinary city planning.

                     Stephan Pauleit is Professor in Strategic Landscape Planning and Management at the Technical
                     University of Munich. He has developed a special interest in research to advance urban green infras-
                     tructure planning and multifunctional nature-based solutions in the urban environment, particularly
                     urban forests and trees. At present, Stephan Pauleit is the Director of the “Centre for Urban Ecology
                     and Climate Change Adaptation,” awarded by the Bavarian State Ministry of the Environment and
                     Consumer Protection.

Urban Planning, 2021, Volume 6, Issue 1, Pages 5–19                                                                      19
You can also read