CITY OF NANAIMO
COMMUNITY PROFILE
←
→
Page content transcription
If your browser does not render page correctly, please read the page content below
CITY OF NANAIMO COMMUNITY PROFILE
2020 Community Profile

MAYOR’S WELCOME
                                    On behalf of City Council and the citizens of Nanaimo, it is
                                    my pleasure to welcome you to our beautiful city. As the
                                    economic hub of central Vancouver Island, Nanaimo boasts
                                    both a vibrant business community and an exceptional
                                    quality of life. Nanaimo has transitioned from a commodity-
                                    based economy that relied on an abundance of natural
                                    resources from the forests and ocean towards a service-
                                    based “knowledge” economy that relies on the skills, talent
                                    and innovation of the local workforce. The city is now a
                                    regional centre for health services, technology, retail,
                                    construction, manufacturing, education and government
                                    services.

                                  Nanaimo is a central transportation and distribution hub for
                                  Vancouver Island. Home to an excellent deep-sea port, this
                                  ocean-side city receives 4.6 million tons (2019) of cargo
                                  through its port facilities and deep-sea terminal at Duke Point
                                  each year. Air Canada offers direct flights to Vancouver,
Calgary and Toronto from the Nanaimo Airport, an all-weather facility. Seaplanes and Helijet link
downtown Nanaimo to downtown Vancouver in 20 minutes. BC Ferries provides vehicle and
passenger service between Nanaimo and Vancouver as well as Richmond from two terminals
located in Nanaimo.

Businesses choose to locate in Nanaimo because of the cost efficiencies and a complete range
of telecommunications services. Nanaimo offers a well-trained, stable and educated workforce.
Vancouver Island University graduates, from various disciplines, provide a constant stream of
new employees for area companies.

Nanaimo City Council values our over 6,200 businesses and offers support programs through the
Economic Development office. We offer various incentives for new multi-family housing, and
commercial and heritage projects in our City Centre. Additionally, city wide incentives are
available for hotel and/or motel developments or redevelopments.

Nanaimo offers a full spectrum of housing options most with spectacular ocean and mountain
views. A diverse range of recreational opportunities is available to Nanaimo residents and
visitors. Nestled between the ocean and the mountains, Nanaimo offers an enviable lifestyle with
a variety of employment and investment opportunities.

We hope you choose to become a part of our beautiful, vibrant city.

Mayor Leonard Krog, City of Nanaimo

                                                                               P a g e 2 | 50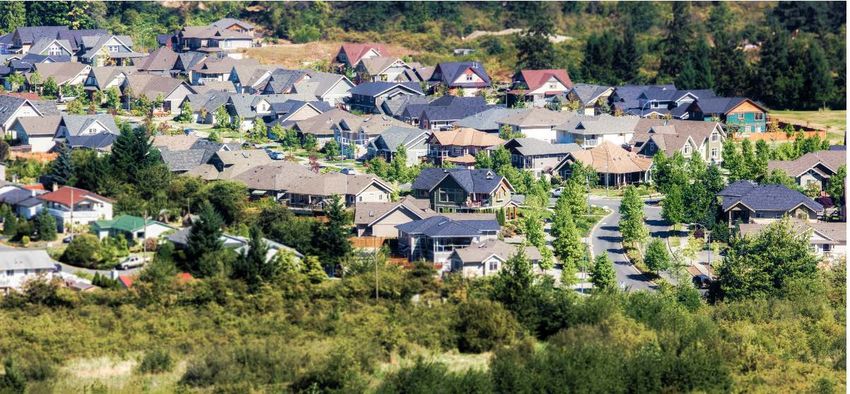
2020 Community Profile

TABLE OF CONTENTS
1.0   INTRODUCTION – Pg. 4
       1.1 Nanaimo Economic Development        6.0   TELECOMMUNICATIONS – Pg. 32
       1.2 Location
       1.3 Economic Overview
                                               7.0   BUSINESS CLIMATE – Pg. 33
2.0   DEMOGRAPHICS – Pg. 7                           7.1 Municipal Tax Rates
      2.1 Population                                 7.2 Development Services
      2.2 Migration                                  7.3 Development Cost Charges
      2.3 Population by Age Distribution             7.4 Financial Tax Incentives
      2.4 Language & Immigration
                                               8.0 UTILITIES – Pg. 35
3.0   LABOUR MARKET – Pg. 14                       8.1 Electricity and Natural Gas
      3.1 Labour Market by Industry Sector –       8.2 Water and Sewer
          Vancouver Island                         8.3 Waste Management
      3.2 Unemployment and Participation
          Rates                                9.0 COMMUNITY SERIVICES & QUALITY
      3.3 Income                                   OF LIFE – Pg. 36
      3.4 Labour Force by Education                9.1 Government
      3.5 Major Employers                          9.2 Climate
                                                   9.3 Communications and Media
4.0   DEVELOPMENT TRENDS & REAL                    9.4 City Living
      ESTATE – Pg. 21                              9.5 Health & Safety
      4.1 Building Permits                         9.6 Education
      4.2 Housing Starts
      4.3 Housing Prices                       APPENDIX – p.48
      4.4 Residential Rental Market                  A- Nanaimo Population Projections
      4.5 Commercial Rental Market                   B- Regional District of Nanaimo Population
      4.6 Major Projects                                Projections

5.0   TRANSPORTATION & LOGISTICS –             Note:   Nanaimo CA boundary includes Lantzville, East
      Pg. 28                                   Wellington, Cedar and Mt. Benson area.
      5.1 Air Transportation
      5.2 Marine Transportation
      5.3 Road Transportation

1.0 INTRODUCTION

                                                                                 P a g e 3 | 50
2020 Community Profile
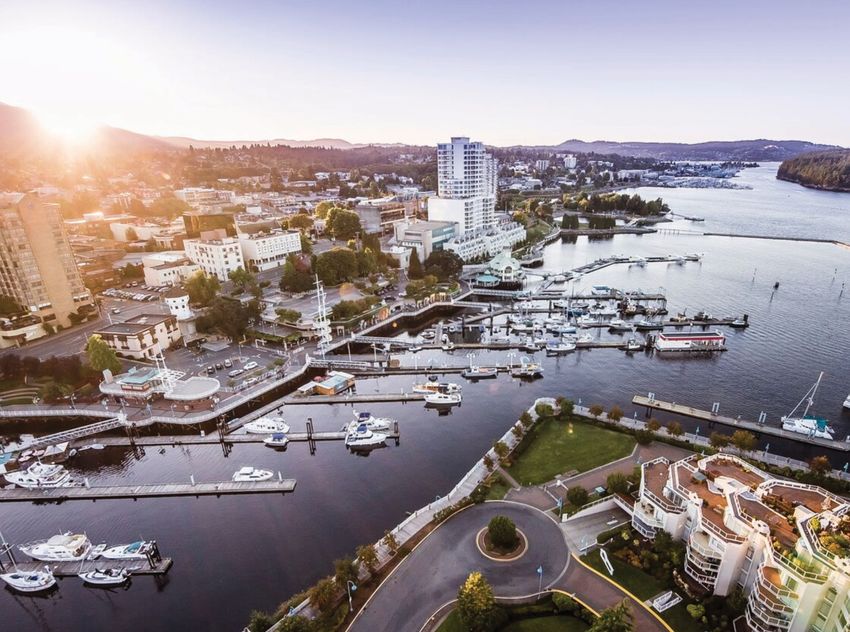
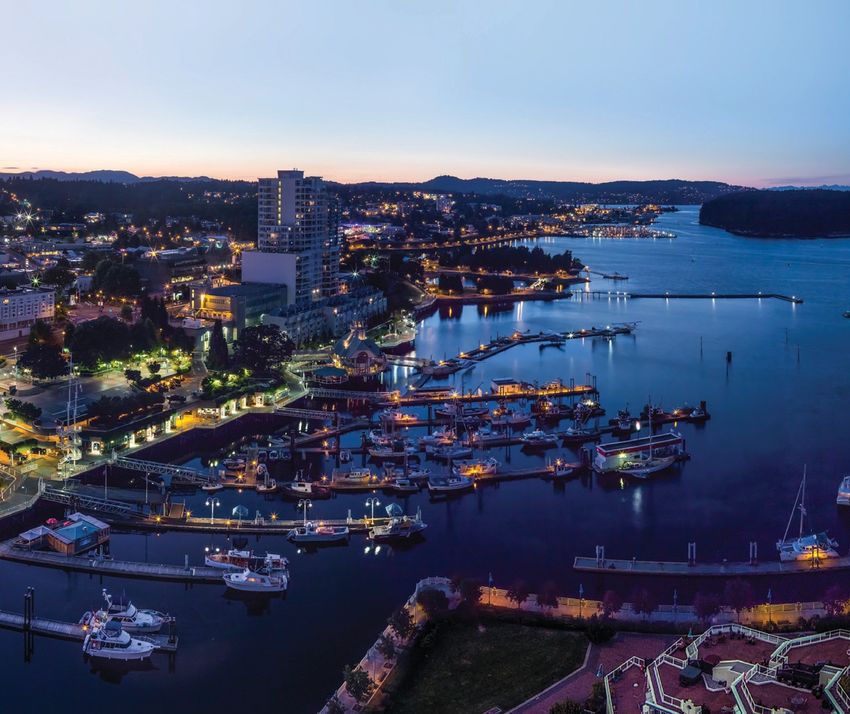
Nanaimo is the fifth largest urban centre in British Columbia. Nestled between the mountains and
the ocean, Nanaimo is a 20-minute flight from downtown Vancouver or a 1.5 hour ferry ride. The
economic hub of Central and North Vancouver Island, Nanaimo boasts a vibrant business
community and exceptional quality of life.
Businesses choose to locate in Nanaimo because of the cost efficiencies and a complete range
of telecommunications services. The city offers a skilled and motivated workforce, exceptional
technological infrastructure, and easy access to world markets. This welcoming region of 170,757
(RDN 2020) people is proud of their recreational facilities, community spirit, and the region’s
natural beauty.
1.1 Nanaimo Economic Development (NED)
Working with local and regional partners, the Nanaimo Economic Development office assists in
building a prosperous community through economic opportunity.
Our services include:
• Supporting new start-ups, business retention and business expansion;
• Attracting new business and investment; and
• Promoting Nanaimo as a premier destination for new businesses and residents.
1.2 Location
The City of Nanaimo is the second largest urban centre on Vancouver Island. Nanaimo is located
on the eastern side of Vancouver Island, 23km (14 miles) west of Vancouver and 113km (70
miles) north of Victoria, the capital of British Columbia. The City of Nanaimo covers 88.19 square
kilometres within the Nanaimo Regional District. The Regional District stretches north to Bowser,
south to Cedar and west to Errington, an area of 2,041.32 square kilometres. The City of Nanaimo
accounts for 4.3% of the total land area of the region, but is home to 61% of the population and
operates as the region’s economic and employment centre.
1.3 Economic Overview
Nanaimo has transitioned from a commodity-based economy that traditionally relied on an
abundance of natural resources in the forest and ocean towards a service-based “knowledge”
economy that relies on the skills, talent and innovation of the local workforce. The area offers a
diversified economic base of 6,233 businesses operating within the City of Nanaimo. Nanaimo’s
largest sectors by number of businesses are Construction (18.8%), Professional Scientific &
Technical (12.5%), Retail Trade (12.2%),Other Services except Public Administration (10.5%)
and Healthcare/Social Assistance (10.4%). These top five industry sectors account for 64.3% of
all business licenses.
P a g e 4 | 50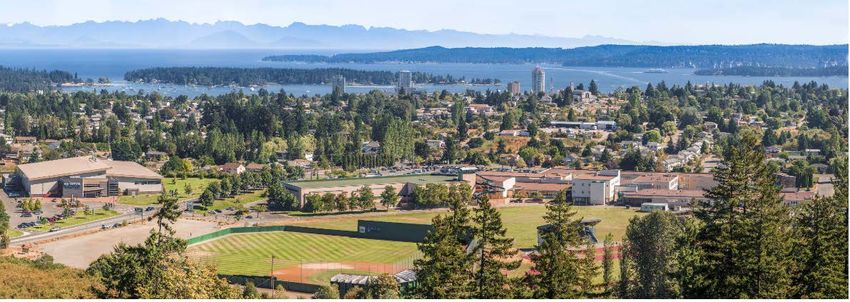
2020 Community Profile

                                Business Licenses by Industry 2019
                                         City of Nanaimo

                                                 Utilities       2
             Management of Companies & Enterprises               3
               Agriculture, Forestry, Fishing & Hunting          11
                     Information & Cultural Industries             41
                                   Education & Training             82
                                       Wholesale Trade                120                      Total = 6,233
                                    Finance & Insurance               126
               Transportation, Warehousing & Storage                    166
                                         Manufacturing                 162
                     Arts, Entertainment & Recreation                     212
                        Accomodation & Food Services                             346
                                   Real Estate & Leasing                               449
  Administrative & Support, Waste Mgt & Remediation                                      503
                        Healthcare & Social Assistance                                         646
         Other Services (except Public Administration)                                         653
                                                   Retail                                            760
           Professional, Scientific & Technical Services                                              780
                                           Construction                                                                 1,171

                                                             0       200        400      600     800        1,000    1,200

Source: Nanaimo Economic Development, City of Nanaimo

As with Canadian business composition, the majority of the businesses in Nanaimo are small to
medium sized enterprises. The City of Nanaimo has 3,977 businesses with employees.
Approximately 87% (2,997) of these businesses have between 1 and 19 employees; 9% (300) of
the businesses have between 20-49 employees; 4% (145) of these businesses have between 50-
499 employees and 7 businesses have more than 500 employees. Nanaimo’s largest sectors by
employment are: Healthcare and Social Assistance, Retail Trade, Construction, Accommodation
& Food Services and Educational Services (2016 Census)

                                                                                                                    P a g e 5 | 50
2020 Community Profile

                                                Businesses by Employee Size 2019
                                                        City of Nanaimo
                            1777
     NUMBER OF BUSINESSES

                                         720
                                                  500
                                                            300
                                                                      95     37
                                                                                         13      7

                            1-4    5-9         10-19    20-49     50-99    100-   200-        >500
                                                                           199    499
                                                   NUMBER OF EMPLOYEES

Source: Stats Canada, Nanaimo Economic Development

Health Care & Social Assistance
During the 2016 Census, the Healthcare and Social Assistance sector was the largest
employment sector in the Nanaimo CA with 7,285 employees. Nanaimo CA area includes the
City of Nanaimo, Area A, Aarea C and Lantzville. Over the past decade significant investments
have been made at the Nanaimo Regional General Hospital and in private healthcare facilities
surrounding the hospital zone. Employment in healthcare rose by 14.4% between 2011 and 2016.
The City of Nanaimo had 6,600 employees in the Healthcare and Social Assistance sector
representing 14.7% of total employment.

Retail Trade
Nanaimo is the retail and distribution hub for Central and North Vancouver Island. Employment
in retail trade increased by 0.96% between 2011 and 2016. In the City of Nanaimo the retail
sector employed 6,610 representing 14.8% of total employment. In the Nanaimo CA 6,975
persons were employed in the retail sector. Nanaimo is home to the largest retail mall on
Vancouver Island, Woodgrove Centre. Retail malls and boutique shops are continually
reinventing themselves to provide an exceptional customer experience as the competition
between traditional brick and mortar stores and on-line shopping intensifies.

Construction
Construction remains one of the key employment sectors in the Nanaimo CA, with 4,220
employees. Building permit values for residential and commercial projects continue to reflect
higher demand year-over-year from positive migration. Employment in the construction sector
grew by 5.2% between 2011 and 2016. In the City of Nanaimo at the time of 2016 Census 3,775
persons were employed in Construction.

Accommodation & Food Services
Accommodation and Food Services is the fourth largest employment sector in the Nanaimo CA,
with 4,035 employees. Employment in this sector decreased by 1.6% between 2011 and 2016.
The City of Nanaimo employed 3,840 people in the Accommodation and Food services sector at
the time of Census.

                                                                                                           P a g e 6 | 50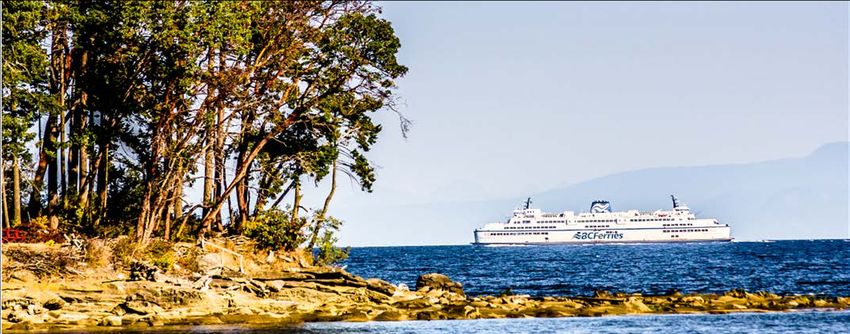
2020 Community Profile

Educational Services
Educational Services is the fifth largest sector in Nanaimo CA with 3,355 employees. Nanaimo
is home to Vancouver Island University which draws students from all parts of the world and adds
diversity. In 2011 educational services accounted for 7.2% of the total employment in Nanaimo,
but declined to 7.0% in 2016. In the City of Nanaimo 2,995 people were employed in educational
services, representing 6.7% of employment.

2.0 DEMOGRAPHICS
2.1     Population
The City of Nanaimo’s population is estimated to be 98,957 in 2019. The population in the
Regional District of Nanaimo was estimated at 162,727. Based on future projections, strong
population growth is expected to continue in the Nanaimo area. For detailed City of Nanaimo and
Regional population projections by age breakdown see Appendix A and B.

                                          Population Growth
                                           City of Nanaimo
  120,000
                                                                                                   106,254
                                                                                  98,957
  100,000
                                                                   90,504
                                               83,810
                                 78,690
   80,000       72,980

   60,000

   40,000

                                                                             9%            7%
                                                        8%
   20,000
                          8%              7%

        -
                   2001            2006          2011                     2016      2019              2024

                                               Actual        Projection

Source: Stats Canada, BC Stats

Nanaimo’s location has helped the city develop as an important retail, service, transportation and
distribution centre for central and northern Vancouver Island. The city’s primary trade area
comprises of approximately 164,235 people drawn from the Nanaimo Regional District and the
Town of Ladysmith. This trade area has been growing due to population growth. The primary
trade area grew by 6.3% between 2011 and 2016.

                                                                                                P a g e 7 | 50
2020 Community Profile

The city’s secondary trade area has over 142,179 people in the Alberni-Clayoquot region to the
west, and the Comox Strathcona region to the north. This area has grown on average 3.13%
between 2011 and 2016.

The city’s tertiary trade area has an additional 86,237 people from the Cowichan Valley region to
the south, and the Mount Waddington region to the north. This area has grown by 4.35% between
2011 and 2016. Thus, the total trade area is approximately 392,651 persons.

                              Nanaimo's Trade Areas
                                              2011       2016 % Change
Primary Trade Area
City of Nanaimo                              83,810      90,504        7.39%
Remainder of Nanaimo Regional District       62,764      65,194        3.72%
Ladysmith                                     7,921       8,537        7.21%
Subtotal                                    154,495     164,235        5.93%
Secondary Trade Area
Alberni-Clayoquot RD                         31,061      30,981       -0.25%
Comox Strathcona RD                         106,790     111,198        3.96%
Subtotal                                    137,851     142,179        3.04%
Tertiary Trade Area
Remainder of Cowichan RD                     72,411      75,202        3.71%
Mount Waddington RD                          11,506      11,035       -4.26%
Subtotal                                     83,917      86,237        2.69%
Total (All Trade Areas)                     376,263     392,651        4.17%
Source: Stats Canada Census

2.2    Migration

Population growth is driven by two factors: natural increase and migration. Nanaimo’s population
growth has resulted from migration. People move to new areas for a variety of reasons including
employment opportunities and quality of life factors. There are three types of migrants; intra-
provincial (within BC), inter-provincial (other provinces) and international immigrants (outside of
Canada). In the past five years, on average over 3,000 net new migrants have located in the
Nanaimo region.

                                                                                P a g e 8 | 50
2020 Community Profile

Source: BC Stats

                         P a g e 9 | 50
2020 Community Profile

Migration to British Columbia from other countries has been growing significantly over the last five
years. Migration to BC from other provinces has been slowing down after peaking in 2015-2016.
Net migration to BC had been on a positive trajectory year-over-year but declined in 2018-2019.
The Nanaimo region captured 5.2% of total migrants to BC in 2018-2019 and the five-year
average is 5.8%.

                                                       BC Migration
 80,000
                                                                                     70,692
 70,000                                                                                                    65,104
                                          56,492                58,323
 60,000                                                                           56,703               58,993

 50,000
                39,585                                       39,489
 40,000

                                        29,919
 30,000                                      26,573
                       20,379                                        18,834
 20,000       19,206
                                                                                       13,989
 10,000                                                                                                         6,111

       0
                   2014-2015             2015-2016            2016-2017           2017-2018            2018-2019

                                Net International         Net Interprovincial       Net Migration BC

Source: BC Stats

2.3        Population by Age Distribution

In 2019, the City of Nanaimo had 13,680 children aged 0 to 14, and 23,271 persons aged 65 and
older, representing respectively 14.0% and 23.0% of the total population. The working age
population 62,006 (15 to 64) represented 63.0% of the total population. Below is a table of
population by age breakdown and expected increase or decrease in each age category by 2024.

Children                   Young Adults               Early Working Years       Later Working Years              Retirement
 (0-14)                      (15-24)                        (25-44)                   (44-64)                      (65+)

 2019                            2019                        2019                      2019                         2019
13,680                          10,342                      24,243                    27,421                       23,271

  2024                          2024                         2024                      2024                         2024
  4.1%                           1.4%                        14.4%                      3.2%                        17.1%

                                                                                                  P a g e 10 | 50
2020 Community Profile
The Chart below breaks down age categories as a proportion of total population in 2019 and five
years forward. Note although an age category may see absolute growth over the five year term,
it may represent a small portion of the total population depending on what happens in other
categories.
Age Composition
City of Nanaimo
30% 27%
26% 26%
25%
25% 25%
20% 23%
14%
15%
11%
10% 13%
10%
5%
0%
0-14 (Children) 15-24 (young adults) 25-44 (Early working 45-64 (later working 65+ Retirement
years) Years)
2019 2024
Source: Environics Analytics
P a g e 11 | 502020 Community Profile
2.4 Language, Ethnic Origins, Visible Minorities
Nanaimo is becoming a more ethnically diverse community over time. Approximately 15% of
Nanaimo’s total population are immigrants. Roughly, 74% of the immigrants have been living in
Nanaimo for over sixteen years.
Mother Tongue
Language % of total population
English 88.6
French 1.6
German 1.3
Mandarin 1.2
Panjabi (Punjabi) 1.0
Dutch 0.6
Tagalog (Pilipino, Filipino) 0.6
Other immigrant languages 4.9
Aboriginal languages 0.2
Source: Stats Canada 2016 Census
Population by Ethnic Origins - City of Nanaimo
2016 % of Total population
European Origins 68,970 79%
Other North American Origin 24,025 27%
Asian Origins 8,455 10%
North American Aboriginal Origins 7,330 8%
African Origins 995 1%
Latin, Central & South American Origins 855 1%
Oceania Origins 605 1%
Total popn by Ethnic Origins* 87,650 127%
Source: Stats Canada 2016 Census
*a person may report more than one ethnic origin, hence totals do not match.
P a g e 12 | 502020 Community Profile
Visible Minorities- City of Nanaimo
2,019 2024 % change
Chinese 2,762 3,131 13%
South Asian 2,207 2,200 0%
Filipino 928 997 7%
Southest Asian 836 844 1%
Black 760 778 2%
Latin American 550 599 9%
Japanese 473 482 2%
Korean 401 392 -2%
Arab 281 282 0%
Multiple Visible Minorities 254 229 -10%
West Asian 198 200 1%
Visible Minority (not inc elsewhere) 78 73 -6%
Total 9,728 10,207 5%
source: 2016 census, environic analytics
The largest segment of residents in Nanaimo are of European origins, representing 79% of the total population.
At 27%, the second highest group is Other North American Origin (excluding Aboriginal), and the third largest is
Asian origins at 10%. Aboriginal origins represent 8.4% of the population. The largest population gains in the
last census were in the Asian and European origin categories.
Visible minorities represent 9.9% of Nanaimo’s total population. As the overall population grows, Nanaimo
is seeing greater diversity in its population. The three largest minorities in Nanaimo are Chinese (2.6%),
South Asian (2.2%), and Filipino (1.1%). The total visible minority population in Nanaimo is expected to
increase by 5% by 2024. The largest growth is expected to come from Chinese migrants (369 persons),
followed by Filipino (69 persons) and Latin American (49 persons).
BC’s visible minority population is at 31.1%. The three largest minorities in BC are Chinese (11.7%), South
Asian (7.8%), and Filipino (3.6%). Vancouver has the most diverse population in BC with visible minorities
representing 48.9% of the total population — with Chinese at 19.6%, South Asian 12% and Filipino at 5.1%.
P a g e 13 | 502020 Community Profile
3.0 LABOUR MARKET
Labour Market by Industry Sector – Nanaimo
Service industries account for much of Nanaimo’s employment base. In 2019, 83% of total
employment was provided by the service sector and the goods producing sector accounted for
17% of the total employment. The greatest number of jobs in the City of Nanaimo were provided
by the Retail and Healthcare/Social assistance sector followed by the Construction,
Accommodation/Food services, and Education sector.
Labour Market by Industry Sector
City of Nanaimo 2019
Mgmt of Companies & Enterprises 0.03%
14
Utilities 0.51%
220
Mining/Oil & Gas 0.96%
416
Real Estate/Rental/Leasing 1.69%
731
Arts/Entertainment/Recreation 1.90%
818
Agr/Forestry/Fishing/Hunting 2.34%
1,011
Wholesale Trade 2.46%
1,060
Information & Cultural 2.85%
1,230
Finance & Insurance 3.30%
1,423
Manufacturing 4.27%
1,841
Transportation & Warehousing 4.68%
2,018
Other Services (Except Public Admin) 4.69%
2,024
Public Administration 4.90%
2,113
Amin & Support, Waste Magmt & Remed 5.19%
2,238
Prof/Scientific/Technical 6.31%
2,721
Educational Svcs 6.92%
2,987
Accommodation & Food Svcs. 8.56%
3,694
Construction 8.82%
3,807
Health Care & Social Assistance 14.79%
6,380
Retail Trade 14.82%
6,395
Source: Environics Analytics
P a g e 14 | 502020 Community Profile
Labourforce by Occupation
City of Nanaimo 2019
Not Applicable 828
Natural Resources, Agri & Rel'd Prodn 828
Manufacturing & Utilities 1,069
Arts, Culture, Recreation & Sport 1,217
Natural and Applied Science 2,612
Health 3,875
Management Occupations 4,106
Edn, Law & Social, Cmty & Gov't Serv 4,775
Business, Finance, Administration 6,106
Trades, Transport/Equip Operators 6,521
Sales and Service 12,161
0 2,000 4,000 6,000 8,000 10,000 12,000 14,000
Source: Environics Analytics
Sales and service occupations make up 28% of all jobs in Nanaimo. Trades, Transport/Equipment
operators account for 15% of all occupations. The next three categories fall into professional
services, together they account for 35% of occupations in Nanaimo.
3.1 Unemployment and Participation Rates
The labour force is composed of those 15 years of age and older who are either employed or
actively seeking work. Changes in the labour force are the result of changes in population and
economic opportunities. A growing economy attracts workers from other areas and induces
people to enter the labour force. When the economy slows, people leave in search of opportunities
elsewhere or withdraw from the labour force.
Historically Nanaimo’s unemployment rate has been below BC and the Canadian average. In the
past three years Nanaimo’s unemployment rate has been higher than BC’s but lower than the
national rate.
P a g e 15 | 502020 Community Profile
Unemployment Rate Comprisons
Annual Averages
7.5
7.0
6.5
6.0
PERCENT
5.5
5.0
4.5
4.0
3.5
3.0
2015 2016 2017 2018 2019
Nanaimo 4.7 6.6 5.7 5.1 4.6
Vac Isl & Coast 6.3 5.8 5.0 4.7 4.1
BC 6.2 6.0 5.1 4.7 4.7
Canada 6.9 7.0 6.3 5.8 5.7
Source: Stats Canada
Nanaimo’s labour force participation rate for has been increasing in recent years. Labour force
participation rate represents the ratio between those in the labour force and the total population
that is of working age. Regions with younger populations tend to have higher labour force
participation rates while those with an older population have lower rates. Participation rates also
tend to fall during recessions and rise during expansions.
Nanaimo’s labour force participation rate for 2019 was 64.4%higher than Vancouver Island Coast
region but lower than BC and Canada.
P a g e 16 | 502020 Community Profile
Labour Force Participation Rate Comparison
Annual Averages
Nanaimo Van Isl & Coast BC Canada
70
68
66
64
62
PERCENT
60
58
56
54
52
50
2009 2010 2011 2012 2013 2014 2015 2016 2017 2018 2019
Nanaimo 62.8 64.7 60.7 59.3 61.8 61.4 51.6 58.7 62.8 64.9 64.4
Van Isl & Coast 63.8 63.4 60.7 59.6 59.9 57.7 58.2 58.8 60.8 61.5 59.0
BC 65.6 65.7 65.1 64.8 64.0 63.3 63.4 64.4 65.3 64.9 65.5
Canada 67.1 66.9 66.7 66.5 66.5 66 65.8 65.7 65.8 65.4 65.7
Source: Stats Canada
3.2 Income
Median, Average and Per Capita Income
In 2019, the median household income in the City of Nanaimo was $69,492. This is a 17.5%
increase in the last five years. By 2024, Nanaimo’s median household income is projected at
$83,428, a growth of 20.1%.
In 2019, the average household income in the City of Nanaimo was $88,057 an increase of 20.7%
in the past five years. Average household income is projected to reach $103,945 by 2024.
The per capita income in 2019 was $37,509, this is an increase of 19.7% in the past five years.
Projected per capita income for 2024 is $44,587.
P a g e 17 | 502020 Community Profile
City of Nanaimo
Median, Average & Per Capita Income
2024 2019 2014
Per capita income 37,509
Average household income 88,057
Median Household income 69,492
0 20,000 40,000 60,000 80,000 100,000 120,000
Source: Environics Analytics
The largest number of households in the city of Nanaimo (7,624) report household income
between $20,000 and $39,999 per annum. The second largest number of households (7,392)
report household income of $100,000 to $149,999 per annum. 32% of the households in
Nanaimo earned $100,000 or more in 2019.
Household Income Distribution
City of Nanaimo 2019
2%
$300,000+ 681
5%
$200,000+299,999 1857
8%
$150,000+199,999 3091
$100,000+149,999 18%
7392
Income
$80,000-$99,999 11%
4589
$60,000-$79,999 17%
5505
$40,000-$59,999 16%
6561
$20,000-$39,999 19%
7624
< $19,999 9%
3459
0 1000 2000 3000 4000 5000 6000 7000 8000
Number of Households
Source: Environics Analytics
P a g e 18 | 502020 Community Profile
3.3 Labour Force by Education
Nanaimo has a higher proportion of high school graduates (28.5%) compared to BC (26.5%) but
lower proportion of population holding some form of post-secondary accreditation. Nanaimo’s
portion of population with a bachelor’s level of education or above is 23.3% compared with BC’s
average of 29.9%.
Educational Attainment (25 to 64 years)
City of Nanaimo, 2016
University cert.diploma above bachlor level 7.9% 3,680
Bachlor's degree 15.4% 7,150
University cert. or diploma below bachelor 5.2% 2,430
College or non-university cert/diploma 22.3% 10,370
Apprenticeship/Trade certfificate/diploma 10.8% 4,990
High school diploma or equiv 28.5% 13,215
no certificate diploma or degree 9.9% 4,580
0 2,000 4,000 6,000 8,000 10,000 12,000 14,000
Source: Stats Canada 2016 Census
P a g e 19 | 502020 Community Profile
3.4 Major Employers
Telephone
Business Name Address City Prov Zipcode (250) Sector Employees
Nanaimo Reg Gen Hospital 1200 Dufferin Cres Nanaimo BC V9S 2B7 755-7691 Healthcare 2,200
School District No 68 Nanaimo 395 Wakesiah Ave Nanaimo BC V9R 3K5 754-5521 Education 1,800
Vancouver Island University 900 Fifth Street Nanaimo BC V9R 5S5 753-3245 Education 1,030
680 Trans Canada
BC Ferries Hwy Nanaimo BC V9S 5R1 716-7131 Transport 700
City of Nanaimo 455 Wallace Street Nanaimo BC V9R 5J6 754-4251 Mun Gov 639
Save-on-foods (5 locations) Island Hwy Nanaimo BC V9S 5W3 390-4517 Retail 536
Harmac Pacific (NFP) 1000 Wave Place Nanaimo BC V9X 1J2 722-3211 Forestry 400
Walmart Supercenter 100-3200 Island Hwy Nanaimo BC V9T 6N8 390-2344 Retail 295
Coast Bastion Hotel & Rest 11 Bastion Street Nanaimo BC V9R 6E4 753-6601 Hotel 290
Regional District of Nanaimo 6300 Hammond Bay Nanaimo BC V9T 6N2 390-4111 Reg Gov 268
Real Canadian Superstore 6435 Metral Drive Nanaimo BC V9T 2L9 390-5700 Retail 250
Costco Wholesale 6700 Island Hwy Nanaimo BC V9V 1K8 390-3231 Retail 200
Home Depot 6555 Metral Drive Nanaimo BC V9T 2L9 390-9093 Retail 180
Vancouver Island Regl Library 6250 Hammond Bay Nanaimo BC V9T 6M9 933-2665 Library 180
Western Forest Products Inc Port Nanaimo BC V9R 734-4700 Forestry 180
Lowe's Home Improvement 4750 Rutherford Nanaimo BC V9T 4K6 760-1001 Retail 150
Thrifty Foods (2 locations) 5801 Turner Road Nanaimo BC V9R 5E2 728-4950 Retail 141
Central Vancouver Island Hlth 1665 Grant Nanaimo BC V9S 5K7 755-6200 Healthcare 130
Great Canadian Casinos Inc 620 Terminal Ave Nanaimo BC V9R 5E2 753-3033 Entertain. 130
Hudson's Bay 6631 N Island Hwy Nanaimo BC V9T 4T7 390-3141 Retail 130
Mnp Llp 345 Wallace Nanaimo BC V9R 5B6 753-8251 Accounting 118
Morrison Hershfield Ltd 630 Terminal Ave Nanaimo BC V9S 4K2 755-4025 Engineering 101
P a g e 20 | 502020 Community Profile
4.0 DEVELOPMENT TRENDS & REAL ESTATE
4.1 Building Permits
Value of Building Permits 2019
480
460 City of Nanaimo
440 $445.3
420
400
380
360
340
320
300
280
260
Millions
240 $228.9
$204.6 $212.0 $203.6 $216.0
220
200
180
160
140
120
100
80
60
40
20
0
2014 2015 2016 2017 2018 2019
Residential 142.8 157.0 160.0 161.0 186.1 340.0
Commerical 60.4 39.2 36.0 24.5 26.2 80.4
Industrial 7.0 2.9 5.3 6.5 1.2 10.0
Public 17.5 4.5 10.5 10.5 1.5 13.9
Misc 1.1 0.8 0.8 0.8 1.0 1.0
Total $228.9 $204.6 $212.0 $203.6 $216.0 $445.3
Source: Nanaimo Economic Development, City of Nanaimo
2019, was an all-time record breaking year for building permit activity. At $445.3 million building
permit values increased by 106% over 2018. Prior to 2019, the highest year recorded for
building permit activity was 2007at $253 million.
Overall, residential permits accounted for 76% of the total value of building permits, commercial
for 18%, and industrial and public combined for 5.3%. In 2019 growth occurred in each category
of building permits issued. Residential permits grew by 83%, commercial by 207%, industrial
by 733% and public by 827% over 2018 values. Non-residential building permit values nearly
quadrupled in 2019 in comparison to 2018.
4.2 Housing Starts
Housing starts, like building permits, are a leading indicator of economic activity. Increases in
housing starts are indicative of a strong or improving economy. While decreases may indicate
economic activity is slowing.
P a g e 21 | 502020 Community Profile
In 2019, 1,259 housing units were started, 236 were single family dwellings and 965 were multi-
family dwellings. Overall in 2019 there was 60% growth in housing starts compared to 2018.
Housing Starts by Type
City of Nannaimo 2019
1,400
1,259
1,200
991
965
1,000 878
850
785
800
600
477
433 425 431
384 374 364
400
270 236
200
70 62
22 40 41 32 57 22 40 18
-
2015 2016 2017 2018 2019
Single Semi-Detached Row Apt & Other Total
Source: Canada Mortgage & Housing Corporation
4.3 Housing
There is a wide range of housing choices in Nanaimo, from waterfront estates to condos. Because
of the mountainous terrain, many properties offer spectacular views and all residents have access
to the waterfront from public access paths. Due to the areas recent population growth, much of
the housing has been built within the past 25 years.
Single-detached homes make up the majority of housing in the area. As the city grows the mix of
housing is changing, with a proportional decline in single family residences and an increase in
multi-family housing types. In total, there were 39,165 dwelling units in the City of Nanaimo at
the time of the 2016 Census.
Despite the area’s population growth, Nanaimo remains an affordable place to live. The average
single family detached home in Nanaimo was $566,023 in 2019. Housing in Nanaimo is
considerably more affordable when compared to other near metropolitan areas such as Victoria
and Greater Vancouver.
Real estate sales are handled by the Vancouver Island Real Estate Board (VIREB). There are
389 real estate agents and 23 offices that serve the Nanaimo market. The Vancouver Island Real
Estate Board also provides statistical information about the real estate market in Nanaimo and
other communities on Vancouver Island.
P a g e 22 | 502020 Community Profile
Dwellings by Structure Type City of Nanaimo
2016 2019
Houses
Single-detached house 21,245 21,577
Semi-detached house 1,910 1,991
Row house 1,880 1,999
Apt, Building Low/High Rise
Apt Buidling 5+ stories 1,240 1,294
Apt Buidling2020 Community Profile
Residential Rental Market
The 2016 Census indicated that 30.2% of Nanaimo residents rent the dwelling they live in, while
69.8% own their home.
Canada Mortgage and Housing Corporation (CMHC) conducted their annual rental market survey
of Nanaimo in October 2019. The table on the following page profiles the average rents and
vacancy rates for various types of rental accommodation in Nanaimo. Overall rent in Nanaimo
increased by 8% in 2019 over the previous year.
Rent - City of Nanaimo
Bachelor One Bedroom Two Bedroom Three+ Bedroom Total
2018 $ 795 $ 886 $ 1,084 $ 1,265 $ 966
2019 $ 889 $ 946 $ 1,170 $ 1,306 $ 1,039
% Change ↑ 11% ↑ 7% ↑ 8% ↑ 3% ↑ 8%
Number of Units - City of Nanaimo
Bachelor One Bedroom Two Bedroom Three+ Bedroom Total
2018 314 1917 1499 123 3853
2019 354 1928 1569 127 3978
% Change ↑ 13% ↑ 1% ↑ 5% ↑ 3% ↑ 3%
% Change 13 1 5 3 3
Source: Canada Mortgage and Housing Corporation
Overall, the number of total private apartment units available for rent increased by 3% between
2018 and 2019. Despite this, increased demand put downward pressure on vacancy rate
brining it further down by .5% to 2.0%
P a g e 24 | 502020 Community Profile
Source: Canada Mortgage and Housing Corporation
Senior’s Housing Market
The overall vacancy rate for standard space in senior’s residences in the Nanaimo region was
2.2% in 2019, compared to 3.0% in 2018. Demand for seniors’ housing was mainly supported by
a growing senior’s population. 318 new units were added to existing supply in 2019. Rising
demand also led to average rent increases during this period.
Nanaimo Region Seniors' Housing
Rental Vacancy Rate
12.0
9.6
10.0
7.5
8.0
6.0
4.0 2.8
3.0 2.2
1.7
2.0
0.0
2014 2015 2016 2017 2018 2019
Source: Canada Mortgage and Housing Corporation
P a g e 25 | 502020 Community Profile
Seniors' Housing Average Rents & Vacancy Rates
Independent Living Spaces
Average Rent Vacancy Rate
Type 2019 2018 2019 2018
Bachelor $2,502 $1,588 2.4% 2.2%
1 Bedroom $3,019 $2,815 2.2% 2.6%
2 Bedroom $4,075 $3,564 2.1% 6.9%
Total $3,038 $2,710 2.2% 3.0%
Source: Canada Mortgage and Housing Corporation,includes Nanaimo CA and Parksville CA
4.4 Commercial Rental Market
Commercial rental rates in Nanaimo are significantly lower for each class of space compared with
Vancouver and Victoria markets. The costs in the table below are based on weighted average
gross rental rates asking per square foot gross.
Class Nanaimo Downtown Vancouver Suburban Vancouver
A $34 $54.50 $35.18
B $24 $45.30 $28.21
C $18 $35.89 $22.06
Average * $25 $48.00 $33.50
*Note Class AAA rates not included for any geographies
(Source: Colliers International, NAI, Remax Commercial division)
P a g e 26 | 502020 Community Profile
4.5 Major Projects
2019 Major Projects - Value $2 million or more
(Building Permit Issued)
Address Description Value of Construction
77 Chapel Street 24-storey mixed-use residential building $ 64,000,000.00
10 Buttertubs Drive 159-unit affordable senior housing $ 27,800,000.00
100 Gordon Street 9-storey, 172-unit hotel $ 22,000,000.00
2020 Estevan Road New church, 74 residential rental units $ 20,500,000.00
20 Barsby Avenue Multi-family apartment building $ 15,000,000.00
1515 Dufferin Crescent 5-storey medical center and parkade $ 12,048,800.00
15 Front Street 6-storey, 89-unit hotel $ 9,000,000.00
119 Haliburton Street Multi-family apartment building $ 6,668,886.00
1608 Bowen Road Multi-family apartment building $ 6,116,714.00
6973 Island Highway N. Multi-family apartment building $ 6,000,000.00
6975 Island Highway N. Multi-family apartment building $ 5,500,000.00
3421 Uplands Drive Non-profit affordable rental units $ 5,059,000.00
4900 Uplands Drive 1-storey building for retail use $ 5,000,000.00
1885 Boxwood Road 2 commercial shell buildings $ 3,615,615.00
285 Rosehill Street 23-unit supportive housing $ 2,800,000.00
548 Steeves Road 1 Fourplex, 2 Triplexes (Phase 1) $ 2,730,000.00
1200 Dufferin Crescent MRI addition and anciallary spaces (NRGH) $ 2,380,000.00
1965 Boxwood Road 2-storey repair garage with offic space $ 2,185,711.00
1925 Boxwood Road 1-storey commercial shell building $ 2,062,177.00
2018 Major Projects - Value $2 million or more
(Building Permit Approved)
Address Description Value of Construction
5085 Uplands Drive Multi-family apartment building $ 8,884,558.00
91 Chapel Street Six-storey mixed-use building $ 8,647,959.00
6971 Island Highway N. Multi-family apartment building $ 7,500,000.00
6540 Metral Drive Multi-family apartment building $ 7,413,791.00
20 Prideaux Street Multi-family apartment building $ 6,000,000.00
6544 Metral Drive Multi-family apartment building $ 5,211,078.00
525 Third Street Three-storey mixed-use building $ 4,000,000.00
858 Georgia Avenue Multi-family apartment building $ 3,631,218.00
2073 Boxwood Road 1-storey building for sales/service $ 3,345,000.00
440 Selby Street Four-storey, 45-unit hotel $ 2,846,599.00
609 Bruce Avenue 3 commercial shell buildings $ 2,750,000.00
4950 Uplands Drive 1-storey building for retail use $ 2,600,000.00
6545 Portsmouth Road 3-storey shell commercial building $ 2,190,074.00
308 Hillcrest Avenue 2 three-storey fourplexes $ 2,096,113.00
5646 Linley Valley Drive 1 fourplex, 1 single residence, 1 triplex $ 2,000,000.00
Source: Nanaimo Economic Development, City of Nanaimo
P a g e 27 | 502020 Community Profile
5.0 TRANSPORTATION & LOGISTICS
Nanaimo is a transportation gateway and a central destination for Vancouver Island. Nanaimo
has a comprehensive transportation network designed to support and promote the growth of
existing businesses and to facilitate the establishment of new operations. Nanaimo has a modern
and efficient transportation network, with an airport, seaplane terminal, Helijet service, two ferry
terminals, highway system, and a public transit system. The average commute time from the
outer boundaries of the city to downtown is 15 minutes.
The city is easily accessible to the mainland by ferry, air, and to other Vancouver Island
destinations by road. Deep-sea shipping facilities are available through the Port of Nanaimo and
Seaspan Ferries. Businesses have a range of options to access markets, customers and
suppliers.
Distance to other major centres from Nanaimo
Vancouver, BC 61 km 38 miles
Victoria, BC 113 km 70 miles
Campbell River, BC 153 km 95 miles
Seattle, Washington 217 km 135 miles
Calgary, Alberta 983 km 609 miles
Edmonton, Alberta 1,163 km 721 miles
5.1 Air Transportation
Airport
The Nanaimo Airport (YCD) has a 6,600 ft. runway capable of accommodating 737-700W aircraft.
YCD’s Instrument Landing System (ILS) allows the airport to be over 99% weather reliable. The
Nanaimo Airport Authority is continuously making investments to improve the airport
infrastructure, attract new carriers, new tenants and add new destinations. The Nanaimo airport
completed a $15 million terminal expansion in 2019. The Nanaimo Airport is serviced by Air
Canada, WestJet and Island Express.
For additional information, please visit www.nanaimoairport.com
P a g e 28 | 502020 Community Profile
The Nanaimo Seaplane Terminal operated by the Nanaimo Port Authority, provides facilities for
seaplane flights from downtown Nanaimo. Regularly scheduled flights to downtown Vancouver
and Vancouver International Airport are available through Harbour Air, and Seair Seaplanes with
a flight time of only 20 minutes. Harbour Air flies to nine destinations in British Columbia with
frequent service between Nanaimo and the lower mainland. Sunshine Coast Air provides flight
service between Nanaimo and Sechelt as well as Victoria.
Helijet provides 14 scheduled flights between 7am and 7pm on weekdays from the Nanaimo
Cruiseship Welcome Centre to downtown Vancouver. Helijet is equipped to operate in daylight,
after dark and in most inclement weather. For more info visit:
Harbour Air Seaplanes www.harbourair.com Seair Seaplanes www.seairseaplanes.com
Sunshine Coast Air www.sunshinecoastair.com Helijet www.helijet.com
Nanaimo Airport Passengers
600,000
500,000
400,000
300,000
200,000
100,000
-
2014 2015 2016 2017 2018 2019
Airport Passengers 270,426 312,117 340,861 358,184 435,349 491,499
Source: Nanaimo Airport
5.2 Marine Transportation
Nanaimo Port Authority
Nanaimo is Vancouver Island's largest commercial port, with four berths and over 21ha (88
acres) of paved storage space, covered warehousing space and barge loading facilities.
Nanaimo offers deep sea ship anchorages and a 104 metric tonne capacity crane. Located 36
nautical miles west of Vancouver and centrally located on Vancouver Island, the Nanaimo Port
Authority is the region's most convenient load centre port. In 2019, 4.6 metric tonnes of cargo
volume and 5.7 million passengers moved through the Port Authority. A new BC Vehicle
Processing Centre, an investment totalling $19 million was completed in 2019. This terminal is
the initial offloading and detailing centre for European automobiles that are shipped to dealerships
across Western Canada.
P a g e 29 | 502020 Community Profile
Seaspan
Seaspan, located at Duke Point, offers regular roll-on/roll-off barge service between Nanaimo
and Vancouver. For further information on schedules and rates please visit www.seaspan.com.
Cruise Ship Terminal
In 2011, the Nanaimo Port Authority opened a new $25 million floating cruise ship terminal and
Welcome Centre. The Nanaimo Port Authority is working with the cruise lines to welcome more
cruise ships annually to Nanaimo. For more information, please visit www.npa.ca.
BC Ferries
Regularly scheduled ferry service is available between Nanaimo and Vancouver from two terminal
locations. There are approximately 16 scheduled sailings daily. The ferries are capable of
carrying approximately 370 vehicles (including trucks and commercial vehicles) and over 1,650
passengers. In 2019-20, more than 5.1 million passengers and 1.99 million vehicles travelled
between Nanaimo and Vancouver. (BC Ferries fiscal year runs from April 1 to March 31st). For
further information visit www.bcferries.com.
P a g e 30 | 502020 Community Profile
Source: BC Ferries
5.3 Road Transportation
Public Transit
Nanaimo Regional Transit is the first transit system in B.C. to make the switch to compressed
natural gas (CNG). CNG burns cleaner than diesel, and engines running on natural gas operate
much quieter. The RDN Transit System provides both regular transit (conventional transit) and
handyDART (custom transit) service. RDN Transit is an integrated system with service in urban
centres and rural areas, providing dedicated connections to shopping, educational and
recreational facilities.
Public transit is provided by the Nanaimo Regional Transit System with service between 6:40 am
and 11:00 pm. Buses run every 15 minutes during peak hours on core runs, and every half an
hour during off-peak times. For more information visit www.rdn.bc.ca.
P a g e 31 | 502020 Community Profile
6.0 TELECOMMUNICATIONS
The City of Nanaimo is well served by the national and local telecommunication providers. High
speed and high capacity voice and data services are available connecting customers worldwide.
Nanaimo is serviced by multiple data cables leading off the island, and thereby ensuring that your
business connections are reliable and always available.
Telus, Bell, Shaw and Allstream all provide a full suite of services in Nanaimo. Each of these
national companies can meet all of your voice and data requirements. In addition to these
established organizations, you will find many smaller competitive companies that can also provide
similar services for your business.
High speed internet connectivity is available throughout the city. The downtown area of Nanaimo
is exceptionally well serviced. Gigabit internet speed is available from multiple providers and
4G/LTE wireless speeds are available from both national networks. All city facilities offer free Wi-
Fi.
Nanaimo is a 911 service area. This emergency service is available through all wireline and
wireless telephone providers.
Telus
In 2019 Telus completed a comprehensive $65 million fibre to the premise network throughout
the City of Nanaimo to serve residential and business customers. This network ensures Nanaimo
is ready for 5G technology. In addition, Telus provides cellular coverage through a network of
tower sites that support the latest LTE+ wireless communication speeds. Telus provides full voice
and data services from its office located in downtown Nanaimo at 400 Fitzwilliam Street. Voice
service rates range from single business line to full PBX with PRI and VOIP. Internet connectivity
is provided for residential, SMB (Small, Medium size Businesses) and large organizations with
ADSL and dedicated high-speed fibre connections. For additional information, contact Telus at 1-
888-811-2828.
Shaw
Shaw has become a significant provider of voice and data services and they provide this full
service in Nanaimo. They have complete coverage of the city with their co-axial and fibre optic
cabling network. They also have a full service state-of-the-art production facility in Nanaimo. Shaw
provides internet and telephone service to residential customers and SMBs. Additional
information about these and other services can be obtained directly from Shaw at 250-760-1999.
Allstream
Allstream provides limited services in Nanaimo, focused primarily on data communications and
support services. They will provide internet connectivity for your business, as well as service for
your telephone and data processing equipment. For more information, contact Allstream at 1-888-
288-2273.
Bell
Bell provides full data and voice communications services in Nanaimo, focusing primarily in the
downtown core. They can provide for your fully wireline and wireless voice needs, and share the
3G high-speed wireless service with Telus. For more information about Bell’s services, contact
Bell at 1-800-561-0934.
P a g e 32 | 502020 Community Profile
Rogers
Rogers Communications is a leading provider of Wireless service in Nanaimo. They are supported
through their retail outlets and business customer service agents. For more information, contact
Rogers at 1-800-980-5464.
7.0 BUSINESS CLIMATE
7.1 Municipal Tax Rates
Overall tax rates in Nanaimo are lower than similar sized cities such as Prince George and
Kamloops. For residential class, Nanaimo’s tax rates are below Prince George and Kamloops.
Major and light industrial tax rates are significantly lower in Nanaimo than both Kamloops and
Prince George.
Nanaimo Kamloops Prince George
2017 2018 2019 2017 2018 2019 2017 2018 2019
Residential 8.1 6.9 6.9 8.5 7.7 7.7 11.5 10.8 10.8
Utilities 64.6 57.3 57.3 56.9 56.4 56.4 61.4 60.3 60.3
Supportive
Housing 6.3 5.4 5.4 6.5 5.8 5.8 9.0 8.5 8.5
Major Industry 19.4 18.1 18.1 81.6 78.6 78.6 53.6 58.9 58.9
Light Industry 21.9 20.0 20.0 28.9 26.8 26.8 36.7 35.0 35.0
Business/other 21.3 19.4 19.4 20.7 19.3 19.3 25.0 23.6 23.6
Managed Forest
Land 26.2 23.5 23.5 21.3 20.9 20.9 13.2 12.6 12.6
Recreation/non
profit 13.4 12.9 12.9 17.7 17.6 17.6 11.7 10.7 10.7
Farm 4.7 4.8 4.8 21.3 21.6 21.6 10.2 10.2 10.2
Total 186.1 168.2 168.2 263.2 254.6 254.7 232.2 230.7 230.6
Source: City of Nanaimo, City of Kamloops, City of Prince George
Note: Tax rates are per $1,000 of assessed value
7.2 Development Services
The City of Nanaimo’s Official Community Plan (OCP) provides direction on land use and
development within the city boundaries. A complete copy of the OCP is available on the city’s
website at www.nanaimo.ca . The city charges fees to offset the cost of processing development
applications, and to recover a portion of the costs of a new development. A number of
development review processes are required by the city including: Development Permits, Building
Permits, Development Variance Permits, Business Licenses and Land Use Changes, such as
rezoning. Any proposed land use or development must be consistent with its OCP designation
and meet zoning and other city bylaw and safety requirements. For more information visit
www.nanaimo.ca.
All businesses operating in the city are required to have a valid business license. For most
business types the business license fee is $165 per annum. For more information, visit the
Business Licensing section at www.nanaimo.ca.
P a g e 33 | 502020 Community Profile
7.3 Development Cost Charges (DCCs)
Small Lot Multifamily Commercial/ Mobile Camp
Categories SFD SFD Dwelling Institutional Industrial Home Ground
$ per m2 of $ per m2 of $ per m2
$ per lot $ per lot GFA* GFA* of GFA* $ per unit $ per unit
Sanitary Sewer $1,787.04 $1,250.93 $10.77 $10.22 $2.61 $1,098.28 $279.22
Drainage 75.94 56.2 **0.38 **0.38 **0.38 49.36 15.19
Water Distribution 306.34 214.44 1.85 1.75 0.45 188.27 47.87
Water Supply 5,619.55 3,933.69 33.86 32.14 8.2 3,453.68 878.06
Parks 1,249.32 874.52 7.53 - - 767.81 195.21
Roads 5,824.08 4,076.86 35.09 33.31 8.49 3,579.38 922.15
City Total $14,862.27 $10,406.64 $89.10 $77.42 $19.75 $9,136.78 $2,337.70
RDN Sanitary+ 2,951.37 2,951.37 17.4 17.66 4.5 1,748.81 482.21
TOTAL $17,813.64 $13,358.01 $106.50 $95.08 $24.25 $10,885.59 $2,819.91
* Gross Floor Area
** Drainage DCCs will be charged per m2 of lot coverage (m2 of first floor)
*** Row-housing lot or a residential lot < 370m2
+ Consult with City staff regarding the RDN DCC boundary
Source: Nanaimo Economic Development, City of Nanaimo
7.4 Financial Tax Incentives
The City of Nanaimo provides incentives for development under a number of tax exemption and
grant funding programs.
Downtown Revitalization Tax Exemption Program – Designed to expand the downtown
housing stock and commercial developments.
Hotel Motel Revitalization Tax Exemption Program – Designed to encourage the development
and redevelopment of hotels and motels to improve the inventory of quality accommodation within
the City of Nanaimo.
Heritage Building Tax Exemption Program – To encourage new downtown residential units in
existing heritage buildings and to preserve heritage buildings in the downtown core.
Heritage Facade Improvement Grant Program – To encourage the rehabilitation and
enhancement of heritage buildings in the downtown core.
Heritage Home Grant Program- To encourage homeowners of heritage buildings to fix up and
maintain historic homes.
For further information on these grant programs visit www.investnanaimo.com.
P a g e 34 | 502020 Community Profile
8.0 UTILITIES
8.1 Electricity & Natural Gas
BC Hydro, a crown corporation, operates 31 hydroelectric facilities and three thermal generating
plants, totaling 12,000 megawatts (MW) of installed generating capacity. BC Hydro has a network
of over 18,500 kilometres of transmission lines and 57,648 kilometres of distribution lines. This
network also includes approximately 300 substations, 900,000 utility poles and 325,000 individual
transformers. The system connects with other transmission systems in Alberta and Washington
State to improve the overall reliability of the system.
Fortis BC provides electricity, natural gas, propane, and integrated energy solutions such as
geothermal and district energy. As an integrated energy solutions provider, FortisBC owns and
operates four regulated hydroelectric generating plants, approximately 7,000 kilometres of
transmission and distribution power lines and approximately 47,000 kilometres of natural gas
transmission and distribution pipelines.
For electricity and natural gas rates visit:
BC Hydro www.bchydro.com
FortisBC www.fortisbc.com
8.2 Water & Sewer
Drinking Water
The City of Nanaimo’s drinking water supply is from a protected community watershed, consisting
of over 200 square kilometers of private managed forest land. The city owns and operates two
dams within the watershed, to impound enough water to ensure a sustainable supply for drinking,
firefighting and environmental needs in the river. From the watershed, two major supply pipelines
convey water to the South Fork Water Treatment Plant. The Water Treatment Plant, new in 2016,
filters and conditions the water and produces an exceptionally clear drinking water. Drinking water
is distributed to city residents via over 600km of piping.
Wastewater
The City of Nanaimo operates the sewer collection system within city limits, discharging to large
interceptor sewers that run the length of the foreshore. The Regional District of Nanaimo owns
and operates the Greater Nanaimo Pollution Control Centre – the wastewater treatment plant is
currently undergoing an $80 million upgrade to comply with new regulations.
For information about sewer or water levies, contact the City of Nanaimo Finance Department at
250-754-4251.
8.3 Waste Management
The City of Nanaimo provides weekly curbside collection of garbage, recycling and kitchen/yard
waste organic matter. The service uses standardized carts and automated collection vehicles to
28,000 residential addresses. City garbage services are not extended to businesses. Businesses
contract garbage and recycling collection and disposal to private operators. The Regional District
of Nanaimo operates a landfill and is responsible for the regional Solid Waste Management Plan
– targeting zero waste. The Nanaimo region is a national leader in waste reduction.
P a g e 35 | 502020 Community Profile
9.0 COMMUNITY SERVICES AND QUALITY OF LIFE
9.1 Government
9.1.1 Municipal Council
The City of Nanaimo is led by Mayor Regional District of Nanaimo
Leonard Krog and eight Council members.
Municipal elections are held every four Directors Municipality/Electoral Area
years, with the next election to be held in Ian Thorpe City of Nanaimo
October 2022. City departments include
Bob Rogers Electoral Area E
Human Resources, Legislative Services,
Nanaimo Fire Rescue, Corporate Services, Stuart McLean Electoral Area H
Development Services, Engineering and Keith Wilson Electoral Area A
Public Works, Parks & Recreation. Vanessa Craig Electoral Area B
Maureen Young Electoral Area C
For additional information on City Hall, Leanne Salter Electoral Area F
please visit www.nanaimo.ca or call
Clarke Gourlay Electoral Area G
(250)754-4251.
Leonard Krog City of Nanaimo
City of Nanaimo Sheryl Armstrong City of Nanaimo
Don Bonner City of Nanaimo
Title Name Tyler Brown City of Nanaimo
Mayor Leonard Krog Ben Geselbracht City of Nanaimo
Councillors Sheryl Armstrong Erin Hemmens City of Nanaimo
Don Bonner Jim Turley City of Nanaimo
Tyler Brown Ed Mayne City of Parksville
Ben Geselbracht Adam Fras City of Parksville
Erin Hemmens Mark Swain District of Lantzville
Zeni Maartman Teunis Westbroek Town of Qualicum Beach
Ian Thorpe
Jim Turley
9.1.2 Provincial Government 9.1.3 Federal Government
Premier Prime Minister
Name John Horgan Name Justin Trudeau
Party Affiliation NDP Party Affiliation Liberal
Elected May 29, 2017 Elected November 4, 2015
Members of the Legislative Assembly Ministers of Parliament
Electoral District Nanaimo Riding Name Nanaimo Ladysmith
MLA Sheila Malcolmson MP Paul Manly
Party Affiliation NDP Party Affiliation Green
P a g e 36 | 502020 Community Profile
9.2 Climate
Nanaimo has moderate climate, with over 1,800 hours of bright sunshine each year. During the
summer, the average daily high is 21°C (70°F), and during the winter months daily temperatures
normally remain above the freezing level.
AVERAGE* Jan Feb Mar Apr May Jun Jul Aug Sep Oct Nov Dec
Temperature (°C) 3.5 4.3 6.3 9 12.5 15.6 18.1 18.2 14.9 9.9 5.6 3.1
Rainfall (mm) 167.8 115.2 106.9 67.2 54.2 43.4 25.4 28.4 35.8 101.2 186.5 166.1
Snowfall (cm) 21 10.9 6.2 0.2 0.1 0 0 0 0 1.2 10.7 18.4
Source: Environment Canada
9.3 Communications & Media
9.3.1 Local Radio & TV Stations
Nanaimo is serviced by six local radio stations (see below), which offer a variety of different genres
of music and talk programming for their listeners. Nanaimo is serviced by three television stations,
Shaw TV, Chek News and CTV offering programs and up-to-date news airing at numerous times
throughout the day.
102.3 FM The Wave 101.7 FM CHLY
106.9 FM The Wolf For more information, visit www.chly.ca
88.5 FM The Beach
99.9 FM The Lounge 91.7 Coast FM
For more information, visit www.islandradio.ca For more information visit www.mycoastbiw.com
9.3.2 Newspapers
The Nanaimo News Bulletin is the city’s printed newspaper. They provide print and online issues.
For more information, visit www.nanaimobulletin.com.
9.3.3 News Websites
Nanaimo has an online local news source called NanaimoNewsNOW. For more information, visit
www.nanaimonewsnow.com.
9.3.4 City Living
Nanaimo is the fifth largest urban centre in British Columbia. Nestled between the mountains and
the ocean Nanaimo offers an enviable lifestyle and first-rate infrastructure with all the urban
amenities. Nanaimo is a classic West Coast community offering natural beauty at every turn, and
vast recreation potential.
9.3.5 Recreation
Nanaimo offers a variety of recreational activities. Nanaimo boasts over 200 parks, 63
playgrounds, four public beaches, 20 picnic areas, three pools, four indoor ice rinks and three golf
courses. Residents can enjoy a leisurely stroll along the waterfront sea wall, or a vigorous hike
up Mount Benson. The City of Nanaimo’s Parks and Recreation Department provides a
comprehensive year-round program of activities for residents of all ages and interests.
P a g e 37 | 502020 Community Profile
Newcastle Island (Saysutshun) is a charming provincial park just off the shores of downtown
Nanaimo. It is a popular summertime picnic and camping area. Buttertubs Marsh, in the heart of
the city, is a wonderful place to view waterfowl and learn about our delicate ecosystem. Neck
Point Park is a 14.5 hectare oceanfront park known for its views and natural features. The park
has a vast trail system of varying lengths and difficulty and offers a number of amenities including
picnic areas, viewpoints and lookouts. The Linley Valley Park is a 182.2ha (450.23 acres)
undeveloped park recently acquired by the City of Nanaimo. The Linley Valley contains many old
growth trees, open meadows and wetlands. Residents enjoy the informal walking trails, the
beautiful scenery and the abundance of wildlife.
During the late fall and early winter months, Nanaimo becomes home to thousands of Stellar and
California sea lions and bald eagles grace our skies throughout the year.
Outdoor adventures include paddling, hiking, biking, golfing, and bungee jumping. Those ocean
waters are the source of many activities, including sailing, fishing, and kayaking. Spend the day
paddling around Newcastle Island, or get out on a charter to become the next great angler. Take
your adventure to new depths on a snorkelling or scuba diving expedition. Beaches at local ocean
parks such as Piper’s Lagoon, Departure Bay, Neck Point, and Swy-A-Lana Lagoon, offer a
myriad of opportunities for swimming, windsurfing, and snorkelling, complete with incredible sea
life just below the surface.
P a g e 38 | 50You can also read