The role of termite CH4 emissions on the ecosystem scale: a case study in the Amazon rainforest
←
→
Page content transcription
If your browser does not render page correctly, please read the page content below
Biogeosciences, 18, 2609–2625, 2021
https://doi.org/10.5194/bg-18-2609-2021
© Author(s) 2021. This work is distributed under
the Creative Commons Attribution 4.0 License.

The role of termite CH4 emissions on the ecosystem scale:
a case study in the Amazon rainforest
Hella van Asperen1 , João Rafael Alves-Oliveira2 , Thorsten Warneke1 , Bruce Forsberg3,a ,
Alessandro Carioca de Araújo4,5 , and Justus Notholt1
1 Instituteof Environmental Physics (IUP), University of Bremen, Otto-Hahn-Allee 1, 28359 Bremen, Germany
2 Coordenação    de Biodiversidade (CBIO), Instituto Nacional de Pesquisas da Amazônia (INPA),
Av. André Araújo, 2936, Aleixo, AM 69060-001, Manaus, Brazil
3 Coordenação de Dinâmica Ambiental (CODAM), Instituto Nacional de Pesquisas da Amazônia (INPA),

Av. André Araújo, 2936, Petrópolis, AM 69067-375, Manaus, Brazil
4 Programa de Grande Escala da Biosfera-Atmosfera na Amazônia (LBA), Instituto Nacional de Pesquisas da Amazônia

(INPA), Av. André Araújo, 2936, Aleixo, AM 69060-001, Manaus, Brazil
5 Brazilian Agricultural Research Corporation (EMBRAPA), Embrapa Amazônia Oriental, Tv. Dr. Enéas Piheiro, s/n,

Marco, PA 66095-903, Caixa postal 48, Belém, Brazil
a currently at: Vermont Agency of Natural Resources, Department of Environmental Conservation, Vermont, USA

Correspondence: Hella van Asperen (v_asperen@iup.physik.uni-bremen.de)

Received: 15 October 2020 – Discussion started: 16 November 2020
Revised: 11 February 2021 – Accepted: 25 February 2021 – Published: 26 April 2021

Abstract. The magnitude of termite methane (CH4 ) emis-               The role of termites in the ecosystem’s CH4 budget was
sions is still an uncertain part of the global CH4 budget and      evaluated by use of two approaches. Termite mound emis-
current emission estimates are based on limited field stud-        sion values were combined with local mound density num-
ies. We present in situ CH4 emission measurements of ter-          bers, leading to an estimate of 0.15–0.71 nmol CH4 m−2 s−1 ,
mite mounds and termite mound subsamples performed in              on average, emitted by termite mounds. In addition, the ter-
the Amazon rainforest. Emissions from five termite mounds          mite CH4 emission factor from this study was combined with
of the species Neocapritermes brasiliensis were measured by        termite biomass numbers, resulting in an estimate of termite-
use of a large flux chamber connected to a portable gas anal-      emitted CH4 of ∼ 1.0 nmol m−2 s−1 . Considering the rela-
yser measuring CH4 and CO2 . In addition, the emissions of         tively low net CH4 emissions previously measured at this
mound subsamples were measured, after which the termites           ecosystem, we expect that termites play an important role in
were counted so that a termite CH4 and CO2 emission factor         the CH4 budget of this terra firme ecosystem.
could be determined.
   Mound emissions were found to range between 17.0
and 34.8 nmol mound−1 s−1 for CH4 and between 1.1 and
13.0 µmol mound−1 s−1 for CO2 . A termite emission fac-            1   Introduction
tor of 0.35 µmol CH4 g−1 termite h
                                   −1 was found, which is almost

twice as high as the only other reported value for the Ama-        Methane (CH4 ) is one of the most important greenhouse
zon. By combining mound emission measurements with the             gases, but its natural sources are still not well understood.
termite emission factor, colony sizes could be estimated,          Anaerobic decomposition processes in wetlands are expected
which were found to range between 55–125 thousand indi-            to represent the largest natural CH4 source, but estimates re-
viduals. Estimates were similar to literature values, and we       main a large source of uncertainty (Kirschke et al., 2013;
therefore propose that this method can be used as a quick          Saunois et al., 2020). Recently, alternative CH4 production
non-intrusive method to estimate termite colony size in the        mechanisms and their possible important role on the ecosys-
field.                                                             tem scale have been proposed, such as CH4 production by

Published by Copernicus Publications on behalf of the European Geosciences Union.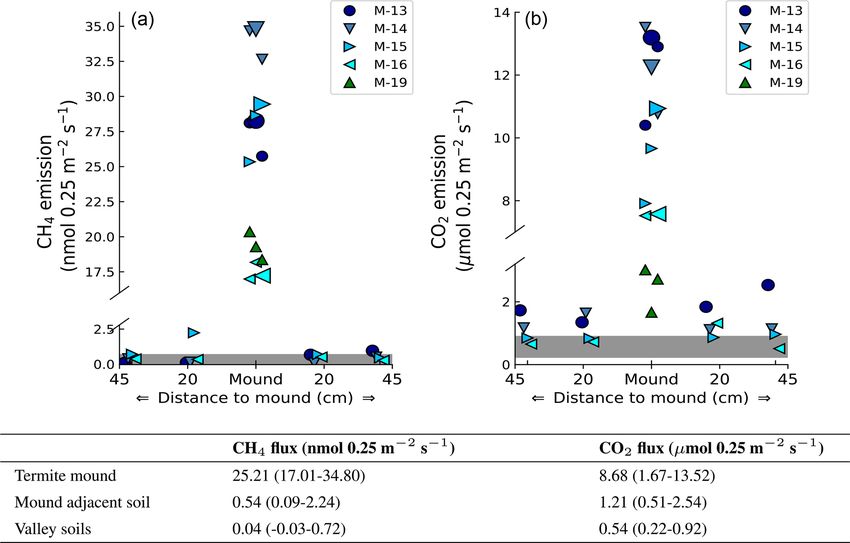
2610                                                               H. van Asperen et al.: Termite CH4 emissions in the Amazon

living vegetation (Bruhn et al., 2012; Wang et al., 2014),            2013; Sanderson, 1996; Saunois et al., 2020), which is ap-
CH4 emission due to photo and thermal degradation (Lee                proximately 0.5 %–4 % of the total estimated natural source
et al., 2012), or the transport of anaerobic soil-produced CH4        of CH4 emissions (Saunois et al., 2020). While global-scale
through wetland trees (Pangala et al., 2015; Rice et al., 2010).      termite emissions can be considered small in comparison to
An additional known CH4 source in tropical ecosystems is              natural sources like wetland emissions (∼ 147 Tg yr−1 ) or
emission by termites.                                                 fresh water emissions (∼ 159 Tg yr−1 ) (Saunois et al., 2020),
   Termites (Isoptera) can mostly be found between 45◦ N              the question of what their role can be in the CH4 budget of a
and 45◦ S and are especially abundant in warm ecosys-                 local tropical ecosystem remains.
tems (Bignell, 2006; Brian and Brian, 1978; Gomati et al.,               Estimates of global termite CH4 emissions are based
2011; Wood, 1988). They are highly socialised insects, liv-           on field and laboratory measurements. To estimate global
ing in large communities of up to several million indi-               CH4 termite emissions, most commonly the CH4 emis-
viduals (Wood, 1988). Termites are considered “ecosystem              sion per termite (mg CH4 termite−1 h−1 ) or termite mass
engineers”: they are known for decomposing organic sub-               (mg CH4 g−1           −1
                                                                                   termite h ) is measured, whereby termite mass
stances and moving and mixing organic and mineral mate-               can either be measured directly or be taken from literature
rials, thereby enhancing humus formation, modifying soil              (Sanderson, 1996). The disadvantage of this approach is that
structure, and improving soil fertility (Bignell, 2006; Brian         termites are removed from their natural environment, thereby
and Brian, 1978; Bignell and Eggleton, 2000; Mishra and               possibly changing their emission and behaviour. Another ap-
Sen-Sarma, 1980; De Bruyn and Conacher, 1990; Wood,                   proach is to measure termite nest CH4 emissions in situ in
1988). In addition, they are able to modify their environ-            the field. In this case, emissions are expressed per mound
ment to their needs: most termite species live in complex             or nest (mg CH4 mound−1 h−1 ). While this method does not
above- or (partly) below-ground nests where temperature and           disturb the natural environment, correct estimation of termite
moisture remain stable (Bignell, 2019; Noirot and Darling-            nest colony size is challenging; therefore, values are hard to
ton, 2000; Wood, 1988). Recently, it was shown that termites          convert to emission-per-termite values (Jones et al., 2005).
increase their activity during droughts, resulting in, among             Besides CH4 , termite emissions of other gases have also
other things, enhanced litter decomposition, elevated soil            been investigated, such as for CO2 , O2 , CO, H2 , CHCI3 ,
moisture, and higher seedling survival rates, thereby demon-          N2 O, and different hydrocarbons (Cook, 1932; Khalil et al.,
strating a mitigating effect during droughts in tropical rain-        1990; Zimmerman et al., 1982). In previous studies, mea-
forests (Ashton et al., 2019).                                        surements of termite CO2 emissions were often performed
   Three main groups of termites can be distinguished based           alongside CH4 emission measurements and generally a clear
on their main feeding habits: soil-feeding (humiverous) ter-          relationship between CH4 and CO2 emissions was found,
mites, which can mainly be found in and on the soil, decom-           of which the ratio is expected to be species dependent
posing decayed organic soil material; xylophagous termites,           (Seiler et al., 1984; Jamali et al., 2013). For termite-emitted
which feed on (decomposed) wood and can also be found                 CO2 , reported global estimates are 50 Pg yr−1 (Zimmerman
in living trees; and fungus-feeding termites, which live in a         et al., 1982), 4 Pg yr−1 (Khalil et al., 1990), and 3.5 Pg yr−1
symbiotic relationship with fungus (Eggleton, 2000; Sander-           (Sanderson, 1996) (1 Pg = 1000 Tg). In addition, Khalil et al.
son, 1996).                                                           (1990) observed mound CO uptake and emissions but re-
   CH4 production by termites was first described and mea-            ported them to be irregular and small. Strong termite mound
sured by Cook (1932). Follow-up studies found that methane            N2 O emissions have also been detected (Brümmer et al.,
is produced by almost all termite species and that its pro-           2009b; Brauman et al., 2015), although they were also found
duction takes place in the termite gut. In higher termites            to be very irregular or undetectable (Khalil et al., 1990; Zim-
(dominant in tropical forests; more evolved species with re-          merman et al., 1982). Brauman et al. (2015) suggested that
spect to diet and community complexity) CH4 production                termite mound N2 O emissions occur if nitrogen-rich organic
is caused by symbiotic bacteria, and in lower termites the            matter is available.
production is caused by flagellate protozoa (Bignell et al.,             Current global termite CH4 emission estimates are based
1997; Brune, 2018; Lee and Wood, 1971). In a laboratory               on relatively few studies, and there is still a lack of data on
experiment Zimmerman et al. (1982) measured the emission              termite CH4 emission rates (Brune, 2018). In addition, ex-
strength of individual termites and, by use of termite biomass        isting studies have mostly focused on Australian or Asian
numbers, presented a global termite emission estimate of              species (Eggleton et al., 1999; Fraser et al., 1986; Jamali
150 Tg CH4 yr−1 , which was estimated to be 40 % of the               et al., 2011a, b, 2013; Khalil et al., 1990; Macdonald et al.,
global natural CH4 emissions. Different estimates followed,           1998; Sugimoto et al., 1998a, b) or African species (Brau-
resulting in lower values, such as by Seiler et al. (1984) of         man et al., 1992; Brümmer et al., 2009a; Macdonald et al.,
2–5 Tg yr−1 , by Fraser et al. (1986) of 14 Tg yr−1 , by Khalil       1998; Rouland et al., 1993; Sawadogo et al., 2011, 2012;
et al. (1990) of 12 Tg yr−1 , and by Martius et al. (1993) of         Seiler et al., 1984). To our knowledge, only two studies fo-
26 Tg yr−1 . More recent literature uses estimates in the range       cused on CH4 emission of termites in the Amazon (Mar-
of 2–15 Tg CH4 yr−1 (Ciais et al., 2014; Kirschke et al.,             tius et al., 1993; Queiroz, 2004) and only one study reported

Biogeosciences, 18, 2609–2625, 2021                                                     https://doi.org/10.5194/bg-18-2609-2021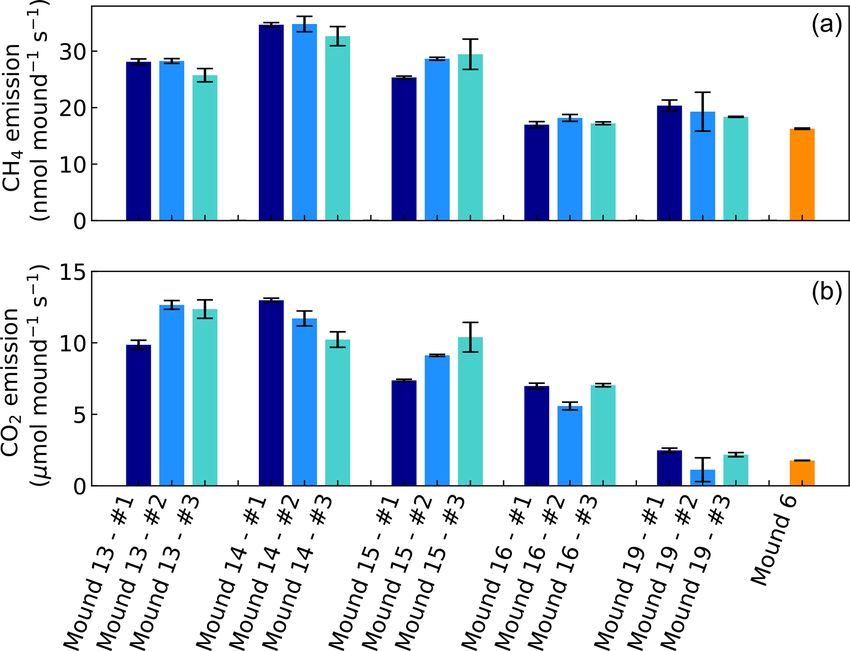
H. van Asperen et al.: Termite CH4 emissions in the Amazon                                                                       2611

CH4 emission values for Amazonian termites (Martius et al.,             sada et al. (2010), and Zanchi et al. (2014). Measurements
1993). Martius et al. (1993) performed field measurements               took place at the end of the wet season (March 2020).
on wood-feeding termites by semi-field and laboratory mea-
surements, and suggested that Amazonian termites release                2.2   Selection of termite mounds
more methane than species in other regions. In addition, for
the Amazon, it is expected that most termites are soil feed-            In the study area, two main trails exist following the topogra-
ing (Jones and Eggleton, 2010), a group which are expected              phy from valley to plateau, and termite nests in the vicin-
to be the strongest emitters of CH4 (Bignell and Eggleton,              ity of these trails were inventoried. For practical reasons,
2000; Brauman et al., 1992).                                            only free-standing epigeal (above-ground) nests were con-
   In this paper, we present a case study performed in a                sidered (hereafter called mounds). Twenty termite mounds
tropical rainforest in the Amazon, where we measured the                were selected for further research and for each mound the
emission of CH4 and other gases of epigeal (above-ground)               termite species was determined. For flux chamber measure-
termite nests of the species Neocapritermes brasiliensis, a             ments, five mounds with the same termite species were se-
soil-feeding species1 abundant in the Amazon (Constantino,              lected (nos. 13, 14, 15, 16, and 19); for practical reasons,
1992; Pequeno et al., 2013) and one of the most common                  chosen mounds were in close proximity to each other and
species in the region (Dambros et al., 2016). In addition we            all located in the valley. As an exploratory measurement, an
measured the CH4 emission of countable groups of termites.              additional mound of a different species was selected on the
The goal of our research was twofold. Firstly, we provide               plateau (no. 6). For each mound, height and perimeter were
the first CH4 and other gas emission measurements of the                measured. Termite mound volumes were estimated by use of
species N. brasiliensis, thereby expanding the limited litera-          the following formula, as also used in Ribeiro (1997) and in
ture on CH4 emissions from Amazonian termites. Secondly,                Pequeno et al. (2013):
we aim to quantify the role of termite emissions in the CH4                   πH WT
                                                                        V =         ,                                              (1)
budget of this specific ecosystem as part of a larger ecosys-                   6
tem CH4 budget study (in preparation). In addition, we are              where V is the mound volume (cm3 ), H is the height (cm), W
presenting a possible quick, non-intrusive field method to es-          is the width (cm), and T is the thickness (cm) of the mound.
timate termite colony size in situ.                                     The termite mound surface was estimated by mathematically
                                                                        considering the lower part of the mound as a column and the
                                                                        upper part as half a sphere. Details of each mound (dimen-
2     Material and methods                                              sions, species, location) are given in Table 1.

2.1    Study site                                                       2.3   Mound flux chamber setup

The study was conducted at the experimental field                       Collars (stainless steel, 15 cm height, 56.5 cm diameter) were
site Reserva Biológica do Cuieiras–ZF2 (2◦ 360 32.6700 S,               placed around the five selected termite mounds a week before
60◦ 120 33.4800 W, 40–110 m above sea level (a.s.l.)), which            the start of the measurements. Collars were inserted approxi-
is managed by the Instituto Nacional de Pesquisas da                    mately 5 cm into the soil and litter layer. A flux chamber was
Amazônia (INPA) and located ∼ 50 km northwest of Manaus                 created by use of a 220 L slightly cone-shaped polyethylene
(Brazil). Field site ZF2 consists of plateaus and valleys with          bucket, with a diameter of 57.5 cm. A strip of closed-pore
typical terra firme forest with tree heights of 35–40 m on the          foam (1 cm × 1 cm × 57.5 cm) was attached over the whole
plateaus and 20–35 m in the valleys. Soils on the plateau are           inner perimeter so that if the bucket was placed on the col-
clayey and can be classified as Oxisols and Ultisols. Soils in          lar, the foam strip would seal the part between the bucket and
the valleys contain more sand and can be classified as Spo-             the collar. Two one-touch fittings (1/4 in., SMC Pneumatics)
dosols (Luizão et al., 2004; Zanchi et al., 2014). The field            were installed on each side of the bucket. On the inside of the
site has a strong seasonality, with a wet season from De-               bucket, a four-inlet vertical sampling tube was placed so that
cember to April and a dry season from June to September.                air was sampled from different heights (∼ 10, ∼ 25, ∼ 35,
Annual average temperatures range between 26–28◦ C and                  and ∼ 50 cm) in the headspace (Clough et al., 2020). The
annual average precipitation is around 2400 mm. More in-                setup (chamber and tubing) was tested for internal emissions
formation about the field site can be found in Araújo et al.            of all measured gases. For CO (see Appendix), an internal
(2002), Chambers et al. (2004), Luizão et al. (2004), Que-              emission of < 0.014 nmol s−1 was found; the presented CO
                                                                        fluxes are not corrected for this possible internal emission.
    1 The species Neocapritermes brasiliensis is a wood–soil inter-        CH4 and CO2 concentrations were measured with a Los
face feeding species. Species feeding on extremely decomposed           Gatos Ultraportable Greenhouse Gas Analyser. The instru-
wood are in the centre of the “wood–soil decomposition gradient”        ment was connected in a closed loop with the flux chamber
termite classification (Bourguignon et al., 2011), but are classified   (2 × 2 m PTFE tubing, 1/4 in.). For air circulation, the inter-
as soil feeders according to Eggleton and Tayasu (2001).                nal pump of the Los Gatos instrument was used with a flow

https://doi.org/10.5194/bg-18-2609-2021                                                        Biogeosciences, 18, 2609–2625, 2021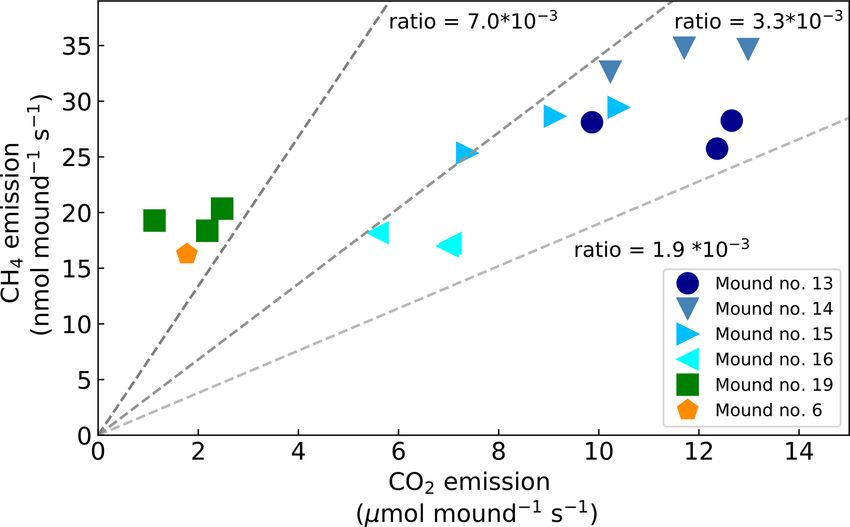
2612                                                                 H. van Asperen et al.: Termite CH4 emissions in the Amazon

Table 1. Termite mounds: location, dimensions, and observed species. Volume is the estimated mound volume as calculated by Eq. (1) and
surface is the estimated mound surface by mathematically considering the lower part of the mound as a column and the upper part as half a
sphere. In mound 1, two different termite species were found. N. bra stands for Neocapritermes brasiliensis, H. ten for Heterotermes tenuis,
R. bra for Rotunditermes bracantinus, and E. neo for Enbiratermes neotenicus. The five mounds indicated in bold (mound nos. 13, 14, 15,
16, and 19) were the mounds selected for flux measurements.

                             No.    Location     Height    Perimeter    Volume       Surface    Species
                             1      Valley       50 cm       128 cm                             N. bra, H. ten
                             2      Slope        45 cm       145 cm                             N. bra
                             3      Plateau      35 cm       128 cm                             N. bra
                             4      Plateau      55 cm       138 cm                             N. bra
                             5      Plateau      45 cm       148 cm                             R. bra
                             6      Plateau      47 cm        99 cm      33.8 L    4653 cm2     E. neo
                             7      Plateau      50 cm       160 cm                             E. neo
                             8      Slope        35 cm       160 cm                             E. neo
                             9      Valley       37 cm       105 cm                             N. bra
                             10     Valley       50 cm        94 cm                             N. bra
                             11     Valley       45 cm       111 cm                             N. bra
                             12     Valley       65 cm       125 cm                             N. bra
                             13     Valley       65 cm       150 cm      77.6 L    9750 cm2     N. bra
                             14     Valley       54 cm       118 cm      48.0 L    6372 cm2     N. bra
                             15     Valley       58 cm       121 cm      50.5 L    7018 cm2     N. bra
                             16     Valley       58 cm       120 cm      49.7 L    6960 cm2     N. bra
                             17     Valley       55 cm       157 cm                             N. bra
                             18     Valley       75 cm       130 cm                             N. bra
                             19     Valley       45 cm       105 cm      38.0 L    4725 cm2     N. bra
                             20     Slope        30 cm        92 cm                             N. bra

of ∼ 0.35 L min−1 . The instrument measures concentrations              of the chamber closure to avoid possible effects of the bag
every second; 10 s averaged concentrations were saved and               filling (see Appendix). If clear headspace concentration fluc-
used for flux calculations. For each measurement, the flux              tuations were observed in the beginning of this time window,
chamber was closed for 20 min, during which time concen-                possibly by a remaining effect of the bag filling, the win-
trations were measured continuously. All five mounds were               dow was shortened by a maximum of 2 min (leaving a time
always measured on the same day and in the same order.                  window of 8 min). All calculated dC/dt increases showed
Over one week, each mound was measured three times, each                an R 2 > 0.95. Unless mentioned otherwise, the given mound
time at approximately the same hour of the day.                         CO2 emissions are corrected for the estimated contribution
                                                                        of soil respiration by subtracting the average valley soil emis-
2.4    Flux calculations                                                sion (see Sect. 2.5). For mound no. 6, the average plateau soil
                                                                        emission was subtracted.
Fluxes were calculated as follows. By use of the ideal gas
law, mole fractions (mol mol−1 ) were converted to concen-              2.5    Valley and mound-adjacent soil fluxes
trations (mol m−3 ). For chamber temperature, a standard
temperature of 25 ◦ C was assumed. For chamber volume                   To quantify the CH4 and CO2 emissions of the soils adja-
(CV), the termite mound volume (Table 1) was deducted                   cent to the termite mounds, four soil collars were installed
from the bucket volume (220 L).                                         around each mound: two soil collars were placed at 20 and
   Fluxes could be calculated as follows:                               45 cm distance from the mound (distance between mound
       dC                                                               collar and middle of soil collar) and two additional soil
F=        · CV,                                                (2)      collars were placed on the opposite side of the mound at
       dt
                                                                        the same distances. The soil collars were of 20 cm diame-
where F is the mound emission (mol s−1 ), dC/dt is the                  ter with a height of 10 cm and were inserted 5 cm into the
concentration change (mol m−3 s−1 ), and CV the corrected               soil. The flux chamber height was 15 cm so that the soil
chamber volume (m3 ). Linear regression was used to de-                 chamber volume was 4.7 L. To be able to connect the Los
rive the concentration change and the given error bars are              Gatos instrument, the soil chamber had two one-touch fit-
the propagated standard error of the linear regression slope.           tings on top. The chamber and collars were created from a
Concentration increases were calculated over the last 10 min            common PVC sewage pipe. Every mound-adjacent soil flux

Biogeosciences, 18, 2609–2625, 2021                                                         https://doi.org/10.5194/bg-18-2609-2021
H. van Asperen et al.: Termite CH4 emissions in the Amazon 2613
measurement was 4 min, and the set of 4 collar measure-
ments was performed once per mound, with the exception of
mound no. 19. For mound nos. 13 and 14, the measurements
were performed on the second measurement day, for mound
nos. 15 and 16, the measurements were done on the third
measurement day. Mound-adjacent soil fluxes will be ex-
pressed per mound-collar area (0.25 m2 ) to be better compa-
rable to mound emissions. The same chamber setup was also
used in a substudy at a nearby transect (∼ 500 m from termite
mounds) where, among other things, valley soil (10 collars)
and plateau soil (10 collars) fluxes were measured (three rep-
etitions). Measured soil fluxes from the valley will be shown
for comparison.
2.6 Termite mound subsample emission measurements
After each last mound flux measurement, a mound sam- Figure 1. CH4 and CO2 emissions of mounds nos. 13–19 (in
ple was taken of approximately 1 L volume. From this, valley) and of mound no. 6 (on plateau) expressed in nmol and
three small subsamples were taken (volume not determined). µmol mound−1 s−1 , which represents a collar area of 0.25 m2 . All
When selecting a piece, we tried to look for solid not crum- mounds (except mound no. 6) were measured three times during
bling pieces, so that the inside of the subsample was undis- one week and each series no. (#) was measured on the same day
turbed. From the sample from mound no. 19, only one suit- and in the same order. Error bars are propagated standard errors of
able subsample was found. Each subsample was placed in the linear regression slope, as described in Sect. 2.4.
a small closed box (12.6 cm × 19.2 cm × 6.8 cm) with two
one-touch fittings, functioning as a small closed flux cham-
ber. A blank measurement was made with the small box and 3 Results
no internal emissions were found. Each mound subsample
was measured with the Los Gatos instrument for 5 min, to 3.1 Mound CH4 and CO2 emissions
determine the CH4 and CO2 production in the chamber over
time. After each measurement, the mound sample was care- Headspace concentrations increased strongly during cham-
fully broken open and termites were counted, so that the CH4 ber closure, and chamber concentrations climbed up to
and CO2 emission per termite (the termite emission factor) 5750 nmol CH4 mol−1 and up to 1950 µmol CO2 mol−1 . CH4
could be calculated. The measurements took place next to emissions of mounds nos. 13–19 ranged between 17.0 and
the mound and time between sampling and measuring was 34.8 nmol mound−1 s−1 (Fig. 1), with an average emis-
always less than 15 min. To verify whether the termite emis- sion of 25.2 nmol mound−1 s−1 . Additional valley measure-
sion factor was stable between seasons and mounds, addi- ments showed heterogeneous soil CH4 fluxes with small up-
tional measurements were performed. In October 2020 (dry take and emission taking place alongside, ranging between
season), the same type of measurements were performed on −0.1 and 2.9 nmol m−2 s−1 (med = −0.02, avg = 0.15,
15 subsamples of the same termite mounds, and in Decem- SD = 0.54). Mound-adjacent soil CH4 fluxes, measured at
ber 2020 (transition dry–wet season), measurements were 20 and 45 cm from the mound, ranged between 0.4 and
performed on five subsamples of a different mound of the 8.9 nmol CH4 m−2 s−1 (avg = 2.14, SD = 2.00) and were, on
same species. average, enhanced in comparison to valley soils (Fig. 2).
Soil valley CO2 fluxes were found to range between 0.9 and
2.7 Termite mass measurement
3.7 µmol m−2 s−1 (avg = 2.14, SD = 0.74) (Fig. 2) and the
Termite mass was measured in the Laboratory of Systematics average plateau soil CO2 emission was 4.03 µmol m−2 s−1
and Ecology of Soil Invertebrates at INPA. A total of 480 (SD = 1.36). Mound-adjacent soil CO2 fluxes showed an
living workers of the species N. brasiliensis were weighed in average emission of 4.81 µmol CO2 m−2 s−1 (range = 2.0–
five subgroups (4×n = 100, 1×n = 80) by use of a precision 10.1, SD = 2.04), thereby being enhanced with respect to
scale (FA2104N). Reported individual termite mass is fresh the surrounding valley soils (Fig. 2). Mound CO2 emissions,
weight per termite (mg termite−1 ). corrected for the average valley and plateau soil respira-
tion, ranged between 1.1 and 13.0 µmol mound−1 s−1 , with
an average emission of 8.14 µmol mound−1 s−1 (average of
mounds nos. 13–19).
During chamber closure, the concentration changes in
CH4 and CO2 were strongly correlated (R 2 > 0.95 for each
https://doi.org/10.5194/bg-18-2609-2021 Biogeosciences, 18, 2609–2625, 20212614 H. van Asperen et al.: Termite CH4 emissions in the Amazon
Figure 2. Measured mound emissions and mound-adjacent soil fluxes for CH4 (a) and CO2 (b) for mound nos. 13, 14, 15, and 16 expressed
in nmol 0.25 m−2 s−1 for CH4 and µmol 0.25 m−2 s−1 for CO2 (collar area is 0.25 m2 ). Note that for CO2 the total mound emissions per
collar area not corrected for soil respiration are shown and stated. The centrally placed markers are the measured mound emissions (also for
mound no. 19); the larger marker indicates the day-specific mound emission when mound-adjacent soil fluxes were measured. The grey bar
indicates the range of additionally measured soil valley fluxes. The range and average flux for each group of measurements are given in the
table. On average, measured mound CH4 and CO2 fluxes were a factor of 630 and 16 higher in comparison to the surrounding soil valley
fluxes.
chamber closure). The ratio between the mound CH4 and
CO2 emission (CH4 /CO2 ) ranged between 2.1 and 17.1 ×
10−3 (Fig. 3) and showed a constant ratio when data from
mound no. 19 (furthest away from other mounds) and
mound no. 6 (different species) were excluded (average ratio:
2.8 × 10⁻³ , SD = 0.4). The smallest mound (no. 19) clearly
showed smaller-than-average emissions, but in general no
strong correlation was found between mound CH4 emissions
and mound height (R 2 = 0.07) or volume (R 2 = 0.08), and
a small correlation was found between mound CO2 emis-
sions and mound height (R 2 = 0.43) and mound volume
(R 2 = 0.44).
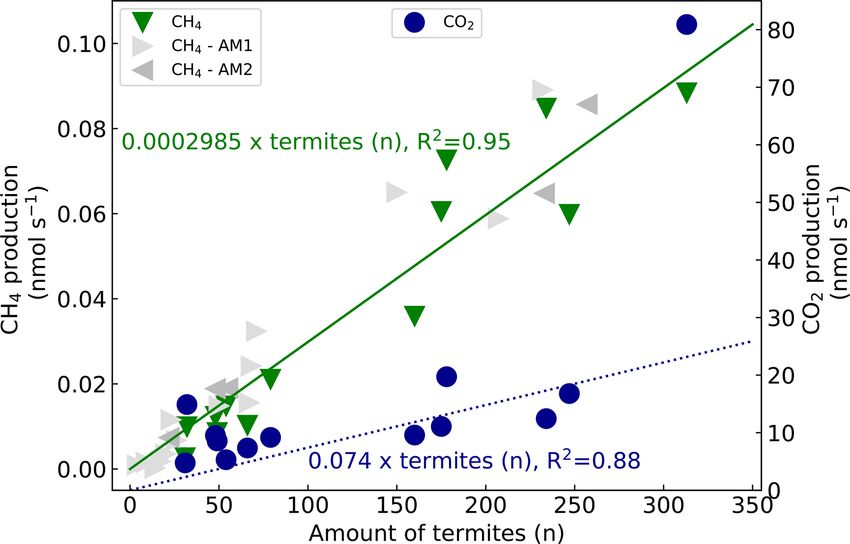
3.2 Termite weight, individual termite emission, and Figure 3. Mound CO2 emissions (µmol mound−1 s−1 ) vs. mound
colony size estimation CH4 emissions (nmol mound−1 s−1 ). Dotted lines indicate the dif-
ferent dCH4 /dCO2 emission ratios.
The average weight of five subsets of living workers of the
species N. brasiliensis was determined and was found to
range between 2.83 and 3.33 mg with an average weight of
3.07 mg (SD = 0.18), which is similar to what was found line has a forced intercept at y = 0. For CH4 , an emission of
by Pequeno et al. (2013), who reported 3.0 mg (SD = 0.4). 0.0002985 nmol termite−1 s−1 was found (se = 1.77 × 10⁻⁵ )
Since the species N. brasiliensis has a relatively low sol- and fitted with an R 2 of 0.95 (n = 13). The set of additional
diers : workers ratio of 1 : 100 (Krishna and Araujo, 1968), measurements resulted in similar termite CH4 emission
we will use the worker weight 3.07 mg (SD = 0.18) as an av- factors, namely 0.0002976 nmol termite−1 s−1 (se = 1.32 ×
erage termite weight for the species N. brasiliensis. 10−5 ) and 0.0003043 nmol termite−1 s−1 (se = 1.41 × 10⁻⁵ )
CH4 and CO2 emissions of 13 mound subsamples were for the measurements of October and December 2020 respec-
measured. For each subsample, the measured gas produc- tively. Given estimates in this paper will be based on the ter-
tion was plotted over the counted termites (Fig. 4). The fitted mite emission factor of 0.0002985 nmol CH4 termite−1 s−1 .
Biogeosciences, 18, 2609–2625, 2021 https://doi.org/10.5194/bg-18-2609-2021H. van Asperen et al.: Termite CH4 emissions in the Amazon 2615
4 Discussion
4.1 CH4 and CO2 emissions
Measured mound CH4 emissions were of similar magni-
tude to emissions found by previous studies (Table 2, mid-
dle and lower part). The termite emission factor, determined
for the soil-feeding species N. brasiliensis, was found to be
0.35 µmol g−1termite h
−1 (SD = 0.02), which is similar to val-
ues found for other species (Table 2, upper part) but almost
two times higher than the average value reported by Mar-
tius et al. (1993) for a wood-feeding species in the Ama-
zon (0.19 µmol g−1 −1
termite h ). Our emission rate is within the
reported range of 0.1–0.4 µmol g−1 termite h
−1 for soil feeders
Figure 4. CH4 production (left axis, green triangles) and CO2 pro-
(Sugimoto et al., 2000). Mound CO2 emissions and the ter-
duction (right axis, blue circles) over counted termites. The lines
(green solid for CH4 , blue dashed for CO2 ) represent a linear re-
mite CO2 emission factor were similar to or a little higher
gression fit with forced intercept at y = 0. For CH4 , a production of than the few values found in literature (Table 2). Neverthe-
0.0002985 nmol termite−1 s−1 (se = 1.77 × 10⁻⁵ , R 2 = 0.95) was less, since mound material and termites were measured to-
found and, for CO2 , a production of 0.1316 nmol termite−1 s−1 gether, the contribution of indirect termite emissions, i.e.
(se = 2.59 × 10⁻² , R 2 = 0.68) was found. Excluding the outliers mound respiration, cannot be quantified, so that the direct
(32, 14.9 nmol s−1 & 313, 80.9 nmol s−1 ) gives an R 2 of 0.88 (n = termite-produced CO2 emission is presumably lower.
11) with a CO2 emission of 0.074 nmol termite−1 s−1 (se = 8.5 × There is a large variety in type of termite mounds (shape
10−3 ). For comparison, two sets of additional subsample CH4 emis- and size are dependent on, among other things, species,
sion measurements are shown. The first additional measurements ecosystem, and climate; Noirot and Darlington, 2000), ex-
(AM1, light grey triangles) resulted in a termite emission factor plaining the wide range of reported termite mound CH4
of 0.0002976 nmol termite−1 s−1 (se = 1.32×10⁻⁵ ) (one measure-
emissions (Table 2, middle and lower part). In situ measure-
ment point (599 termites, 0.165 nmol s−1 ) is not shown in this fig-
ure). The second set (AM2, dark grey triangles) gave a termite emis-
ment of termite mounds gives information about the net CH4
sion factor of 0.0003043 nmol termite−1 s−1 (se = 1.41 × 10⁻⁵ ). emission under natural conditions but is unable to distinguish
sources and sinks inside the mound. One known CH4 sink
in termite mounds is the uptake by methanotrophic bacte-
For CO2 , an emission of 0.1316 nmol termite−1 s−1 was ria, which are also responsible for the CH4 uptake in aerobic
found (se = 2.59 × 10⁻² ) with an R 2 of 0.68 (n = soils. The presence and magnitude of this process have been
13). Excluding the outliers (32, 14.9 nmol s−1 and 313, discussed and reviewed by different studies (Ho et al., 2013;
80.9 nmol s−1 ) gave an R 2 of 0.88 (n = 11) with a CO2 emis- Khalil et al., 1990; Macdonald et al., 1998; Nauer et al.,
sion of 0.074 nmol termite−1 s−1 (se = 8.5 × 10⁻³ ). Convert- 2018; Seiler et al., 1984; Sugimoto et al., 1998a; Pester et al.,
ing the emission rates from termite to termite mass (fresh 2007; Reuß et al., 2015). The role of possible mound CH4
weight) and from seconds to hourly rates gives a termite uptake should also be acknowledged for the measurement of
emission factor of 0.35 µmol g−1termite h
−1 (se = 0.02) for CH
4 individual termite emissions (Table 2, upper part); most lit-
−1 −1
and of 86.8 µmol gtermite h (se = 10.0) for CO2 (Table 2). erature values, including values from this study, are based on
By combining the termite CH4 emission factor with the termite incubation in the presence of mound material, with
termite mound CH4 emissions, colony sizes were estimated. ongoing CH4 uptake; therefore, actual termite CH4 emission
Colony size estimates were based on the highest measured values might be higher.
emissions and were found to range between 55–125 thou- Small variation in mound emission magnitudes was ob-
sand individuals (Table 3). Colony size can also be estimated served between measurement days. This can be caused by
by use of mound volume or mound external surface. Table 3 a variation in colony size (due to foraging activities) or ter-
shows the colony size estimates based on values as given by mite activity driven by fluctuations in temperature or radia-
Lepage and Darlington (2000) for termites in general and tion (Jamali et al., 2011a; Ohiagu and Wood, 1976; Sands,
also shows the estimates based the “mound volume–termite 1965; Seiler et al., 1984). However, as our termite mounds
biomass” relation found by Pequeno et al. (2013), specifi- are in a tropical forest with relatively constant temperatures
cally for the species N. brasiliensis. and only indirect daylight, strong diurnal temperature and ra-
diation patterns are not expected. Small variation can also be
caused by minimal air transport below the soil collar through
the porous upper soil layer; during preliminary tests without a
collar, we observed that even a light forest breeze can cause
chamber headspace variations. In case our setup was sub-
https://doi.org/10.5194/bg-18-2609-2021 Biogeosciences, 18, 2609–2625, 2021H. van Asperen et al.: Termite CH4 emissions in the Amazon
https://doi.org/10.5194/bg-18-2609-2021
Table 2. Overview of literature values for CH4 and CO2 emissions of termites per weight (upper part), emissions per termite mound (middle part), and emissions per area (lower
part). Values from this study are indicated in bold. If reported, the average and SD are given, otherwise a range is indicated. If multiple values were found, measurements from higher
soil-feeding termite species were selected. For each study, the graph or table where the data were found is given. The CH4 /CO2 is given in molar ratio (10−3 ).
Studies reporting emission per gram termite
−1 −1 −1 −1
Study Study area CH4 emission (µmol gtm h ) CO2 emission (µmol gtm h ) CH4 /CO2 Species
This study, Fig. 4 Amazon 0.35 (0.2) (0.0002985 nmol tm−1 s−1 ) 86.8 (10.0) (0.074 nmol tm−1 s−1 ) ∼ 4c Soil feedersd
−1 −1
Brauman et al. (1992), Table 1 Congo 0.39–1.09 (0.39–1.09 µmol gtm h ) Soil feederse
−1 −1 −1 −1
Eggleton et al. (1999), Table 4 Australia 0.17–0.27 (0.17–0.27 µmol gtm h ) 1.4–9.0 (1.4–36.4µmol gtm h ) 10–154 Soil feedersf
−1 −1 −1 −1
Fraser et al. (1986), Fig. 2 Australia 0.04 (0.01) (0.67 (0.2) mg kgtm h ) 107 (4.5) (4.7 (0.2) g kgtm h ) ∼ 0.38c Wood feedersg
−1 −1
Konaté et al. (2003), Table 1 Ivory Coast 31.4–133.5 (31.4–133.5 nmol mgtm h ) Fungi feedersh
−1 −1
Martius et al. (1993), Table 1 Amazon 0.19 (0.08) (3.0 (1.3) µg gtm h ) Wood feedersi
−1
Rouland et al. (1993), Table 1 Congo 0.53–1.09 (0.53–1.09 µmol gtm h−1 ) Soil feedersj
−1 −1 a −1 −1 a
Sawadogo et al. (2011), Table 1 Burkina Faso 0.10–0.12 (0.30–0.39 µmol gtm h ) 19–25 (59.4–78.4 µmol gtm h ) ∼ 5c Wood feedersk
−1 −1
Sugimoto et al. (1998a), Table 3 Thailand 0.03–0.20 (3.4–20.3 × 10⁻⁸ mol gtm h ) Soil feedersl
Studies reporting emission per nest or mound
Study Study area CH4 emission (µmol mound−1 h−1 ) CO2 emission (mmol mound−1 h−1 ) CH4 /CO2 Species
This study, Fig. 1 Amazon 61–125 (17.0–34.8 nmol mound−1 s−1 ) 4–47 (1.1–13.0 µmol mound−1 s−1 ) 2.8 (0.4) Soil feedersd
Khalil et al. (1990), Fig. 4 & Table 3 Australia 9–135 (0.04–0.6 µg mound−1 s−1 ) 4–92 (0.05–1 µg mound−1 s−1 ) 0.12–11 Wood feedersm
Macdonald et al. (1999), Table 4 Cameroon 1–11 (4.5–49 ng mound−1 s−1 ) Soil & wood feedersn
Martius et al. (1993), Table 1 Amazon 125 (150) (2.0 (2.4) mg nest−1 h−1 ) Wood feedersi
Seiler et al. (1984), Table 1 South Africa 1–644 (0.02–10.3 mg nest−1 h−1 ) 0.7–241 (0.03–10.6 g nest−1 h−1 ) 0.07–8.7 Soil & wood feederso
Sugimoto et al. (1998a), Table 3 Thailand 0.4–1.9 (4.2–18.7 × 10⁻⁷ mol nest−1 h−1 ) Soil feedersl
Studies reporting emission per area
Study Study area CH4 emission (µmol m−2 h−1 ) CO2 emission (mmol m−2 h−1 ) CH4 /CO2 Species
This study, Fig. 1 Amazon 245–501b (17.0–34.8 nmol mound−1 s−1 ) 16–187b (1.1–13.0 µmol mound−1 s−1 ) Soil feedersd
Biogeosciences, 18, 2609–2625, 2021
2.8 (0.4)
Brümmer et al. (2009a), Fig. 5 Burkina Faso 315.7 (3788.9 µg CH4 -C m−2 h−1 ) 37.3 (447.0 mg CO2 -C m−2 h−1 ) ∼ 8.5c Soil feedersp
Jamali et al. (2013), Fig. 1 Australia 32–500 (379–6000 µg CH4 -C m−2 h−1 ) 0–129 (0–1550 mg CO2 -C m−2 h−1 ) 2.7–11.0 Wood feedersq
Queiroz (2004), Table 4 Amazon 10–24 (0.16–0.38 mg m−2 h−1 ) unknown
a Sawadogo et al. (2011) reported emissions per dry weight mass. To convert to fresh weight, a formula as reported by Pequeno et al. (2017) was used. With an assumed dry weight of 0.5 mg, a fresh weight of 1.57 mg is deducted.
b Mound emissions are divided by a collar area of 0.25 m2 . c Calculated based on average values in this table. d Neocapritermes brasiliensis. e Crenetermes albotarsalis, Cubitermes fungifaber, Cubitermes speciosus, Noditermes sp.,
Procubitermes sp., Thoracotermes macrothorax; f Dicuspiditermes santschii, Dicuspiditermes nemorosus, Pericapritermes semarangi, Procapritermes nr. sandakanensis, Homallotermes eleanorae, Proaciculitermes sp. A,
Pericapritermes nitobei. g Coptotermes lacteus. h Ancistrotermes cavithorax, Odontotermes n. pauperans. i Nasutitermes macrocephalus, Nasutitermes corniger, Nasutitermes surinamensis, Nasutitermes sp., Nasutitermes
ephratae, Nasutitermes araujoi. j Noditermes sp., Crenetermes albotarsalis, Cubitermes speciosus, Thoracotermes macrothorax, Astratotermes sp. k Macrotermes bellicosus. l Microcerotermes sp., Globitermes suplhureus,
Termes sp., Dicuspiditermes sp. m Drepanotermes perniger, Nasutitermes magnus, Nasutitermes triodiae, Tumulitermes pastinator, Amitermes laurensis, Coptotermes lacteus. n Bulbitermes sp. C, Dicuspiditermes nemorosus,
Dicuspiditermes santschii. o Macrotermes and Odontotermes (Macrotermitinae), Trinervitermes (Nasutitermitinae), Amitermes and Cubitermes (Termitinae), Hodotermes (lower termite). p Cubitermes fungifaber.
q Microcerotermes nervosus, Turnulitermes pastinator, Turnulitermes hastilis, Amitermes meridionalis.
2616H. van Asperen et al.: Termite CH4 emissions in the Amazon 2617
Table 3. Colony size estimates (CSEs) based on different methods; values given per thousand (×103 ). “Mound volume” is the estimated
mound volume as given in Table 1 and “Mound emission” is the highest measured emission per individual mound.
Mound Mound Mound emission CSE by CSE by CSE by CSE by
No. volume emissiona volumeb surface areac species-specific
volumed
13 77.6 L 28.3 nmol mound−1 s−1 89.6–100.9 15.5–434.6 54.6–162.8 114.0–128.2
14 48.0 L 34.8 nmol mound−1 s−1 110.1–124.0 9.6–268.8 35.7–106.4 91.0–102.3
15 50.5 L 29.5 nmol mound−1 s−1 93.4–105.1 10.1–282.8 39.3–117.2 93.2–104.8
16 49.7 L 18.2 nmol mound−1 s−1 57.6–64.9 9.9–278.3 39.0–116.2 92.5–104.0
19 38.0 L 20.4 nmol mound−1 s−1 64.6–72.7 7.6–212.8 26.5–78.9 81.5–91.7
a CSE based on the highest measured mound CH emission and combined with an emission factor of 0.0002985 nmol CH termite−1 s−1
4 4
(se = 1.77 × 10⁻⁵ ). b CSE based on mound volume by use of mound termite density values (0.2–5.6 termite cm−3 ; Lepage and Darlington, 2000).
c CSE based on mound surface area (given in Table 1) by use of mound termite surface values (5.6–16.7 termite cm−2 ; Lepage and Darlington,
2000). d CSE based on mound volume by the species-specific volume–population equation y = 47.94 · x 0.47 (x is mound volume (L) and y is
colony biomass (g)) as given by Pequeno et al. (2013); for termite weight, 3.07 mg (SD = 0.18) was used. Since mound no. 6 was of a different
species, it is not included in this table.
ject to minor air transport below the collar, the given mound The population estimation method we tested combined
emission estimates will be slightly underestimated with re- CH4 mound emissions with a termite emission factor mea-
spect to the actual mound emissions. Another possible under- sured in situ at the field site. We estimated colony sizes rang-
estimation is caused by the estimated corrected chamber vol- ing between 57.6 and 124.0 thousand termites per mound.
ume CV, as used in Eq. (2). In this study, we considered the For all mounds, our population estimate was in the estimated
mound volume as a solid body. A previous study considered range based on mound volume or external surface area, as
the solid nest volume as 10 % of the actual mound volume taken from literature equations (Table 3). Comparison to es-
(Martius et al., 1993), leading to a larger corrected chamber timates based on a N. brasiliensis species-specific equation
volume and therefore to larger calculated mound emissions. shows an average difference of 20 % (Pequeno et al., 2013).
By use of this approach, average calculated mound emis- It should be noted that the relation found between mound vol-
sions would increase by almost 30 % to be 32.7 instead of ume and colony biomass by Pequeno et al. (2013) was quite
25.2 nmol CH4 mound−1 s−1 . weak (R 2 = 0.41), and our estimates would fit in the gen-
The mound emission CH4 /CO2 ratio was found to be rel- eral spread they observed in their data. Interestingly, Pequeno
atively constant over four of the five mounds. While values et al. (2013) concluded that mound volume is a weak indica-
in literature indicate a wide range of CH4 /CO2 ratios (Ta- tor for population size for nests of the species N. brasiliensis,
ble 2), both Seiler et al. (1984) and Jamali et al. (2013) found as also indicated by the weak correlation we found between
little variation between mounds of the same species and con- mound volume and mound CH4 emissions.
cluded that the ratio is species-specific. Our average variation The influence of mound CH4 uptake on our population es-
of a factor of ∼ 4 between mounds of the same species is of timate method should be considered: mound methanotrophic
the same magnitude as what was observed in earlier studies CH4 uptake probably decreases the net mound CH4 emis-
(Seiler et al., 1984; Jamali et al., 2013). sion, resulting in an underestimation of the colony size when
linking it to termite emission factors, as also suggested by
4.2 Colony size estimate Nauer et al. (2018). However, our termite emission factor was
determined inside small pieces of undisturbed mound mate-
rial, so that the material’s CH4 uptake rate was presumably
To estimate colony sizes of (epigeal) nest building termites, only mildly affected. It is therefore likely that our termite
different methods exist. One method is by fumigation of the emission factor is underestimated to the same degree as our
nest (to prevent colony evacuation) followed by excavation, mound emissions; therefore, both values can still be com-
after which termites can be removed from the nest debris by bined.
flotation in water. This process is labour intensive and can Overall, our colony size estimation approach can be con-
take five persons up to three weeks to finish one nest (Dar- sidered as a test case for a quick population estimation
lington, 1984; Jones et al., 2005). A faster method is by sub- method. The combination of one mound flux measurement
sampling known volumes of the mound, counting the ter- (15 min) in combination with five subsample measurements
mites in the subsample, and extrapolating this to the total (5 × 5 min) can be performed within 1 h, thereby being faster
mound volume. Termite mounds can have irregular shapes; than the original methods. Also, the method is applicable to
therefore, volume estimates strongly depend on which vol- epigeal mounds of all species, independent of internal mound
ume estimation approach is used (Jones et al., 2005).
https://doi.org/10.5194/bg-18-2609-2021 Biogeosciences, 18, 2609–2625, 20212618 H. van Asperen et al.: Termite CH4 emissions in the Amazon
structure (Josens and Soki, 2010) or species characteristics limited literature on this subject, we prefer to not further ex-
(Pequeno et al., 2013). In addition, the method is not strongly trapolate our mound emission measurements.
dependent on a correct mound volume estimate, which re- A more comprehensive approach is to use termite biomass
mains a source of uncertainty (Jones et al., 2005) and which estimates and combine them with termite emission fac-
has been shown to be a weak indicator of population size for tors, a method which is commonly used for global CH4
some species (Pequeno et al., 2013; Josens and Soki, 2010). budget studies (Kirschke et al., 2013; Saunois et al.,
Moreover, mounds can also be measured several times in a 2020). For active tropical ecosystems, a termite biomass of
row before the subsample measurement, so that colony size ∼ 11 g termite m−2 is generally assumed (Bignell and Eggle-
dynamics over time can be studied non-invasively. A disad- ton, 2000; Kirschke et al., 2013; Sanderson, 1996; Saunois
vantage of this method is that it is only applicable to free- et al., 2020). Considering the previously found value of
standing epigeal mounds, at least with the current type of 0.19 µmol CH4 g−1 termite h
−1 for wood-feeding termites in the
chamber setup. For a possible follow-up study, we propose a Amazon (Martius et al., 1993) and our newly found ter-
setup wherein the different methods are compared. mite emission factor of 0.35 µmol CH4 g−1 termite h
−1 for a soil-
feeding termite, a termite-derived ecosystem CH4 emission
range of 0.6–1.1 nmol m−2 s−1 can be calculated. For CO2 ,
4.3 Role of termites on the ecosystem scale
our termite emission factor of 86.8 µmol CO2 g−1 termite h
−1
leads to a termite-induced ecosystem CO2 emission of
Valley soil CH4 and CO2 fluxes were similar to what was ∼ 0.27 µmol CO2 m−2 s−1 .
found by earlier studies (Souza, 2005; Moura, 2012; Cham- An overview of the different estimates is given in Ta-
bers et al., 2004; Zanchi et al., 2014). On average, mound- ble 4. Each of these estimates are based on measurements
adjacent soil CH4 and CO2 fluxes were enhanced with re- from mounds and termites found in the valley, which were
spect to valley soils, although differences were small and only measured during the wet season. Nevertheless, an ex-
no clear emission pattern with “distance to mound” was ob- ploratory measurement of a small mound of a different
served. While mound-adjacent soil fluxes are possibly en- species on the plateau (mound no. 6) indicated CH4 fluxes of
hanced, we preferred to avoid overestimation and decided to a similar magnitude in comparison to a similar-sized mound
treat termite mounds as very local hot spots, with measured in the valley (mound no. 19). Furthermore, exploratory dry
fluxes only representative for the collar area of 0.25 m2 . On season measurements of the same mounds showed emissions
average, CH4 and CO2 fluxes per collar area were found to of similar magnitude (not shown) and additional dry sea-
be a factor ∼ 630 and ∼ 16 higher when an active termite son mound subsample measurements revealed very consis-
mound was present. tent termite CH4 emission factors (Fig. 4). We therefore do
To estimate the role of termites on the ecosystem scale, not expect that mound CH4 emissions are only of importance
one approach is to combine mound emission values with ter- in the valleys or only present in the wet season.
mite mound density numbers. A local study reported a den- To put the estimates in perspective, non-termite-specific
sity value of 21.6 mound ha−1 for the species N. brasiliensis ecosystem CH4 and CO2 fluxes measured at this field
specifically (Pequeno, 2014), which would lead to an aver- site during earlier studies are given. Ecosystem termite
age CH4 emission of 0.05 nmol m−2 s−1 caused by mounds CO2 emissions were estimated to range between 0.05–
of this species alone. Non-species-specific mound densities 0.27 µmol m−2 s−1 , which is approximately ∼ 1 %–3 % of
are known to vary strongly between and within ecosystems the estimated total ecosystem respiration (7.8 µmol m−2 s−1 ;
(Ackerman, 2006, Appendix B8). We found five local stud- Chambers et al., 2004). Nevertheless, since the “emission per
ies reporting mound (epigeal nest) density values, which mound” as well as the “termite emission factor” are both af-
were ∼ 100 mound ha−1 (Queiroz, 2004), 193 mound ha−1 fected by indirect effects of termite activity (mound respi-
(Oliveira, 2016), 250 mound ha−1 (Dambros et al., 2016), 60 ration), the contribution of direct termite-emitted CO2 into
and 280 mound ha−1 (de Souza and Brown, 1994), and even the ecosystem is presumably smaller. For CH4 , we rather ex-
760 mound ha−1 (Ackerman et al., 2007). When excluding pect an underestimation than an overestimation of our ter-
the strong outlier of 760 mound ha−1 , the emission of termite mite and mound emission values, therefore we expect that
mounds on the ecosystem scale was estimated to range be- these ecosystem estimates are lower bound. For CH4 , it is
tween 0.15–0.71 nmol m−2 s−1 for CH4 and between 0.05– difficult to judge the role on the ecosystem scale since the
0.23 µmol m−2 s−1 for CO2 . Since (epigeal) mounds only earlier measured CH4 flux (above canopy EC measurements,
represent a part of the total termite community, and not the ∼ 2.0 nmol m−2 s−1 ; Querino et al., 2011) is a net flux of
termites located in the subsoil, in dead wood, or on trees (ar- uptake and emission processes with relatively unknown in-
boreal nests), this emission value underestimates the actual dividual magnitudes. Nevertheless, considering the magni-
role of termites on the ecosystem scale. To our knowledge, tude of our estimated termite-emitted CH4 emissions (0.15–
only Bandeira and Torres (1985) (as given in Martius et al., 1.1 nmol m−2 s−1 ), it is expected that termites play a signifi-
1996) assessed the ratio between nest-building vs. total ter- cant role in this terra firme ecosystem.
mite biomass and estimated it to be ∼ 0.16. Considering the
Biogeosciences, 18, 2609–2625, 2021 https://doi.org/10.5194/bg-18-2609-2021H. van Asperen et al.: Termite CH4 emissions in the Amazon 2619
Table 4. Overview of termite-induced CH4 and CO2 emissions based on two different approaches. For comparison, the lowest row shows
the total (not termite-specific) ecosystem CH4 and CO2 flux values, measured at the same field site by previous studies.
Estimation approach CH4 (nmol m−2 s−1 ) CO2 (µmol m−2 s−1 )
(1) Mounds per hectare · emission per mound (mol mound−1 s−1 ) 0.15–0.71 0.05–0.23
(2) Termite biomass estimate (g m−2 ) · termite emission factor (mol g−1 −1
termite s ) 0.5–1.1 0.27
Total (not termite-specific) ecosystem fluxes ∼ 2a 7.8b
a Querino et al. (2011) performed above-canopy Eddy Covariance CH flux measurements and reported an average CH flux of ∼ 2 nmol m−2 s−1 . b Chambers et al.
4 4
(2004) quantified different respiratory CO2 sources in this ecosystem and estimated the total ecosystem respiration to be 7.8 µmol CO2 m−2 s−1 .
Termites contribution to tropical South America CH4 measurements on small groups of termites, we derived a ter-
budget mite CH4 emission factor, so far only the second value re-
ported for the Amazon rainforest. The newly found termite
In current CH4 budget studies, a termite emission factor of emission factor, measured for a soil-feeding species, is al-
2.8 µg CH4 g−1termite h
−1 is used for “Tropical ecosystems and
most twice as high as the previously reported average value
Mediterranean shrub lands” (Kirschke et al., 2013; Saunois for the Amazon, which was determined for a wood-feeding
et al., 2020),2 which is mainly based on field studies in species. By combining mound emissions and termite emis-
Africa and Australia (Brümmer et al., 2009a; Jamali et al., sion factors, mound colony sizes were estimated and values
2011a, b; Macdonald et al., 1998, 1999; Sanderson, 1996). were similar to estimates based on a literature review. Con-
The only termite emission factor measured for the Ama- sidering the quick, widely applicable, and non-destructive
zon rainforest is by Martius et al. (1993) (3.0 µg g−1 −1
termite h ) nature of this approach, we propose that it can be used as an
for a wood-feeding species, which are expected to emit less alternative to the traditional methods that are intrusive and
CH4 than soil-feeding species (Bignell and Eggleton, 2000; time-consuming.
Brauman et al., 1992). As a back-of-the-envelope calcula- Assessment of the magnitude of termite-emitted CH4
tion based on Kirschke et al. (2013): 36 % of global ter- on the ecosystem scale was attempted by two ap-
mite emission (11 Tg) is expected to come from the re- proaches. Mound emission values were combined with
gion of “tropical South America” (0.36 · 11 = 3.96 Tg). Sub- mound density numbers, leading to an estimate of 0.15–
stituting the emission factor of 2.8 with the newly found 0.71 nmol CH4 m−2 s−1 emitted by mounds, on average;
5.6 µg CH4 g−1termite h
−1 would increase this regions estimate
since this estimate neglects emission from termite activity
to 7.92 Tg and thereby the global estimate to 14.96 Tg. outside mounds, the number is likely an underestimation.
Our study points out that termite emissions are still an un- The CH4 termite emission factor from this study and from the
certain source in the CH4 budget and are especially poorly only other Amazon field study were combined with termite
quantified for the Amazon rainforest. Measurement of CH4 biomass numbers, resulting in an estimate of termite-emitted
emissions from different termite species, preferably covering CH4 of 0.6–1.1 nmol m−2 s−1 . Considering the relatively low
species of different feeding or nesting habits in combination CH4 emissions previously measured at this ecosystem, we
with more precise termite distribution and abundance data, expect that termites play an important role in the CH4 budget
would allow more precise estimates and a better understand- of this terra firme ecosystem.
ing of the role of termites in the CH4 budget.
5 Conclusions
In situ measurement of termite mound CH4 and CO2 emis-
sions confirmed that mounds are important local hot spots,
playing a considerable role on the ecosystem scale. Mea-
sured mound emissions of the species N. brasiliensis were of
similar magnitude to observed emissions for different soil-
and wood-feeding species, and mounds showed a relatively
constant CH4 /CO2 emission ratio. By performing emission
2 Kirschke et al. (2013) and Saunois et al. (2020) stated a ter-
mite emission factor of 2.8 (±1.0) mg CH4 (g−1 termite ). Correspon-
dence with the authors clarified that a termite emission factor of
2.8 (±1.0) µg CH4 (g−1 −1
termite h ) was meant.
https://doi.org/10.5194/bg-18-2609-2021 Biogeosciences, 18, 2609–2625, 20212620 H. van Asperen et al.: Termite CH4 emissions in the Amazon
Appendix A: Termite mounds: N2 O, CO, and δ 13 C of
CO2
A1 Methodology
In addition to the direct mound CH4 and CO2 emission
measurements (performed with the Los Gatos instrument),
mound N2 O and CO fluxes and the δ 13 C of the mound CO2
flux were determined by the following method. Three bags
(5 L inert foil, Sigma-Aldrich) were sampled consecutively
during chamber closure. The bags were measured on the
same or the consecutive day with a Spectronus FTIR anal-
yser, which can quantify concentrations of CO2 , CH4 , N2 O,
and CO, and can determine the δ 13 C of CO2 . The N2 O Figure A1. CO emissions of valley mound nos. 13–19, expressed
and the δ 13 C of CO2 measurements of the FTIR analyser in nmol mound−1 s−1 , which represents a collar area of 0.25 m2 .
have a cross sensitivity for CO2 concentrations, which is All mounds were measured three times during one week and each
well quantified for the CO2 range 380–800 ppm (Hammer series no. (#) was measured on the same day and in the same order.
et al., 2013). In order to sample air with CO2 concentrations
< 800 µmol mol−1 , air samples were taken in the first min-
utes after chamber closure (2, 5, 8 min). Out of the 45 sample
bags taken, two bag samples could not be used.
Before measurement of the bag sample, sample lines were
flushed with bag sample air. Air samples were dried by a
Nafion dryer and by a column of magnesium perchlorate.
Measurements were corrected for pressure and tempera-
ture variations as well as for cross sensitivities (Hammer
et al., 2013). For more information on this instrument,
please refer to Griffith et al. (2012). For calibration of the
instrument, two calibration gases were used: gas 1 with
values 381.8 µmol CO2 mol−1 , 2494.9 nmol CH4 mol−1 ,
336.6 nmol N2 O mol−1 , 431.0 nmol CO mol−1 , and
13
a δ C of CO2 of −7.95 ‰, and gas 2 with val- Figure A2. δ 13 C of CO2 emitted by mounds nos. 13–19, derived
ues 501.6 µmol CO2 mol−1 , 2127.0 nmol CH4 mol−1 , by use of Keeling plots. Error bars represent the standard error of
327.8 nmol N2 O mol , 256.7 nmol CO mol−1 , and a δ 13 C
−1
the linear regression intercept. Red squares indicate intercepts based
of CO2 of −14.41 ‰. on linear regression fits with R 2 < 0.99 or based on linear regres-
To calculate the fluxes of N2 O and CO, FTIR-measured sion with only two instead of three sample points. All mounds were
bag concentrations of N2 O, CO and CO2 were used. For each measured three times during one week, and each series no. was
chamber closure, the dNdt2 O , dCO dCO2
dt , and dt were calculated
measured on the same day and in the same order. Averages were
dN2 O dCO calculated for each mound, which were −38.1 ‰ (mound no. 13,
so that the ratios dCO2 , and dCO could be derived. To cal-
2 se = 0.9), −36.2 ‰ (mound no. 14, se = 1.0), −35.7 ‰ (mound
culate the fluxes of N2 O and CO, the ratios were combined
no. 15, se = 0.1), −34.7 ‰ (mound no. 16, se = 1.4), and −34.7 ‰
with the in situ determined mound CO2 flux, as measured by (mound no. 19, se = 1.3). For calculation of these averages, values
the Los Gatos instrument. This approach was chosen because with a linear regression of R 2 < 0.99 or values based on a linear re-
the intended 3 min bag sampling interval was not always ac- gression of only two measurements (indicated as dark red squares)
complished, so that an exact 1t could not be assumed with were excluded.
certainty. To determine the δ 13 C of the CO2 emitted by the
termite mounds, Keeling plots were used (Pataki et al., 2003).
(Hammer et al., 2013), not all three headspace samples per
A2 Mound N2 O and CO fluxes chamber closure could be used; therefore, qualitative N2 O
flux estimates cannot be reported. As a back-of-the-envelope
Gas samples (three samples per chamber closure) revealed calculation, N2 O fluxes were calculated if two headspace
stable N2 O concentrations and headspace concentrations samples were with CO2 < 800 µmol mol−1 and if a minimum
ranged between 333.7 and 342.4 nmol mol−1 over the differ- N2 O concentration difference of 0.18 nmol mol−1 was found
ent chamber closures. Since headspace CO2 concentrations (FTIR precision (σ ) for 5 min spectra is 0.09 nmol mol−1 ),
sometimes exceeded 800 µmol mol−1 and N2 O–CO2 cross which gave us three mound flux estimates ranging between
sensitivity becomes uncertain at higher CO2 concentrations 0.03 and 0.11 nmol N2 O mound−1 s−1 . Similarly low fluxes
Biogeosciences, 18, 2609–2625, 2021 https://doi.org/10.5194/bg-18-2609-2021You can also read