Community Solar Power - Revised November 2010 JOHN FARRELL
←
→
Page content transcription
If your browser does not render page correctly, please read the page content below
Community Solar Power

   Obstacles and Opportunities

         JOHN FARRELL
          jfarrell@ilsr.org

   Revised November 2010
           A publication of

         New Rules Project            612-379-3815
         1313 5th St. SE, Suite 303   www.newrules.org
         Minneapolis, MN 55414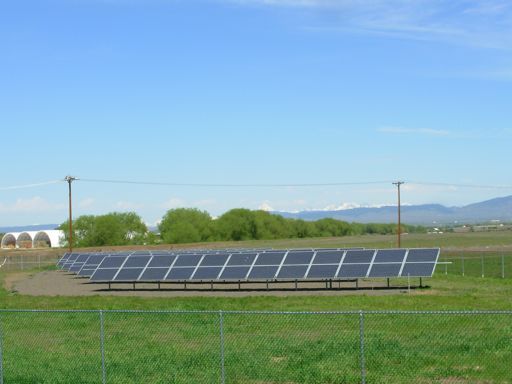
New Rules Project                            www.newrules.org                                            i

Comment on Revisions
The original edition of Community Solar Power received a lot of attention, for which we at the Institute
for Local Self-Reliance are very grateful. The grading system we used for community solar projects was
of particular interest, especially our offer of higher scores for projects placed on rooftops rather than on
the ground.

In particular, the excellent folks at the Clean Energy Collective (whose project is featured in this report)
engaged us on the criteria we used for rooftop and ground-mounted solar power. After several in-depth
conversations, we offer this revision to Community Solar Power and to the grades we provided for solar
project location. We think that our revised grading system better reflects the advantages of distributed
renewable energy as well as the best efforts of community solar projects to provide their participants with
the best value. See the table below for the revised grades (an updated scorecard is in the report).

For a more thorough discussion of the location conversation, see this post to our distributed energy web
resource, Energy Self-Reliant States: Community Solar: Better on the Roof?

Sincerely,
-John Farrell

  Community                  Sol      Simple University Green-        Solar      Sun-
    Solar          CEC                                  house                             Ellensburg Sakai
                           Partners    Solar   Park                  Pioneer    Smart
  Scorecard:                                            Solar
   Overcome
                    A         B          A         A          A         A         B           B         B
    Barriers
    Expand
                    A         C          A         A          C         A         A           A         B
  Participation
    Expand
                    A          F         D         A          A         F         F           F         F
   Ownership
   Affordable       A         C          A         A          C         F         F           C         D
    Location       CA-        FC        FC         A          A         A         FC          C         A
   Replicable       A         D          D         C          D         D         C           D         F
 Overall Grade     A-A       D+C-      C+B-        A-         B        C+         C-          C         C-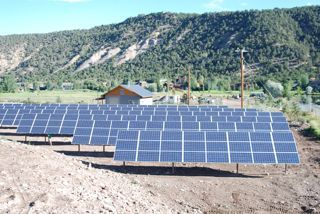
New Rules Project                              www.newrules.org                                                 ii

Acknowledgments
I would like to thank Anya Schoolman, Steve Owen, Tammy Deets, Alex from SolarCity, Joy Hughes, Jerry Marizza,
Dave Brosch, Lauren Martindale and Renee Fleming for their time spent answering my questions about their
community solar projects and Joe Williams, Jim Farrell, John Bailey and Joel Haskard for their thoughtful review. I
also thank David Morris, for his thoughtful time spent reading and asking questions to make this report better.

All shortcomings, of course, are my own responsibility.               Cover photo: Greenhouse Solar Project, NC

Recent Energy Publications
Municipal Energy Financing: Lessons Learned
By John Farrell, May 2010

Electric Vehicle Policy for the Midwest – A Scoping Document
By John Bailey and David Morris, December 2009

Energy Self-Reliant States: Second and Expanded Edition
By John Farrell and David Morris

Community Choice Aggregation: An Update
By John Farrell, June 2009

Feed-in Tariffs in America: Driving the Economy with Renewable Energy Policy that Works
By John Farrell, April 2009

Meeting Minnesota's Renewable Energy Standard Using the Existing Transmission System
By John Bailey, George Crocker (NAWO), John Farrell, Michael Michaud (Matrix Energy Solution), David Morris,
November 2008

Energy Self-Reliant States: Homegrown Renewable Power
By John Farrell and David Morris, November 2008

Rural Power: Community-Scaled Renewable Energy and Rural Economic Development
By John Farrell and David Morris, August 2008

Balancing Budgets by Raising Depletion Taxes
By Justin Dahlheimer, June 2008

Concentrating Solar and Decentralized Power: Government Incentives Hinder Local Ownership
By John Farrell, May 2008

Driving Our Way to Energy Independence
By David Morris, April 2008

Since 1974, the Institute for Local Self-Reliance (ILSR) has worked with citizen groups, governments and
private businesses to extract the maximum value from local resources.

A program of ILSR, the New Rules Project helps policy makers to design rules as if community matters.

               2010 by the Institute for Local Self-Reliance. Permission is granted under a Creative
               Commons license to replicate and distribute this report freely for noncommercial purposes.
               To view a copy of this license, visit http://creativecommons.org/licenses/by-nc-nd/3.0/.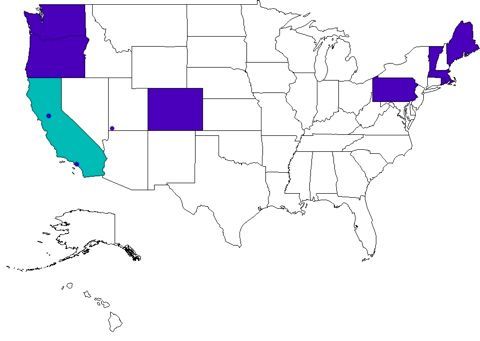
New Rules Project                                             www.newrules.org                                                                      iii

Table of Contents
Executive Summary!.............................................................................................................1
Introduction!......................................................................................................................2
Operational Community Solar Projects!.................................................................................4
     Colorado – Clean Energy Collective!...........................................................................................5
     Colorado – United Power’s Sol Partners! .....................................................................................6
     Florida Keys Electric Cooperative (FKEC) Simple Solar Program! .................................................8
     Maryland – University Park Solar!................................................................................................9
     North Carolina – AIRE Greenhouse Solar Project! ......................................................................10
     Oregon – Solar Pioneer I and II! .................................................................................................11
     Utah – St. George’s SunSmart!...................................................................................................13
     Washington – Ellensburg Community Solar Project!....................................................................15
     Washington – Solar for Sakai!....................................................................................................17
Other Models of Community Solar!......................................................................................18
     Buying Groups and Cooperative Negotiations!............................................................................18
           Washington DC – Mt. Pleasant Solar Cooperative
     Individual Solar Leasing!...........................................................................................................19
     Green Pricing!.........................................................................................................................21
Analysis of Existing Community Solar Projects!....................................................................22
     Overcoming Barriers!...............................................................................................................22
     Participation!...........................................................................................................................22
     Ownership!..............................................................................................................................22
     Affordability!...........................................................................................................................23
     Location!................................................................................................................................24
     Replicability! ...........................................................................................................................24
Community Solar Policy!....................................................................................................26
     Colorado Community Solar Garden Legislation!.........................................................................26
     Washington Community Solar Enabling Act! .............................................................................29
     Community Net Metering!........................................................................................................32
The Missing Links!............................................................................................................33
     Federal Tax Incentives!.............................................................................................................33
     Securities Regulations!.............................................................................................................33
     Location!................................................................................................................................34
     Ownership!..............................................................................................................................34
Conclusion!......................................................................................................................35
References!.........................................................................................................................1
New Rules Project                         www.newrules.org                                           1

Executive Summary
Community solar power can offer unique benefits in the
                                                           We define community solar as a solar
expansion of solar power, from greater participation and
ownership of solar to a greater dispersion of the          PV project with multiple individual
economic benefits of harnessing the sun’s energy. But      owners living in geographic proximity
community solar faces significant barriers in a market     to the solar project, and sharing the
where the “old rules” favor corporate, large-scale
                                                           costs and benefits of ownership of the
development. New rules – better community solar
policy and regulations – are needed to remove these        solar project.
barriers.

In this report, we explore whether community solar can:
• Overcome financial and institutional barriers to collectively-owned solar.
• Increase the number of people who can invest in and own decentralized solar power.
• Offer an affordable opportunity to “go solar.”
• Disperse the economic benefits of solar power development.
• Tap unused space on existing structures and near existing grid connections rather than using open space
  requiring new transmission.
• Replicate.

Existing community solar projects have overcome barriers to get electrons flowing, but most fail to meet
the remaining goals. However, their failure comes as much from solar policy – the old rules – as from
project design.

Recent community solar policies have tried to address these shortcomings, but with mixed success and in
limited areas of the country. A Washington state community solar incentive offers significant cash flow,
but for a limited time. A Colorado solar gardens law creates a legal structure for community solar but
perhaps at the expense of rooftop solar development. A handful of states have community net metering
that offers only a small reduction in the significant barriers affecting community solar.

Future community solar policy still must address the following issues:
• Lack of access to federal tax incentives.
• Onerous securities regulations of community solar entities.
• Ground-mounted versus rooftop solar installations.
• Subscription or lease versus ownership shares.

                          Greenhouse Solar Project, NC
New Rules Project www.newrules.org 2
Introduction
Solar energy is an attractive source of electric power. The sun shines everywhere and therefore solar
energy can provide electricity in almost every corner of the country. Because solar is a distributed
resource, it’s also worth considering how more people can have a stake in producing the energy they
consume and sharing in the economic benefits of a transition to clean energy.
Solar power can be developed by people with sunny rooftops or by big utilities or private companies. But
should renters be able to invest in solar power? People with shady property or poorly orientated roofs?
Should nonprofits and cooperatives be able to organize investors to reduce the cost of solar power?
Should they receive the same incentives as commercial developers or utilities? Should the economic
benefits of federal tax incentives and accelerated depreciation (funded by progressive income taxes)
accrue to many, dispersed solar power generators rather than just a few large tax equity financiers?
Under the existing rules and incentives for solar power development, the answer is often ‘no’. But a few
emerging solar projects have overcome these barriers and in this brief we examine their business models
and the potential for the “new rules” of community solar policy to create the opportunity for not only
more distributed solar to come online but for more people to be able to participate in that development.
We define community solar as a solar PV project with multiple individual owners living in geographic
proximity to the solar project, and sharing the costs and benefits of ownership of the solar project. Figure
1 below provides a basic illustration of a community solar project.1 Local residents create a community
solar entity that hires a third party to install the panels. The entity may collect tax incentives and solar
renewable energy credits (SRECs). Electricity is sold to the local utility, and the proceeds allocated by
providing credits on the residents’ electricity bills.
Figure 1 – Sample Community Solar Project Structure
Installation
Company
SREC sales
Community Solar Array Resident
Tax credits
Resident
Utility Resident
$
In this paper, we explore whether community solar can:
• Overcome existing financial and institutional barriers to collectively-owned solar. Financial
barriers include barriers to accessing federal tax incentives (the 30% tax credit and accelerated
depreciation), rules that make it hard to raise capital (e.g. securities laws), and rules that prohibit easy
sharing of electricity generation among geographically dispersed owners.
• Increase the number of people who can invest in and own decentralized solar power. Increasing
participation means opening solar investment to people who traditionally cannot (i.e. renters or those
with shady property). Increasing ownership means that participants are legal owners of their share of
the community solar project, rather than holding a license or lease.
• Offer an affordable opportunity to “go solar.” Good community solar policy will make community
solar projects cost the same or less than individual ownership and preferably offer participants a good
return on investment.New Rules Project www.newrules.org 3
• Disperse the economic benefits of solar power development. Dispersing the benefits means
broadening participation and more importantly ownership of solar power, so that the economic benefits
accrue to many, varied investors.
• Tap unused space on existing structures rather than open ground for solar modules. Solar PV is
uniquely suited among renewable energy technologies to claim unused roof-space and tap into the grid
inexpensively in areas of high demand. Using open space for solar cedes one of its major technical
advantages. 2
• Replicate. Community solar can only accomplish the first five goals if it’s easy to duplicate a project
model.
The arrangement in Figure 1 is common for community wind and a few community solar projects. In
other cases, the community solar array is owned by the local municipal or cooperative utility and the local
residents “subscribe” via a lease or power purchase agreement. But developing a community solar project
often requires a special set of new rules to enable the business structure.
For example, community solar projects are often
hindered by a barrier imposed by traditional net metering Net Metering
(see inset), which provides a bill credit and/or payment
for net excess electricity generation for an individual on- Net metering policy establishes standards for
site renewable energy project. For a community solar connecting small, on-site renewable energy
project, without a change in net metering law, it would be generation. It allows the individual owner to
difficult to easily share the electricity credits with each of essentially roll their meter backward when their
the owners or participants, even if they all lived in close system is generating electricity, hence the “net”
proximity to the project. Community solar is enabled metering of their consumption and production.
Excess electricity is sold back to the utility at
when net metering rules are revised to allow a group of
varying rates depending on the state.
meters to come together under a single project so that
renters and shade dwellers can share the electricity output
and value from the off-site solar array.
Community solar can also be hindered by the structure of federal tax incentives. Rural cooperative and
municipal utilities are good entities to do community solar – they are member-owned or -governed and
have experience in managing the grid, building electricity generators, and handling the financing. But
these entities don’t pay taxes and therefore cannot use federal solar tax credits. Community solar could
get a boost from a bill by Colorado Senator Mark Udall, that would change the federal solar tax incentive
to allow it to be collected if a person owns or leases solar equipment for their primary residence.3 This
means a community solar project owned by a municipal utility and leased by residents could get federal
tax credits passed through to the individual investors.
Ultimately, community solar policy can help disperse the economic benefits of transforming to a clean
energy economy by expanding participation in and ownership of solar power generation.
The next section of this brief – Operational Community Solar Projects – provides a case study of nine
existing community solar projects, and the succeeding section examines a few Other Models of
Community Solar.
We then provide an Analysis of Existing Community Solar Projects and an analysis of Community Solar
Policy, profiling two community solar policy recently enacted in Colorado and Washington and
examining whether they overcome the barriers of existing solar policy rules.
The final section examines the shortcomings of existing community solar projects and community solar
policy and explores what policy is yet needed.New Rules Project www.newrules.org 4
Operational Community Solar Projects
Under the existing rules for solar power development, it’s a complex process to proceed from a
conceptual model of community solar electricity to an actual working system. Fortunately, a few projects
have employed a variety of methods to overcome the barriers to community solar. This section profiles
nine projects in seven different states (Colorado, Florida, Maryland, North Carolina, Oregon, Utah, and
Washington), detailing the effort required to organize and finance a community solar project that creates a
viable return on investment for participants. In this section we also evaluate and comment on whether
these emerging community solar projects are effective and replicable models for breaking down barriers
to solar development, expanding local ownership, and attaining affordability/profitability. We also
compare them to the most appropriate non-community solar model: a solar lease or individual solar array
ownership.
The route to a community solar project requires several complex steps:
1. Identifying an organizational format for pooling capital and accessing financing. Existing entities
such as municipal utilities or rural electric cooperatives account for four of the five featured
community solar projects.
2. Choosing an organizational format that allows for access to federal solar incentives including the 30%
Investment Tax Credit (ITC) and accelerated depreciation. These incentives are only available to tax-
paying individuals or entities. This means that the four projects developed by municipal utilities were
not able to use federal solar incentives, but had to seek alternatives such as federal Clean Renewable
Energy Bonds (CREBs), with zero percent interest, but limited by annual Congressional
appropriations and IRS disbursement rules. The federal stimulus program has briefly allowed solar
projects to take a cash grant in lieu of the ITC, but this program expires at the end of 2010.
3. Defining investor’s rights to solar output. Investors in community solar can own specific solar
modules, have ownership shares, or lease a part of the solar project and receive access to its electricity
output. Most of the community solar projects described the participant’s access as a lease, license, or
subscription – a term-limited right to the electricity output from a certain amount of panel capacity,
e.g. output from a 210 Watt module for 20 years.
Clean Energy Collective’s Community Solar ProjectNew Rules Project www.newrules.org 5
Colorado – Clean Energy Collective
The solar installation by the Clean Energy Collective (CEC) is touted
as the “first community-owned solar garden.”4 The 77.7 kW system
was developed by CEC and is owned collectively by 18-20 customers
of Holy Cross Energy, the local electric cooperative. The project
leases land from the local wastewater treatment plant near El Jebel,
CO.5
The cost of the system was $466,000 ($6 per Watt), in line with the
expected installed costs (including maintenance) of $5-6 per Watt.6
The final cost to customers is reduced by the 30% federal tax credit and was also reduced by a rebate
from the utility and upfront sales of the renewable energy credits (RECs), a combined value of $1.50 per
Watt.7
Owners of the panels paid $725 per panel (230 Watts) or $3.15 per Watt.8 The 18-20 owners purchased as
few as 1 panel and as many as 80 of the 340 total panels, although each owner could purchase no more
than would supply 120% of their electricity consumption. 9 The price includes all applicable rebates and
tax credits (all processed by the CEC). 10 Each owner will receive 11 cents per kWh produced by the
panels, slightly higher than net metering because CEC negotiated a PPA with Holy Cross for the
electricity.11 The contract provides ownership rights for 50 years.
Figure 2 compares the ownership of a 2.1 kW share in CEC’s El Jebel project with individual solar
ownership. The individually owned system (also 2.1 kW) is expected to have an installed cost of $8 per
Watt. Although no electricity price inflation figure was given, the national historic average of 2% was
used. Our calculations show a 15-year payback, compared to the CEC projections based on a 5%
inflation rate.
For this figure and all of the similar ones following, the figure does not show incentives claimed by the
project owner or installer, but rather just the cost and incentives that can be claimed by the customer.
Figure 2 – CEC Solar Ownership Compared with Individual Solar Ownership
Share Ownership Individual Ownership
Customer Investment $6,615 Installed Cost (@ $8/W) $16,800
Federal Tax Credit -$4,095
State Rebate @ $1.50/W -$3,150
Net Installed Cost $6,615 Net Installed Cost $9,555
25-year value of electricity 25-year value of electricity
Net metered $18,267 Net metered $15,343
Simple payback 13 years Simple payback 19 yearsNew Rules Project www.newrules.org 6
The CEC’s solar project gets high marks for overcoming barriers to investment and federal tax incentives,
expanding participation and ownership, and at an affordable price. The location of the array gets a high
grade grade for being interconnected near existing infrastructure and on “otherwise unusable land.” The
Clean Energy Collective seems to have a replicable model (based on the Colorado Solar Gardens
legislation).
Community Solar Scorecard: CEC
Overcome Barriers A
Expand Participation A
Expand Ownership A
Affordable A
Location A-
Replicable A
CEC Overall A
Colorado – United Power’s Sol Partners
The Colorado rural electric cooperative, United Power, recently completed a
10 kW solar project in Brighton, CO. The Sol Partners solar farm was
financed in part with a one-time grant from the governor’s office, and is
owned by the utility. United Power’s member-owners may lease a share of the
solar farm in exchange for the solar output.
The Sol Partners solar array was constructed for $120,000 ($12 per Watt – a
figure that reflects high module costs as well as metering, security, monitoring
equipment). The utility was unable to receive the federal tax credit (that
would have been worth $15,000).12 Instead, United Power received a $50,000
grant from the Colorado governor’s Energy Office and the utility provided an in-kind donation for the
labor to construct the modules.13 Lower module costs should make expansions of Sol Partners possible at
$5.50 per Watt (if the utility installs them) or $4.50 per Watt if installed by a contractor that can capture
the federal tax credit. 14
The cost for participants is $1,050 for a 25-year lease (or “license”) on a 210 Watt panel ($5 per Watt).
The contract specifies that United Power can buy back the license at any time and that the buyback cost is
the full value of the panel less 4% per year.15
The utility estimates that a single solar panel will generate $32 per year in electricity credits or a 3%
return on investment based on expected electricity cost escalation of 5%. Historical national electricity
price escalation (2% per year from 1990 to 2008) suggests this may be optimistic. Using 2% instead of
5% cuts the return on investment to zero. In the project FAQ, the utility responds that customers should
contact a tax advisor about the federal tax credits, but it’s doubtful this arrangement would qualify.16
Figure 3 compares a 10-share lease (equivalent to 2.1 kW) to individual ownership of solar. The
individually owned array is the same size (2.1 kW) and expected to cost $8 per Watt installed, before
federal and state tax credits.New Rules Project www.newrules.org 7
The figure calculates the payback period with the more modest assumption about price inflation (2%).
The payback for the original assumption of 5% (not shown) was 20 years for the SolPartners Lease, 19
years for individual ownership.
Figure 3 – Sol Partners Solar Lease Compared to Individual Ownership
SolParters Lease Individual Ownership
Customer Investment $10,500 Installed Cost (@ $8/W) $16,800
Federal tax credit $0 Federal Tax Credit -$4,095
Net Installed Cost
$10,500 State Tax Credit $1.50/W -$3,150
(with credit)
Net Installed Cost $9,555
25-year value of electricity 25-year value of electricity
Net metered $10,250 Net metered $10,250
Simple payback 26 years Simple payback 24 years
The business model used by Sol Partners was successful in developing a collectively owned project
without utilizing the federal tax incentives, but is not creating an attractive return on investment because
of strikingly high capital costs. The project overcame the barriers of tax liability and securities laws by
using the existing rural cooperative structure and finding a one-time grant from the governor’s office.
Being only 10 kW, it helps expand participation modestly (though not ownership), but at a price that is no
better than individual solar ownership (and offers no payback with a more conservative inflation
estimate). The solar array is on utility property for easy grid connection, but is an open field design that
required additional investments to secure the system (perhaps avoidable with a roof-mounted system).
The project has good prospects for expansion, but is scarcely replicable given the one-time grant and high
initial cost.
Community Solar Scorecard: Sol Partners
Overcome Barriers B
Expand Participation C
Expand Ownership F
Affordable C
Location C
Replicable D
Sol Partners Overall C-New Rules Project www.newrules.org 8
Florida Keys Electric Cooperative (FKEC) Simple Solar Program
The FKEC Simple Solar Program is a solar leasing program for members
of the cooperative. The cooperative completed construction of a 96.6 kW
solar array in 2008 financed with federal clean renewable energy bonds
(CREBs). 17
The leasing program allows customers to pay $999 to lease a 175-Watt
panel for 25 years (a cost of $5.71 per Watt), entitling them to the retail
value of the electricity produced by each panel for 25 years. The utility
retains control of the renewable energy credits.18
With the co-op’s assumption of 3% inflation in electricity prices (slightly above the historical average of 2%),
the customer would see their investment pay back (in nominal dollars) in 21 years, receiving approximately
$1,280 from the value of the solar electricity over 25 years.19 Figure 4 provides a comparison to individual
ownership of a similarly size solar array (2.1 kW). Electricity price inflation is calculated at 2% for consistency
with other project financial analyses; using 3% reduces payback time by 2 years for Simple Solar customers
and 1 year for the individually owned system, respectively.
Customers who move within the utility’s service territory can continue to receive the electricity value from the
panels. Those who move outside the territory can assign the value to another cooperative customer.
Figure 4 – Simple Solar Program Share Ownership Compared to Individual Ownership
Share Ownership Individual Ownership
Customer Investment $11,991 Installed Cost (@ $8/W) $16,800
Federal Tax Credit -$5,040
Net Installed Cost $11,991 Net Installed Cost $11,760
25-year value of electricity 25-year value of electricity
Net metered $13,837 Net metered $13,837
Simple payback 23 years Simple payback 22 years
The FKEC leasing program overcomes traditional financial and securities law barriers to investment, in part by
getting CREBs in lieu of federal tax incentives. It also helps expand participation in solar. It provides a taste of
solar ownership by providing a connection between a specific solar installation and the customer, but it doesn’t
provide the same producer relationship as does individual ownership. It does make solar more affordable, with
an upfront cost significantly below individual ownership and a simple payback within 21 years. The solar
array doesn’t use existing structures but is on utility property. It would be hard to replicate given the
dependence on CREBs, which require annual Congressional appropriation and an IRS allocation.
Community Solar Scorecard: Simple Solar
Overcome Barriers A
Expand Participation A
Expand Ownership D
Affordable A
Location C
Replicable D
Simple Solar Overall B-New Rules Project www.newrules.org 9
Maryland – University Park Solar
The University Park Solar community solar project is a private
membership limited liability company (LLC) whose 22 kW solar array
was dedicated in June 2010. The LLC structure is quite common for
community wind power but is new to community solar power, and selling
the electricity to a local church is also a unique feature.
The $126,000 ($5.75 per Watt installed) solar array is financed by over 30
members, with investments largely in the $2,000-4,000 range. 20 The
project LLC will also receive the federal tax credit and accelerated
depreciation (the effective cost per Watt to investors is $2.27).
The solar array is installed on a local church and members are Maryland
residents.21 The investors in University Park LLC are full owners, with no expiration on their rights to a
share of the project revenues.
The LLC will generate revenue from the sale of electricity to the church (at an initial rate of $0.13 per
kWh). The project will also sell the solar renewable energy credits (SRECs) worth $0.25 per kWh.22
These tradable credits have market value of around $0.36 per kWh, but the community solar LLC will sell
them to the solar installer (Standard Solar Inc) at a discount to avoid having to participate in the market. 23
The project’s financial statement expects a 5-year payback on the initial investment.
Figure 5 compares the economics participation in the community solar project to individual ownership.
The individual solar array (2.1 kW) is assumed to cost $8 per Watt installed and to generate $0.119 per
kWh under net metering and $0.25 per kWh for solar RECs. Both solar arrays are assumed to generate
2,919 kWh per year (15.9% capacity factor). The customer investment for the LLC is factored to match
the 2.1 kW capacity used in the individual analysis. The LLC did not factor inflation into its cash flow
estimates, so an assumption of modest inflation (2%) was used.
Figure 5 – University Park Community Solar Share Compared to Individual Ownership
Investment in LLC Individual Ownership
Customer Investment $4,767 Installed Cost (@ $8/W) $16,800
Federal Tax Credit -$5,828
State Grant $1.25/W -$2,625
Net Installed Cost $4,767 Net Installed Cost $8,348
20-year value of electricity 20-year value of electricity
Net meter @ $0.12 $9,220 Power sale @ $0.13 $8,440
SRECs @ $0.25 $17,731 SRECs @ $0.25 $17,731
$26,951 $26,171
Simple payback 5 years Simple payback 9 years
It should be noted that the solar renewable energy credit value will likely fall over time as the falling price
of new solar power converges on the rising retail electricity price, but since this would affect both
scenarios equally, the value was assumed to remain constant.24
The one complication for the University Park Solar project is that, being a private enterprise, they have to
comply with the Securities and Exchange Commission's regulations for investors. Although they avoidedNew Rules Project www.newrules.org 10
the costs of full registration (in the hundreds of thousands of dollars) by restricting themselves to in-state
investors, it limited the project in other ways. They can have no more than 35 “unsophisticated” (non-
wealthy) investors, are not allowed to advertise other than by word of mouth, and each member must
complete a 10-page financial disclosure form for the state of Maryland.25 This issue is discussed in
greater detail later in this paper.
The University Park project is a well-executed community solar project. It impressively overcame
financial and securities barriers and did not use one-time grants. This business model certainly expands
participation and ownership in solar power. The economics are very good for participants, provide less
cost and risk than individual ownership and the investment is affordable in its own right. The project can
be replicated, but the securities regulations surrounding the number and location of investors will make it
a bit more complicated.
Community Solar Scorecard: University Park
Overcome Barriers A
Expand Participation A
Expand Ownership A
Affordable A
Location A
Replicable C
University Park Overall A-
North Carolina – AIRE Greenhouse Solar Project
This 2.4 kW solar project was put together by the Executive Director
of the Appalachian Institute for Renewable Energy (AIRE), Steve
Owen, as a private LLC. It was funded by investments from 7-10
individuals and the electricity is sold to the AIRE building under a
power purchase agreement and its not grid-connected.
The total installed cost including LLC operation expenses was $8.34 per Watt, but this price was reduced
substantially by federal and state tax incentives (NC has a 35% state tax credit). It was designed as a
teaching project, so most installation costs were zero. The project receives close to $0.10 per kWh under
the annual contract with the building. If it does get an interconnection agreement, it would be able to sell
its power plus RECs to NC Green Power for $0.15 per kWh. Figure 6 compares ownership of 2.1 kW in
the Greenhouse Solar project to individual solar ownership of a 2.1 kW array. The individual system is
expected to cost $8 per Watt installed and receive net metering at $0.078 per kWh (we assume that if the
Greenhouse Solar Project could not interconnect, neither will the individual system).New Rules Project www.newrules.org 11
Figure 6 – Greenhouse Solar Investment Compared to Individual Solar Ownership
Share Ownership Individual Ownership
Customer Investment $4,010 Installed Cost (@ $8/W) $16,800
Federal Tax Credit -$3,276
State Tax Credit (35%) -$5,880
Net Installed Cost $4,010 Net Installed Cost $7,644
25-year value of electricity 25-year value of electricity
Net metered $9,197 Net metered $7,395
Simple payback 13 years Simple payback 26 years
Because module prices had peaked around the time this project was installed, project owners expect
expansions to feature lower module prices but also no free labor. Overall, they are anticipating lower
costs for future installs ($7 per Watt).26
The Greenhouse solar project does a good job of overcoming barriers to community solar and provides
access to federal tax incentives for investors. It expands participation in solar, although only in a small
project (so far). It gets high marks for ownership, but a middling grade for affordability because it was
near the same cost as individual ownership. With the array on a local building it gets an ‘A’ for location,
but is probably not very replicable because much of the financial return depends on the building owner’s
willingness to accept green pricing.
Community Solar Scorecard: Greenhouse Solar
Overcome Barriers A
Expand Participation C
Expand Ownership A
Affordable C
Location A
Replicable D
Greenhouse Solar Overall B
Oregon – Solar Pioneer I and II
The city of Ashland, OR, has developed two community solar projects
through its municipal utility, Solar Pioneer I and II. The first phase
was a 30 kW solar installation split between the Shakespeare Festival,
Southern Oregon University and the Civic Center. This first phase
project did not allow community members to buy shares, but was built
as an educational tool on four separate sites. 27
The second phase is a 64 kW community solar system installed on the covered parking area of the city
service center and owned by the municipal utility. The 363 175-Watt panels cost $442,000 (~$7 per Watt)
and the solar array provides electricity for the municipal utility. 28 The project was funded with clean
renewable energy bonds (CREBs) that Bank of America purchased at 1.25% interest. The OregonNew Rules Project www.newrules.org 12
Business Energy Tax Credit Pass-Through allowed the Bank of the Cascades to buy a tax credit worth
35% of the system value – at the discounted price of 25.5% of the system value – and to take the credit
over five years.29
Citizens of Ashland can purchase the output of a panel for 20 years, in 44 Watt increments for $207
($4.71 per Watt). 30 In this respect, the Ashland community solar project allows investors to buy a 20-year
block of electricity at a fixed rate insulating themselves from future cost increases in their utility’s
electricity rates (currently at $0.06 per kWh).
The economics for Ashland’s community solar project are not as favorable for some (maybe most)
participants as individual ownership would be, given the available incentives. The city provides rebates
for solar PV, with a $2.25 per Watt residential rebate and a $1.00 per Watt commercial rebate, both capped
at $7,500 per customer.31 But since residents can get both a 30% federal tax credit and an $3 per Watt
state solar PV rebate ($6,000 cap), the payback on ownership happens twice as fast as an investment in
the community solar project (Figure 7). The ownership calculations do not include the sale of the
renewable electricity credits (RECs), which would make payback even faster. The RECs for Solar
Pioneer II are being held by the utility as a hedge against a possible renewable energy standard policy
being adopted. Both forms of ownership get revenue in the form of a net metering credit.
The assumed inflation factor of 3% is slightly above the historic average of 2% and the latter was used for
the calculations in Figure 7. Using 3% would subtract approximately 4 years from the payback for the
Solar Pioneer II investment and 1 year from the payback for the individually owned system.
Figure 7 – Investment in Solar Pioneer II Program Compared to Individual Ownership
Investment Individual Ownership
Customer Investment $9,900 Installed Cost (@ $8/W) $16,800
Share (%) 0.3% City Utility Rebate -$4,725
Electricity price inflation 3.0% State Tax Credit -$6,000
Federal Tax Credit -$1,823
Net Installed Cost $4,253
20-year value of electricity 20-year value of electricity
Net meter @ $0.06 Net meter @ $0.06
$5,209 $5,209
inflated at 2%/yr inflated at 2%/yr
Simple payback 34 years Simple payback 17 years
Ashland overcame barriers to community solar in the same fashion as Ellensburg, even receiving funds
from one of the same organizations (the Bonneville Environmental Foundation). It was also not able to
access federal tax incentives. The project is expanding participation in solar, not ownership, but the cost
to participants is nearly twice that of individual ownership. This is because the generous incentives from
the city and state are only available to individuals and not Ashland Solar Pioneer participants.
Furthermore, since panel subscriptions expire after 20 years, participants will never get their up-front
investment money back, making this a pre-pay green pricing scheme. The Ashland project is clever use
of existing space, covering a city parking area with solar panels. Overall, the project is not very
replicable because it uses clean renewable energy bonds (CREBs) subject to annual appropriations of
Congress as well as one-time assistance (marketing and monitoring) from the Bonneville Environmental
Foundation.New Rules Project www.newrules.org 13
Community Solar Scorecard: Ashland
Overcome Barriers A
Expand Participation A
Expand Ownership F
Affordable F
Location A
Replicable D
Ashland Overall C+
Utah – St. George’s SunSmart
SunSmart in St. George, UT, is a 100 kW solar farm operated by The
City of St. George Energy Services Department and Dixie Escalante
Electric. Each entity provided half the capital for the solar farm, with
plans to expand it up to 2,000 kW.32 The two utilities split the
renewable energy credits for the project, which are sold through a
broker for about a half cent per kWh (a low price because Utah has no
mandatory renewable portfolio standard).
Citizens of St. George can buy up to 4 kW of the solar farm, in half-
share (0.5 kW) increments costing $3,000 apiece ($6 per Watt), with ownership lasting 19 years. The
share is guaranteed to provide at least 800 kilowatt-hours (kWh) per year, although the expected
generation is 1,680 kWh (and early results suggest the estimates were correct).33 The state of Utah
provides a 25% tax credit (maximum of $2,000) for the purchase and state law treats solar share
ownership the same as owning your own solar panel. Federal tax credits are not available to participants
because it only applies to people who have title to their solar investment and not just a share of output.34
The solar farm started operations in January 2009 and had sold 26.5 shares (about one-quarter of the
output) by September 2009.35
Figure 8 compares the costs of private ownership with a subscription in the SunSmart program.
Customer of either are expected to net meter the solar electricity, and to receive $0.068 per kWh (the
residential electric rate for the St. George city utility; the rates in Dixie Escalante territory are lower, only
$0.055 per kWh). 36 Payback was estimated over 20 years for consistency of comparison.
The project marketing does not include an estimate of electricity price inflation, which has historically
been around 2%. Factoring this in to the estimate reduced payback times by 12-13 years (not enough for
the subscription to pay back by the end of the 19 years).New Rules Project www.newrules.org 14
Figure 8 – SunSmart Share Ownership Compared to Individual Ownership
Share Ownership Individual Ownership
Customer Investment $12,600 Installed Cost (@ $8/W) $16,800
State Tax Credit -$2,000 State Tax Credit -$2,000
Federal Tax Credit -$4,440
Net Installed Cost $10,600 Net Installed Cost $10,360
20-year value of electricity 20-year value of electricity
Net meter @ $0.068 $5,829 Net meter @ $0.068 $5,829
Simple payback 32 years Simple payback 32 years
The SunSmart solar installation was relatively unique in combining the financing power of two local
utilities without outside capital. While the project did not get federal incentives, it was designed to allow
participants to get a Utah state tax credit. It will expand participation, though not ownership, of solar in
St. George. The program ranks poorly on affordability because the program shares last only 19 years, less
than half the time for an investor to make back their initial investment. This is another example of pre-
paid green pricing. Compared to individual ownership the economics seem reasonable, but only because
individual ownership is a uniquely poor investment in Utah compared to the other states with community
solar projects. The project is an open-field array, but it interconnects to existing infrastructure.
SunSmart is a replicable upfront capital financing model, but it depends on the altruistic nature of
community residents to purchase shares.
Community Solar Scorecard: SunSmart
Overcome Barriers B
Expand Participation A
Expand Ownership F
Affordable F
Location C
Replicable C
SunSmart Overall C-New Rules Project www.newrules.org 15
Washington – Ellensburg Community Solar Project
Interestingly, only two solar projects are receiving incentives under
the state’s community solar law and the Ellensburg Solar Project is
one of them. 37 However the project was unable to receive federal tax
incentives because it is owned by the Ellensburg public utility, a
nonprofit entity that could not use the federal tax credits. The utility
has constructed a 58 kW array in two phases.
The first phase – 36 kW – came online in November 2006 and cost $7.91 per Watt. It was financed with
voluntary investments from 73 individual contributors (averaging $1,400), the Bonneville Environmental
Foundation, and the Bonneville Power Administration’s (BPA) Conservation Rate Credit. Phase Two –
22 kW – was financed with a grant from Central Washington University and a second grant from BPA’s
Conservation Rate Credit. 38
The entirety of the electricity generated by Phase I is credited to the 73 contributing individuals in
proportion to their contribution, for a term of “20+ years.”39 Their share of the array’s electricity
production is credited back on their electricity bills at the BPA wholesale rate, so it’s as though each
individual has their own small solar array generating on-site electricity. Because the net metering credit
will be insufficient to pay off the initial investment for more than 50 years, investors would be unlikely to
get a return on their investment.
Instead, the investors are buying a pre-paid block (20 years worth) of electricity. And since they are
paying more than they will get in return, they are paying a premium. This appears to mimic traditional
green pricing programs where customers voluntarily pay a higher rate for electricity from renewable
resources. The original project could be fairly labeled “pre-paid green pricing.”
However, after the passage of amendments to the state renewable energy production incentive in 2009,
investors may be able to receive a $0.30 per kWh state incentive (until 2020) in addition to their credit
from the public utility. This incentive program provides a base rate of $0.15 per kWh for renewable
energy projects and provides a multiplier for community projects (2x), projects using an inverter
manufactured in Washington (1.2x) and for solar modules built in Washington (2.4x). 40 This will make an
enormous difference in the economics, as shown in Figure 9.41 The split share value in the far right
column is shown because the project gets the state incentive for the first 10 years, until it expires.
Figure 9 – Payback for Local Investor in Ellensburg Solar Project
Original Credit Credit with State
Incentive
Customer Investment $1400 $1400
Share (%) 1% 1%
BPA Wholesale Rate $0.05 $0.05
Annual share value (kWh) 520 520
Annual share value ($) $26 $182 / $26
Simple payback 54 years 8 years
While the state incentive significantly improves the economics for community solar projects, it does not
do as much for individually owned ones. The base rate for individually owned projects is $0.15 per kWh,
but a 2009 update to the production incentive raised the base rate for community solar to $0.30 per kWh.
The following comparison (Figure 10) illustrates how a community solar subscription pays back much
faster than private ownership. In both cases, the owner/investor is assumed to receive the state production
incentive for 10 years.New Rules Project www.newrules.org 16
Adding an inflation assumption for general electricity prices (the national historic average of 2%) makes
almost no difference to the community solar investor, but shaved off approximately 14 years from the
payback time for individual solar ownership.
Figure 10 – Investment in Ellensburg Community Solar Compared to Individual Ownership
Investment Individual Ownership
Customer Investment $8,167 Installed Cost (@ $8/W) $16,800
Federal Tax Credit -$5,040
Net Installed Cost $8,167 Net Installed Cost $11,760
20-year value of electricity 20-year value of electricity
Wholesale @ $0.05 $3,685 Wholesale @ $0.05 $3,685
Comm. solar incentive Ind. solar incentive
$9,100 $4,550
@ $0.30 for 10 yrs. @ $0.15 for 10 yrs.
$12,785 $8,235
Simple payback 8 years Simple payback 34 years
Ellensburg’s community solar project was the result of innovative collaboration, bringing together many
partners to overcome financial barriers (although it was unable to use federal incentives). It expanded
participation, though not ownership, of solar power. In terms of price, the initial project was no more than
a pre-paid green pricing program, costing investors more than conventional electricity and requiring them
to pay up front. The state’s community solar incentive of $0.30/kWh changes that significantly, but the
project’s grade on affordability will average the initial design and the result of state policy. The location
is open space, but is graded up slightly because of its high visibility location adjacent to Interstate 90. 42
Given the significant grants and contributions from foundations, the project is not particularly replicable.
Community Solar Scorecard: Ellensburg
Overcome Barriers B
Expand Participation A
Expand Ownership F
Affordable C
Location C
Replicable D
Ellensburg Overall CNew Rules Project www.newrules.org 17
Washington – Solar for Sakai
This 5.1 kW system was built by Community Energy Solutions with a
grant from Puget Sound Energy and charitable contributions from
citizens in Bainbridge Island, WA. It is the second of two solar
projects to receive the Washington solar production incentive and is
installed on the Sakai Intermediate School on Bainbridge Island.
The total project budget was $50,000, with $30,000 from 26
contributions from individuals or organizations and the remainder
from a Puget Sound Energy grant for solar in the schools. The 5.1
kW array produces about 6,120 kWh per year and the school receives a
net metering credit in addition to the state’s production incentive ($0.15 per kWh) for the electricity.
Contributors to the project are just donors, and the only financial value of their contribution is the
charitable tax deduction. Therefore we provide no analysis of the value to the contributor.
The school’s system will be expanded by Community Energy Solutions, who has obtained a $7,500 grant
from the local Rotary Club and some sustainability money from the school. With this and other funds
they hope to double the system size by the end of 2010.
Because the school is the project owner (and not one of the qualifying entities in the state’s community
solar initiative, the project does not get the higher community solar incentive (30 cents). 43
The Solar for Sakai problem in an interesting model, using a utility grant for schools and the generosity of
charitable contributions to get a small solar array built, but failing to get any federal tax incentives (or
even the higher state community solar incentive). It expands participation, though only via a small array,
and does not encourage solar ownership. The project was relatively expensive and offers little financial
value to contributors. It receives high marks for location on the roof of the local school, but is a poor
model with its dependence on altruistic solar donors.
Community Solar Scorecard: Sakai
Overcome Barriers B
Expand Participation B
Expand Ownership F
Affordable D
Location A
Replicable F
Sakai Overall C-New Rules Project www.newrules.org 18
Other Models of Community Solar
Buying Groups and Cooperative Negotiations
Not all community solar projects involve a common solar array. Instead, some community efforts have
focused on dispersing information about and reducing prices for individual ownership. One example is a
cooperative buying group, like Ace Hardware stores use to collectively buy tools at lower prices than
individual outlets could receive. A buying group negotiates reduced module and installation costs for a
group of people who will individually install solar on their own property.
There are several examples of buying groups. The Solarize Portland cooperative succeeding in recruiting
145 members to install solar PV and negotiated the installed cost down to $6.80 from $9.00. 44 In San
Jose, CA, the San Jose Credit Union partnered with the San Jose Solar America City program to offer
group buying discounts on solar PV and solar thermal. 45
A for-profit company called 1 Block Off the Grid (1BOG) operates in several states on a similar model,
organizing group discounts in exchange for referral fees from installers. They typically achieve a 15%
discount for members.46
Buying groups do not help overcome barriers to financing or organizing community solar projects, but
they can expand participation and ownership of solar. They also help make solar more affordable. Since
buying groups have no influence on solar installation location, they get a neutral grade, but the model is
not only replicable but the core of a successful for-profit business. Overall, buying groups are an
effective, if modest, tool for encouraging more distributed solar power and even ownership.
Community Solar Scorecard: Buying Groups
Overcome Barriers F
Expand Participation C
Expand Ownership A
Affordable A
Location C
Replicable A
Buying Groups Overall B-
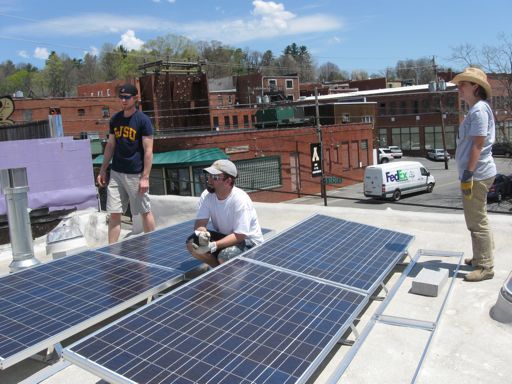
Washington DC – Mt. Pleasant Solar Cooperative
The Mt. Pleasant Solar Cooperative in Washington, DC, is similar to a buying group, but instead of
negotiating with a single installer, they negotiated with several “preferred” installers and those installers
compete to offer the best price to each individual member. 47 The cooperative has 70 members, and 45
have already had solar arrays installed on their roofs by May 2010. 48
The cooperative has done substantial work to improve the economics of individual solar PV. With a
combination of the negotiations with preferred installers to get installed costs of near $5.50 per Watt, the
federal tax credit, the District grant program and sale of solar RECs, the installations have a payback ofNew Rules Project www.newrules.org 19
less than three years. 49 Figure 11 offers a comparison of the Mt. Pleasant Solar Cooperative payback
period to individual (non-cooperative) ownership. The 2.1 kW arrays are assumed to generate 2,682 kWh
per year. The only difference between the two solar installations is that an individual acting alone would
likely pay more to have their solar array installed ($8 per Watt).
Figure 11 – Individual Solar Ownership with and without Cooperative Membership
Cooperative Member Non-Member
Installed Cost (@ $5.50/W) $11,550 Installed Cost (@ $8/W) $16,800
Federal Tax Credit -$3,465 Federal Tax Credit -$5,040
District Rebate -$6,300 District Rebate -$6,300
Net Installed Cost $1,785 Net Installed Cost $5,460
25-year value of electricity 25-year value of electricity
Net metering @ $0.11 $18,660 Net metering @ $0.11 $18,660
SRECs (@ $0.37 for 5 SRECs (@ $0.37 for 5 yrs;
yrs; $0.37 less retail rate $9,669 $0.37 less retail rate $9,669
thereafter) thereafter)
$28,329 $28,329
Simple payback 2 years Simple payback 5 years
The Mt. Pleasant Co-op has also been an active advocacy group, helping to spawn eight other solar
cooperatives in the District, lobbying for legislation to increase the value of SRECs, and establish (and
maintain) a solar grant program funded by a small utility bill fee. They also do community meetings and
consultations with individuals wanting to go solar. Going forward, they are also working on new policy
including community net metering and a solar gardens bill.50
The Mt. Pleasant Cooperative receives the same grades as buying groups, because even though it has been
incredibly successful at making individual solar ownership possible and affordable, it does not help
people with shady property or renters make the shift to solar power.
Individual Solar Leasing
SolarCity is one of several companies that provide a lower risk model of individual solar power. Their
lease arrangement allows a homeowner with a sunny roof to have a solar array installed with zero or little
money down, and to have a lower monthly payment (lease plus remaining electric bill) than their current
electricity bill. While individual solar leases are not available for folks with shady roofs or renters, they
may offer another route to solar for those with sunny property but low cash on hand. However, solar
leasing companies tend to operate only in states with generous solar incentives (SolarCity operates in
fives states).51
Figure 12 illustrates the economics of a 20-year SolarCity lease for a 2.1 kW system, modeled on a
property in Boulder, CO. It compares the SolarCity lease to individual ownership, assuming the
individual solar array costs $8 per Watt installed and that both systems produce 3,200 kWh per year. 52 In
both cases, grid electricity prices are expected to inflate at 5%, the price inflation mark for Xcel in
Colorado, according to SolarCity.53You can also read