GENDER DISPARITIES IN THE LABOUR MARKET? EXAMINING THE COVID-19 PANDEMIC IN ALBERTA - The School of Public Policy
←
→
Page content transcription
If your browser does not render page correctly, please read the page content below
PUBLICATIONS
SPP Research Paper

Volume 14:18 June 2021

GENDER DISPARITIES IN THE LABOUR
MARKET? EXAMINING THE COVID-19
PANDEMIC IN ALBERTA†

John Baker,1 Kourtney Koebel2 and Lindsay Tedds3

SUMMARY
The initial wave of the COVID-19 pandemic generated large labour market
disparities between men and women; however, in Alberta these differences
did not persist beyond summer 2020. Instead, the pandemic continues to
persistently and negatively affect the labour market patterns of parents with
young children, regardless of the parent’s gender. This finding should guide
policy-makers when planning for the province’s economic recovery.

Using data from Alberta up to and including the December 2020 release
of the Labour Force Survey, we do not find evidence that the “she-cession”
continued into Alberta’s second round of health restriction measures. Instead,
we find that school transitions to virtual learning, daycare closures, and
parents opting for online learning resulted in profound and persistent effects
on workers with young children compared to workers without children.

Recovery plans focusing solely on gender may be therefore insufficient for
addressing the effects that different groups have experienced during the
pandemic. Policy-makers should target policies towards both mothers and
fathers with young children. Moreover, new policies should be aimed at
supporting parents so that they do not face additional stress over how they

† This work was supported by a generous contribution by the John Dobson Foundation (Project 10011864) which had no role in the
 conceptualization, data collection, analysis, decision to publish, or preparation of the manuscript. The authors declare they have
 no competing interests, either financial or community in nature.
1
 Department of Economics, University of Waterloo
2
 Centre for Industrial Relations and Human Resources, University of Toronto
3
 Department of Economics, University of Calgary

http://dx.doi.org/10.11575/sppp.v14i.72237 w w w. policyschool.ca
will pay their bills and feed their families if they lose their jobs or must reduce their
 hours to stay home to care for their children.

 The Canada Recovery Caregiving Benefit (CRCB) should remain in place until all threats
 of school and child-care facility closures are past. Alberta has received approximately
 $144 million in direct CRCB subsidies, but the weekly amount of $500 per recipient is
 less than minimum wage in a full-time job, meaning parents still may be unable to pay
 bills and meet their families’ needs. The province should top up the CRCB for lower- or
 single-income parents.

 Employment Insurance benefits should be made available to parents who quit their
 jobs to take care of their children as a direct result of public health measures. As
 well, those parents with young children who receive welfare payments should not be
 required to search for jobs while public health measures remain in place.

 The Alberta government needs to work together with the federal government to provide
 adequate support to daycare centres and schools to cover the added pandemic-related
 costs. Alberta received $87 million in federal funding to help with those costs and has
 itself contributed $17.8 million to extra health and safety measures in daycare centres.
 This is money well spent, for when parents feel their children are in a safe place, they will
 not keep them at home and jeopardize or lose their own employment.

 However, the end of the pandemic will not mean an abrupt end to its effects on
 the labour market. Even though this paper finds no differences in the situations of
 employed men and women, the latter may experience more labour market friction in
 the long run, due to missed opportunities for on-the-job training and work experience.
 One benefit that can come out of the labour market disruptions caused by the
 pandemic is a renewed focus on addressing pre-pandemic inequities between men and
 women with children. From this perspective, Alberta should celebrate and embrace the
 recent federal commitment to a Canada-wide early learning and child care plan.

1
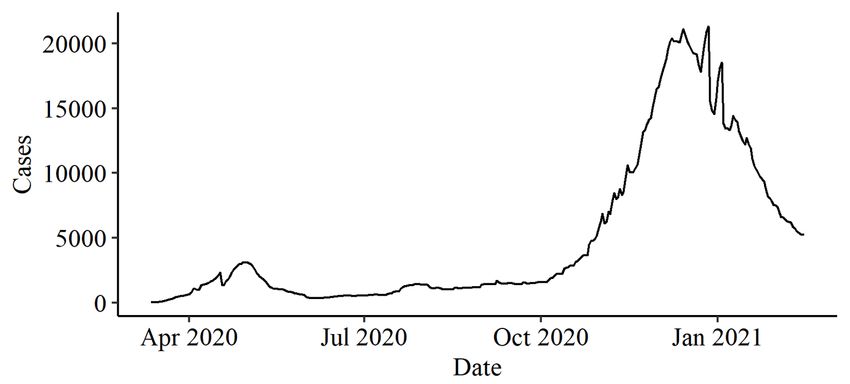
INTRODUCTION
 On March 5, 2020, Alberta reported its first case of the novel coronavirus disease
 (COVID-19). Shortly after, the government took extensive measures to “flatten the
 epidemic curve” and contain the virus’s spread: schools closed to face-to-face learning
 and daycares closed completely on March 15, a state of public health emergency was
 declared on March 17 and the closure of non-essential businesses and services was
 mandated on March 27. The impacts of these social-distancing efforts on Alberta’s labour
 market were large and immediate. In a year-over-year comparison, data from April 2020
 show that employment in Alberta declined by 15.5 per cent, while the unemployment rate
 increased to 13.4 per cent (Alberta Treasury Board and Finance 2020).

 As the government started to relax public health restrictions over the summer months,
 Alberta’s labour market showed promising signs of recovery (Business Council
 of Alberta 2020). However, when the option for in-person K-12 school returned in
 September 2020, upwards of 30 per cent of students chose the online learning option,
 depending on school district, as parents expressed concern about their children’s
 safety (Bench 2021). By mid-September 2020, COVID-19 cases began to rise again,
 with Alberta’s cases reaching new daily record highs throughout fall 2020 (see Figure
 1). The virus’s re-emergence resulted in K-12 students, teachers and staff having to
 isolate as exposure to the virus in schools led to another round of comprehensive
 social-distancing restrictions. A second state of public health emergency was
 declared on November 24,1 and on November 30, in-person classes were moved
 fully online for grades 7-12 province-wide. On December 8, additional restrictions
 were imposed until January 12, 2021, including: i) the prohibition of all indoor and
 outdoor social gatherings, including limiting in-home contact to household members
 only; ii) mandatory working from home when physical presence was not required; iii)
 mandatory closure of restaurants/bars/cafes, entertainment businesses and personal
 and wellness services; and iv) all K-12 students returning to online learning for the first
 week of school in January. 2 Similar to the first round of social-distancing measures,
 such substantial restrictions were likely accompanied by major changes to Alberta’s
 labour market, including reduced working hours, increased unemployment or complete
 non-participation in the labour force altogether.

 1
 For additional details on the restrictions imposed by Alberta’s government in November, see Cameron-Blake
 (2021) and Pearson (2020).
 2
 See CBC News (2020) for further details.

2
Figure 1: Number of Active COVID-19 Cases in Alberta, March 12, 2020–February 15, 2021

 Source: Government of Canada Public Health Infobase, 2020–2021. Tabulations by authors.

 While research has demonstrated that Canada’s nation-wide economic shutdowns
 had the largest adverse impact on low-wage workers in the first wave of the virus
 (Koebel and Pohler 2020; Lemieux et al. 2020; Statistics Canada 2020a), researchers
 and policy-makers in Canada have been particularly concerned about the potential
 gendered effects of the crisis (Alon et al. 2020; Montenovo et al. 2020; Qian and Fuller
 2020; Stevenson 2020). 3 Using data from March 2020 across Canada, several reports
 have shown that declines in employment were much larger for women than for men
 (Lemieux et al. 2020; Statistics Canada 2020a). Within Alberta specifically, a report
 from the Business Council of Alberta (2020) similarly shows that the province’s first
 round of business closures in March 2020 had much larger negative impacts on the
 labour market outcomes of women than men.

 Compared to previous recessions, several factors unique to the COVID-19 economic
 crisis explain why the shutdowns may have exacerbated gender-based disparities
 in the labour market. First, the mandatory shutdown of non-essential businesses
 disproportionately impacted industries that employ a relatively greater share of women
 than men (Alon et al. 2020). Second, school and child-care closures meant that parents
 had to provide child care in the home. Because women in Canada tend to take on a
 greater share of unpaid work in the household (Moyser and Burlock 2018), the sudden
 need for at-home child care during working hours may have also disproportionately
 reduced the ability of mothers to stay at (or return to) work.4 Note that if this is the
 main mechanism driving gender labour market disparities during the pandemic, then
 as schools and child-care centres reopen, more women can return to work and the
 aforementioned gender disparities should disappear (at least for parents).

 3
 For example, in a February 2021 press release for the Feminist Response and Recovery Fund, the government
 of Canada emphasized that “the COVID-19 pandemic has magnified systemic and longstanding inequalities,
 with women and girls disproportionately affected by the crisis” (Women and Gender Equality Canada 2021).
 The federal government expressed similar concerns about an asymmetric economic recovery for women in
 the 2020 Fall Economic Update (Department of Finance 2020).
 4
 Even if a parent’s work is amenable to working from home, the need to provide child care does not
 necessarily mean that pre-crisis hours of work (or even employment) were maintained.

3
Evidence suggests that, in Alberta, the gendered labour market effects identified
 early in the pandemic have not persisted. A report by the Business Council of Alberta
 (2020) shows that, over the summer months, as the government reduced restrictions,
 the employment of men and women recovered at similar rates. 5 The divergence in
 the gendered effects of the pandemic between March and August has led to ongoing
 disputes in Alberta’s legislature about how to best design an economic recovery plan
 for the province. The opposition party has cited the difficulty of managing parenting
 duties and work during the pandemic, as well as pre-crisis affordability of child care in
 the province, as reasons for a gender-oriented economic recovery plan. In contrast, the
 ruling United Conservative Party (UCP) has argued in line with the Business Council
 of Alberta report that women have recovered as well as men, and therefore a gender-
 focused plan is unwarranted.6

 At Canada’s federal level, evidence that the crisis created gendered differentials in
 employment outcomes early on prompted the government to define the economic
 consequences of the pandemic as a “she-cession.”7 And while the federal government
 has advocated for gender-based policies in its economic recovery package, Alberta’s
 provincial government has not yet put forth a similar initiative. As these policy debates
 ensue, and the COVID-19 pandemic continues to upend Alberta’s economy, there is a
 strong need to better understand the potential crisis-driven gender disparities in the
 labour market at the provincial level.

 There are two main reasons that the evidence presented by the Business Council of
 Alberta (2020) is insufficient for both examining the possibility of the pandemic’s
 gendered effects and determining which types of policies should be included in an
 economic recovery plan. First, the analysis ignores the intersection of gender with
 parental status. Because child-care provision is one of the main theoretical mechanisms
 behind greater reduced female employment during the crisis, what matters most for
 drawing informed conclusions is a comparison of mothers and fathers, not women and
 men more generally. Second, it is possible that the province may have experienced
 a second divergence in the labour market outcomes of men and women like that
 in March because of the: i) large number of students opting for online learning in
 September 2020; ii) subsequent round of class- and school-specific shifts to online
 learning throughout the fall; iii) shifts to online learning for all students in Grade 7 at
 the end of November; and iv) targeted mandatory business shutdowns in December.
 These second-wave closures could therefore result in a K-shaped recovery, which may
 further exacerbate already large labour market disparities between women and men,
 even as the province begins to recover.

 5
 The Business Council of Alberta report also shows that women aged 55+, as well as women aged 20–24, did
 not experience the same recovery as men, or the key 25–54 demographic group more generally.
 6
 This debate took place in the second sitting of the fall 2020 Alberta legislature between Minister of Culture,
 Multiculturalism and Status of Women Leela Aheer and Opposition member Rakhi Pancholi.
 7
 For further information on the federal government’s Fall Economic Statement, readers are referred to the
 Department of Finance (2020).

4
In this paper, we explore labour market trends in Alberta between March 2020 and
 December 2020 to determine whether gender-specific economic recovery policies are
 needed at the provincial level. More specifically, we explore whether and to what extent
 the pandemic produced differential labour market effects on women and men (with
 and without children) and whether these groups have recovered at similar rates. We
 are particularly interested in labour market outcomes during Alberta’s second wave, as
 policy-makers have yet to consider this.

 Using the public-use Labour Force Survey (LFS) microdata files, we focus on two main
 outcomes: employment and hours worked. While we confirm large gender differentials
 in the first wave of the pandemic, during the second wave we find no evidence that
 women were impacted more adversely than men. Interestingly, we find that the crisis
 had persistently large, negative and statistically significant impacts on parents — both
 mothers and fathers — with young children in the household. Our results suggest
 that, during the second wave, men with young children have lost more hours of work
 than their female counterparts. However, when we investigate cumulative losses,
 we find that women with young children have experienced the largest reductions in
 hours worked over the entire course of the pandemic. Our results therefore do not
 point to evidence of a she-cession in Alberta. Instead, they suggest that the COVID-19
 pandemic is a crisis of parental care, and that, among parents, the shutdowns did not
 reduce the labour supply of mothers more than fathers. We conclude with a discussion
 of policy implications.

 DATA: THE LABOUR FORCE SURVEY
 For our main results, we use Statistics Canada’s LFS public-use microdata files from
 2019 and 2020. The LFS is Canada’s preeminent source for monthly data on the labour
 market. Each month, respondents are asked about their labour market behaviour
 in a given reference week, which usually includes the 15th day of the month. Survey
 respondents are drawn from the nationwide non-institutionalized population that is 15
 years of age and older. The LFS uses a six-month rotating panel design: participating
 households are followed for six consecutive months, after which they are dropped from
 the sample. The public-use LFS files do not allow researchers to link individuals across
 time; as such, we treat the LFS as a repeated cross-section. Our analyses use data from
 Alberta only.

 We separately examine changes in labour force statistics for each month since the start
 of the pandemic (i.e., March 2020 to December 2020), which allows us to determine
 how trends have changed. We exclude individuals who have never worked (n = 13,228),
 as well as unpaid family workers (n = 258). In addition, we also exclude individuals who
 are not employed and who last worked more than a year ago (n = 51,471). In this sense,
 our sample is selected such that we examine respondents who were somewhat attached
 to the labour market before the pandemic. We do this to isolate the pandemic’s impact
 on the labour market since those who were not attached to the labour market prior to
 the economic shutdowns are less likely to be impacted by them (acknowledging that
 their job search might have been). In doing so, however, it is important to note that we
 omit small groups of individuals (in particular, youth who have not started working)

5
who may experience scarring effects from the pandemic in the long run. We are less
 concerned about this, as the focus of this paper is on the immediate or short-run impact
 of the COVID-19 economic shutdowns in Alberta.

 Our main outcomes of interest include a dichotomous measure of whether an
 individual is employed and at work, a dichotomous measure of whether an individual
 is employed and absent from work and a continuous measure of an individual’s total
 actual weekly hours of formal, paid work at all jobs (we emphasize formal and paid
 since this measure does not capture unpaid work that takes place in the household).
 We use respondents’ actual hours worked rather than their usual hours worked since
 Koebel and Pohler (2020) show that the latter were not impacted by the pandemic. To
 ensure that unemployed individuals and labour market non-participants are included in
 our hours-worked estimates, and to get a sense of the overall impact of the pandemic
 on hours worked at the extensive margin, we simply set actual hours worked to zero
 for all individuals who fall into these categories. In addition, we examine hours worked
 exclusively among those who retained employment (either at work or absent from
 work) to get a sense of the labour market impacts of the pandemic at the intensive
 margin. We also provide results examining labour force participation and part-time
 employment. The former statistic allows us to determine the extent to which the
 economic shutdowns have pushed Alberta residents out of the labour market entirely,
 while the latter measure allows us to examine whether the composition of employment
 has shifted away from full-time work.

 In this paper, we are particularly interested in identifying whether the COVID-19
 pandemic had a differential impact on labour market outcomes across various socio-
 demographic groups. Given paramount concerns about the gendered impacts of the
 pandemic in the media and among policy-makers, we first examine labour market
 trends across men and women. In addition, because many Canadians faced the added
 burden of home-based child care during the crisis, we also look across parent status,
 as well as the intersection of gender and parental status. For simplicity, we define
 parents as those whose youngest child is less than 13 years of age. We note that, due to
 limitations of the LFS questionnaire, we are unable to identify other socio-demographic
 groups that may have been disproportionately impacted by the pandemic. 8 More
 specifically, we are unable to examine labour market trends across Indigenous, Black
 and other racial groups, gender identity or LGBTQ+ status.

 DESCRIPTIVE STATISTICS
 Table 1 displays descriptive statistics for our sample of respondents from Alberta in
 2019 and 2020.9 Panel A contains summary statistics for employed respondents (either
 absent from or at work) only, while panel B contains summary statistics for all LFS
 respondents (i.e., employed, unemployed and not in the labour force). Examining panel
 B, there is a clear reduction in both employment (at work) and average total actual hours

 8
 Statistics Canada (2020b) focuses on the impact of COVID-19 on immigrants and visible minorities.
 9
 Note that the employment rate and labour force participation rate are higher than the real employment and
 labour force participation rate in Alberta because of the sample selection described above.

6
worked (all jobs) between the two years. Overall, labour force participation declined by
 two percentage points, while part-time employment remained the same at 18 per cent.
 Average wages increased slightly between the two years; this is likely because job losses
 have been heavily concentrated in low-wage jobs so that the wages among individuals
 who remained employed throughout the pandemic are, on average, higher.

 In terms of the socio-demographic characteristics of our sample, there are no
 remarkable differences between the pre- and post-pandemic years. In both years,
 almost half of our sample is comprised of women. About 19 per cent of respondents
 work in the public sector and roughly 25 per cent are covered by a collective
 agreement. The majority of LFS respondents: i) are married; ii) are non-students; and
 iii) do not have any children residing in the household. Of those with children, the
 presence of a child under the age of six is the most common, followed by children aged
 six to 12. Finally, there is a relatively even distribution of ages in our sample, though
 there are very few respondents who are older than 65.

 Table 1: Descriptive Statistics, 2019 and 2020
 2019 2020
 Panel A: Employed Respondents (absent or at work)

 Average total actual hours worked (all jobs) 33.90 32.29
 (17.44) (18.16)
 Part-time employment .18 .18
 (.38) (.39)
 Average hourly wage ($) 31.39 32.89
 (15.66) (16.10)
 Average job tenure (months) 82.21 86.80
 (78.03) (77.75)
 Public .19 .20
 (.39) (.40)
 Union .25 .26
 (.43) (.44)
 N 80,308 64,772

 Panel B: All Respondents

 Average total actual hours worked (all jobs) 30.42 27.15
 (19.46) (20.42)
 Employed, at work .82 .75
 (.38) (.44)
 Employed, absent from work .07 .09
 (.26) (.29)
 Labour force participation .94 .92
 (.24) (.28)
 Female .46 .46
 (.50) (.50)
 Married* (ref: single) .63 .64
 (.48) (.48)
 Children
 None .63 .61
 (.48) (.49)

7
Youngest child < 6 .14 .15
 (.35) (.36)
 Youngest child 6–12 .11 .11
 (.32) (.32)
 Youngest child 13–17 .06 .06
 (.24) (.25)
 Youngest child 18–24 .05 .06
 (.23) (.24)
 Low education** .30 .29
 (.46) (.45)
 Student
 Non-student .92 .92
 (.27) (.28)
 Full-time .06 .06
 (.24) (.24)
 Part-time .02 .02
 (.14) (.14)
 Immigrant .24 .23
 (.43) (.42)
 Age Group
 Age 15–19 .14 .14
 (.35) (.34)
 Age 25–34 .23 .23
 (.42) (.42)
 Age 35–44 .23 .24
 (.42) (.43)
 Age 45–54 .19 .19
 (.39) (.39)
 Age 55–64 .15 .16
 (.36) (.36)
 Age 65+ .05 .05
 (.22) (.21)
 N 89,644 76,697

 Notes: Summary statistics are computed with LFS survey weights. Unweighted sample sizes reported. *
 Married includes common-law relationships. ** Low education includes individuals who have secondary
 education or less. Proportions may not sum to one due to rounding. Sample excludes: i) unpaid family
 workers; ii) respondents who have never worked; and iii) respondents who are not employed and who last
 worked more than a year ago.
 Source: Canadian Labour Force Survey, public-use microdata files, 2019–2020. Tabulations by authors.

 It is clear in Table 1 that survey response declined substantially over the course of the
 pandemic. Overall, between 2019 and 2020 there is a reduction of 12,947 respondents.
 While this may be potentially problematic if those still responding to the LFS are more
 (or less) likely to be employed during the pandemic than those who are not responding,
 Table 1 suggests that the use of survey weights adequately corrects for the possibility
 of a non-representative sample due to non-random attrition.

 In Table 2, we present data on changes in employment rates, labour force participation
 rates, average weekly hours worked and the share of employment in part-time
 occupations across several different demographics of interest. Note that in order to

8
reflect pre- and post-COVID-19 samples over the same seasonal period, these statistics
 include all data between March and December in 2019 and 2020.

 Across gender, age, parental status, education and geography, declines in the Alberta
 labour market due to the COVID-19 economic crisis have been wide-ranging. The raw
 differentials we present in Table 2 suggest that, overall, the following groups have
 experienced especially large labour market consequences during the pandemic: i)
 women; ii) individuals under the age of 30; iii) individuals with less than a bachelor’s
 degree; iv) and residents of Edmonton.10 Across the four labour market statistics
 presented, the largest reductions are seen in employment rates. We do not observe
 movements of a similar magnitude for labour force participation. This suggests that
 many individuals shifted into unemployment rather than complete non-participation;
 that is, many respondents may have been temporarily laid off or were still searching for
 work despite heavy losses in employment. Furthermore, the reduction in labour market
 hours worked is shown to be uniform across all demographics. Table 2 also indicates
 that the 15–29-year-old cohort experienced a slight increase in part-time employment
 during the pandemic.

 Table 2: Changes in Labour Market Statistics between 2019 and 2020,
 March–December
 Employment Labour Force Average Weekly Part-Time
 Rate Participation Rate Hours Worked Employment

 2019 2020 Diff. 2019 2020 Diff. 2019 2020 Diff. 2019 2020 Diff.

 Men (15–29) 83.3 74.0 -9.3 89.2 86.7 -2.5 29.0 23.5 -5.5 21.0 23.9 +2.9

 (37.3) (43.9) (0.8) (31.0) (34.0) (0.6) (20.4) (20.7) (0.4) (40.7) (42.6) (0.9)

 Men (30–54) 94.2 89.9 -4.3 98.2 97.2 -1.0 37.3 33.8 -3.5 4.9 5.5 +0.6

 (23.4) (30.2) (0.3) (13.1) (16.4) (0.1) (18.9) (20.7) (0.3) (21.5) (22.8) (0.3)

 Women (15–29) 84.9 72.5 -12.4 89.6 84.4 -5.2 23.7 18.4 -5.3 34.8 37.0 +2.2

 (35.8) (44.7) (0.8) (30.5) (36.3) (0.7) (17.4) (17.8) (0.4) (47.6) (48.2) (1.1)

 Women (30–54) 93.6 87.5 -6.1 96.3 93.9 -2.4 28.6 25.4 -3.2 21.0 21.1 +0.1

 (23.9) (33.0) (0.3) (18.9) (24.0) (0.3) (17.3) (18.7) (0.2) (40.7) (40.8) (0.5)

 Parents (Child =13, 95.3 89.1 -6.2 97.1 94.3 -2.8 30.1 26.6 -3.5 22.6 22.0 -0.6
 Women)

 10
 In fact, deteriorating economic conditions in Edmonton led the city to the highest unemployment rate in the
 nation (Johnson 2020).

9
(21.1) (31.1) (0.7) (16.8) (23.1) (0.6) (16.6) (18.0) (0.5) (41.9) (41.4) (1.2)

 Bachelor’s Degree 92.8 88.5 -4.3 95.4 94.3 -1.1 31.1 29.1 -2.0 15.7 15.1 -0.6

 (26.0) (31.9) (0.4) (20.9) (22.8) (0.3) (18.4) (19.1) (0.2) (36.4) (35.8) (0.5)

 No Bachelor’s 89.0 81.0 -8.0 93.5 90.3 -3.2 30.2 25.8 -4.4 19.0 19.6 +0.6

 (31.9) (38.6) (0.3) (25.0) (29.3) (0.2) (19.9) (20.9) (0.2) (39.2) (39.7) (0.3)

 Calgary 90.2 83.9 -6.3 94.2 92.4 -1.8 30.1 26.7 -3.4 17.8 16.8 -1.0

 (29.6) (36.8) (0.4) (23.3) (26.4) (0.3) (18.6) (19.6) (0.2) (38.2) (37.4) (0.5)

 Edmonton 90.2 82.8 -7.4 94.6 91.3 -3.3 30.2 26.2 -4.0 17.2 18.3 +1.1

 (29.7) (37.7) (0.4) (22.7) (28.1) (0.3) (18.6) (20.2) (0.2) (37.7) (38.6) (0.5)

 Other Alberta 89.3 82.9 -6.4 93.2 90.6 -2.6 31.1 26.9 -4.2 18.7 18.9 +0.2

 (30.9) (37.7) (0.4) (25.1) (29.2) (0.3) (21.4) (20.5) (0.2) (38.0) (39.1) (0.4)

 Notes: Labour market statistics are computed with LFS survey weights. Sample excludes: i) unpaid family
 workers; ii) respondents who have never worked; and iii) respondents who are not employed and who last
 worked more than a year ago. For the “2019” and “2020” columns, the parentheses denote the standard
 deviation, while the difference column reports the robust standard error. All estimates are rounded to one
 decimal place. From March 2019 to December 2019, we draw from a total sample of 73,941 unweighted
 survey respondents. Over the same period in 2020, our sample size is reduced to 62,615 individuals.
 Source: Canadian Labour Force Survey, public-use microdata files, 2019–2020. Tabulations by authors.

 While these descriptive statistics give some insight into the labour market impacts
 of the COVID-19 pandemic in Alberta, they are far from conclusive. To conduct a
 statistically rigorous analysis of the crisis, in the next section we present the regression
 framework that we use to measure whether the pandemic’s impact has trended
 differently across time and socio-demographic groups and whether those differences
 exhibit statistical significance.

 METHODOLOGY

 EMPIRICAL APPROACH
 We use a difference-in-difference approach to investigate the impact of the COVID-19
 pandemic on labour supply in Alberta. For each group of interest, we compare labour
 force statistics from February 2020 to each of the post-COVID-19 months in 2020.
 We use February as our comparison month since it captures the most recent state of
 Canada’s labour market before the onset of the crisis. To account for normal seasonal
 fluctuations in the labour market, we also use data from 2019. Using March and weekly
 hours worked as an example, to obtain the impact of the COVID-19 pandemic, we
 first take the difference between average hours worked in February 2020 and March
 2020. We then take the difference between average hours worked in February 2019
 and March 2019. Finally, we take the difference of these two results to obtain the
 pandemic’s effect on hours worked. We repeat these computations for each month in
 2020 up to and including December.

 We emphasize that while we do not claim to present causal estimates in this paper,
 given the exogeneity of the government-enforced health restrictions, we are confident
 that our approach isolates the impact of the crisis. Importantly, we present average

10
estimates that capture the total pandemic effect. For each individual, there were
 potentially many different ways that public health restrictions could have impacted
 labour market outcomes, including: i) direct job loss due to business closures; ii)
 reductions in work due to greater at-home child-care needs; iii) potential behavioural
 responses to the various crisis income-support programs the federal government
 introduced; and iv) falling ill with COVID-19. Due to limitations of the LFS data, we are
 unable to distinguish between these different mechanisms and so our estimates should
 be interpreted as a total pandemic effect.

 ESTIMATION
 To obtain the labour market effects of the COVID-19 crisis, we estimate a double-
 difference regression shown in equation (1) below:

 (1) !"# = + ∑$$ $$
 "%$ " ℎ" ∗ # + ∑"%$ " ℎ" +

 # + !"# + !"#

 The outcome variable !"# captures one of the following labour market statistics:
 employment (at work), employment (absent from work), actual hours worked,
 participation or part-time employment status for individual i in month m and year t.
 ℎ! is an indicator for whether a respondent is observed in a month after
 the start of the pandemic (i.e., March/April/May/etc.; note that February is excluded
 as the reference month), while ! is a dichotomous variable capturing
 whether a respondent is observed in the crisis year (i.e., 2020=1; 2019=0). Therefore,
 ℎ! ∗ " is an interaction term indicating that a respondent
 is observed in one of the post-COVID-19 months in 2020, so that ! represents the
 monthly labour supply effects of the COVID-19 pandemic.

 To examine the impact of the crisis across different groups, equation (1) is estimated
 separately for men and women, as well as for parents and non-parents (i.e., individuals
 whose youngest child is younger than 13). We also estimate equation (1) separately
 for fathers and mothers to determine whether the effects of the pandemic were
 moderated by the interaction between gender and parental status. Finally, we
 compare labour market effects across the age of the youngest child in the household
 to determine whether having a relatively young child intensifies negative employment
 effects. The vector !"# includes a number of control variables that vary depending on
 the groups in the estimation sample but in general include: gender, an indicator for the
 presence of a child under 13, marital status, age (in five-year age groups) and highest
 level of educational attainment. We specify which control variables have been used in a
 particular regression in the notes of each figure.

 Because we are particularly interested in the differential impact of the pandemic
 across different groups, we also estimate a triple-difference regression that allows us
 to examine whether any of the labour market differences we observe between two
 groups are statistically different. For example, the difference between men and women
 is estimated by equation (2):

11
(2) !"# = + ∑$$ $$
 "%$ " ! ∗ ℎ" ∗ # + ∑"%$ " ! ∗

 ℎ" + ! ∗ # + ∑$$
 "%$ " ℎ" ∗ # +

 ! + ∑$$
 "%$ " ℎ" + # + !"# + !"#

 The variables in equation (2) are identical to those in equation (1), except for the
 addition of ! , which is an indicator for whether individual i is a woman (i.e.,
 female=1; male=0). The differential impact of the pandemic on the labour supply of
 men and women in each month of 2020 is therefore represented by ! . A negative,
 significant coefficient on this term would suggest that women experienced greater
 losses in employment or hours worked than men. For our other groups of interest (i.e.,
 parents with young children, fathers and mothers), we simply replace ! with a
 dichotomous variable that equals one if the respondent belongs to the given group.

 To ensure that our results are representative of Alberta’s population, we use LFS
 sample weights in all analyses.11 For the hours-worked outcome, we use ordinary
 least squares (OLS) to estimate equations (1) and (2), noting that respondents with
 zero hours worked remain in the full sample.12 In contrast, for the binary employment,
 participation and part-time status outcomes, we use a linear probability model (LPM).13

 EMPIRICAL RESULTS

 GENDER-BASED DIFFERENTIALS: HAS COVID-19 GENERATED A SHE-CESSION?
 We begin our analysis by investigating the extent to which men and women
 experienced different labour market changes during the COVID-19 pandemic. This
 differential is an important starting point, given that various federal and provincial
 policy-makers have emphasized the need for a gender-based economic recovery plan.

 While the gendered labour market effects early in the pandemic have already been
 well documented in Alberta (Business Council of Alberta 2020), recall that the province
 experienced its greatest increase in COVID-19 cases in the fall, which subsequently led
 to a second state of emergency and another round of non-essential business closures.
 The question remains as to how these gendered trends have evolved in the latter half
 of 2020. Figure 2 plots the results of the employment regressions estimated using
 equation (1) and equation (2) for men and women. To be clear, the black squares
 represent the difference in employment between men and women, while the light grey
 diamonds/circles indicate the group-specific estimate. The vertical bars denote the 95
 per cent confidence intervals computed using robust standard errors. The panel on the
 left-hand side of Figure 2 presents estimates for the likelihood of being employed and

 11
 The average unweighted monthly sample size consists of 6,931 individuals.
 12
 We also estimate the hours-worked outcome with and without those with zero hours of work and find similar
 overall results.
 13
 We use the LPM for simplicity in interpretation. There are, however, drawbacks to this approach, including the
 linearity assumption, and the possibility that the fitted values may fall outside of the [0,1] interval. Since most
 of the modelled probabilities are not at the extremes, the LPM fits similarly to a logistic model.

12
at work while the panel on the right-hand side of Figure 2 presents estimates for the
 likelihood of being employed and absent from work.

 Figure 2: Double- and Triple-difference Estimates of the Effect of the COVID-19
 Pandemic on Employment by Gender, 2019–2020
 Employed, at work Employed, absent from work

 Notes: Figure 2 displays the regression results for each month of the pandemic estimated using equations
 1 and 2. The dependent variable in the left panel is an indicator for employed and at work, while the
 dependent variable in the right panel is an indicator for employed and absent from work. The vertical bars
 denote the 95 per cent confidence intervals computed using robust standard errors. The black squares
 represent the difference in employment between men and separately for women and men. Controls
 include: a dichotomous variable equal to one if the respondent is married or in a common-law relationship,
 the age of the respondent (in five-year age groups), the respondent’s highest level of educational
 attainment and a dichotomous variable equal to one if the respondent’s youngest child is under 13. Sample
 excludes: i) unpaid family workers; ii) respondents who have never worked; and iii) respondents who are
 not employed and who last worked more than a year ago.
 Source: Canadian Labour Force Survey, public-use microdata files, 2019–2020. Tabulations by authors.

 The left panel of Figure 2 confirms that women in Alberta experienced a
 disproportionate decline in employment relative to men in the first three months of the
 pandemic. The difference in the likelihood of employment (at work) between men and
 women is around five percentage points between March and June. These differences
 are significant at the five per cent level. However, the estimated gender differential
 converges to zero during the summer months and remains at a similar level through
 the fall and into December. Apart from December 2020, there are no statistically
 or economically significant differences between men and women in terms of the
 likelihood of being employed but absent from work during any month of the pandemic.
 Interestingly, our results suggest that Alberta’s second wave did not reproduce the
 large gender differentials that were observed in the beginning of the crisis. Instead,
 Figure 2 indicates that between July and December 2020, men and women have faced
 an almost identical decline (or gain) in employment — around six percentage points
 below pre-crisis levels.

13
Figure 3: Double- and Triple-difference Estimates of the Effect of the COVID-19
 Pandemic on Actual Hours Worked by Gender, 2019–2020
 All Respondents Employed respondents

 Notes: Figure 3 displays the regression results for each month of the pandemic estimated using equations
 1 and 2. The dependent variable is a continuous measure of hours worked. The left panel contains
 estimates for the entire sample of LFS respondents (i.e., employed at work, employed absent from
 work, unemployed and not in the labour force), while the right panel contains estimates for employed
 respondents (at or absent from work). The vertical bars denote the 95 percent confidence intervals
 computed using robust standard errors. The black squares represent the difference in hours worked
 between men and women (equation 2). The light grey diamonds/circles indicate the group-specific
 estimate (equation 1 estimated separately for women and men). Controls include: a dichotomous variable
 equal to one if the respondent is married or in a common-law relationship, the age of the respondent
 (in five-year age groups), the respondent’s highest level of educational attainment and a dichotomous
 variable equal to one if the respondent’s youngest child is under 13. Sample excludes: i) unpaid family
 workers; ii) respondents who have never worked; and iii) respondents who are not employed and who last
 worked more than a year ago.
 Source: Canadian Labour Force Survey, public-use microdata files, 2019–2020. Tabulations by authors.

 Although we observe a convergence in employment levels in the second half of 2020,
 labour market disparities between men and women may still exist if their actual hours
 worked are differentially reduced relative to pre-crisis levels. To investigate this, we
 plot the estimates for hours worked in Figure 3 for all LFS respondents (left panel)
 and only those who remained employed (right panel). Our results suggest that, early in
 the pandemic, both men and women experienced profound declines in weekly actual
 hours worked at all jobs. For example, in May, actual hours worked declined by seven
 to eight hours on average for the entire sample of LFS respondents. Among those who
 were employed, the pandemic generated a significant reduction in hours worked of
 about four hours per week, on average. However, like the employment estimates, there
 is some gradual recovery over the course of the summer and fall months. We do not
 find any compelling evidence that there are statistically different reductions in hours
 worked between men and women in either group of respondents.

 In the appendix, we report our analysis investigating labour market participation and
 part-time status. Trends in labour force participation are like the employment estimates
 shown in Figure 2. For part-time employment, we find that women were slightly less
 likely to be employed in part-time jobs, while men were more likely to be employed on
 a part-time basis. In most months, this difference is statistically significant, and could
 be an indication that men were under-employed during the pandemic, even though we
 find no difference in hours worked.

14
In summary, we do not find evidence that the she-cession continued into Alberta’s
 second round of economic shutdowns. While this suggests that the province may not
 need a gender-based recovery plan,14 it does not rule out the possibility that policy
 intervention is warranted among other groups. Indeed, because school closures to
 face-to-face learning and daycare closures have had profound effects on workers with
 young children, we investigate this group next.

 PARENT STATUS DIFFERENTIALS: DO YOUNG CHILDREN POSE UNIQUE
 LABOUR MARKET CHALLENGES?
 The pandemic has presented a unique set of challenges to parents in Alberta, many
 of whom have had to balance their time between child care, parental supervision and
 formal and informal work activities amid two province-wide states of emergency.
 School closures to face-to-face learning and daycare closures ultimately result in trade-
 offs between child care and paid employment. In turn, these trade-offs may generate
 adverse employment consequences for parents simply because a child is present in the
 household. This trade-off is likely to be especially large among people with younger
 children who require more attention and supervision (Montenovo et al. 2020).

 In Figure 4, we compare the employment status of respondents whose youngest child
 is under 13 to those whose youngest child is 13 or older and those who have no child in
 the household. We focus on parents with children under 13 as we believe that this age
 captures the point at which the trade-off between working in the labour market and
 providing child care is likely the strongest.

 Figure 4 shows that, between March and August, there are similar declines in the
 likelihood of being employed and at work among individuals with young children
 and individuals with older or no children. During the fall months, these gaps widen —
 particularly in November and December — suggesting that the school closures to face-
 to-face learning associated with Alberta’s second round of social distancing measures
 were likely more detrimental to employment than the shutdown of non-essential
 businesses. The right-side panel of Figure 4 reveals further evidence that parents with
 young children have been especially impacted by the government’s social distancing
 measures: there are large, substantial differences between parents and non-parents
 in terms of absences from work among those who remained employed. In March, May,
 June and July, individuals with children under 13 were significantly more likely to be
 absent from work than those with older or no children in the household. During the fall
 months, these gaps are no longer statistically significant, but individuals with young
 children remain somewhat more likely to be absent from work than non-parents.

 14
 Note that there are important gendered differences in labour market outcomes that existed prior to the
 pandemic which may require policy attention. These pre-crisis differences are distinct from the disparities
 that we are investigating in this paper (i.e., those generated by the pandemic).

15
Figure 4: Double- and Triple-difference Estimates of the Effect of the COVID-19
 Pandemic on Employment by Presence/Age of Youngest Child, 2019–2020
 Employed, at Work Employed, Absent from Work

 Notes: Figure 4 displays the regression results for each month of the pandemic estimated using equations
 1 and 2. The dependent variable in the left panel is an indicator for employed and at work, while the
 dependent variable in the right panel is an indicator for employed and absent from work. The vertical
 bars denote the 95 per cent confidence intervals computed using robust standard errors. The black
 squares represent the difference in employment between respondents whose youngest child is under
 13 and respondents: i) whose youngest child is 13 or older; or ii) who have no children at all (equation 2).
 The light grey diamonds/circles indicate the group-specific estimate (equation 1 estimated separately for
 these groups). Controls include: a dichotomous variable equal to one if the respondent is married or in a
 common-law relationship, the age of the respondent (in five-year age groups), the respondent’s highest
 level of educational attainment and a dichotomous variable equal to one if the respondent is female.
 Sample excludes: i) unpaid family workers; ii) respondents who have never worked; and iii) respondents
 who are not employed and who last worked more than a year ago.
 Source: Canadian Labour Force Survey, public-use microdata files, 2019–2020. Tabulations by authors.

 There are two main reasons why parents’ employment may have continued to trend
 downward during the second wave of Alberta’s pandemic. First, between September
 and December 2020, many parents may have elected to use online learning or to
 provide home-schooling for their children rather than risk the uncertainties associated
 with a return to the classroom.15 Second, in October 2020, the federal government
 introduced the Canada Recovery Caregiving Benefit (CRCB). The CRCB provides $500
 weekly payments to households that have had to reduce formal paid employment
 hours to provide child care.16 The availability of this income support coincides with
 the downward trends observed in Figure 4, suggesting that the CRCB may have also

 15
 Indeed, relative to 2019, the coronavirus has led to a near doubling of enrolment in provincial home-based
 schooling (Edwardson 2020) — an option which is eligible for funding from the Alberta government. The
 ability to receive such funding may impact the labour market decisions of parents differently than non-
 parents (or parents with older children).
 16
 To be eligible for the CRCB, parents must have experienced a 50 per cent reduction in weekly working hours
 because of a need to care for a child under 12. The CRCB is also available to individuals who have reduced
 their hours worked due to care for another family member who may have been affected by school, daycare
 or other care facilities closing. Eligibility also extends to individuals providing care for a child who is at a high
 risk of contracting the COVID-19 virus.

16
incentivized more parents to stay home with their children.17 We elaborate on the
 significance of this program later in the policy discussion section but emphasize here
 that the CRCB is under-used in Alberta relative to other provinces.

 The findings presented in Figure 4 suggest that, even among parents who have
 maintained employment, there may be a substantial reallocation of hours away from
 the labour market towards home production.18 We investigate this in Figure 5, which
 shows that the stable differentials in employment observed early in the pandemic
 mask relatively large declines in hours worked among parents with young children.
 Subjugated to closures of child-care centres and schools to face-to-face learning,
 the challenges this group of workers experienced are considerably different from the
 rest of the population as parental activities effectively reduce the amount of time
 available to do other things like formal, paid work in the labour market (i.e., constrained
 optimization). In most of the months in Figure 5, many of the differentials exhibit
 statistical significance and are typically in the range of two to four fewer hours worked
 per week for parents relative to non-parents. Specific to parents of young children, the
 change in hours worked relative to pre-COVID-19 levels was nearly 10 hours less per
 week on average in May at the extensive margin (left panel). During the summer and fall
 months, this number reduced slightly to about six hours less on average in December.

 17
 It is important to note that data related to take-up of the CRCB show a large gender gap in the rate of CRCB
 applications per individuals in the labour force. It appears from the data that a portion of this gender gap
 is being driven by the fact that there has been low take-up of the CRCB by single parents, the majority of
 whom are women. While maintaining labour market attachment can be viewed as a positive, it is possible that
 this outcome is masking a real struggle to provide for their family while managing increased caregiving and
 parental supervision responsibilities. To the extent that this is due to the low amount of support under the
 CRCB, policy-makers should be concerned about this struggle. We were unable to explore this hypothesis
 due to the minute sample size of single parents in the LFS since the pandemic hit, but it is worthwhile for
 policy-makers to consider a top-up to the CRCB for single parents.
 18
 Recall that in our full sample, we set actual hours worked to zero for respondents who are unemployed or out
 of the labour force. Figure 5 shows that the hours differentials by parental status are robust among those who
 are still working and those who are not.

17
Figure 5: Double- and Triple-difference Estimates of the Effect of the COVID-19
 Pandemic on Actual Hours Worked by Presence/Age of Youngest Child, 2019–2020
 All Respondents Employed Respondents

 Notes: Figure 5 displays the regression results for each month of the pandemic estimated using equations
 1 and 2. The dependent variable is a continuous measure of hours worked. The left panel contains
 estimates for the entire sample of LFS respondents (i.e., employed at work, employed absent from
 work, unemployed and not in the labour force), while the right panel contains estimates for employed
 respondents (at or absent from work). The vertical bars denote the 95 per cent confidence intervals
 computed using robust standard errors. The black squares represent the difference in employment
 between respondents whose youngest child is under 13 and respondents: i) whose youngest child is 13 or
 older; or ii) who have no children at all (equation 2). The light grey diamonds/circles indicate the group-
 specific estimate (equation 1 estimated separately for these groups). Controls include: a dichotomous
 variable equal to one if the respondent is married or in a common-law relationship, the age of the
 respondent (in five-year age groups), the respondent’s highest level of educational attainment and a
 dichotomous variable equal to one if the respondent is female. Sample excludes: i) unpaid family workers;
 ii) respondents who have never worked; and iii) respondents who are not employed and who last worked
 more than a year ago.

 Source: Canadian Labour Force Survey, public-use microdata files, 2019–2020. Tabulations by authors.

 The relatively greater loss in hours worked for parents with young children still leaves
 room for a potential gendered effect of the pandemic given that women tend to spend
 relatively more time on home production and child care than men (Moyser and Burlock
 2018). Are mothers bearing the brunt of increased home production duties? We turn to
 this question next.

 EXAMINING DIFFERENTIALS BETWEEN MOTHERS AND FATHERS: WHO IS
 MAKING A BIGGER TRADE-OFF?
 We start this section by noting that any documented differences in hours worked
 between men and women should be interpreted with the following caveat: if women
 with children worked fewer hours relative to men before the pandemic, then they
 ultimately had fewer hours to give up during the pandemic. In other words, if the
 pandemic generates a larger negative effect for fathers at the intensive margin, this
 may simply be because men with children had more hours available to lose given the
 pre-pandemic status quo in Alberta. We explore whether and how differences in pre-
 pandemic labour market participation impact the interpretation of our results at the
 end of this section.

18
Figure 6 shows the change in hours worked between 2019 and 2020 for respondents
 with young and older/no children, separately for men and women. During the second
 wave, there is an evident downward trend in working hours for both men and women
 with young children. While these trends are similar for both genders, there is a much
 greater decline in hours worked for men, particularly in November and December
 when the Alberta government introduced the second round of school closures to
 face-to-face learning for children in grades 7 to 12. This is suggestive of more equitable
 sharing of parental duties and perhaps provides evidence that the pandemic may be
 shifting attitudes about the role of men in household work. This is consistent with other
 research in the U.K. showing that the pandemic has produced a substantial increase in
 the share of home responsibilities that men hold (Alon et al. 2020; Chung et al. 2020;
 Shafer et al. 2020). Finally, all the point estimates are consistently below zero for both
 women and men with young children.19 However, the difference in the reduction of
 working hours between these two groups is only statistically significant for men in May
 and the last two months of 2020.

 Figure 6: Double- and Triple-difference Estimates of the Effect of the COVID-19
 Pandemic on Actual Hours Worked by Gender and Presence/Age of Youngest child,
 2019–2020
 Women Men

 Notes: Figure 6 displays the regression results for each month of the pandemic estimated using equations
 1 and 2. The sample includes all LFS respondents (i.e., employed at work, employed absent from work,
 unemployed and not in the labour force). The dependent variable is a continuous measure of hours
 worked. The left panel contains estimates for women, while the right panel contains estimates for men.
 The vertical bars denote the 95 per cent confidence intervals computed using robust standard errors.
 The black squares represent the difference in employment between respondents whose youngest child
 is under 13 and respondents: i) whose youngest child is 13 or older; or ii) who have no children at all
 (equation 2). The light grey diamonds/circles indicate the group-specific estimate (equation 1 estimated
 separately for these groups). Controls include: a dichotomous variable equal to one if the respondent
 is married or in a common-law relationship, the age of the respondent (in five-year age groups) and
 the respondent’s highest level of educational attainment. Sample excludes: i) unpaid family workers; ii)
 respondents who have never worked; and iii) respondents who are not employed and who last worked
 more than a year ago.

 Source: Canadian Labour Force Survey, public-use microdata files, 2019–2020. Tabulations by authors.

 19
 Note that conditioning the data in this way leads to smaller sample sizes and therefore a reduction in the
 precision of our estimates. While this is potentially concerning, there is little variability across the (separately)
 estimated months, which should provide readers with additional reassurance in our results.

19
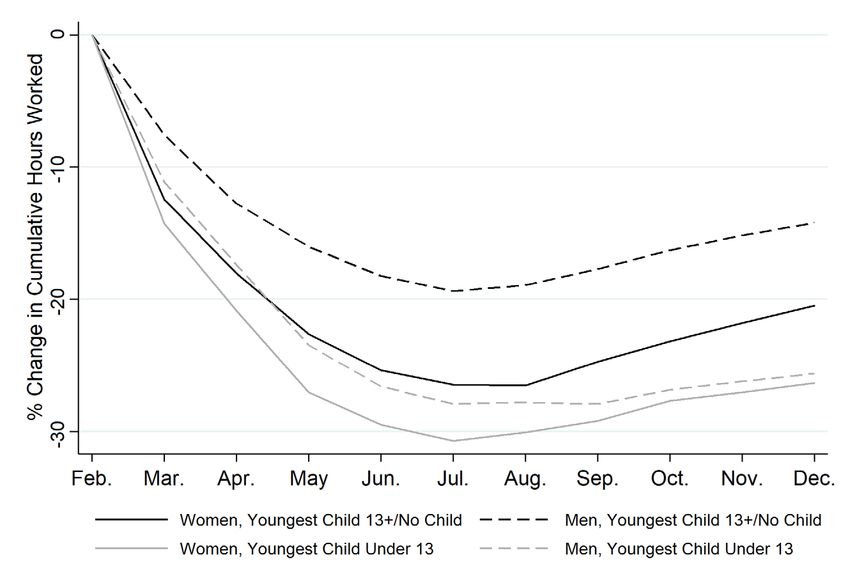
A recurring theme in the data on labour market hours is the concept of persistence or
 the tendency for shocks, such as the COVID-19 pandemic, to have long-run effects that
 dissipate slowly. Because we observe steady reductions in working hours for parents of
 young children throughout the pandemic, persistence may be particularly concerning
 for this group. Cumulatively, this means that lower working hours will build up, leading
 to the potential for even greater differences between parents with young children and
 individuals with older or no children in the medium run.

 For example, a full-time parent working three hours less per week (relative to an
 individual without a child under 13) would accumulate an excess loss of 120 hours
 between March and December — the equivalent of three full-time weeks — attributed
 to the pandemic effect alone. We examine this empirically in Figure 7, where we
 illustrate the loss of aggregate cumulative hours relative to 2019, noting that the
 difference in February is normalized to zero. 20

 Across all groups, the cumulative effect of the pandemic was most severe in the
 summer months, after which some momentum in the labour market levelled out the
 differences relative to 2019. Nonetheless, by December, all gender-parent pairings
 saw large reductions in total hours worked. Figure 7 suggests that parents of young
 children (as highlighted by the grey lines) experienced the most profound reductions
 in hours worked, and that men and women experienced nearly the same cumulative
 losses by the end of 2020. At 14 per cent, men without young children lost the smallest
 percent of hours relative to 2019, while women with young children saw the largest
 declines by the end of 2020 — 26 per cent below their 2019 level. However, also note
 that by December 2020, the cumulative losses among men and women with young
 children were roughly at the same level. Given the large gaps between these two
 groups through the spring and summer months, this suggests that changes in hours
 worked among men in the second wave were substantial enough that they resulted in
 roughly the same cumulative losses by the end of December 2020.

 20
 More specifically, we gather the cumulative sum of total hours worked by parental status and gender from
 February to December in 2019 and 2020. Then, we normalize these values such that the February amount is
 set to be 100 in both years. Finally, we take the log difference between 2020 and 2019.

20
You can also read