LEARNING BLOOD OXYGEN FROM RESPIRATION SIG- NALS - OpenReview
←
→
Page content transcription
If your browser does not render page correctly, please read the page content below
Under review as a conference paper at ICLR 2021

L EARNING B LOOD OXYGEN FROM R ESPIRATION S IG -
NALS

 Anonymous authors
 Paper under double-blind review

 A BSTRACT
 Monitoring blood oxygen is critical in a variety of medical conditions. For almost a century,
 pulse oximetry has been the only non-invasive method for measuring blood oxygen. While
 highly useful, pulse oximetry has important limitations. It requires wearable sensors, which
 can be cumbersome for older patients. It is also known to be biased when used for dark-
 skinned subjects. In this paper, we demonstrate, for the first time, the feasibility of predicting
 oxygen saturation from breathing. By eliminating the dependency on oximetry, we eliminate
 bias against skin color. Further, since breathing can be monitored without body contact by
 analyzing the radio signal in the environment, we show that oxygen too can be monitored with-
 out any wearable devices. We introduce a new approach for leveraging auxiliary variables via
 a switcher-based multi-headed neural network model. Empirical results show that our model
 achieves good accuracy on multiple medical datasets.

1 I NTRODUCTION
Oxygen saturation refers to the amount of oxygen in the blood – that is the fraction of oxygen-
saturated hemoglobin relative to the total blood hemoglobin. Normal oxygen levels range from 94%
to 100%. Lower oxygen can be dangerous, and if severe, leads to brain and lung failure (Taylor
et al., 1951; Dı́az-Regañón et al., 2002; Lapinsky et al., 1999). Oxygen Monitoring is important for
patients suffering from lung diseases such as COVID-19, pulmonary embolism (PE), and chronic
obstructive pulmonary disease (COPD) who are susceptible to reduced blood oxygen (NIH, 2020;
Nordenholz et al., 2011). It is also recommended in old people since lung functions deteriorate with
age putting the elders at a high risk of low oxygen (NLM, 2020).
Today, the only non-invasive approach for measuring oxygen saturation (SpO2) is pulse oximetry.
It works by shining light on one’s figure (or other body parts). Since oxygen-saturated hemoglobin
has a bright red color, oxygen saturation can be measured by estimating the absorbance of the red-
colored waves relative to other colors. While pulse oximetry is a very useful technology, it can
be unsuitable for some of the most vulnerable patients. Oximetry requires the patient to wear a
finger clip or other sensors, which can be cumbersome and hard to remember for older patients with
dementia or cognition problems. Further, since it relies on measuring light absorbance, it is affected
by skin color and tend to overestimate blood oxygen in dark-skinned subjects (Feiner et al., 2007).
In this paper, we introduce a new approach for monitoring blood oxygen that could be more appro-
priate for older patients or those with dark skin color. We propose to learn oxygen saturation from
respiration signals. Recent advances in wireless sensing have demonstrated the feasibility of obtain-
ing accurate measurements of the respiration signal from analyzing the radio waves that bounce off
people’s bodies, without any physical contact (Adib et al., 2015; Yue et al., 2018). Hence, if oxygen
saturation is predictable from breathing, we can sense one’s oxygen in a contactless way without any
wearable sensors. Further, unlike pulse oximetry, such oxygen sensing method would be oblivious
to skin color.
We model the problem as sequence-to-sequence learning and introduce a neural network that maps
respiration signals to the corresponding oxygen saturation. A key innovation in our model is a new
design for leveraging auxiliary variables. The standard approach in the literature for leveraging
auxiliary variables would either provide those variables to the model as inputs or try to predict them
as auxiliary tasks. We demonstrate empirically that for our problem neither of these approaches
is beneficial. We show that in some cases, the gradient of the model can take vastly different and
even divergent values given the auxiliary variable. In such a scenario, it is better to learn different

 1
Under review as a conference paper at ICLR 2021

models for different values of the variable. This motivates us to propose an alternative design for
incorporating auxiliary information. We introduce a multi-headed model where the value of the
auxiliary variable is used to gate the learning through the appropriate head.
We evaluate our model on multiple medical datasets, and compare it with various baselines. Our
empirical results show that the average absolute error in predicting oxygen saturation on the tested
medical data is 1.6%, which is comparable to the accuracy of consumer pulse oximeters (whose
average error ranges from 0.4% to 3.5% (Lipnick et al., 2016)). Further, by testing the model on
data that include the RF modality, we show that the model generalizes to breathing signals extracted
from radio waves, opening the door for continuous contactless monitoring of blood oxygen. We
also use longitudinal data from one COVID-19 patient as a qualitative case study, showing that the
predicted oxygen values are consistent with the patient’s recovery process.
In summary, this paper makes the following contributions:

• The paper is the first to predict blood oxygen from respiration signals. This provides a novel
 non-invasive way for monitoring oxygen saturation, and improves our understanding of the rela-
 tionship between these two physiological signals.
• The paper introduces a new approach for leveraging auxiliary variables. We analyze the gradient
 of a vanilla model with respect to the variable; if the gradient is divergent or vastly different for
 different values of the variable, we use a multi-headed neural network gated by the variable.
• The paper is the first to demonstrate the feasibility of contactless oxygen prediction from radio
 signals. Such a design can facilitate in-home oxygen monitoring, particularly for older patients
 who may have problems remembering to wear and charge oxygen sensors.

2 R ELATED W ORK

Predicting Oxygen Saturation. Past work on oxygen prediction focuses on inferring future oxygen
values from recent measurements. Several papers use auto-regressive models that take past SpO2
readings and predict the SpO2 in the near future (ElMoaqet et al., 2013; 2014; 2016). Others use
an auto-regressive model to model the photoplethysmogram (PPG) signal, which is the raw data
obtained from a pulse oximeter (Lee et al., 2011). Some past work predicts changes in SpO2 in
the five minutes after adjusting ventilator setting (Ghazal et al., 2019). Our work differs from these
methods in that it predicts oxygen saturation from breathing, a completely different physiological
signal. Further, we show the feasibility of oxygen prediction without body contact by inferring
oxygen from radio-based breathing estimates.
Contactless Sensing with Radio Frequency Signals. The past decade has seen a rapid growth in
research on passive sensing using radio frequency (RF) signals. Early work has demonstrated the
possibility of sensing one’s respiration and heart rate using radio signals (Adib et al., 2015). Building
on this work, researchers have found that by carefully analyzing the RF signals that bounce off the
human body, they can monitor a variety of health metrics including sleep, respiration, heart rate,
gait, falls, and even human emotions (Nguyen et al., 2016; Wang et al., 2017; Yue et al., 2018; Hsu
et al., 2017; Wang et al., 2016; Tian et al., 2018; Zhao et al., 2016; Jiang et al., 2018). Our work
adds a new piece to the global picture of predicting vital signals from radio waves.
Learning with Auxiliary Variables. Improving machine learning model by leveraging auxiliary
variables is a well-known idea. Treating auxiliary variables as extra input features is a simple but
effective method, and has been shown useful in computer vision (Forsyth & Ponce, 2002), health
profiling (Wang et al., 2019), and traffic prediction (Liao et al., 2018). Auxiliary learning (Liu
et al., 2019) provides an alternative approach for leveraging auxiliary variables by taking them as
secondary supervisors. It has been shown beneficial in multiple domains including object detec-
tion (Mordan et al., 2018), sequence modelling (Collobert & Weston, 2008; Dong et al., 2015),
reinforcement learning (Wilson et al., 2007), and visual odometry (Valada et al., 2018). Our work
explores a third way of using auxiliary variables. We focus on partitioning the data space by those
auxiliary variables based on analyzing how they affect the gradient of the primary task. We show
that a wise partition facilitates model learning and leads to better results.

 2
Under review as a conference paper at ICLR 2021

 $

 gate
 … " Input
 $ $ ! $! … $"
 $ Output
 !
 Accessible Variable

 # " … # ! ! Inaccessible Variable

 " Switch Status

 Predictor

 Encoder

(a) Backbone (b) Multi-Task (c) Multi-Headed

Figure 1: Illustrations of different models. (a) is the vanilla backbone model, which takes a sequence
of breathing signal as input, and predicts the corresponding sequence of oxygen saturation. (b) is
the multi-task model that has extra input v, and predicts extra output û. (c) is the multi-headed
model that generates multiple predictions under different status, and the final output is obtained by
combining these predictions with the estimated status.

3 M ETHOD

3.1 P ROBLEM F ORMULATION

Our task is to predict oxygen saturation based on respiration signals1 . Let the breathing signal
be x ∈ R1×fb T and the corresponding oxygen saturation be y ∈ R1×fo T , we aim at learning a
sequence-to-sequence model that maps x to y, i.e. p(y 1 , y 2 , · · · , y fo T |x1 , x2 , · · · , xfb T ). Here,
T denotes the length of the segments (in seconds), fb and fo are the sampling frequencies of the
breathing and oxygen data. In practice, we have high sampling rates for both respiration and oxygen
saturation, i.e., fb = 10Hz and fo = 1Hz. This allows us to capture instantaneous changes in these
signals.
Moreover, we are particularly interested in monitoring oxygen saturation during sleep time. This is
because blood oxygen typically drops during sleep, and supplemental oxygen is medically necessary
if oxygen level drops to 88% or lower for 5 consecutive minutes during sleep (Becattini et al., 2018).

3.2 BACKBONE M ODEL

As the relation between respiration x and oxygen y could be highly complicated, we use a deep
neural network to map x to y. We start with the backbone model shown in Figure 1(a), which
consists of an encoder E(·; θe ) and a predictor F (·; θf ). The encoder is composed of a fully con-
volution network (FCN) followed by a bidirectional transformers (BERT) module (Devlin et al.,
2018). The FCN extracts local features from the raw respiration signal, then the BERT module cap-
tures long-term dependencies based on those features. This design has two benefits. First, it can
extract both local and global information from the respiration signal. Second, it works for variable
length respiration signals. The predictor F is composed of several De-convolution layers, which
up-samples the extracted features to the same time resolution of oxygen saturation. Formally, we
have E : R1×fb T → Rn×αfb T and F : Rn×αfb T → R1×fo T where n is the size of the breathing
feature and α is the down-sampling factor (1/240 in our model). The model is trained with a L1
loss, i.e., Lo (F, E) = T1 kŷ − yk1 , where ŷ = F (E(x)) is the model prediction. Thanks to the
elaborately designed model architecture, even with a simple L1 loss, this model has achieved 1.66%
error (see Table. 1), which is a reasonably good result. More details on this model are available in
Appendix A.

 1
 The breathing signal is a time series that measures the chest displacement with the inhale-exhale motion.
Please refer to Section B and Figure 7 for a detailed introduction and illustrative figures.

 3
Under review as a conference paper at ICLR 2021

3.3 L EVERAGING AUXILIARY VARIABLES & THE M ULTI - HEADED M ODEL

In the medical domain, typically, there exist many physiological indices that could potentially help
improve the model. From the viewpoint of machine learning, physiological indices can be viewed
as auxiliary variables that could be beneficial to train the model. During testing, auxiliary variables
can be categorized into two types: accessible and inaccessible. We denote accessible variables as v
and inaccessible variables as u. In the learning procedure, a common practice is to use accessible
variable as extra inputs and use inaccessible variables for auxiliary tasks. Figure 1(b) illustrates such
framework where Fu denotes a predictor of the auxiliary task u. We call the design in Figure 1(b)
the Multi-Task model. Despite its intuitive appeal, in practice, this model may not always lead to
improvements. As shown in Table 1, the Multi-Task model even causes a performance drop on the
SHHS dataset2 .
In our work, we investigate an alternative approach that uses auxiliary variables as switches. The
idea is based on the hypothesis that some variable h affects the target input-output relationship in a
non-smooth way. For example, assuming h is a binary variable. The mapping from input x to output
y conditioned on variable h equal to 0 is significantly different from the mapping when the variable
is 1, i.e., y(x|h = 0) and y(x|h = 1) are two distinct functions. In this case, instead of learning
function y(x, h), we propose to use variable h as a switch to partition the data space and learn the
functions y(x|h = 0) and y(x|h = 1) separately. We realize this idea in our Multi-Headed model
illustrated in Figure 1(c). We first define a switch function S(v, u) : V × U → [N ] where v ∈ V
and u ∈ U are accessible/inaccessible variables and N is the number of switch status. The model
has N heads {Fi }N i=1 to make the prediction ŷi = Fi (E(x)) for every switch status separately. It
also has a predictor Fu to infer u. During testing time, based on the accessible auxiliaries v and
estimated inaccessible auxiliaries û, we evaluate the switch status Ŝ = S(v, û), and output the final
prediction ŷ = ŷŜ . In the case of oxygen prediction, ŷi and the switch Ŝ are time series, we use
ŷit and Ŝ t to denote their value at time step t. As shown in Figure 1(c), the final prediction is the
gated combination of every head’s output, ŷ t = ŷŜt t . One might argue that the Multi-Task model
can also learn such compositional function by implicitly learning each piece of the target function,
and learning to assign the input to the target piece based on the value of the auxiliary variable.
However, in practice, such incorrect model inductive bias introduces unnecessary difficulty in the
learning procedure and typically leads to bad performance. In our experiments, we show, with a
more preferable inductive bias, the Multi-Headed model outperforms the Multi-Task model with a
clear gap.

3.4 I DENTIFYING G OOD S WITCHES VIA G RADIENT D IAGNOSIS

In the above description, we assume a good switch function exists. In this paragraph, we answer
the critical question: which auxiliary variables should be used as switches? We introduce, gradient
diagnosis, a simple but effective way to test the influence of variable v on the task of learning
function y(x). We first train a vanilla model with no auxiliary variables, e.g., our backbone model.
We then use the validation set to check the predictor F (·; θf )’s loss gradient ∇θf L. For each possible
value a ∈ V of variable v, we compute the gradients averaged on data samples when v equals a,
i.e., ∇θf L|v=a = E(x,y)∼p(x,y|v=a) ∇θf L(F (E(x)), y). Such gradient indicates the direction to
improve the model when v = a. Intuitively, if gradients ∇θf L|v=a are similar for all values a, it
means variable v does not change the loss function drastically. So it is reasonable to use one model
to handle all values of v. On the other hand, if the gradients are vastly different from each other, it
is preferable to separate the predictor for different values of v.

4 E XPERIMENTS

We present the results of empirical evaluation on medical datasets and RF data. We evaluate the
models using the average absolute error between the predicted oxygen saturation ŷ and the ground-
 PT
truth y. The error is first averaged for every night and each subject, i.e., T1 t=1 ky t − ŷ t k. We then
report the mean and standard deviation of per-night averaged errors of the dataset.

 2
 More dataset details are provided in Section 4.1.

 4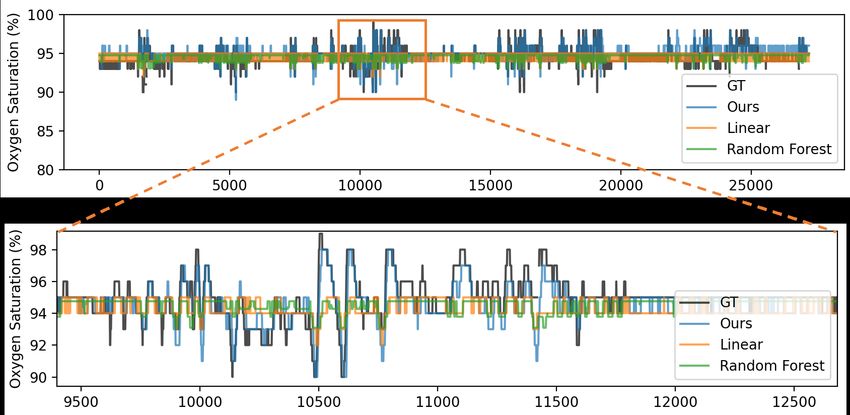
Under review as a conference paper at ICLR 2021

4.1 DATASETS

Medical Datasets. We leverage three publicly-available medical datasets: Sleep Heart Health Study
(SHHS) (Zhang et al.), Multi-Ethnic Study of Atherosclerosis (MESA) (Chen et al., 2015), and
Osteoporotic Fractures in Men Study (MrOS) (Blackwell et al., 2011). Each dataset contains the
polysomnography (PSG) signals of subjects. The first two datasets have males and females, whereas
the last one has male subjects. The PSG data includes full-night respiration signals and the corre-
sponding oxygen saturation (SpO2) and sleep stage labels. The data has three types of respiration
channel measured with: a nasal probe, a breathing belt on the chest, and a breathing belt on the ab-
domen. We denote it as BB-respiration signals. The datasets also contain subjects’ bio-information
such as gender, age, etc. SHHS, MESA, and MrOS contains 2651, 2056, and 1026 subjects, respec-
tively. We randomly split the training and testing sets for SHHS, MESA, and MrOS as 1855/796,
1439/617, and 718/308, and keep the same splits in all experiments. We note that the subjects in
these studies have an age range between 40 and 95, and suffer from a variety of diseases as indicated
by the studies names. This allows for a wider range of oxygen variability beyond the typical range
of healthy individuals.
RF Dataset. We collect a small PSG dataset that contains the standard PSG channels mentioned
above as well as an RF-based inference of the respiration signal, i.e., RF-respiration signals. The
dataset is collected in the sleep lab in the university and contains 31 nights of data from 14 indi-
viduals. All subjects in this study are healthy. Each subject is monitored using the standard PSG
channels as in the medical datasets above (SpO2, respiration belts, sleep stages, etc.). Additionally,
a radio device is installed in the room to collect RF signals, which are then processed to extract the
subject’s respiration in accordance with Adib et al. (2015). Therefore, in this dataset, each subject
has both the BB-respiration signals and the RF-respiration signals.

4.2 M ODELS

As we describe in Section 3, our models focus on predicting oxygen from breathing while leveraging
auxiliary gender and sleep stage information. We evaluate the following models: (a) Single-Headed:
the vanilla backbone model. (b) Multi-Task: the model that takes gender as an extra input and is
trained with sleep stages as an auxiliary task. (c) Multi-Headed: the model that uses multiple heads
to predict oxygen level for different switch status. (d) We also compare with an adaptation of the
Projecting Conflicting Gradient PCGrad-Adapted. The original PCGrad was proposed for improved
multi-task learning to deal with scenarios where the various tasks have divergent gradients (Yu et al.,
2020). In that case, PCGrad projects the divergent gradients along consistent directions. In our
context, the gradients of the tasks themselves – i.e., oxygen prediction and sleep stage prediction
– do not diverge. Hence, simply applying PCGrad to our problem should be no different from the
Multi-Task model. However, we can adapt PCGrad to be more suitable for our problem. In our
case, the gradients of subgroups (i.e., subjects with different status) in the input data with respect to
the main task can be divergent or significantly different. We can think of learning a mapping from
breathing to oxygen for different subject status as different sub-tasks. Then, we can augment our
backbone model with PCGrad applied to these sub-tasks. Specifically, to train the single predictor F ,
We compute 6 different losses based on the six subject status corresponding to our 6-headed model.
 i
 P status i, we
For each subject Phave an oxygen prediction loss Lo for that status. Mathematically,
Lio (F, E) = ( t:S t =i 1)−1 t:S t =i |F (E(xb ))t −y t |. We compute the predictor’s gradients ∇θf Lio
for each loss and update the predictor by the gradient calibrated by PCGrad.

4.3 G RADIENT D IAGNOSIS R ESULTS

Before evaluating the various models, we show that the gradient diagnosis method proposed in
section 3.3 finds good “switches” for the oxygen prediction task. Among the huge set of physio-
logical indices in the medical datasets, we pick the following variables as candidates: (a) Sleep
stages: awake, light sleep (N1,N2), deep sleep (N3), rapid eye movement (REM); (b) Gender: male
vs. female; (c) Asthma: having asthma or not; (d): Smoking: non-smoker, current smoker, for-
mer smoker; (e) Education: less than 15 years vs. greater than 15 years; (f): Height: lower than
160cm or higher than 160cm; (g) Aspirin: taking aspirin or not. Figure 2 visualizes the cosine
similarity of the gradients computed on the medical dataset SHHS. We clearly see that the gradient
directions are altered by the sleep stage, gender, asthma and smoking while less affected by the

 5
Under review as a conference paper at ICLR 2021

 (b) Gender (d) Smoking (f) Aspirin

 (a) Sleep Stage (c) Asthma (e) Height (g) Education (years)

 Figure 2: Gradient cosine similarities of different variables.

height, aspirin and education level. These result is quite interesting. For example, although it is
hard to see why gender affects the oxygen-breathing function from the first glance, there are medi-
cal evidence that show gender matters. Due to differences between women’s and men’s respiratory
system, women consume more oxygen when breathing compared to men (Ramonatxo, 2003), espe-
cially during exercise (Reybrouck & Fagard, 1999), and men’s oxygen saturation is naturally higher
than women (Ricart et al., 2008). As for sleep stages, it is a known fact that it influences the oxygen
saturation. For example, pointed out by Choi et al. (2016), that oxygen saturation differs signifi-
cantly during REM and Non-REM sleep. It is also understandable that asthma affects oxygenation
since asthma causes difficulty in breathing. It is also supported by medical findings that smoking
reduces oxygen saturation (Özdal et al., 2017). Since it is a long-term effect, no matter if a smoker
quits or not, his/her oxygen pattern is already altered. This may explains why the gradient similarity
is high between current smoker and former smoker.
Based on our gradient diagnosis, we pick sleep stage and gender as auxiliary variables for our task.
Other variables are possible. However, we pick these two variables because gender is almost always
accessible during testing; and while sleep stages are usually not available during testing, luckily past
work shows that sleep stages can be inferred from respiration signals (Zhao et al., 2017). Hence,
our model can estimate the sleep stages and use the estimates to do the switching. Further, from
Figure 2(a), we can see the gradients for awake, REM and sleeping (N1,N2,N3) are very dissimilar
from each other while the gradients are much more similar within the group of N1,N2,N3. So we
design the switch function to consider N1,N2,N3 as one sleep stage. In total, we have six switch
status due to the combinations of gender and sleep stages. Our model has six heads for each switch
status.

4.4 E VALUATION ON M EDICAL DATASETS

Quantitative Results. Table 1 reports the absolute error of all models for the three medical datasets.
The table reveals two main results. First, all baselines perform reasonably well and have average
prediction errors between 1.58% and 1.7%. These errors are relatively low and comparable to the
errors of consumer pulse oximeters whose average error is in the range 0.4-3.5% (Lipnick et al.,
2016). It is important to keep in mind that all baselines are based on our backbone model, which
already embodies our design for learning this new task. Thus, these results show for the first time
that respiration signals have a predictive power for learning oxygen saturation.
Second, Table 1 also shows that the Multi-Headed model outperforms the other baselines on all
datasets. This demonstrates that the Multi-Headed design is more effective at leveraging relevant
auxiliary variables than the other methods.
Qualitative Results. Figure 3 visualizes the predicted oxygen saturation of the Multi-Headed model
and the Multi-Task model on a male subject in the SHHS dataset. As the ground-truth oxygen satu-
ration are integers, we rounded the predicted oxygen saturation into integers. The background color
indicates different sleep stages. The ‘light grey’ and ‘white’ corresponds to ‘REM’ and ‘Awake’,
respectively. For clarity, we use one color ‘dark grey’ for all three non-REM ‘Sleep’ stages, N1, N2,
and N3. We observe that the Multi-Headed model consistently performs better than the Multi-Task
model over the whole night. In non-REM ‘Sleep’, the ground-truth oxygen saturation is more stable.

 6
Under review as a conference paper at ICLR 2021

 Table 1: Prediction error (mean ± std) of different models for three medical datasets.
 Model SHHS MESA MrOS Overall
 Single-Headed 1.68 ± 1.56 1.59 ± 1.58 1.76 ± 1.56 1.66 ± 1.53
 Multi-Task 1.69 ± 1.57 1.51 ± 1.56 1.71 ± 1.57 1.62 ± 1.53
 PCGrad-Adapted 1.74 ± 1.58 1.62 ± 1.57 1.74 ± 1.53 1.71 ± 1.54
 Multi-Headed 1.62 ± 1.54 1.48 ± 1.51 1.66 ± 1.51 1.58 ± 1.49

 Time (in seconds)

 98 98 98

 96 96
 96
 94
 94 94
 92
 92 92
 90
 90 90
 88
 88 86 88

 Sleep REM Awake

Figure 3: Visualization of the oxygen saturation predicted by the Multi-Task model and the Multi-
Headed model on a male subject in SHHS dataset. The background color indicates sleep stages. The
‘dark grey’, ‘light grey’ and ‘white’ corresponds to ‘Sleep’ (N1, N2, N3), ‘REM’ and ‘Awake’.

The Multi-Headed model predicts more accurate oxygen than the Multi-Task model. In the ‘REM’
stage, people usually have lower oxygen saturation with larger variance. The Multi-Headed model
predicts the ups and downs and captures the changes in blood oxygen. In the ‘Awake’ stage, the
Multi-Headed model predicts the more dramatic changes, while the Multi-Task model has a larger
bias. This experiment demonstrates that the way we incorporate the sleep stages into the model
improves the performance across different sleep stages.
Error Analysis and Relation to Skin Color. One important issue to keep in mind is that our
model learns from ground-truth data measured using pulse oximeters (today oximetry is the only
way for continuous noninvasive monitoring of blood oxygen). Hence, to understand the prediction
errors and their potential causes, we plot in Figure 4 the distributions of the ground-truth SpO2
and the predicted SpO2 by the Multi-Headed model for different races, for all datasets. Interest-
ingly, the ground-truth SpO2 from oximetry shows a clear discrepancy between black and white
subjects. In particular, the ground-truth oxygen distributions show that black subjects have higher
blood oxygen. This is compatible with past findings that pulse oximeter overestimates blood oxygen
in dark-skinned subjects (Feiner et al., 2007). In contrast, the model prediction shows much more
similar oxygen distributions for the two races. It is interesting that while the model learned from
what seems to be biased ground-truth, the results show that the model is able to correct, to some
extent, for this bias. Admittedly, these observations are inductive since there is no way to measure
the exact errors in the ground-truth labels.
The distributions in Figure 4 also show that the model tends to miss the very high and very low
oxygen values. This is expected given that only a very small percentage of the ground-truth data
falls in the tails. One would expect that the performance on very high and very low oxygen values
would improve if there is sufficient training data in those ranges.

4.5 E VALUATION ON RF DATASET

In this section, we evaluate whether our model, which is trained on respiration measured using
a breathing belt, can generalize to predicting oxygen from respiration signals measured via radio
waves. We directly apply a Multi-Headed model trained on the BB-respiration signals in medical

 7
Under review as a conference paper at ICLR 2021

 Black Black Black Black Black Black
 White White White White White White

 Density

 Density

 Density

 Density

 Density

 Density
 86 88 90 92 94 96 98 100 86 88 90 92 94 96 98 100 86 88 90 92 94 96 98 100 86 88 90 92 94 96 98 100 86 88 90 92 94 96 98 100 86 88 90 92 94 96 98 100
 SpO2 SpO2 SpO2 SpO2 SpO2 SpO2

 (a) SHHS GT (b) SHHS Pred (c) MESA GT (d) MESA Pred (e) MrOS GT (f) MrOS Pred

 Figure 4: Distributions of the ground-truth SpO2 readings ((a), (c), (e)), and the predicted SpO2 ((b),
 (d), (f)) by Multi-Headed model for the two races.
Predicted Per-Night Average Oxygen (%)

 dates
 Figure 5: The predicted per-night averaged oxygen saturation for a COVID-19 patient from Apr 28
 to July 31, 2020. The patient turned negative for COVID-19 on May 5, 2020 (marked by the star).

 datasets, to the RF dataset. For comparison, we test the model on both RF-respiration signals and
 BB-respiration signals from the RF dataset. The results are shown in Table 2. We observe that the
 model works well on RF dataset with a small prediction error, no matter which breathing signal is
 used. The prediction error of using the RF-respiration signals (1.28%) is even slightly lower than
 using the BB-respiration signals (1.30%). This is because the noise in the respiration measured
 using RF signal is different from the noise in the breathing belt measurements. The noise in the
 RF-based measurements tend to increase with motion and hence we see that the model prediction
 error is higher for the aware stage. In contrast, the error in the breathing belt depends on the sleep
 posture and the positioning of the belt on the body. Also, comparing with the error from previous
 section, we find the model is performing better on the RF dataset than on the medical datasets, i.e.,
 1.30% vs. 1.62%. We believe the reason is that the RF dataset is collected with healthy individuals
 and hence has less complexity and is easier to predict. These results show the first demonstration of
 predicting oxygen saturation from radio signals without any body contact.

 Table 2: Prediction error for the RF dataset using BB-respiration signals or RF-respiration signals.

 BB-respiration signals RF-respiration signals
 Awake Sleep REM All Awake Sleep REM All
 1.37 1.30 1.27 1.30 1.65 1.24 1.35 1.28

 4.6 A PPLICATION TO M ONITORING COVID-19 PATIENTS

 Finally, we show a case study of a COVID-19 patient. An 88-year old male was monitored from
 April 28 till July 31, in home, with a contactless radio device. The subject tested COVID-19 positive
 prior to the monitoring, and was declared COVID-19 negative on May 5. The objective of the
 case study is to compare the results of a completely passive contactless monitoring approach to
 information collected from the medical doctor and the professional caregiver attending to the subject.
 Figure 5 shows the average oxygen saturation predicted by the Multi-Headed model for each of the
 monitored nights. May 5 is highlighted with a star as the day on which the patient was declared
 COVID-19 negative. The results in the figure show a clear trend of increased oxygen level as the
 patient transitioned to becoming COVID-19 negative. They also show that improvement in blood
 oxygen did not stop on the day the patient became COVID-free; it rather continued to ramp up for
 almost two weeks after that date, and eventually reached a steady level. While there is no ground-

 8
Under review as a conference paper at ICLR 2021

truth measurements of the oxygen for this completely passive case study, the results are consistent
with the doctor notes about patient recovery and general expectations for a symptomatic COVID-19
patient who recovered without escalation of his COVID-19 symptoms.

5 D ISCUSSION AND C ONCLUDING R EMARKS
This paper introduces a model for predicting oxygen saturation from breathing signals, and shows
that it performs well on three medical datasets and an RF-based dataset. In this section, we discuss
some of the clinical implications, properties, and limitations of such model.
Data Diversity. We note that the medical datasets used in our evaluation include many patients
with diverse diseases and health conditions. In particular, the Multi-Ethnic Study of Atherosclerosis
(MESA) dataset focuses on patients with Atherosclerosis, a disease in which cholesterol plaques
build up in the walls of arteries, and the minimum oxygen saturation predicts disease progno-
sis (Gunnarsson et al., 2015). As shown in the results, our model has low error and good per-
formance on this dataset. In fact, all three evaluation datasets (SHHS, MrOS and MESA) contain
people who have various diseases including chronic bronchitis (323 subjects), cardiovascular dis-
eases (1196 subjects), coronary heart disease (869 subjects), myocardial infarctions (508 subjects),
diabetes (307 subjects), Alzheimer’s (40 subjects), Parkinson’s (69 subjects), and others. This means
that our reported accuracy already takes into account unhealthy individuals. We note that many of
these diseases, including diabetes and pulmonary and cardiovascular diseases, interact with oxygen.
Our model performs well on this population, as shown in our evaluation results. Furthermore, all
three datasets are focused on old people. In particular, the median age in MrOS is 80 years. Hence,
50% of the subjects are in their 80’s and 90’s. Such old subjects are natural beneficiaries from
monitoring oxygen saturation since they are at a high risk of low oxygen (NLM, 2020).
Relationship between breathing signals and Oxygen. Oxygen affects breathing through the pe-
ripheral chemoreceptors, located in the carotid bodies (Plataki et al., 2013). There is a feedback loop
that relates blood oxygen and ventilation, allowing changes in oxygen to cause changes in breath-
ing. However, the details of the chemoreflex physiology are complex and not yet fully understood.
Our approach is data-driven and demonstrates that custom neural networks can extract significant
and useful information about oxygen level from the breathing signal. It is important to note that the
model learns more than the relationship between breathing rate and oxygen level. In Section B, we
show several examples where two subjects breath at the same rate, yet the model detects that their
oxygen levels are quite different. Such empirical results show that the model not only leverages the
breathing rate, but also other more sophisticated patterns in the detailed breathing signals.
Limitations and Clinical Usefulness. Oxygen saturation and breathing are physiologically related,
but this does not mean that the model can discover all situations that lead to low oxygen. Even
pulse oximetry does not always work. The literature reports that in the critically ill, oximetry does
not reliably predict changes in oxygen saturation because the calibration of red-light absorbance is
based on calculations made from healthy volunteers (Ralston et al., 1991). Oximetry also fails in
subjects with COPD (Amalakanti & Pentakota, 2016), anemia (Severinghaus & Koh, 1990), sickle
cell disease (Blaisdell et al., 2000), skin pigmentation (Bickler et al., 2005). Similarly, the model
herein has its own limitations and cannot detect low oxygen if the breathing signal is not impacted.
Our objective is to introduce a method that is non-invasive, easy to use, non-contact, and can be
useful in many cases, particularly for old people, who are naturally at high risk of reduced oxygen
(NLM, 2020). This population is well represented in our evaluation datasets, on which the model is
demonstrated to have good performance. Furthermore, old patients can have onset of dementia or
Alzheimer’s and cannot remember to regularly measure themselves using a pulse oximeter. Thus,
they would benefit from a system that passively and continuously measures oxygen using radio
signals, without asking the patient to remember to actively measure themselves.
The model can also provide a complementary oxygen monitoring system at home or in the hospital.
As explained above pulse oximetry fails in various scenarios. One can add a radio device in the
patient room to collect radio signals and use our system to augment oximetry. This does not add
any overhead to the patient since they will not wear any additional sensor but rather be monitored
in a passive contactless manner using radio signals. Further, since oximetry and our model use
intrinsically different methods, they have independent errors, and hence can complement each other.

 9
Under review as a conference paper at ICLR 2021

R EFERENCES
Fadel Adib, Hongzi Mao, Zachary Kabelac, Dina Katabi, and Robert C Miller. Smart homes that
 monitor breathing and heart rate. In Proceedings of the 33rd annual ACM conference on human
 factors in computing systems, pp. 837–846, 2015.
Sridhar Amalakanti and Mohan Rao Pentakota. Pulse oximetry overestimates oxygen saturation in
 copd. Respiratory Care, 61(4):423–427, 2016.
C Becattini, MC Vedovati, P Pruszczyk, S Vanni, M Cotugno, LA Cimini, V Stefanone, MG de Na-
 tale, M Kozlowska, F Mannucci, et al. Oxygen saturation or respiratory rate to improve risk
 stratification in hemodynamically stable patients with acute pulmonary embolism. Journal of
 Thrombosis and Haemostasis, 16(12):2397–2402, 2018.
Philip E Bickler, John R Feiner, and John W Severinghaus. Effects of skin pigmentation on pulse
 oximeter accuracy at low saturation. Anesthesiology: The Journal of the American Society of
 Anesthesiologists, 102(4):715–719, 2005.
Terri Blackwell, Kristine Yaffe, Sonia Ancoli-Israel, Susan Redline, Kristine E Ensrud, Marcia L
 Stefanick, Alison Laffan, Katie L Stone, and Osteoporotic Fractures in Men Study Group.
 Associations between sleep architecture and sleep-disordered breathing and cognition in older
 community-dwelling men: the osteoporotic fractures in men sleep study. Journal of the American
 Geriatrics Society, 59(12):2217–2225, 2011.
Carol J Blaisdell, Steve Goodman, Karen Clark, James F Casella, and Gerald M Loughlin. Pulse
 oximetry is a poor predictor of hypoxemia in stable children with sickle cell disease. Archives of
 pediatrics & adolescent medicine, 154(9):900–903, 2000.
Xiaoli Chen, Rui Wang, Phyllis Zee, Pamela L Lutsey, Sogol Javaheri, Carmela Alcántara, Chan-
 dra L Jackson, Michelle A Williams, and Susan Redline. Racial/ethnic differences in sleep dis-
 turbances: the multi-ethnic study of atherosclerosis (mesa). Sleep, 38(6):877–888, 2015.
Eunkyung Choi, Doo-Heum Park, Jae-hak Yu, Seung-Ho Ryu, and Ji-Hyeon Ha. The severity of
 sleep disordered breathing induces different decrease in the oxygen saturation during rapid eye
 movement and non-rapid eye movement sleep. Psychiatry investigation, 13(6):652, 2016.
Ronan Collobert and Jason Weston. A unified architecture for natural language processing: Deep
 neural networks with multitask learning. In Proceedings of the 25th international conference on
 Machine learning, pp. 160–167, 2008.
Jacob Devlin, Ming-Wei Chang, Kenton Lee, and Kristina Toutanova. Bert: Pre-training of deep
 bidirectional transformers for language understanding. arXiv preprint arXiv:1810.04805, 2018.
Genaro Dı́az-Regañón, Eduardo Miñambres, Marisol Holanda, Segundo González-Herrera, Fran-
 cisco López-Espadas, and Carlos Garrido-Dı́az. Usefulness of venous oxygen saturation in the
 jugular bulb for the diagnosis of brain death: report of 118 patients. Intensive care medicine, 28
 (12):1724–1728, 2002.
Daxiang Dong, Hua Wu, Wei He, Dianhai Yu, and Haifeng Wang. Multi-task learning for multiple
 language translation. In Proceedings of the 53rd Annual Meeting of the Association for Compu-
 tational Linguistics and the 7th International Joint Conference on Natural Language Processing
 (Volume 1: Long Papers), pp. 1723–1732, 2015.
Hisham ElMoaqet, Dawn M Tilbury, and Satya-Krishna Ramachandran. Predicting oxygen satu-
 ration levels in blood using autoregressive models: A threshold metric for evaluating predictive
 models. In 2013 American Control Conference, pp. 734–739. IEEE, 2013.
Hisham ElMoaqet, Dawn M Tilbury, and Satya-Krishna Ramachandran. A novel dynamic model
 to predict abnormal oxygen desaturations in blood. In 2014 IEEE International Symposium on
 Medical Measurements and Applications (MeMeA), pp. 1–6. IEEE, 2014.
Hisham ElMoaqet, Dawn M Tilbury, and Satya Krishna Ramachandran. Multi-step ahead predic-
 tions for critical levels in physiological time series. IEEE transactions on cybernetics, 46(7):
 1704–1714, 2016.

 10
Under review as a conference paper at ICLR 2021

John R Feiner, John W Severinghaus, and Philip E Bickler. Dark skin decreases the accuracy of pulse
 oximeters at low oxygen saturation: the effects of oximeter probe type and gender. Anesthesia &
 Analgesia, 105(6):S18–S23, 2007.

David A Forsyth and Jean Ponce. Computer vision: a modern approach. Prentice Hall Professional
 Technical Reference, 2002.

Sam Ghazal, Michael Sauthier, David Brossier, Wassim Bouachir, Philippe A Jouvet, and Rita
 Noumeir. Using machine learning models to predict oxygen saturation following ventilator sup-
 port adjustment in critically ill children: A single center pilot study. PloS one, 14(2):e0198921,
 2019.

Sverrir I Gunnarsson, Paul E Peppard, Claudia E Korcarz, Jodi H Barnet, Erika W Hagen, K Mae
 Hla, Mari Palta, Terry Young, and James H Stein. Minimal nocturnal oxygen saturation predicts
 future subclinical carotid atherosclerosis: the wisconsin sleep cohort. Journal of sleep research,
 24(6):680–686, 2015.

Chen-Yu Hsu, Yuchen Liu, Zachary Kabelac, Rumen Hristov, Dina Katabi, and Christine Liu. Ex-
 tracting gait velocity and stride length from surrounding radio signals. In Proceedings of the 2017
 CHI Conference on Human Factors in Computing Systems, pp. 2116–2126, 2017.

Hongbo Jiang, Chao Cai, Xiaoqiang Ma, Yang Yang, and Jiangchuan Liu. Smart home based on
 wifi sensing: A survey. IEEE Access, 6:13317–13325, 2018.

SE Lapinsky, M Aubin, S Mehta, P Boiteau, and AS Slutsky. Safety and efficacy of a sustained
 inflation for alveolar recruitment in adults with respiratory failure. Intensive care medicine, 25
 (11):1297–1301, 1999.

Jinseok Lee, John P Florian, and Ki H Chon. Respiratory rate extraction from pulse oximeter and
 electrocardiographic recordings. Physiological measurement, 32(11):1763, 2011.

Binbing Liao, Jingqing Zhang, Chao Wu, Douglas McIlwraith, Tong Chen, Shengwen Yang, Yike
 Guo, and Fei Wu. Deep sequence learning with auxiliary information for traffic prediction. In
 Proceedings of the 24th ACM SIGKDD International Conference on Knowledge Discovery &
 Data Mining, pp. 537–546, 2018.

Michael S Lipnick, John R Feiner, Paul Au, Michael Bernstein, and Philip E Bickler. The accuracy
 of 6 inexpensive pulse oximeters not cleared by the food and drug administration: the possible
 global public health implications. Anesthesia & Analgesia, 123(2):338–345, 2016.

Yifan Liu, Bohan Zhuang, Chunhua Shen, Hao Chen, and Wei Yin. Auxiliary learning for deep
 multi-task learning. arXiv preprint arXiv:1909.02214, 2019.

Taylor Mordan, Nicolas Thome, Gilles Henaff, and Matthieu Cord. Revisiting multi-task learning
 with rock: a deep residual auxiliary block for visual detection. In Advances in Neural Information
 Processing Systems, pp. 1310–1322, 2018.

Phuc Nguyen, Xinyu Zhang, Ann Halbower, and Tam Vu. Continuous and fine-grained breathing
 volume monitoring from afar using wireless signals. In IEEE INFOCOM 2016-The 35th Annual
 IEEE International Conference on Computer Communications, pp. 1–9. IEEE, 2016.

NIH. Covid-19 treatment guidelines. https://www.covid19treatmentguidelines.
 nih.gov/critical-care/oxygenation-and-ventilation/, 2020. Accessed:
 2020-10-01.

NLM. Aging changes in the lungs. https://medlineplus.gov/ency/article/
 004011.htm, 2020. Accessed: 2020-10-01.

Kristen Nordenholz, Jordan Ryan, Benjamin Atwood, and Kennon Heard. Pulmonary embolism risk
 stratification: pulse oximetry and pulmonary embolism severity index. The Journal of emergency
 medicine, 40(1):95–102, 2011.

 11
Under review as a conference paper at ICLR 2021

Mustafa Özdal, Zarife Pancar, Vedat Çinar, and Murat Bilgiç. Effect of smoking on oxygen satu-
 ration in healthy sedentary men and women. EC Pulmonology and Respiratory Medicine, 4(6):
 178–182, 2017.
Rosalind W. Picard, Elias Vyzas, and Jennifer Healey. Toward machine emotional intelligence:
 Analysis of affective physiological state. IEEE transactions on pattern analysis and machine
 intelligence, 23(10):1175–1191, 2001.
Maria Plataki, Scott A Sands, and Atul Malhotra. Clinical consequences of altered chemoreflex
 control. Respiratory physiology & neurobiology, 189(2):354–363, 2013.
AC Ralston, RK Webb, and WB Runciman. Potential errors in pulse oximetry: I. pulse oximeter
 evaluation. Anaesthesia, 46(3):202–206, 1991.
M Ramonatxo. Gender influence on the oxygen consumption of the respiratory muscles in young
 and older healthy individuals. Int J Sports Med, 24:559–564, 2003.
Tony Reybrouck and Robert Fagard. Gender differences in the oxygen transport system during
 maximal exercise in hypertensive subjects. Chest, 115(3):788–792, 1999.
A Ricart, T Pages, G Viscor, C Leal, and JL Ventura. Sex-linked differences in pulse oxymetry.
 British journal of sports medicine, 42(7):620–621, 2008.
Olaf Ronneberger, Philipp Fischer, and Thomas Brox. U-net: Convolutional networks for biomedi-
 cal image segmentation. In International Conference on Medical image computing and computer-
 assisted intervention, pp. 234–241. Springer, 2015.
John W Severinghaus and Shin O Koh. Effect of anemia on pulse oximeter accuracy at low satura-
 tion. Journal of clinical monitoring, 6(2):85–88, 1990.
E Stewart Taylor, William C Scott, and Clifton D Govan. Studies of blood oxygen saturation and
 causes of death in premature infants. American journal of obstetrics and gynecology, 62(4):764–
 777, 1951.
Yonglong Tian, Guang-He Lee, Hao He, Chen-Yu Hsu, and Dina Katabi. Rf-based fall monitoring
 using convolutional neural networks. Proceedings of the ACM on Interactive, Mobile, Wearable
 and Ubiquitous Technologies, 2(3):1–24, 2018.
Abhinav Valada, Noha Radwan, and Wolfram Burgard. Deep auxiliary learning for visual localiza-
 tion and odometry. In 2018 IEEE international conference on robotics and automation (ICRA),
 pp. 6939–6946. IEEE, 2018.
Hao Wang, Chengzhi Mao, Hao He, Mingmin Zhao, Tommi S Jaakkola, and Dina Katabi. Bidirec-
 tional inference networks: A class of deep bayesian networks for health profiling. In Proceedings
 of the AAAI Conference on Artificial Intelligence, volume 33, pp. 766–773, 2019.
Xuyu Wang, Chao Yang, and Shiwen Mao. Tensorbeat: Tensor decomposition for monitoring mul-
 tiperson breathing beats with commodity wifi. ACM Transactions on Intelligent Systems and
 Technology (TIST), 9(1):1–27, 2017.
Yuxi Wang, Kaishun Wu, and Lionel M Ni. Wifall: Device-free fall detection by wireless networks.
 IEEE Transactions on Mobile Computing, 16(2):581–594, 2016.
Aaron Wilson, Alan Fern, Soumya Ray, and Prasad Tadepalli. Multi-task reinforcement learning: a
 hierarchical bayesian approach. In Proceedings of the 24th international conference on Machine
 learning, pp. 1015–1022, 2007.
Tianhe Yu, Saurabh Kumar, Abhishek Gupta, Sergey Levine, Karol Hausman, and Chelsea Finn.
 Gradient surgery for multi-task learning. arXiv preprint arXiv:2001.06782, 2020.
Shichao Yue, Hao He, Hao Wang, Hariharan Rahul, and Dina Katabi. Extracting multi-person
 respiration from entangled rf signals. Proceedings of the ACM on Interactive, Mobile, Wearable
 and Ubiquitous Technologies, 2(2):1–22, 2018.

 12
Under review as a conference paper at ICLR 2021

Guo-Qiang Zhang, Licong Cui, Remo Mueller, Shiqiang Tao, Matthew Kim, Michael Rueschman,
 Sara Mariani, Daniel Mobley, and Susan Redline. The national sleep research resource: towards
 a sleep data commons. Journal of the American Medical Informatics Association.
Mingmin Zhao, Fadel Adib, and Dina Katabi. Emotion recognition using wireless signals. In
 Proceedings of the 22nd Annual International Conference on Mobile Computing and Networking,
 pp. 95–108, 2016.
Mingmin Zhao, Shichao Yue, Dina Katabi, Tommi S Jaakkola, and Matt T Bianchi. Learning sleep
 stages from radio signals: A conditional adversarial architecture. In International Conference on
 Machine Learning, pp. 4100–4109, 2017.

 13
Under review as a conference paper at ICLR 2021

A M ODEL A RCHITECTURE AND I MPLEMENTATION D ETAILS
As we described in section 3, our vanilla model consists of an encoder and a predictor. The en-
coder has nine 1-D convolutional layers (Conv-Norm-RReLU) that shrink the temporal dimension
of the features by 240 times. It then followed by several bi-directional multi-head self-attention
layers (Devlin et al., 2018) to aggregate the temporal information at the bottleneck. We use 8 layers,
8 heads with hidden-size of 256, intermediate-size of 512 for self-attention, and the max position
embeddings is 2400. The decoder contains 7 layers of 1-D de-convolutional layers (DeConv-Norm-
RReLU). We also use a skip connection (Ronneberger et al., 2015) by concatenating the convolu-
tional layers in the encoder to the de-convolutional layers in the predictor. Figure 6 illustrate the
overall network architecture. We keep the encoder and predictor architectures the same for all mod-
els. All models are implemented using PyTorch. The number of parameters for the multi-headed
model is 26,821,113 and the model size is 107.28MB. In the training process, we use the Adam
optimizer with a learning rate of 2 × 10⁻⁴ , and train the model for 500 epochs. Due to the varying
input length, we set the batch size for all the models to 1 (i.e., one night of breathing signals and the
corresponding oxygen time series).
Because oxygen saturation is affected by sleep stages and sleep cycles, it exhibits non-local depen-
dencies. To allows the model to capture these dependencies, we use the breathing signals from a
night of sleep as one input sample. To process such a long signal at the input, we use a UNET
structure with a bottleneck that shrinks by a factor of 240, and has a max position embedding of
2400. The breathing signal is measured at 10 fps (frames per second). Thus, the model can process
240 ∗ 2400/10/3600 ≈ 16 hours of breathing data.

 Output

 De De De De De De Predictor
 Conv Conv Conv Conv Conv Conv

Temporal-Aware
Features

 BERT

 Encoder
Position
 ! " … # … $
Embeddings
 + + + + + +
Breathing
Features

 Conv Conv Conv Conv Conv Conv

 Input

 Figure 6: Network architecture for the vanilla model.

 14
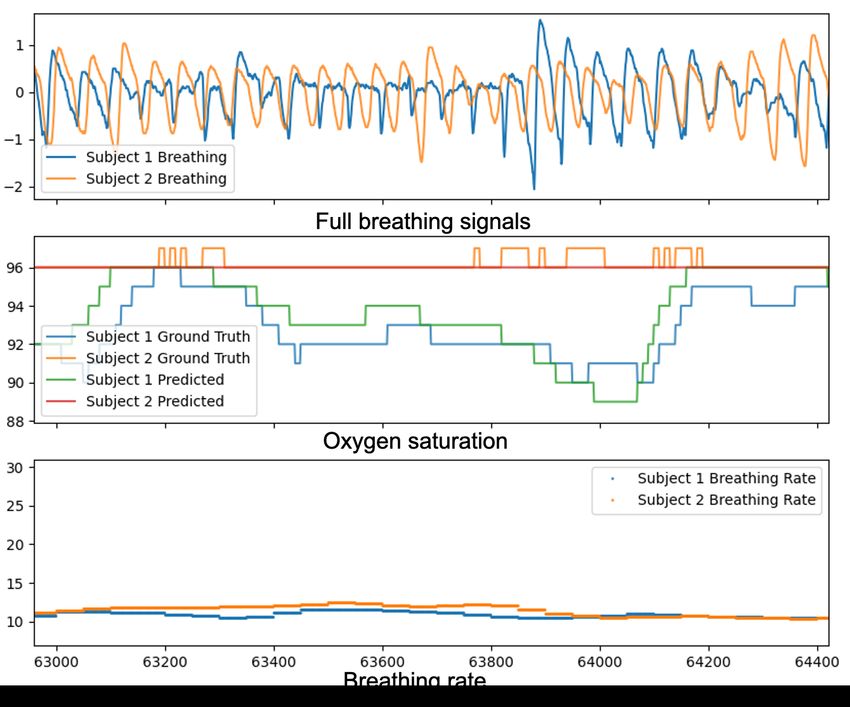
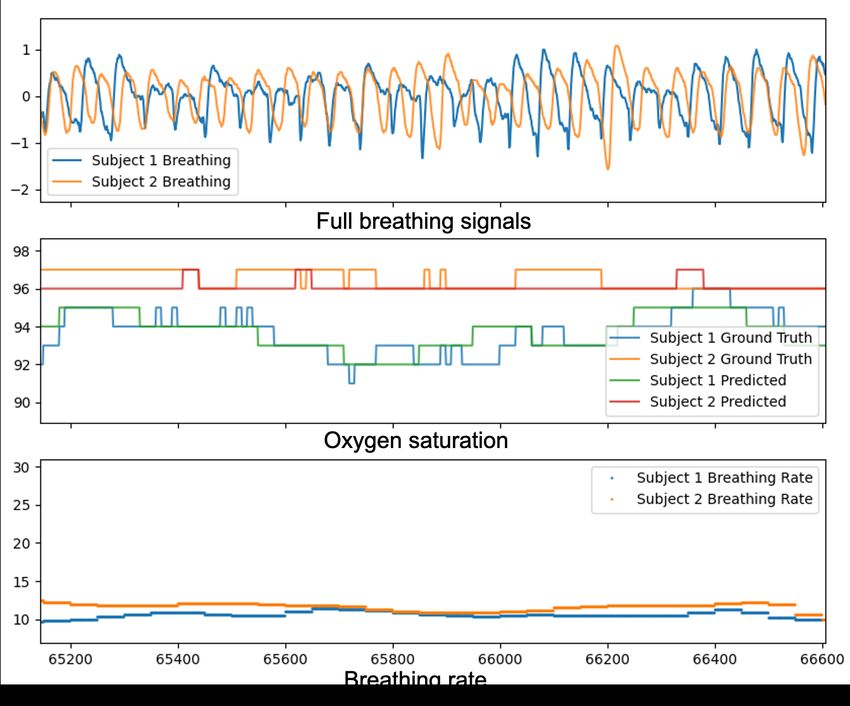
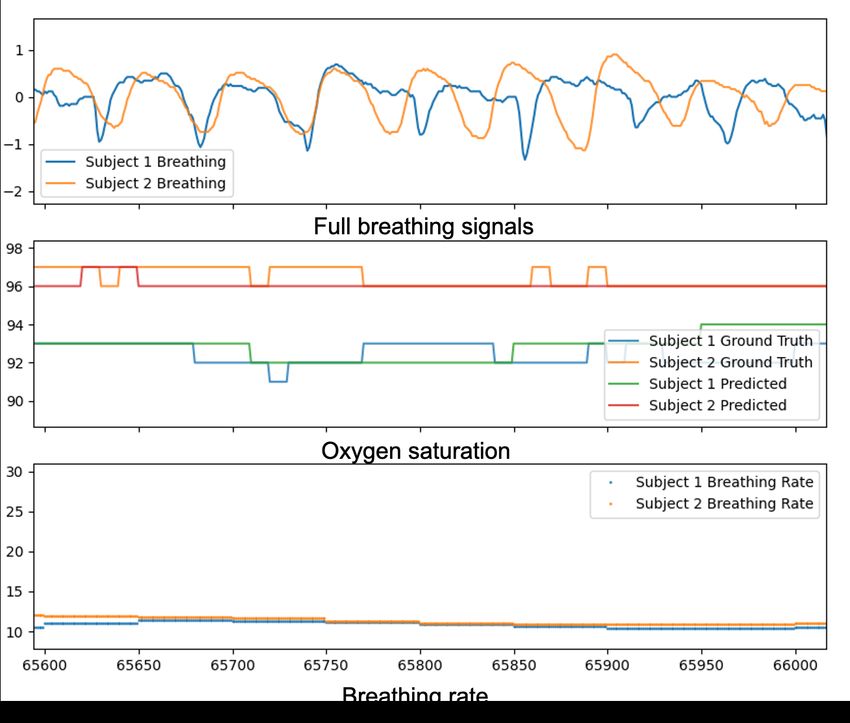
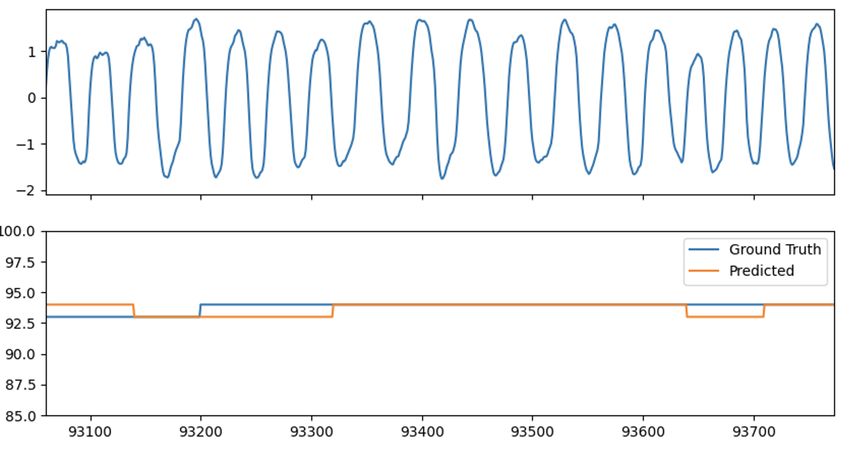
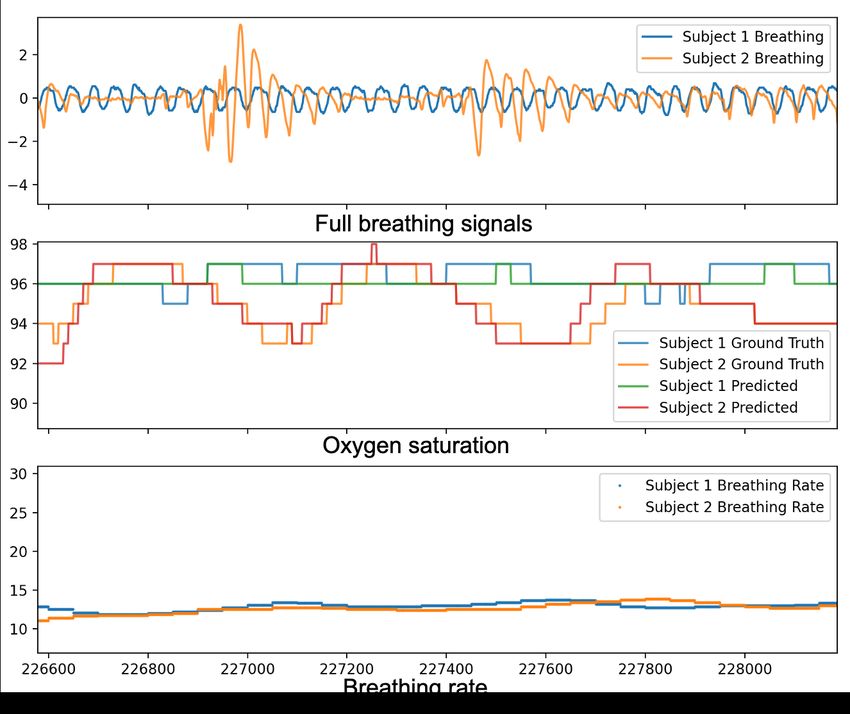
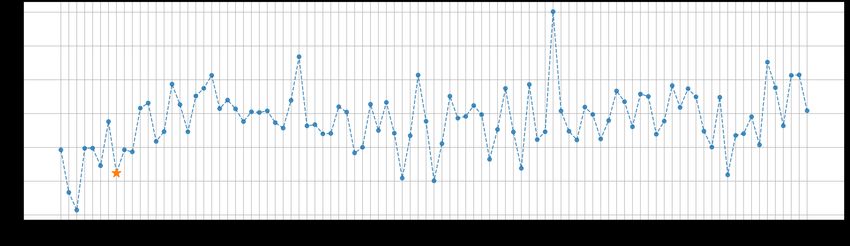
Under review as a conference paper at ICLR 2021

B B REATHING S IGNALS
The input respiration signal we used in the paper is a one-dimensional time series with a frame rate
of 10 fps (frames per second). It contains full information about the inhale and exhale motions.
Figure 7 illustrates typical patterns of breathing signals with the corresponding oxygen saturation.
Figure 7(a) shows a normal breathing pattern, which leads to constant oxygen saturation. Figure 7(b-
d) are abnormal breathing signals.

 (a) (b)

 (c) (d)
Figure 7: Visualization of breathing signals and the corresponding oxygen level. (a) is an example
of normal breathing signals. (b-d) are examples of different abnormal breathing signals. In every
figure, the first row shows the breathing signals while the second row shows the ground truth oxygen
level (in blue) and the oxygen level predicted by our model (in orange).

B.1 F ULL B REATHING S IGNALS VS . B REATHING R ATE

It is important to note that we use the full breathing signals instead of the breathing rate. Full breath-
ing signals contain richer information about oxygen saturation than the breathing rate. Figure 8
shows several cases where two subjects have the same breathing rate but different oxygen saturation
values. The figure also shows that our model is able to predict the correct oxygen levels and is not
confused by the fact that the subjects have the same breathing rates.

 15
Under review as a conference paper at ICLR 2021

 (a) (b)

 (c) (d)
Figure 8: Visualization of full breathing signals having more information about oxygen level than
breathing rates. Here are four examples of subjects having very similar breathing rate but different
oxygen saturation. However, if we look at the full breathing signals, we can still differentiate them.
Our model can capture the shape difference of full breathing signals and make the correct prediction.

C M ORE V ISUALIZATIONS

We include more visualizations of the breathing signals and the corresponding oxygen saturation
predicted by the Multi-Headed model for the medical datasets: MESA (Figure 9 and Figure 10),
MrOS (Figure 11 and Figure 12). In the plots, The background color indicates different sleep stages.
The ‘dark grey’, ‘light grey’ and ‘white’ corresponds to sleep stages (N1, N2, N3), ‘REM’ and
‘Awake’, respectively.

C.1 M ESA

The examples in Figure 9 show our model’s ability to capture the fluctuations of oxygen saturation.
At the same time, the examples in Figure 10 shows our model accurately detects the region of low
oxygen saturation, which highlights its usefulness in monitoring patients.

C.2 M ROS

Looking at the zoomed-in range (a) and (b) from Figure 11, we see that the model exhibits a larger
error when the ground truth SpO2 reading is very low. It is mainly caused by the imbalanced labels
in the training set since subjects usually experience much less time of having low oxygen level (e.g.,
below 90%) than having a normal oxygen level between 94% to 100%. Figure 12 shows another

 16
Under review as a conference paper at ICLR 2021

example of the dynamics. As shown in the zoomed range, oxygen fluctuations correlate with one’s
sleep stage: in ’REM’ (colored by light gray), the oxygen fluctuates drastically while in ’sleep’
(colored by dark gray), the oxygen is much more stable and fluctuates in a small range. Our model
makes accurate predictions since it leverages the sleep stage information.

 Figure 9: MESA Example 1.

 Figure 10: MESA Example 2.

 17
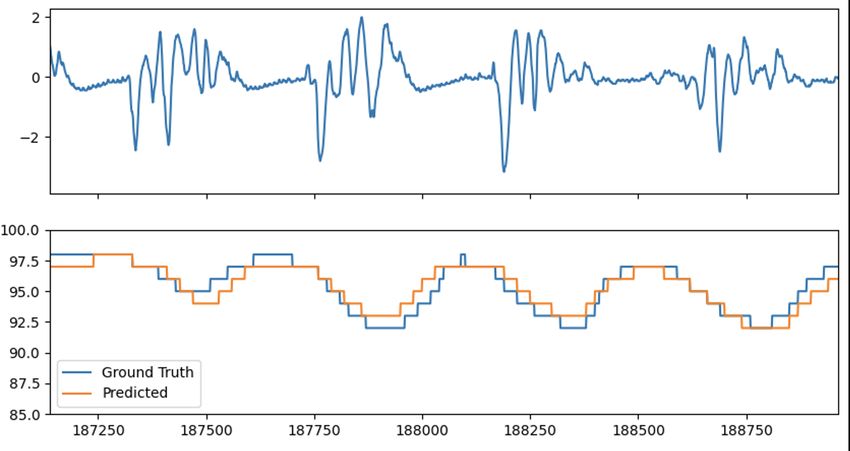
Under review as a conference paper at ICLR 2021

 (b)
 (a)

(a)

(b)

 Figure 11: MrOS Example 1.

 Figure 12: MrOS Example 2.

 18
Under review as a conference paper at ICLR 2021

D C OMPARISON AGAINST NAIVE BASELINE M ODELS
We have compared our approaches with two naive baseline models, i.e., Linear Regression and
Random Forest Regression. To choose features, we use the six statistical time series feature sug-
gested by (Picard et al., 2001). Table 3 compares our model with the naive baselines. As shown,
These baselines produce average prediction errors that are significantly higher than the multi-headed
model. Figure 13 shows an illustrative example of the prediction. It can be noticed that both the
linear regression and random forest models tend to make predictions concentrated at the averaged
oxygen level without capturing the dynamics of oxygen fluctuations across time. While our model’s
prediction follows the ground truth oxygen changes well. It is because our model is designed to
capture the non-local temporal dependencies in the signals.

Table 3: Prediction error (mean ± std) of naive baseline models compared with our multi-headed
model.
 Model SHHS MESA MrOS Overall
 Linear Regression 1.86 ± 1.72 1.73 ± 1.73 1.87 ± 1.69 1.81 ± 1.72
 Random Forest 1.85 ± 1.73 1.72 ± 1.73 1.89 ± 1.71 1.81 ± 1.73
 Multi-Headed 1.62 ± 1.54 1.48 ± 1.51 1.66 ± 1.51 1.58 ± 1.49

 Figure 13: Comparison between our model and linear regression and random forest.

 19
Under review as a conference paper at ICLR 2021

E S WITCHER -BASED AUXILIARY L EARNING OF A P IECE - WISE L INEAR
 F UNCTION
To highlight the benefits of switcher-based auxiliary learning and gradient diagnosis, we conduct
experiments on the toy dataset shown in Figure 14. The target function is an 1-dimensional piece-
wise linear function. The observed data has a small white noise added to the label. Visually the
function looks like a string composed of ‘W’,‘N’, and ‘M’. Assume we have an auxiliary variable,
class, that indicates which letter a data point belongs to. Our goal is to learn the function with
access to the auxiliary variable. By using gradient diagnosis, it suggests that this auxiliary variable
is a good “switcher” candidate. Denote g1 , g2 , g3 as the gradients computed by the data points from
the three letters. The cosine similarity between them are cos(g1 , g2 ) = 0.48, cos(g1 , g3 ) = −0.02,
cos(g2 , g3 ) = 0.39, meaning the gradients are not aligned.
We compare our Multi-Headed model with three baselines: Single-Headed, Multi-Task, PCGrad-
Adapted described in section 4. Figure 15 displays the learned function of the four methods. Only
the Multi-Headed model successfully learns the target function and makes a prediction that visually
looks like “WNM”. Quantitatively, the mean squared errors of the predictions are 0.06, 0.06, 0.05,
0.01 for Single-Headed, Multi-Task, PCGrad-Adapted, and Multi-Headed, respectively. We attribute
the Multi-Headed model’s success to its usage of the auxiliary variable as a “switcher”.

 1.2 class=0
 1.0 class=1
 class=2
 0.8
 0.6
 0.4
 0.2
 0.0
 0.2
 0.0 0.5 1.0 1.5 2.0 2.5 3.0

Figure 14: Visualization of the toy dataset. It is a 1D piecewise linear function. The color indicates
the auxiliary variable for every data point.

 1.2 1.2
 1.0 1.0
 0.8 0.8
 0.6 0.6
 0.4 GT class=0 0.4 GT class=0
 GT class=1 GT class=1
 0.2 GT class=2 0.2 GT class=2
 Pred class=0 Pred class=0
 0.0 Pred class=1 0.0 Pred class=1
 0.2 Pred class=2 0.2 Pred class=2
 0.0 0.5 1.0 1.5 2.0 2.5 3.0 0.0 0.5 1.0 1.5 2.0 2.5 3.0
 (a) Single-Headed (b) Multi-Task
 1.2 1.2
 1.0 1.0
 0.8 0.8
 0.6 0.6
 0.4 GT class=0 0.4 GT class=0
 GT class=1 GT class=1
 0.2 GT class=2 0.2 GT class=2
 Pred class=0 Pred class=0
 0.0 Pred class=1 0.0 Pred class=1
 0.2 Pred class=2 0.2 Pred class=2
 0.0 0.5 1.0 1.5 2.0 2.5 3.0 0.0 0.5 1.0 1.5 2.0 2.5 3.0
 (c) PCGrad-Adapted (d) Multi-Headed (Ours)
Figure 15: The benefits of switcher-based auxiliary learning. The figure shows the results of different
models for the toy dataset. Only the multi-headed model which uses a switcher based method learns
this non-smooth function effectively.

 20
You can also read