Fortification of Ground Roasted Coffees with Iron, Zinc, and Calcium Salts: Evaluation of Minerals Recovery in Filtered and Espresso Brews ...
←
→
Page content transcription
If your browser does not render page correctly, please read the page content below
beverages
Article
Fortification of Ground Roasted Coffees with Iron,
Zinc, and Calcium Salts: Evaluation of Minerals
Recovery in Filtered and Espresso Brews
Angela Soares 1 , Nathalia M. Barros 1 , Tatiana D Saint’Pierre 2 , Juliana De P. Lima 1 ,
Verônica Calado 3 , Carmen. M Donangelo 4 and Adriana Farah 1, *
 1   Lab. de Química e Bioatividade de Alimentos, Inst. de Nutrição, Univ. Federal do Rio de Janeiro,
     Rio de Janeiro 21941-902, Brazil; angelamartinssoares@yahoo.com.br (A.S.);
     nathy.anjos@ig.com.br (N.M.B.); julianadepaula.nutricao@gmail.com (J.D.P.L.)
 2   Lab. de Espectrometria de Emissão, Inst. de Química, Pontifícia Univ. Católica do Rio de Janeiro,
     Rio de Janeiro 22451-900, Brazil; tatispierre@puc-rio.br
 3   Lab. de Reologia e Análises térmicas, Escola de Química, Univ. Federal do Rio de Janeiro,
     Rio de Janeiro 21941-909, Brazil; calado@eq.ufrj.br
 4   Escuela de Nutrición, Universidad de la República-Uruguay, Montevideo 11100, Uruguay;
     cmdonangelo@gmail.com
 *   Correspondence: afarah@nutricao.ufrj.br; Tel.: +55-21-39386449

 Received: 11 December 2018; Accepted: 29 December 2018; Published: 10 January 2019

 Abstract: Micronutrient deficiencies are of great public health and socioeconomic importance.
 Food fortification has been widely used as a simple low-cost resource to increase mineral intake.
 Considering that coffee is the most consumed food product worldwide, in this study, C. arabica and
 C. canephora seeds were roasted, ground, and fortified with three salts of iron, zinc, and calcium as
 part of the selection of appropriate mineral vehicles for fortification. After ranking the performance
 through a test by a trained tasters’ panel, only two salts for each mineral remained. Mineral recoveries
 were evaluated by Inductively Coupled Plasma Optical Emission Spectrometry (ICP-OES) in filtered
 (paper and nylon filters) and espresso brews. The best mean recoveries for each mineral in espresso
 brew prepared from fortified coffees were: 80.8% of iron as ferrous bisglycinate chelate, 75.4% of
 zinc as zinc lactate, and 72.1% of calcium as calcium lactate. These better ranked salts by the tasters’
 panel. In filtered brews, mean recovery values of 51.1%, 47.6%, and 51.6% were obtained for the same
 mineral salts, respectively. No difference or very small differences were observed between species
 and types of filter. The results implications are discussed.

 Keywords: coffee; fortification; iron; calcium; zinc; minerals; brewing methods; ICP-OES

1. Introduction
     Micronutrient deficiencies are of great public health and socioeconomic importance, affecting
about 2 billion people worldwide [1,2]. These are problems that mostly affect developing countries,
causing great impact on health and well-being and contributing to the increased risk of morbidity and
mortality in populations [3]. Additionally, influenced by economic and income growth, urbanization,
and globalization, a significant shift in the quality and quantity of human diets and nutrition-related
epidemiology has occurred in the past few decades. Even at moderate levels, micronutrient deficiencies
can exert serious detrimental effects on the human body. In addition to health effects, they have
implications for economic and social development, especially with high costs of public health [4].
     Iron deficiency is one of the main factors that lead to anemia, which affects 27% of the population
(1.97 billion people). It is estimated that roughly 38% of pregnant women, 29% of non-pregnant

Beverages 2019, 5, 4; doi:10.3390/beverages5010004                             www.mdpi.com/journal/beverages
Beverages 2019, 5, 4 2 of 17
women, and 29% of all women of reproductive age (including all social classes) have anemia globally,
corresponding to 496 million non-pregnant women and 32 million pregnant women [5]. Iron plays
an integral role in a wide range of physiological functions; therefore, the health consequences
of iron deficiency and iron deficiency anemia in women are extensive and potentially serious if
left untreated [6]. Symptoms are often nonspecific but can include fatigue, irritability, hair loss,
poor concentration, palpitations, and dizziness. In severe cases of iron deficiency anemia, tachycardia,
ankle edema, and heart failure may arise [7].
Zinc is one of the most important trace elements in living organisms and has three major
biological functions: catalytic, structural, and regulatory. The human body mass contains 2–3 g of zinc,
and approximately 57% and 29% of total body zinc exist in skeletal muscle and bone, respectively;
heart and blood plasma are known to contain 0.4% and 0.1% of body zinc, respectively [8]. This is
a multifunctional metal compatible with satisfactory growth, health, and well-being. It is essential
for the structure and activity of various proteins and cellular components and plays an important
role in human physiology from involvement in the proper function of the immune system to its
importance in cellular growth, cell proliferation, and cell apoptosis, as well as in the activity of
numerous zinc-binding proteins [9]. Based on the estimated prevalence of zinc deficiency, the global
population at risk for inadequate zinc intake is up to 17%, while in South Asia, up to 30% of the
inhabitants may be deficient [10].
Calcium as a nutrient is most commonly associated with the formation and metabolism of bone.
Over 99% of total body calcium is found as calcium hydroxyapatite in bones and teeth, where it
provides hard tissue with its strength. Calcium in the circulatory system, extracellular fluid, muscle,
and other tissues is critical for mediating vascular contraction and vasodilatation, muscle function,
nerve transmission, intracellular signaling, and hormonal secretion [11]. In developing countries,
such as South Africa and Nigeria, for example, calcium deficiency is considered an important factor
in the etiology of rickets [12]. Additionally, all over the world, inadequate calcium intake has been
correlated with increased prevalence of diseases such as osteoporosis, systemic arterial hypertension
(SAH), and colon cancer, regardless of social class [13].
Food fortification has been widely used by the food industry in high-, middle-, and low-income
countries as a simple low-cost resource to increase mineral intake and prevent and/or correct
nutritional deficiencies [14,15]. The foods chosen as fortification vehicles should be regularly consumed
by the population and be easily accessible to them. Coffee meets these criteria. It is the most consumed
beverage and food product in the world after water. According to the International Coffee Organization,
the world consumption of coffee was about 9 million tons in 2016 (latest report). This volume represents
an average annual growth rate of 1.6% since 2012 [16]. In the last decade, science has offered a
whole new perspective on the use of coffee that is now considered by many as a functional food.
A number of caffeine-related benefits of coffee drinking, such as enhancement of mental performance,
including alertness [17], memory [18,19], mood [20,21], cognitive functions [22–24], and physical
performance [25], are well known. Furthermore, studies have demonstrated the ability of coffee
polyphenols, caffeine, and other coffee compounds to promote antioxidant and anti-inflammatory
effects protecting the body against degenerative and chronic diseases such as type 2 diabetes and
Alzheimer’s, cancer and liver diseases, in addition to other diseases [26,27].
Coffee’s beneficial health properties, together with its high consumption due to its relatively
low cost, high accessibility, and high acceptance by populations, make it an excellent candidate
for use as a micronutrient fortification vehicle. Additionally, in a previous study [28], we have
shown that coffee can be considered an appropriate iron and zinc fortification vehicle, since the salts,
ferrous fumarate, and zinc gluconate added to soluble coffee brews presented reasonable bioavailability,
58% and 78% for iron and zinc, respectively, when expressed relative to that of the mineral salts
ingested with water. These bioavailability values are comparable to those observed for other foods
fortified with such minerals [29,30]. However, in the referred study [28], the type of coffee used was
soluble, which is not consumed by all segments of the world populations. Ground roasted coffee isBeverages 2019, 5, 4 3 of 17
predominantly consumed worldwide, representing about 77.4% of total consumption compared to
22.6% for soluble coffee in importing countries [31]. In Brazil, which is the largest coffee producer and
exporter country in the world [16], only about 12% of the population consumes soluble coffee [32].
The same occurs worldwide, especially in those segments that most require fortification. Among the
preparation methods, filtered and espresso are the two most used worldwide by different segments of
populations [32].
There are a number of possible salts used as vehicles to increase mineral stability and
bioavailability and they present different degrees of solubility. In view of the fact that the various
existing coffee preparation methods have shown different efficiencies in extracting coffee solids,
in order to develop a fortified ground roasted coffee, the efficiency of mineral salts extraction during
the brew’s preparation must be considered. Therefore, in order to select the most suitable mineral for
this purpose, the present study aimed to evaluate the recovery of iron, zinc, and calcium elements in
filtered and espresso brews made from ground roasted coffees fortified with different mineral salts.
2. Methods
2.1. Preparation of Coffee Matrices
High quality raw Coffea arabica beans (Cooxupé, Minas Gerais, Brazil), classified as “soft beverage”
or specialty coffee by the Brazilian classification system (COB), and a high quality Coffea canephora
(Cooabriel, Espírito Santo, Brazil), were roasted separately in a laboratory-scale fluidized bed roaster
(I-Roast® Model No. 40009, Heartware Home Products, Gurnee, IL, USA) at a maximum temperature of
245 ◦ C for 6 min to reach medium roast degree (#55—Roast Color Classification System Agtron—SCAA,
1995). Samples were ground in a disk mill (Gourmet M-50, LEOGAP, Curitiba, PR, Brazil) to pass a
20 mesh (0.85 mm) sieve (medium grid). For a preliminary ranking sensory test, a blend containing 80%
and 20% of the aforementioned C. arabica and C. canephora samples, respectively, was used. Ground
samples were packaged, vacuum sealed, and kept at −20 ◦ C until fortification and brewing. For the
sensory test and evaluation of minerals recovery (item 2.4), fortification with each of the nine tested
salts was performed separately.
2.2. Mineral Salts
When choosing mineral salts to be used in food fortification, their solubility, bioavailability,
and sensory modifications in the food matrix must be considered [33]. Three types of salts of iron, zinc,
and calcium were initially selected based on bioavailability and sensory aspects reported in previous
fortification studies using various types of food matrixes [28–30,34–39]: ferrous bisglycinate chelate
(Infiniti, São Paulo, Brazil), ferrous sulfate (Quimibras, Rio de Janeiro, Brazil), ferrous fumarate
(Synth, São Paulo, Brazil), zinc lactate (Purac, Rio de Janeiro, Brazil), zinc bisglycinate chelate
(Infiniti, São Paulo, Brazil), zinc sulfate heptahydrate (Synth, São Paulo, Brazil), calcium lactate
(Purac, Rio de Janeiro, Brazil), tricalcium phosphate (Solutech, São Paulo, Brazil), and calcium citrate
(Synth, São Paulo, Brazil). Salts were analyzed by Inductively Coupled Plasma Optical Emission
Spectrometry (ICP-OES) (item 2.6) for verification of compliance with salts labels information and they
were all in conformity.
2.3. Fortification of Ground Roasted Coffee
Based on their the salts chemical structures and on the preliminary results from ICP-OES analyses,
iron, zinc and calcium salts were weighted to obtain the concentration of each mineral corresponding
to 30% of the National Agency for Sanitary Surveillance (ANVISA) Dietary Reference Intake (DRI)
for adults (4.2 mg of iron, 2.1 mg of zinc and 300.0 mg of calcium per 100 g of ground roasted coffee,
as the DRI for adults is 14 mg for iron, 7 mg for zinc, and 1000 mg for calcium) [40]. Considering
the The United States Department of Agriculture (USDA) Nutrient Database for Standard Reference,
the amount of salts added to 100 g of ground roasted coffee would correspond to 23.4% and 52.4%Beverages 2019, 5, 4 4 of 17 of iron RDI for women and men respectively, 26.2% and 19.0% of zinc, respectively, and 30% of calcium RDI for men and women equally. Fortification of ground roasted coffees was performed in the following way: after roasting and grinding coffee beans, 100 g were separately fortified with ferrous bisglycinate chelate, ferrous sulfate, zinc lactate, zinc bisglycinate chelate, calcium lactate, or tricalcium phosphate, in the amounts aforementioned, using geometric dilution, which is a technique used to obtain an equal distribution of low quantity particles (salts) within the blend with a large portion of powder (coffee) [41]. Six aliquots of each fortified coffee were collected randomly at different occasions for spectrometric analysis. The final mean SD was
Beverages 2019, 5, 4 5 of 17
solutions with the following concentrations were used: 0.050, 0.100, 0.200, 0.500 mg/L (r = 0.99999
for Fe, 0.99999 for Zn, and 0.99998 for Ca). Samples were introduced through a conical concentric
nebulizator with a cyclonic chamber (Glass Expansion, Melbourne, Vic, Australia) without previous
filtration. Readings were performed in the automatic background correction mode. All reagents were
of analytical grade. Ultra-pure water (resistivity of 18.2 MΩ, Milli Q system, Millipore, Bedford, MA,
USA) was used for solutions preparation. The multi-element aqueous standard solution was also used
for spectral interference tests. Limits of detection (LOD) calculated as 3 times the sample SD of ten
blank readings of the calibration curve (ultra-pure water acidified with nitric acid) were 0.00014 mg/L
for Fe, 0.0009 mg/L for Zn, and 0.0048 mg/mL for Ca. The limits of quantification (LOQ), calculated
as 3.3 times the LOD value for the respective elements, were: 0.00046 mg/mL for Fe; 0.00297 mg/mL
for Zn, and 0.01584 mg/mL for Ca.
2.7. Statistical Analyses
For statistical analysis, the Statistica software, version 12.0 (StatSoft, Tulsa, OK, USA) was used.
Analysis of variance (ANOVA) followed by a Fisher test were used to compare mineral contents in
ground roasted coffees and mineral concentrations in the unfortified (control) and fortified brews.
Differences were considered when p ≤ 0.001.
3. Results and Discussion
3.1. Preliminary Sensory Test
Regarding the appearance of ground roasted coffees, after the addition of calcium lactate
and calcium citrate, small whitish spots were observed in the coffee mixture, despite adequate
homogenization. This fact was not observed when tricalcium phosphate was used for fortification.
However, this salt showed low solubility, as precipitation was observed in the brew. No iron or zinc
salts caused changes in the appearance of ground roasted coffees after fortification. Regarding the
brews’ appearance, however, the use of iron salts altered their coloration to a greenish tone in the
bottom of the cup. This fact may have occurred due to the iron oxidation, which can cause undesirable
alterations associated with taste and appearance, including product color changes [45]. Color is
reported to be one of the main parameters considered in iron fortification studies. Depending on the
iron salt and concentration used, the food may darken, affecting its appearance and acceptance by
consumers [46,47].
Attributes given by tasters to all salts were similar in water and coffee, but coffee seemed to
slightly improve the sensory responses to mineral salts. According to all ten trained tasters, among the
three evaluated salts for each mineral, the most well accepted ones (ranked first) when dissolved in
both water and coffee were ferrous bisglycinate chelate, zinc lactate, and calcium lactate, although
a slight metallic taste for ferrous bisclycinate, and slight astringency for zinc and calcium lactate
were perceived, both in water and coffee. Ferrous fumarate, zinc sulfate heptahydrate, and calcium
citrate salts were eliminated from the study due to their intense metallic (ferrous fumarate and zinc
sulfate heptahydrate) or astringent (calcium citrate) tastes (Table 1). Ferrous fumate also presented
low solubility. Despite the apparently lower solubility compared to ferrous bisglycinate and ferrous
sulfate, zinc bisglycine chelate and tricalcium phosphate proceeded in the study to be compared with
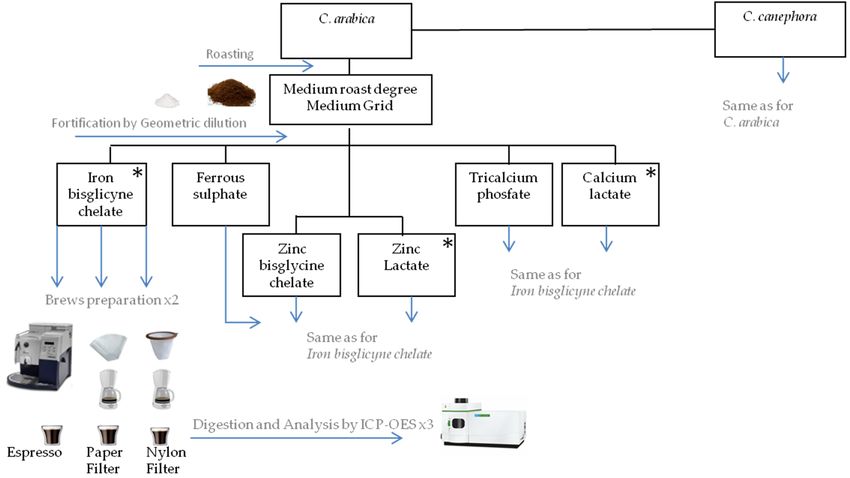
other salts in the recovery tests. Figure 1 illustrates the study design for the evaluation of minerals
recovery in coffee brews after the preliminary sensory test.
3.2. Mineral Contents in Unfortified and Fortified Ground Roasted Coffees
Table 2 presents the mean contents of iron, zinc, and calcium in the unfortified and fortified ground
roasted C. arabica and C. canephora samples used for the mineral recovery evaluation in the brews.Beverages 2019, 5, 4 6 of 18
Beverages 2019, 5, 4 6 of 17
Table 1. Ranking and taste attributes described in preliminary screening evaluating mineral salts
approval by trained tasters.#
Table 1. Ranking and taste attributes described in preliminary screening evaluating mineral salts
SALT & Molecular
approval Formula
by trained tasters #.
Ranking Attributes in Aqueous Solution Attributes in Coffee Brew Status
Ferrous 1 Slight metallic taste Metallic taste Passed
SALT & Molecular Formula
bisglycinate Ranking Attributes in Aqueous Solution Attributes in Coffee Brew Status
chelate
Ferrous 1 Slight metallic taste Metallic taste Passed
bisglycinate
C4H8FeN 2O4
chelate
Ferrous sulfate
C4 H8 FeN2 O4 2 Intense metallic taste Intense metallic taste Passed
FeSO 4
Ferrous sulfate 2 Intense metallic taste Intense metallic taste Passed
Ferrous fumarate
FeSO4 3 Intense metallic taste Intense metallic taste Eliminated
C4Ferrous
H2FeO4fumarate 3 Astringency
Intense metallic taste Intense metallic taste Eliminated
C4 H2 FeO4 1 SlightAstringency
astringency Slight astringency Passed
Zinc lactate 1 Slight astringency
Neutral Slight astringency Passed
C6H10Zinc
O6Znlactate Neutral
C6 H10 O6 Zn
2 Very salty taste Slightly salty Passed
2 Very salty taste Slightly salty Passed
Zinc bisglycinate
Zinc bisglycinate Slight residual
Slight residual Residual astringency
Residual astringency
chelate
chelate astringency
astringency
C4H8NC42H
O84N
Zn2 O4 Zn Neutral
Neutral
Zinc sulfate
Zinc sulfate 3 3 Unpleasantmetallic
Unpleasant metallic Intense
Intensemetallic taste taste Eliminated
metallic Eliminated
Heptahydrate taste
Heptahydrate
ZnSO4 ·7H2 O
taste
Bitter taste
ZnSO4·7H2O Bitter taste
Calcium lactate 1 Neutral taste Slight Passed
CalciumC6lactate
H10 CaO6 1 Neutral taste
Paper taste Slight
calcareous taste Passed
C6H10CaO6 Paper
Slight taste
astringency calcareous taste
Tricalcium fosfate 2 Slight astringency
Neutral taste Slight residual astringency Passed
TricalciumCafosfate
3 (PO4 )2 2 Slight residualtaste
Neutral astringency Slight residual astringency Passed
Ca3(PO4)2 citrate
Calcium 3 Slight Intense
residual astringency
astringency Intense astringency Eliminated
Ca (C6 H5 O7 )2 Significant residual astringency Intense residual astringency
Calcium3citrate 3 Intense astringency Intense astringency Eliminated
#
Ca3(C6H5O7)2 Note: Number of tastersSignificant
= 10; Ranking from 1 (best)
residual astringency to 3 (worse)
Intense was unanimous.
residual astringency
# Note: Number of tasters = 10; Ranking from 1 (best) to 3 (worse) was unanimous.
Figure
Figure 1.1. Scheme
Scheme for
forthe
theevaluation
evaluationofofminerals
minerals recovery
recovery in in coffee
coffee brews
brews after
after preliminary
preliminary sensory
sensory test.
test. Salts indicated with stars were the most well accepted among salts remaining in
Salts indicated with stars were the most well accepted among salts remaining in the study. the study.
3.2.1.
3.2. Unfortified
Mineral (Control)
Contents Coffeesand Fortified Ground Roasted Coffees
in Unfortified
Despite
Table the statistically
2 presents the mean significant
contents ofdifferences
iron, zinc,between mineral
and calcium contents
in the of C.and
unfortified arabica and
fortified
C. canephora
ground (Table
roasted 2), suchand
C. arabica differences weresamples
C. canephora very small
used(equal to or
for the lower recovery
mineral than 2.6%). This similarity
evaluation in the
between both species has been previously reported [48,49], although in a few studies, they have not
brews.
occurred, possibly due to differences in soil composition, plant age, climatic differences, use of fertilizer
3.2.1.
during Unfortified (Control)
plant cultivation, Coffees
and possibly, to different analytical methods [50,51].Beverages 2019, 5, 4 7 of 17
Table 2. Mean contents of iron, zinc, and calcium, measured using ICP-OES, in the unfortified (control) and fortified ground roasted coffees used for recovery
evaluation in brews § .
Mineral Content (mg/100 g)
Unfortified Ground Roasted
Fe Zn Ca
Coffees (Controls)
C. arabica 5.60 ± 0.01 a 0.83 ± 0.02 a 132.82 ± 0.03 b
C. canephora 5.75 ± 0.02 b 0.82 ± 0.03 a 130.66 ± 0.02 a
Fortified ground roasted coffees Fe + ferrous Sulfate Fe + ferrous bisglycinate Zn + zinc bisglycinate Zn + zinc Lactate Ca +tricalcium phosphate Ca + calcium lactate
C. arabica 7.72 ± 0.03 a 7.73 ± 0.03 a 1.85 ± 0.02 a 1.84 ± 0.01 a 282.51 ± 0.0 5 a 283.27 ± 0.05 a
C. canephora 7.76 ± 0.02 a 7.77 ± 0.01 a 1.82 ± 0.09 a 1.83 ± 0.03 a 281.82 ± 0.05 b 282.15 ± 0.04 b
§Results from triplicate extractions expressed as mean ± standard deviation; coefficient of variation lower than 2% for all mineral analyses; different superscript letters (a or b) for the same
mineral or salt (same column) indicate that values differ statistically (p ≤ 0.01) by using Fisher’s test. Limits of detection (LOD): 0.00014 mg/L for Fe, 0.0009 mg/L for Zn, and 0.0048 for
Ca. Limits of quantification (LOQ): 0.00046 mg/mL for Fe, 0.00297 mg/mL for Zn, and 0.01584 mg/mL for Ca.Beverages 2019, 5, 4 9 of 18
Beverages 2019, 5, 4 8 of 17
Iron contents in C. arabica and C. canephora control samples (Table 2, mean of 5.68 ± 0.02 mg/100 g)
wereIron
below those in
contents described
C. arabicainandtheC.Brazilian
canephoraFood Composition
control samples (Table Table (TACO)
2, mean (8.10±mg/100
of 5.68 g) [52],
0.02 mg/100 g)
also
were below those described in the Brazilian Food Composition Table (TACO) (8.10 mg/100 g)of[52],
obtained using ICP-OES. On the other hand, Gogoasa et al. [49] analyzed five blends C.
arabica and C. using
also obtained canephora species
ICP-OES. On and
theobtained a mean
other hand, iron content
Gogoasa et al. [49]ofanalyzed
3.63 ± 0.05 mg/100
five blendsg.of C. arabica
and C. canephora species and obtained a mean iron content of 3.63 ± 0.05 mg/100 g.(Table 2, mean of
Zinc values found in the present study for C. arabica and C. canephora species
0.83 ±Zinc
0.03values
mg/100foundg) were in the
in the samestudy
present magnitude
for C. than those
arabica andreported
C. canephorain TACO
species(0.50 mg/100
(Table g) [52]
2, mean of
by Gogoasa et al. [49] (mean of 0.62 ± 0.02 mg/100 g for C. arabica and C.
0.83 ± 0.03 mg/100 g) were in the same magnitude than those reported in TACO (0.50 mg/100 g) [52] canephora species) and by
Malik et al. [53]
by Gogoasa (mean
et al. of 0.70of
[49] (mean ± 0.16
0.62 mg/100 g for C. arabica
± 0.02 mg/100 g for C.and C. canephora
arabica species). species) and by
and C. canephora
Malik With
et al.regard to calcium,
[53] (mean of 0.70 the mean
± 0.16 content
mg/100 obtained
g for C. arabicain and
the C.present study
canephora for C. arabica and C.
species).
canephora
With regard to calcium, the mean content obtained in the present studymagnitude
species (Table 2, mean of 131.74 ± 0.03 mg/100 g) was also in the same of those
for C. arabica and
reported by TACO [52] for C. arabica species (107.00 mg/100 g), and
C. canephora species (Table 2, mean of 131.74 ± 0.03 mg/100 g) was also in the same magnitude of mean values reported by
Malik
of thoseet reported
al. [53] (144.30
by TACO ± 24.9 mg/100
[52] for C. g) and Gogoasa
arabica et al. [49]
species (107.00 (149.60
mg/100 g),±and
0.03ofmg/100 g) for C.
mean values arabica
reported
and C. canephora.
by Malik et al. [53] (144.30 ± 24.9 mg/100 g) and Gogoasa et al. [49] (149.60 ± 0.03 mg/100 g) for
C. arabica and C. canephora.
3.2.2. Fortified Coffees
3.2.2.The
Fortified
meanCoffees
concentrations of iron, zinc, and calcium obtained in ground roasted coffees after
fortification
The mean (Table 3) were consistent
concentrations of iron, with
zinc, the
andamount
calciumof minerals
obtained in present
ground in the salts
roasted usedafter
coffees for
fortification.
fortification (Table 3) were consistent with the amount of minerals present in the salts used
for fortification.
3.3. Mineral Concentrations in Unfortified and Fortified Coffee Brews
3.3. Mineral Concentrations in Unfortified and Fortified Coffee Brews
The mean concentrations of iron, zinc, and calcium in filtered and espresso coffee brews
The mean
prepared from concentrations
the unfortified of
andiron, zinc, and
fortified calcium
ground in filtered
roasted and
coffees areespresso
shown coffee brews
in Table prepared
3 and Figure
from the unfortified and fortified ground roasted coffees are shown in Table 3 and Figure 2.
2.
Figure 2. Means
Means plot
plot considering
considering the
the influence
influence of
of different coffee species, brewing methods (dripper
paper filter (D-PF), dripper
dripper nylon
nylon paper
paper (D-NF)
(D-NF) and
and espresso),
espresso), and
and minerals.
minerals. Fe bis—ferrous
bisglycinate chelate,
bisglycinate chelate, Fe
Fe sulf—ferrous
sulf—ferrous sulfate;
sulfate; Zn
Zn bis—zinc
bis—zinc bisglycinate
bisglycinate chelate;
chelate; Zn
Zn lac—zinc
lac—zinc lactate;
lactate;
Ca phos—tricalcium phosphate; Ca lac—calcium lactate.Beverages 2019, 5, 4 9 of 17
Table 3. Mean concentrations of iron, zinc and calcium in brews from ground roasted, unfortified (control), and fortified C. arabica and C. canephora coffee species
(mg/100 mL) § .
Mineral Concentrations in Brews (Unfortified Coffees) Mineral Concentrations in Brews from Fortified Coffees
(C. arabica) (C. arabica)
Fe + ferrous Fe + ferrous Zn + zinc Zn + zinc Ca + tricalcium Ca + calcium
Brewing method Fe Zn Ca
bisglycinate sulfate bisglycinate Lactate Phosphate lactate
Electric dripper
0.032 ± 0.001 a 0.026 ± 0.001 a 3.719 ± 0.002 a 0.492 ± 0.001 a 0.463 ± 0.001 a 0.095 ± 0.001 a 0.145 ± 0.002 a 13.159 ± 0.001 a 22.200 ± 0.002 a
(paper filter)
Electric dripper
0.027 ± 0.001 b 0.028 ± 0.000 a 3.513 ± 0.000 b 0.484 ± 0.000 b 0.452 ± 0.000 b 0.097 ± 0.000 a 0.136 ± 0.000 b 11.970 ± 0.000 b 22.100 ± 0.000 b
(nylon filter)
Espresso 0.101 ± 0.002 c 0.038 ± 0.000 b 7.407 ± 0.001 c 0.765 ± 0.001 c 0.679 ± 0.001 c 0.190 ± 0.001 b 0.225 ± 0.001 b 20.790 ± 0.000 c 31.200 ± 0.001 c
(C. canephora) (C. canephora)
Fe + ferrous Fe + ferrous Zn + zinc Zn + zinc Ca + tricalcium Ca + calcium
Brewing method Fe Zn Ca
bisglycinate sulfate bisglycinate lactate phosphate lactate
Electric dripper
0.035 ± 0.003 a 0.029 ± 0.001 a 3.849 ± 0.002 a 0.535 ± 0.001 a 0.504 ± 0.001 a 0.100 ± 0.001 a 0.145 ± 0.000 a 12.419 ± 0.000 a 22.549 ± 0.001 a
(paper filter)
Electric dripper
0.035 ± 0.000 a 0.028 ± 0.001 b 3.506 ± 0.002 b 0.507 ± 0.000 b 0.459 ± 0.000 b 0.098 ± 0.000 a 0.131 ± 0.000 b 13.260 ± 0.000 b 22.300 ± 0.000 b
(nylon filter)
Espresso 0.125 ± 0.002 b 0.038 ± 0.002 c 6.990 ± 0.000 c 0.831 ± 0.000 c 0.753 ± 0.001 c 0.183 ± 0.002 b 0.216 ± 0.000 c 20.780 ± 0.000 c 31.050 ± 0.000 c
§ Results from triplicate extractions and duplicate beverage preparation, expressed as mean ± standard deviation; coefficient of variation (CV) lower than 2% for all mineral analyses
(higher CV can be attributed to methods of preparation); different small superscript letters (a, b or c) for the same mineral indicate statistical difference (p ≤ 0.001) by using Fisher’s test.
Note: Brews from fortified coffees include the original amount of mineral contained in the coffee powder.Beverages 2019, 5, 4 10 of 17
3.3.1. Brews from Unfortified Coffee Grounds
Results reported in Table 3 are in agreement with our previous results obtained by Costa [38] who
reported a mean iron content of 0.109 mg/100 mL and zinc content of 0.033 mg/100 mL for coffees
prepared using the espresso method. The calcium content was not evaluated in the referred study.
Regarding filtered brews, Malik et al. [53] reported mean values of 0.009, 0.002,
and 0.914 mg/100 mL for iron, zinc, and calcium, respectively, in filtered brews from ground roasted
coffees, lower than those found in the present study. Gillies and Birkbeck [54], on the other hand,
reported mean concentrations of 0.033, 0.018, and 2.78 mg/100 mL, respectively, in paper-filtered coffee
brews. Such differences among studies are common and can be attributed to the different ways of
brewing coffees, including parameters applied in the extraction process, such as the proportion of coffee
and water, temperature, water characteristics, and extraction time, as well as different characteristics
of ground coffees and analytical methods [51,55].
In general, among the unfortified coffees, no difference was observed between mineral extraction
from C. arabica and C. canephora species. Also, there was no difference or a very small difference in
iron and zinc extractions using paper and nylon filters. On the other hand, the difference between
filtered and espresso methods was remarkable, especially in the fortified coffees. Considering both
species and filters, espresso method extracted 19.9%, 46.1%, and 54.6% of iron, zinc, and calcium,
respectively, while dripping extracted 5.68%, 36.7%, and 27.7%, respectively. The differences in the
extractability among the minerals existing in the coffee matrix, according to Donangelo [48], may be
related to the nature and strength of the complexes that their ions form with the constituents of the
matrix, such as polyphenols, caffeine, and other compounds, while higher extraction by espresso
method can be attributed to the higher pressure (9 bar) applied to the brewing process compared to all
other extraction methods, including the filtered coffee (little more than 1 bar) [51].
3.3.2. Brews from Fortified Ground Coffees
In order to calculate the mineral percent recovery in fortified coffees, both the coffee matrix
mineral composition and the mineral amount used for fortification were considered. In fortified
coffees, all variables contributed to differences in the results, including species, type of mineral salt,
and extraction method, although only small differences were observed between results for C. arabica
and C. canephora species and for paper and nylon filters (Table 3, Figure 2). In general, there was a
tendency for higher values for paper filters, but in practical life, this difference would probably have no
significance. Also, the difference in espresso method compared to filtered methods was considerably
higher in fortified coffees (Figure 2).
The mean percentages of iron recovery in the espresso and filtered brews obtained from fortified
coffees were 76.6% and 49.3%, respectively (Figure 3A). For zinc, the mean percentages recovered were
69.6% and 40.4%, respectively (Figure 3B), while for calcium, they were 60.1% and 40.5%, respectively
(Figure 3C).
The mineral salts with higher recoveries in both tested brewing methods were: ferrous bisglycinate
chelate, zinc lactate, and calcium lactate, with mean recovery percentages of 80.8%, 75.4%, and 72.1%,
respectively, in espresso brews, and of 51.1%, 47.6%, and 51.6%, respectively, in filtered brews
(Figure 3A–C). These were the same salts that presented better attributes and ranking positions
in the preliminary sensory test. Although ferrous sulfate presented mean recoveries (72.5% in the
espresso coffees and 47.5% in filtered coffees) similar to ferrous bisglycinate chelate, it presented a
more intense metallic flavor in the preliminary sensory test when compared to ferrous bisglycinate
chelate, therefore it is not recommended.
Several studies on food fortification have shown that ferrous bisglycinate chelate is a
recommended source of iron for food fortification as it is a soluble salt with high bioavailability,
safety and stability in foods like milk, yogurt, and wheat flour [56–59].Beverages 2019, 5, 4 11 of 17
Beverages 2019, 5, 4 12 of 18
(A)
90
83.52
78.06
80 75.68
69.28
70
60
Fe recovery % 53.77
50.20 49.39 50.94 50.65
47.24 46.12 Eletric coffee dripper
50 46.13
(paper filter)
40 Eletric coffee dripper
(nylon filter)
30
Espresso coffeemaker
20
10
-
A. Fe bis. A. Fe sulf. C. Fe bis. C. Fe sulf.
(B)
90
80 76.79
73.97
70 64.84
62.67
60
Zn recovery %
49.49 49.66
50 46.42 44.86
Eletric coffee dripper
(paper filter)
40 34.25 33.56
32.42 33.10 Eletric coffee dripper
30 (nylon filter)
20 Espresso coffeemaker
10
-
A. Zn bis. A. Zn lact. C. Zn bis. C. Zn lact.
(C)
90
80
72.08 72.10
70
60
Ca recovery %
51.29 51.06 52.36 51.78
50 48.03 48.25 Eletric coffee dripper
(paper filter)
40 Eletric coffee dripper
30.40
27.66 28.84 30.79 (nylon filter)
30
Espresso coffeemaker
20
10
-
A. Ca phos. A. Ca lact. C. Ca phos. C. Ca lact.
Figure 3. Mean percent recovery of iron (A), zinc (B), and calcium (C) in brews prepared
Figurefortified
from 3. Meanground
percentroasted
recoveryC. of iron and
arabica (A), C.
zinc (B), andusing
canephora calciuman (C) in brews
electric dripperprepared
(paper from
and
fortified
nylon ground
filters) and roasted
espressoC. arabica
machine. §
and C. Note:
canephora using an
Recovery waselectric dripperbased
calculated (paperonand
thenylon
sum filters)
of the
and espresso
amount machine.
of mineral § Note: Recovery was calculated based on the sum of the amount of mineral
existing in the matrix and the added amount of salt. A Fe bis—C. arabica,
existingbisglycinate
ferrous in the matrixchelate;
and theA. added amount arabica,
Fe sulf.—C. of salt. A Fe bis—C.
ferrous arabica,
sulfate; C. Feferrous
bis—C. bisglycinate
canephora, chelate;
ferrous
A. Fe sulf.—C. arabica, ferrous sulfate; C. Fe bis—C. canephora, ferrous bisglycinate
bisglycinate chelate; C. Fe sulf.—C. canephora, ferrous sulfate.; A Zn bis—C. arabica, zinc bisglycinatechelate; C. Fe
sulf.—C. A.
chelate; canephora, ferrous
Zn lact.—C. sulfate.;
arabica, A lactate;
zinc Zn bis—C. arabica,
C. Zn zinc canephora,
bis—C. bisglycinate chelate;
zinc A. Zn lact.—C.
bisglycinate chelate;
arabica,
C. zinc lactate;
Zn lact.—C. C. Zn
canephora, bis—C.
zinc canephora,
lactate; zinc bisglycinate
A Ca phos—C. chelate;
arabica, calcium C. ZnClact.—C.
phosfate; canephora,
Ca phos—C. zinc
canephora,
lactate; A
calcium Ca phos—C.
phosfate; arabica, calcium
A Ca lact—C. phosfate;
arabica, calcium C CaCphos—C.
lactate; Ca lact—C. canephora, calcium
canephora, calciumphosfate;
lactate. A Ca
lact—C. arabica, calcium lactate; C Ca lact—C. canephora, calcium lactate.
Considering that Brazilians consume, on average, about 220 mL of coffee per day [60], it can be
estimated that the that
Considering consumption
Braziliansofconsume,
220 mL of
onthe iron-fortified
average, filtered
about 220 mL ofbrew would
coffee per provide
day [60],1.336
it canmg,
be
or about 9.5%
estimated thatof iron
the recommended
consumption daily
of 220 mLintake
of the(RDI), which isfiltered
iron-fortified 14 mg according
brew would to ANVISA [40].
provide 1.336
This
mg, is
orequivalent
about 9.5% to of
16.7%
ironofrecommended
men and 7.4% daily
of women
intakeUSDA Nutrient
(RDI), which Database
is 14 mg for Standard
according toReference
ANVISA
[40]. This is equivalent to 16.7% of men and 7.4% of women USDA Nutrient Database for Standard
Reference (NDSR) [61] RDI for iron. Comparing iron content in iron-fortified coffee brews with thoseBeverages 2019, 5, 4 12 of 17
(NDSR) [61] RDI for iron. Comparing iron content in iron-fortified coffee brews with those of other
plant food sources, 247 mL of the fortified brew from this study is equivalent to 100 g of cooked
black beans, containing about 1.5 mg of this mineral [52]. According to the Family Budget Survey
(POF) published by the Brazilian Institute of Geography and Statistics and the Ministry of Health in
2008/2009, the mean habitual per capita consumption of wheat flour by Brazilian families is 75 g/day,
where such flour theoretically contains about 3.1 mg/iron (about 2.5 times the amount contained
in 220 mL filtered fortified coffee). Comparing coffee and fortified wheat flour, despite a higher
amount of iron, unlike the fortified coffee brew, wheat flour presents in its composition phytates,
which may considerably inhibit the absorption of iron in the intestinal lumen [62]. On the other hand,
coffee polyphenols are also able to chelate iron, although to a lesser extent [63].
It has been previously reported that zinc lactate has higher solubility, stability, bioavailability, and a
more neutral taste when compared to other zinc salts used in food fortification [64,65]. Zinc lactate
added to strawberry jam in an amount equivalent to 50% of the RDI for Brazilian adults (3.5 mg
Zn) tasted similar to conventional strawberry jam and presented good stability six months after jelly
production [66]. Two hundred milliliters of filtered brew prepared with the present coffee fortified
with zinc would provide, on average, 0.368 mg, or about 5.3% of zinc RDI [40]. Taking into account
the USDA-NDSR [60] RDI for zinc, the provided amount of zinc would represent 3.3% RDI for
men and 4.6% RDI for women. According to Araujo et al. [67] the inadequate consumption of this
mineral can reach up to 30.0% of the Brazilian population. Zinc deficiency is also highly prevalent in
other low- and middle-income countries. Thus, affected populations are at increased risk of growth
retardation, diarrheal diseases, and respiratory tract infections. Micronutrient supplements, such as
zinc, are therefore potentially important interventions in the context of reaching the United Nations
Millennium Development Goals [68].
Calcium lactate has better solubility when compared to tricalcium phosphate. Calcium lactate is
known to have good solubility, bioavailability, low cost, and neutral taste when compared to other
calcium salts being widely used in food fortification [69,70]. In addition, Haro et al. [71] fortified juices
with different calcium salts and observed that calcium lactate showed good stability in beverages over
a period of 12 months. The calcium-enriched mango yogurt prepared after fortification of pasteurized
yogurt mix with calcium lactate corresponding to 50 mg Ca/100 mL did not show significant differences
in flavor, color, body, and texture scores when compared to the control [72]. Taking into account the
consumption of 220 mL of filtered and espresso coffees, the calcium fortified coffee brews in the present
study would provide, on average, 56.0 mg, corresponding to 5.6% of the Brazilian and American
RDI of 1000 mg for adults (considering both ANVISA and USDA-NDSR) [40,61]. This content is
equivalent to other plant food sources of calcium, such as kale, with a mean content of 65.5 mg of
calcium per 50 g [52]. According to Araujo et al. [67], the inadequate consumption of this mineral
can reach percentages up to 90.0% for both Brazilian men and women. Regarding the prevalence of
calcium inadequacy in Europe, in most nutritional surveys reviewed by Viñas et al. [73], more than
20% of individuals presented intake below the estimated average requirement (EAR) defined by the
Institute of Medicine of the United States. According to World Health Organization (WHO)/Food and
Agriculture Organization (FAO), [2], the best indication of calcium adequacy especially for developing
countries is probably provided by comparing dietary intakes with recommended nutrient intakes
(RNI), despite the variability; and uncertainty in the recommended intakes for calcium. On the basis of
the fact that intakes of dairy products are low, it is highly likely that low or very low calcium intakes
are very common in developing countries and therefore they would benefit from coffee fortification.
Still regarding calcium, it has been reported in different studies that acute consumption of caffeine
can increase the urinary excretion of this mineral and reduce bone formation, especially in those who
do not consume coffee regularly. However, due to body mechanisms for adaptation, in regular coffee
consumers, this increase in calcium excretion is lowered. Nawrot et al., [74] concluded in a review that
caffeine intakes lower than 400 mg/day (3 to 4 100 mL coffee cups) does not have significant effects
on bone status or calcium balance in individuals ingesting at least 800 mg calcium/day (this are theBeverages 2019, 5, 4 13 of 17
latest recommendations on the subject) [75]. Therefore, calcium fortification would help increase daily
intake and help making up for eventual losses due to caffeine.
4. Conclusions and Final Considerations
Ferrous bisglycinate chelate, zinc lactate, and calcium lactate presented better recoveries in
both dripping and espresso extraction methods compared to the other tested minerals. As ferrous
sulphate, zinc bisglycinate chelate, and tricalcium phosphate presented very low recoveries during
brewing, probably due to low solubility, these salts would not be recommended for fortification of
ground roasted coffees. Among the salts with better recovery, zinc bisglycinate chelate and tricalcium
phosphate presented very promising sensorial results when offered to tasters in the amount of 30%
of Brazilian DRI, while ferrous bisglycinate chelate did not present satisfactory results. Therefore,
the effect of lowering the amount of this salt, as well as new iron salts, should be evaluated in sensory
tests. Also, the positive or negative effects of the salts’ association on the sensorial attributes and
acceptance of coffee brews should be evaluated.
As previously mentioned coffee largely meets the prerequisites for use as a food fortification
vehicle, being considered a popular food, widely consumed by the populations in general. Ground
roasted coffee was selected as an option for fortification due to the lower cost compared to soluble
coffee. Considering the loss of minerals observed in filtered coffee, which is most used by the mineral
deficient segments of populations, and aiming the preparation of large quantities of the beverage for
popular restaurants and governmental institutions, the fortification of soluble coffee could be an option
since it does not present a loss of salts. However, given the very low cost of these mineral salts and the
higher cost and lower acceptability of soluble coffee by this segment of the populations, fortification of
ground roasted coffee is still a promising option. The higher extraction observed in espresso coffees
indicates that fortification can be also performed in coffees targeting espresso coffee consumers of
different social classes and countries who are also in need for diet supplementation. For example,
women in their menopausal period could largely benefit from calcium fortification.
Regarding the possibility of toxicity, the tolerable upper intake level (UL) can be defined as the
highest average daily nutrient intake that is likely to pose no risk of adverse health effects to almost
all individuals in the general population [76]. For iron, zinc, and calcium, these limits would be
45 mg, 40 mg, and 2500 mg, respectively. Considering salts that obtained the best recovery results,
ferrous bisglycinate chelate, zinc lactate, and calcium lactate, heavy coffee consumers (for example,
500 mL/day) would consume, on average, 2.52 mg of iron, 0.70 mg of zinc, and 111.44 mg of calcium
through filtered brew from fortified coffee, or about 3.99 mg of iron, 1.10 mg of zinc, and 155.63 mg
of calcium in the espresso brew. Therefore, neither of both methods would reach the UL for these
minerals [77].
With the development of micro- and nano-encapsulation technologies, one may ask why
traditional salts were used for ground coffee fortification (especially iron) since they have the
disadvantage of possibly interacting with the food matrix and alter its sensory properties. However,
considering filtering coffee is the most used preparation method by those who are in need of
fortification, the authors hypothesized that in addition to being costlier, such particles, especially
microparticles, could present higher retention in the paper or nylon filter. However, new experiments
should be performed using such technologies for coffee fortification, especially nanoparticles,
which can be very fine and may pass through these filters.
Considering that product development must include consumer acceptance, stability during
storage, and microbiological safety analyses, these aspects will be approached in future studies.
Author Contributions: A.S. and A.F. wrote the manuscript; N.M.B., J.D.P.L., C.V., T.D.S.P., and A.F. were involved
in the chemical and statistical analyses. A.F. and C.M.D. planned the study.
Funding: This research was funded by the National Council for Scientific and Technological Development
(CNPq, Brazil grant number 78118/2013-9) and the Rio de Janeiro State Research Support Foundation (FAPERJ:
grant number E-34/2014#204810).Beverages 2019, 5, 4 14 of 17
Acknowledgments: The authors would like to thank the coffee producers’ cooperatives COOXUPÉ (Minas
Gerais, Brazil) and COOABRIEL (Espirito Santo, Brazil) for generously providing the C. arabica and C. canephora
samples, respectively. The authors acknowledge scholarships provided by the National Council for Scientific and
Technological Development (CNPq, Brazil reg.#309091/2016-0) and the Rio de Janeiro State Research Support
Foundation (FAPERJ: E-02/2017#234092).
Conflicts of Interest: The authors declare no conflicts of interest.
References
1. Tulchinsky, T.H. Micronutrient Deficiency conditions: Global health issues. Public Health Rev. 2010, 32,
243–255. [CrossRef]
2. World Health Organization. Guidelines on Food Fortification with Micronutrients; WHO: Geneva,
Switzerland, 2006; Available online: http://www.who.int/nutrition/publications/guide_food_fortification_
micronutrients.pdf (accessed on 20 August 2018).
3. Piccoli, N.B.; Grede, N.; Pee, S.; Singhkumarwong, A.; Roks, E.; Moench-Pfanner, R.; Bloem, M.W.
Rice fortification: Its potential for improving micronutrient intake and steps required for implementation at
scale. Food Nutr. Bull. 2012, 33, S360–S372. [CrossRef] [PubMed]
4. World Health Organization. The Double Burden of Malnutrition—Policy Brief ; WHO: Geneva, Switzerland,
2016; Available online: http://apps.who.int/iris/bitstream/handle/10665/255413/WHO-NMH-NHD-17.3-
eng.pdf?ua=1 (accessed on 5 August 2018).
5. Metas Mundiales de Nutritión 2025: Documento Normativo sobre Anemia; WHO: Geneva, Switzerland, 2017.
Available online: https://www.who.int/nutrition/publications/globaltargets2025_policybrief_anaemia/es/
(accessed on 29 July 2018).
6. McLean, E.; Cogswel, M.; Egli, I.; Wojdyla, D.; Benoist, B. Worldwide prevalence of anaemia, WHO Vitamin
and Mineral Nutrition Information System, 1993–2005. Public Health Nutr. 2009, 12, 444–454. [CrossRef]
[PubMed]
7. Mirza, F.G.; Kadir, R.A.; Breymann, C.; Fraser, I.S.; Taher, I. Impact and management of iron deficiency and
iron deficiency anemia in women’s health. Expert Rev. Hematol. 2018, 11, 727–736. [CrossRef]
8. Choi, S.; Liu, X.; Pan, Z. Zinc deficiency and cellular oxidative stress: Prognostic implications in
cardiovascular diseases. Acta Pharmacol. Sin. 2018, 39, 1120–1132. [CrossRef] [PubMed]
9. Chasapis, C.C.; Loutsidou, A.S.; Chara, S.M. Zinc and human health: An update. Arch. Toxicol. 2012, 86,
521–534. [CrossRef] [PubMed]
10. Maxfield, L.; Crane, J.S. Zinc Deficiency. StatPearls Publishing LLC: Florida, FL, USA, 2018.
11. Ross, C.; Taylor, C.L.; Yaktine, A.L.; Del Valle, H.B. Dietary Reference Intakes for Calcium and Vitamin D; Institute
of Medicine (US) Committee; National Academies Press (US): Washington, DC, USA, 2011.
12. Prentice, A. Nutritional rickets around the world. J. Steroid Biochem. Mol. Biol. 2013, 136, 201–206. [CrossRef]
13. US Department of Health & Human Services. National Institutes of Health, 2018. Available online: https:
//ods.od.nih.gov/factsheets/Calcium-HealthProfessional/ (accessed on 16 October 2018).
14. Marques, M.F.; Marques, M.M.; Xavier, E.R.; Gregório, E.L. Fortificação de alimentos: Uma alternativa para
suprir as necessidades de micronutrientes no mundo contemporâneo. HU Revista 2012, 38, 79–86.
15. De Pee, S. Proposing Nutrients and Nutrient Levels for Rice Fortification; Nutrition Advisory Office, World Food
Programme: Rome, Italy, 2014.
16. International Coffee Organization (ICO). Coffee Market Report; International Coffee Organization: London,
UK, 2017. Available online: http://www.ico.org/prices/new-consumption-table.pdf (accessed on
15 November 2018).
17. Einöther, S.J.; Giesbrecht, T. Caffeine as an attention enhancer: Reviewing existing assumptions.
Psychopharmacology 2013, 225, 251–274. [CrossRef]
18. Nehlig, A. Is caffeine a cognitive enhancer? J. Alzheimers Dis. 2010, 20, S85–S94. [CrossRef]
19. Borota, D.; Murray, E.; Keceli, G.; Chang, A.; Watabe, J.M.; Ly, M.; Toscano, J.P.; Yassa, M.A. Post-study
caffeine administration enhances memory consolidation in humans. Nat. Neurosci. 2014, 17, 201–203.
[CrossRef] [PubMed]
20. Smith, A.; Sutherland, D.; Christopher, G. Effects of repeated doses of caffeine on mood and performance of
alert and fatigued volunteers. J. Psychopharmacol. 2005, 19, 620–626. [CrossRef] [PubMed]Beverages 2019, 5, 4 15 of 17
21. Olson, C.A.; Thornton, J.A.; Adam, G.E.; Lieberman, H.R. Effects of 2 adenosine antagonists, quercetin and
caffeine, on vigilance and mood. J. Clin. Psychopharmacol. 2010, 30, 573–578. [CrossRef] [PubMed]
22. Arab, L.; Khan, F.; Lam, H. Epidemiologic evidence of a relationship between tea, coffee, or caffeine
consumption and cognitive decline. Adv. Nutr. 2013, 4, 115–122. [CrossRef] [PubMed]
23. Ritchie, K.; Carrière, I.; De Mendonça, A.; Portet, F.; Dartigues, J.F.; Rouaud, O.; Barberger-Gateau, P.;
Ancelin, M.L. The neuroprotective effects of caffeine: A prospective population study (the three city study).
Neurology 2007, 69, 536–545. [CrossRef] [PubMed]
24. Corley, J.; Jia, X.; Kyle, J.A.; Gow, A.J.; Brett, C.E.; Starr, J.M.; Mcneill, G.; Deary, I.J. Caffeine consumption
and cognitive function at age 70: The Lothian Birth Cohort 1936 Study. Psychosom. Med. 2010, 72, 206–214.
[CrossRef] [PubMed]
25. Goldstein, E.R.; Ziegenfuss, T.; Kalman, D.; Kreider, R.; Campbell, B.; Wilborn, C.; Taylor, L.; Willoughby, D.;
Stout, J.; Graves, B.S.; et al. International society of sports nutrition position stand: Caffeine and performance.
J. Int. Soc. Sports Nutr. 2010, 7, 5. [CrossRef]
26. Pandey, K.B.; Rizvi, S.I. Plant polyphenols as dietary antioxidants in human health and disease. Oxid. Med.
Cell. Longev. 2009, 2, 270–278. [CrossRef]
27. Liang, N.; Kitts, D.D. Role of chlorogenic acids in controlling oxidative and inflammatory stress conditions.
Nutrients 2015, 8, 16. [CrossRef]
28. Figueiredo, R.C. Enriquecimento de Café Solúvel com Ferro, Zinco e Ácido Fólico: Avaliação da Biodisponibilidade
em Mulheres Adultas [Dissertação de Mestrado]; Universidade Federal do Rio de Janeiro: Rio de Janeiro,
Brazil, 2007.
29. Giorgini, E.; Fisberg, M.; De Paula, R.A.C.; Ferreira, A.M.A.; Valle, J.; Braga, J.A.P. The use of sweet rolls
fortified with iron bis-glycinate chelate in the prevention of iron deficiency anemia in preschool children.
Archivos Latinoamericanos de Nutrición 2001, 1, 48–53.
30. Rodrigues, J.E.F.G.; Pineda, O.; Name, J.J.; Sanchez, J.G. Effectiveness of iron bis-glycine chelate in chocolate
drink in the control of iron deficiency in preschool children. Nutrire 2006, 31, 43–52.
31. International Coffee Organization (ICO). Annual Review, 2011/2012. London, UK. Available online:
http://www.ico.org/documents/cy2012-13/annual-review-2011-12e.pdf (accessed on 20 September 2018).
32. Associação Brasileira da Indústria de Café. Tendências do Mercado de Café. 2016. Rio de Janeiro, Brasil.
Available online: http://abic.com.br/src/uploads/2018/05/2016.pdf (accessed on 8 October 2018).
33. Monteiro, M.A.; Minim, V.P.; Silva, A.F.; Chaves, J.B. Influência da torra sobre a aceitação da bebida café.
Rev. Ceres 2010, 57, 145–150. [CrossRef]
34. Umbelino, D.C.; Rossi, E.A.; Cardello, H.M.; Lepera, J.S. Aspectos tecnológicos e sensoriais do “iogurte” de
soja enriquecido com cálcio. Ciência Tecnologia Alimentos 2001, 21, 276–280. [CrossRef]
35. Tuma, R.B.; Yuyama, L.K.; Aguiar, J.; Marques, H. Impacto da farinha de mandioca fortificada com ferro
aminoácido quelato no nível de hemoglobina de pré-escolares. Revista Nutrição 2003, 16, 29–39. [CrossRef]
36. Casé, F.; Deliza, R.; Rosenthal, A.; Mantovani, D.; Felberg, I. Produção de “leite” de soja enriquecido com
cálcio. Ciência Tecnologia Alimentos 2005, 25, 86–91. [CrossRef]
37. Gonçalves, A.A.; Leindecker, T.; Biedrzycki, A. Suco de uva em pó fortificado com ferro. Alimentos Nutrição
Araraquara 2008, 19, 177–181.
38. Costa, L. Café Torrado e Moído Fortificado: Avaliação da Eficiência de Extração dos Minerais Adicionados e
Análise Sensorial do Produto Desenvolvido [Dissertação de Mestrado]; Universidade Federal do Rio de Janeiro:
Rio de Janeiro, Brazil, 2010.
39. Lima, E.C.; Cardoso, M.H. Bebida de soja (Glycine Max) e acerola (Malpighia Punicifolia) enriquecida com
cálcio. Alim. Nutr Araraquara 2012, 23, 549–553.
40. Brasil Ministério da Saúde. Agência Nacional De Vigilância Sanitária. Resolução RDC nº 269, 22 de setembro de
2005; Regulamento técnico sobre a ingestão diária recomendada (IDR) de proteína, vitaminas e minerais;
Ministério da Saúde: Brasília (DF), 2005.
41. Alyami, H.; Dahmash, E.; Bowen, J.; Mohammed, A.R. An investigation into the effects of excipient particle
size, blending techniques and processing parameters on the homogeneity and content uniformity of a blend
containing low-dose model drug. PLoS ONE 2017, 12, e0178772. [CrossRef] [PubMed]
42. Meilgaard, M.C.; Civille, G.V.; Carr, B.T. Sensory Evaluation Techniques, 3rd ed.; CRC Press: Boca Raton, FL,
USA, 1999; 387p.Beverages 2019, 5, 4 16 of 17
43. Choi, S.E. Sensory Evaluation. In Food Science: An Ecological Approach, 1st ed.; Edelstein, S., Ed.; Jones and
Bartlett Learning LLC: Burlington, MA, USA, 2014.
44. Wrobel, K. Determination of total aluminum, chromium, copper, iron, manganese, and nickel and their
fractions leached to the infusions of black tea, green tea, Hibiscus sabdariffa, and Ilex paraguariensis (mate)
by ETA-AAS. Biol. Trace Elem. Res. 2000, 78, 271–280. [CrossRef]
45. Mehansho, H. Iron fortification technology development: New approaches. J. Nutr. 2006, 136, 1059–1063.
[CrossRef] [PubMed]
46. Sampaio, C.R.; Ferreira, S.M.; Canniatti-Brazaca, S.G. Perfil sensorial e aceitabilidade de barras de cereais
fortificadas com ferro. Alim. Nutr. 2009, 20, 95–106.
47. Sousa, C.; Fernandes, B.C.; Fernandes, P.H. Characterization of lactic drink pasteurized with added iron.
Rev. Teccen 2015, 8, 1–32.
48. Donangelo, C.M. Minerals. In Coffee: Production, Quality and Chemistry; Farah, A., Ed.; Royal Society of
Chemistry: London, UK, 2019; pp. 505–516.
49. Gogoasa, L.; Pirvu, A.; Alda, M.; Ariana, V.; Maria, R.; Maria, B.D.; Diana, M.; Simion, B.; Gergen, L.
The mineral contentofdifferentcoffeebrands. J. HFB 2013, 17, 68–71.
50. Farnezi, M.M.; Silva, E.B.; Guimarães, P.T. Nutritional diagnosis of coffee plantations in the Upper
Jequitinhonha Valley, Minas Gerais State, Brazil: DRIs norms and critical nutrient ranges. Revista Brasileira de
Ciência do Solo 2009, 33, 969–978. [CrossRef]
51. Farah, A. Coffee Constituents. In Coffee: Emerging Health Effects and Disease Prevention, 1st ed.; Chu, Y., Ed.;
Blackwell Publishing Ltd.: Hoboken, NJ, USA, 2012; pp. 21–57.
52. TACO—Tabela Brasileira de Composição de Alimentos/NEPA—UNICAMP, 4th ed.NEPA-UNICAMP:
Campinas, Brazil, 2011.
53. Malik, J.; Szakova, J.; Drabek, O.; Balik, J.; Kokoska, L. Determination of certain micro and macro elements in
plant stimulants and their infusions. Food Chem. 2008, 111, 520–525. [CrossRef] [PubMed]
54. Gillies, M.E.; Birkbeck, J.A. Tea and coffee as sources of some minerals in the New Zealand diet. Am. J.
Clin. Nutr. 1983, 38, 936–942. [CrossRef] [PubMed]
55. Flaten, T.P. Aluminium in tea—Concentrations, speciation and bioavailability. Coord. Chem. Rev. 2002, 228,
385–395. [CrossRef]
56. Food and Agriculture Organization. Ferrous glycinate (processed with citric acid). Chem. Tech. Assess. 2004.
57. Drago, S.R.; Valencia, M.E. Effect of fermentation on iron, zinc, and calcium availability from iron-fortified
dairy products. J. Food Sci. 2002, 67, 3130–3134. [CrossRef]
58. Osman, A.K.; Al-Othaimeen, A. Experience with ferrous bis-glycinechelate as an iron fortificant in milk.
Int. J. Nutr. Res. 2002, 72, 257–263. [CrossRef]
59. Marchi, R.P.; Szarfarc, S.C.; Rodrigues, J.E. Consumption of fortified rice in prophylaxis of iron deficiency.
Nutrire 2004, 28, 53–64.
60. Cecafé, Brazilian Coffee Exporters Council. Available online: Https://www.cecafe.com.br/en/about-coffee/
consumption/ (accessed on 9 October 2018).
61. USDA Nutrient Database for Standard Reference. US Department of Agriculture, Agricultural Research
Service. Nutrient Data Laboratory Home Page. Available online: http://www.nal.usda.gov/fnic/foodcomp
(accessed on 19 November 2018).
62. Mazariegos, M.; Hambidge, K.M.; Krebs, N.F.; Westcott, J.E.; Lei, S.; Grunwald, G.K. Zinc absorption in
Guatemalan school children fed normal or low-phytate maize. Am. J. Clin. Nutr. 2006, 83, 59–64. [CrossRef]
[PubMed]
63. Brune, M.; Rossander, L.; Hallberg, L. Iron absorption and phenolic compounds: Importance of different
phenolic structures. Eur. J. Clin. Nutr. 1989, 43, 547–557. [PubMed]
64. Lohmann, P. Minerais na alimentação. Food Ingred. Brasil 2008, 4, 48–65.
65. Brown, K.H.; Hambidge, M.; Ranum, P. Zinc fortification of cereal flours: Current recommendations and
research needs. Food Nutr. Bull. 2010, 31, S62–S74. [CrossRef] [PubMed]
66. Silva, E.B. Desenvolvimento de Produtos Alimentares Adicionados de ferro, Cálcio, Zinco e Carotenoides (Alfacaroteno
e Betacaroteno) Como Proposta de Alimentos Enriquecidos ou Fontes Destes Nutrientes [Dissertação de Mestrado];
Universidade Federal Rural do Rio de Janeiro: Rio de Janeiro, Brazil, 2008.You can also read