NIMBLE WISDOM SA QUARTERLY - Q1 2019 - Sesfikile Capital
←
→
Page content transcription
If your browser does not render page correctly, please read the page content below

NIMBLE WISDOM
SA QUARTERLY
Q1 2019

2    Sesfikile Capital

    SECTOR PERFORMANCE

    Quarter one 2019 almost saw us come full circle, shooting out the gates with a stellar January performance
    only to see both February and March just about give it all back. It was really the last couple of days of the
    quarter that pushed the return into the green. The All Property Index (ALPI) and SA Listed Property Index
    (SAPY) recorded a respective total return of +1.3% and +1.5% for the quarter ended 31 March 2019.

    TABLE 01

    ASSET CLASS TOTAL RETURN TO 31 MARCH 2019

                                  Jan       Feb        Mar       YTD            1yr     3yr        5yr       10yr

     SA Listed Property Index    9.2%      -5.7%      -1.5%       1.5%        -5.7%   -3.8%       5.6%      12.4%

     All Property Index          8.4%      -4.8%      -1.9%       1.3%        -7.0%   -5.9%       4.1%      11.5%

     Equities                    2.8%       3.4%       1.6%      8.0%         5.0%     5.7%       6.5%      14.0%

     Bonds                       2.9%      -0.4%       1.3%      3.8%         3.4%     10.1%      8.3%      8.7%

     Cash                        0.6%       0.5%      0.6%        1.7%        7.3%     7.4%       7.0%      6.6%

    Source: Bloomberg

    January saw a significant bounce as the ALPI and SAPY delivered +8.4% and +9.2% respectively. We saw this
    as little more than the market believing that the December sell-off was overdone and with the potential for
    a better outcome from the US / China trade talks, risk assets were back in vogue. Locally we also witnessed
    a substantial foreign buy basket push the local stocks, with the UK names rallying as well, despite Brexit
    concerns not dissipating.

    February turned negative a week into the month as results started revealing that the growth expectations we
    had were too optimistic. The market as a whole was also expecting less negativity, which was expressed through
    a general sell-off in the local counters. February saw the offshore stocks outperforms as well as Fairvest, a
    local stock that managed to deliver strong results in the face of the tough local operating environment. The
    ALPI gave back -4.8%, while the SAPY shed -5.7%, bringing the two indices on par for the year.

    March continued with the malaise from the results season, which saw prices moving sideways right up until the
    lights went out. The reality of Eskom’s woes and the impact on the economy and property specific concerns,
    saw local stocks take another leg down (along with most South African exposed assets). With just a few
    days to go, both the ALPI and SAPY had given back all the alpha generated in January and were headed for
    another negative quarter. The market was bracing itself for a Moody’s review that had the potential to see our
    Sovereign rating pushed below investment grade across all three major rating agencies. But it seems as if the
    market veered from their bearish stance on the potential outcome of the Moody’s review and started to price
    in a temporary reprieve as Moody’s would wait and see how the elections would guide policy reform. This saw
    a two day correction into the end of the month and quarter, bringing both the ALPI and SAPY into the green
    with -1.9% and -1.5% for the month and +1.3% and +1.5% for the quarter.

                                    Nimble Wisdom SA Quarterly Q1 2019 3

CHART 01

ILLUSTRATED MONTH BY MONTH PROPERTY RETURN

Source: Bloomberg
4      Sesfikile Capital

Rosebank Link is a 20 000sqm P-grade office development by Redefine Properties.
WeWork is the primary tenant and will open doors on 1 September 2019.

                                                                                                                       Nimble Wisdom SA Quarterly Q1 2019 5

STOCK PERFORMANCE

There was very little in the way of a theme with regards to the best and worst performers for the quarter.
Three relatively speaking illiquid small caps topped the list:

Tradehold (+17.7%), Stenprop (+15.7%) and Dipula A (+14.6%) were the best performing counters. Tradehold
rallied off the back of the announcement to look to spin off the Collins Group assets into a separate listing and
bounced off all-time lows hit in late December (some 70% off mid-2016 peaks), while Stenprop saw further
implementation of their strategy to acquire multi-let industrial assets funded by London city office disposals,
notably they also came off a three month price decline in excess of 20%. Dipula A was just screening as cheap,
with the preferred claim to 5% growth in an environment where sector distribution growth has fallen well
below that number, they offered significant relative value.

The worst performing stocks were Delta (-61.1%), Rebosis (-33.5%) and Fortress B (-20.4%). Delta cut guidance
further (from -15% to -24%) in a pre-close call and have shown little traction in extending their lease duration
with government. Rebosis disposed of a few assets, which should have been positive, but are far from hitting
the guided disposal quantum the market is looking for; their relatively high exposure to Edcon was also a
detractor from performance. And finally Fortress B released disappointing earnings, missing guidance, and
reflecting a significant capitalized interest line causing concern to many investors.

CHART 02

Q1:2019 STOCK/SECTOR TOTAL RETURN DISTRIBUTION (%)

                                                                                                                                                                                                                                18%
                                                                                                                                                                                                                          16%
                                                                                                                                                                                                            12% 12% 13%
                                                                                                                                                                                                    10% 11%
                                                                                                                                                                    7%   8%   8%   8%   8%   9% 10%
                                                                                                                                                4%   4%   5%   5%
                                                                                                                                 3%   3%   3%
                                                                                                   0%   1%   1%   1%   2%   2%
                                                                               0%   0%   0%   0%

                                                                 -2% -2% -1%
                                                   -5% -5% -4%
                                             -7%
                                   -9% -9%
                            -12%
                     -17%
              -20%

       -33%

-61%

         Local Exposure                                  Pure Offshore Exposure
6    Sesfikile Capital

    THREE E’S REVIEWED

    At the start of the year we identified 3 key events (which we coined the 3 E’s) namely Edcon, Elections and
    Eskom, which had the potential to derail an expected return, which premised on starting valuations and some
    marginal growth, was quite reasonable at around 12% for the calendar year. So far, the market has answered
    some of our questions, put some on hold and presented several more:

    Edcon was largely ‘put to bed’ (for the time being at least) as they reached a refinancing deal with their banks,
    landlords and the Public Investment Corporation (PIC). As part of its restructuring with landlords, Edcon had
    provided two options (or variations thereof). In the first option, landlords could accept a 41% rental reduction
    across all Edcon revenue (excluding CNA, which is presumably being sold) for a two-year period in return
    for an equity stake. The second option allowed landlords to continue receiving the same rental but subscribe
    for equity in Edcon. As REITs do not retain any earnings, this subscription will essentially be funded from
    borrowings.

    Thus far, it appears most companies are choosing to subscribe for equity, which will limit the impact to the
    bottom-line distribution. The rationale for choosing option 2 is to protect current income streams and limit the
    contagion effect, where other retailers too would request lower rentals.

    REITs have been proactive in reducing exposure to Edcon, with about 20 – 40% of Edcon space expected to
    be returned. This will come at a cost as landlords must reconfigure and re-let the space in a weak demand
    environment, albeit at rentals that are likely to be above previous levels.

    The outcome of the Edcon restructure was better than initially expected. However, the impact on competing
    retailer rentals and the reletting risk on vacant space are potential short-term consequences. The longer-
    term impact is still to be determined, lower rentals doesn’t help the top line. The department store format is
    struggling globally with South Africa not being an exception. The reprieve they have got gives them some
    breathing space to try reinvent themselves and gain top line momentum. The reprieve also gives landlords
    time to continue minimizing their reliance on the largest apparel retailer in the country and reposition their
    offering, perhaps before they are forced to. Ultimately Edcon has to turnaround its business in a stagnant
    economy otherwise this is little more than kicking the can down the road for a couple of years.

    Eskom proved substantially harder to navigate. The initial concern centred around their ability to access
    the necessary funding without a blanket bailout from the sovereign; which was somewhat answered in the
    medium-term-budget with a broadly outlined plan to split the parastatal in three and partially fund their
    remaining requirements.

    However, this interim data point’s ability to quell the market was short-lived and overshadowed by the sudden
    introduction of severe rolling black-outs. The impact of these is far reaching with the obvious culmination
    stagnating any economic growth we were expecting. Property specific it increases operating costs as the

                                                        Nimble Wisdom SA Quarterly Q1 2019 7

need for alternate supplementing power solutions are needed; while the loss of productivity, especially across
retail, although not yet quantifiable, is significant. This has led to a serious dent to sentiment and confidence in
the ability to effectively operate within South Africa and ultimately puts a cap on investment into South Africa
and the commitment to longer leases and the take-up of additional space.

The road to Elections has been somewhat tame in relation to expectations. We have seen some hesitation
in the broader economy to commit to investment prior to elections, taking a wait and see approach; but
nothing more than we anticipated. What is becoming more apparent is that the struggle for power will happen
after the 8th of May as President Ramaphosa vies for a stronger mandate to implement reforms. A stronger
performance by the ANC may make this easier for him to achieve, however there is still likely to be opposition
from within the party.

                                                                           Bloemfontein City, Free State, South Africa:
                                                                 Part of Bloemfontein City from Naval Hill showing the
                                                                         railway section and electricity plant at sunset.
8    Sesfikile Capital

    PROPERTY MARKET UPDATE

    SOUTH AFRICA
    Property fundamentals remained stable this quarter and continue to be characterised by soft demand and
    excess supply across all sectors. Economic indicators suggest that there has been a deterioration in tenant
    confidence during the period, emanating from load shedding, weaker economic growth from primary trading
    partners (China, EU), prolonged labour strikes in certain sectors of the economy, more revelations about the
    extent of state capture and corruption in South Africa, the continued conflicting pronouncements on policies
    and priorities due to the contestation within the ANC and the demands of the upcoming election.

    Encouragingly, the supply side is improving, hence slowing down as demand is clearly not there to support it.
    The extension to Fourways Mall is the only major retail scheme in South Africa, but space returned by Edcon
    may see an uptick in retail vacancies. Industrial developments are being developed predominately on tenant
    demand, and the level of new office development activity has slowed to 2.3% of the existing stock in the
    market of which 53% is pre-let.

    Results reported by SA REITs this quarter show a marginal deterioration in occupancy rates, but deep
    discounting of rentals and increasing incentives offered by landlords continues. For example, Growthpoint has
    extended its SmartMove incentive programme to a larger number of properties. According to this programme,
    tenants qualify for a year of gross rentals back in allowances on a 5-year lease, and 60% back on a 3-year
    lease. And while it appears to compromise cash flow in the short term, we see it as prudent and as in this
    market it is better to have a low paying tenant as opposed to a vacancy waiting for a better paying one.

    Property valuations have been flat in the past quarter as a slight increase in capitalisation rates have been
    offset by rental growth. However, several REITs are finding it challenging to dispose of assets in the current
    environment and many disposals have been concluded at discounts to book value. Conventional wisdom
    would say that we should expect valuations to reflect the poor trading conditions and we are likely to see
    cap rates move out further and with that valuations should fall. Consequently, loan-to-value (LTV) ratios are
    expected to come under pressure as valuations adjust to market realities.

    As at the time of compiling this note there was little in the way of new official trading data however, in its
    latest quarterly survey (Q4 ’18), SAPOA revealed a continued sideways trend in office vacancies which are
    currently 11.1%, however this was at the expense of rental levels and incentives as mentioned above. Meanwhile,
    retail trading densities for the quarter showed a mild recovery to 2.5%. Although without the official data
    releases we did see several national retailers release results, which were mostly concerning and indicative of
    an embattled consumer and unfortunately the impact of Eskom’s woes in recent months is likely to put further
    pressure on this number.

                                                         Nimble Wisdom SA Quarterly Q1 2019 9

UNITED KINGDOM
The UK stocks apparently didn’t get the memo in that prices rallied, despite the uncertain backdrop we
highlighted last quarter. Note that our exposure through the JSE is predominantly retail so we highlight: online
sales still cannibalising bricks and mortar spend (as they quickly approach 20% of retail sales) and the overall
concerns surrounding the impending Brexit that are also giving the consumer a reason not to part with their
hard-earned money. With all of this said, we see a stark contrast in sentiment against the economic data that
is coming out of the press. Real GDP is still at an acceptable at 1.3% for the fourth quarter of 2018, with 2019
concensus at 1.5%; unemployment is reasonably low at 3.9% and retail sales were 4.1% and 4.0% higher year
on year for the months of January and February respectively.

A lot of the pain is valuation driven as can be seen through the cap rate expansion (Net Asset Value decline)
and the resultant impact it has on gearing ratios. The lack of transactional evidence has veiled the true decline
in asset values, and only now are valuers starting to reflect a more aggressive / realistic stance on asset
pricing. In addition, rental levels are also under pressure as retailers are pointing to weaker trading densities in
their physical stores, although they are obviously not giving the landlords any credit for the stronger growth
across their online sales. One can argue that both a physical and online presence is essential for an optimal
retail presence and that even at current rental levels, physical margins are still more attractive; however, one
cannot ignore the level of CVA’s and sheer reduction in demand from significant legacy retailers such as House
of Fraser, Debenhams and Arcadia. At the start of the year we were waiting in anticipation, (like we waited for
Edcon in South Africa), as to the measures Debenhams would take in order to continue as a going concern.
While Debenhams has taken measures to refinance and cut space and may dodge the CVA process for now;
Arcadia, another major retailer boasting their flagship brand ‘Top Shop’ has also stepped into the limelight
as a potential CVA candidate. The barrage of potential space coming back to market feels relentless, and
while retail volumes have not totally collapsed, the shift in trading patterns have focused on several retailer’s
inability to adapt and the backlash thereof.

We feel that the market is pricing most of the pain in, however several stocks are holding above fair value
premised on the potential for corporate action. Despite the slowdown in transactional activity, there is still
substantial depth in the liquidity from both local and global sources and we wouldn’t be surprised to see
several of the stocks targeted for corporate activity.
10    Sesfikile Capital

     CENTRAL AND EASTERN EUROPE (CEE)
     CEE stands in stark contrast to what we are seeing in the frustration surrounding the South African and UK
     markets. There has been EUR 13.7bn in total investment in the CEE region in 2018 with SA investors accounting
     for 15 – 25% of volumes. There has been increasing interest from Asian investors recently.

     The vast majority of our exposure is through Poland and Romania where GDP is still strong (albeit slowing off
     the recent peaks), which is driving a relatively unencumbered consumer. The office markets are buoyant and
     are still priced at significant discounts to their Western European comparables. Polish office trades at a spread
     of c.400bps. With recognition of Poland as a developed market, expectations are that capital inflows into the
     country could result in further yield compression.

     The region still has potential to grow as labour forces are well educated and materially more productive than
     their Western European counterparts when considering the hourly rate paid. These countries still exhibit some
     ‘emerging market tendencies’, even though Poland is actually now classified as a developed economy. There
     are three main risk factors considered when evaluating the country of investment: liquidity, rule of law and
     predictability of taxes. While Poland has sufficient liquidity, there are concerns around the independence of
     the courts and the changing tax system. We are always mindful of the Polish governing party’s interference in
     the judiciary and Romania’s recent knee jerk reaction to their fiscal shortfall with their introduction of a ‘Greed
     Tax’. But the physical property market is priced for this and potentially more.

     SPAIN
     This is not a material exposure across the index and really only available through Vukile’s holding of Castellana;
     however, Vukile is our biggest overweight and with our recent visit and review of their investment we believe
     a brief comment is necessary.

     Spain is a market we have been looking into for several years through the Sesfikile BCI Global Property
     Fund and have witnessed strong capital growth (off a low base set in 2008) as economic activity picked up,
     however rental growth lagged. We are now in an environment that cap rates are more likely to push higher
     than compress, however we feel that the market still has scope to grow rentals in order to support capital
     values.

     Vukile has assembled a seasoned team in Castellana, who has started to display evidence of driving active
     asset management and not just sitting back to collect the yield differential. Our first trip to see Castellana was
     the ‘beauty parade’ where we saw what they acquired, the second trip was the ‘talent show’, where we saw if
     there was any substance to their initial plans.

                                                     Nimble Wisdom SA Quarterly Q1 2019 11

Their initial portfolio acquisition, dubbed ‘Project West’ has seen a ¤733 774 Net Operating Income boost
in just 14 months through a series of developments, reconfigurations and lowering vacancies. Admittedly €5
million of capex was spent at a yield of 9.9% at Kinepolis (now branded Granaita), which leaves just over 3%
additional income over escalations on the balance of the portfolio. In additional later transaction (‘Project
London’) saw the acquisition of Alameda shopping centre, which saw a 6% increase in Net Operating Income
in just 10 months from reducing vacancies. Castellana subsequently acquired four more (established) centres
from Unibail Rodamco Westfield, potentially the leading shopping centre owner/manager in the world. The
market was hesitant and questioned both pricing and ability to add value that previous management wasn’t
able to deliver, however on recent evidence and some ‘quick fixes’ we have witnessed already to the portfolio,
we would give management the benefit of the doubt.

KINEPOLIS/GRANAITA (MARCH 2018 : MARCH 2019)

  BEFORE                                                  AFTER

                                    REBRAND AND TOUCHUP EXTERIOR

  BEFORE                                                  AFTER

                                    REFURB AND RE-TENANT INTERIOR

  BEFORE                                                  AFTER

                    CREATE CHILD-FRIENDLY PLAYGROUND IN OVERSIZED CAR PARK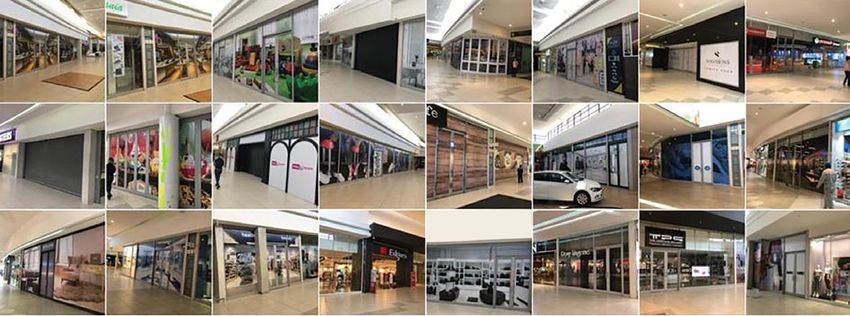
12    Sesfikile Capital

     ECONOMICS

     South Africa’s economy expanded 1.4% in the fourth quarter of 2018 after a revised 2.6% expansion in the
     third quarter. On an annual basis, South Africa’s economy grew by 0.8% compared to a revised 1.4% expansion
     in 2017. The Reserve Bank cut its forecasts for growth in GDP to 1.3% from 1.7% as rolling blackouts dampen
     prospects of a recovery, and sees growth in household expenditure slowing to just 1% in 2019.

     The Monetary Policy Committee’s unanimous decision to maintain the repurchase rate at 6.75% was in line
     with expectations. The bank’s quarterly projection model implies one increase of 25bps by the end of the year.
     Moody’s decided not to update its sovereign debt rating for South Africa. The uncertainty around Eskom’s
     funding requirements and operational ability is the main reason for the delay from Moody’s. The delay has
     been hailed as another chance for the country to improve on its policy reforms.

     Load shedding in February, prolonged labour strikes in certain sectors, slowing growth in trading partners
     (i.e. the EU, China and the rest of Africa), more revelations about the extent of state capture and corruption,
     the continued conflicting pronouncements on policies and priorities due to the contestation within the ANC,
     demands of the upcoming election, as well as the adverse impact of the “expropriation without compensation”
     impacted confidence.

     Formal non-agricultural employment was 1.6% higher in the fourth quarter of 2018, with private sector
     employment growth a touch stronger at 1.9%. The data was significantly influenced by Stats SA’s annual
     update of its sample.

     Consumer confidence relapsed after the excessive early-2018 exuberance, though households remain on
     balance optimistic that economic conditions will improve in the coming year. They are also optimistic about
     an improvement in their personal financial positions. The last survey was released in December 2018, prior to
     the recent bouts in load shedding, which will undoubtedly have an impact on consumer confidence.

     SA bonds were stronger through the quarter with the 10y bond falling 16bps to 9.0%. However, the long bond
     peaked at 9.3% in February on the back of South Africa’s Finance Minister Mr Mboweni’s hard hitting budget
     statement, which showed a deterioration in the fiscal position of the country. The debt to GDP ratio is now
     expected to increase to 56.2% (previously 55.3%) in 2019/2020. Bonds recovered to the end of March as
     Moody’s did not downgrade South Africa’s outlook or credit rating.

                                                     Nimble Wisdom SA Quarterly Q1 2019 13

CHART 03

DEBT TO GDP RATIO

UK 10y Gilt yields were pushed down to 1% by quarter end as Brexit uncertainty has led to a flight to safer
assets. The biggest impact of the vote to leave the EU has been on the pound, which remains 12% and 11%
weaker against the US dollar and the euro, respectively. As a result, UK inflation has increased which reduced
household spending but there has been no notable boost to trade.

The British economy staged an unexpected fightback in January as manufacturing and retail sales growth
recovered from a weaker end to last year, despite mounting uncertainty over Brexit. Monthly GDP growth
jumped to 0.5% in January, the biggest rise since December 2016, reversing a drop of 0.4% in the final month
of last year. Consumer spending growth helped the services sector, which accounts for about 80% of the
economy. to grow by 0.3% in January after a fall of 0.2% in December

Poland bond yields were largely unchanged during the quarter. Concerns that the recently announced
spending hikes will cause Poland’s general government deficit to overshoot 3% of GDP next year, the threshold
required of European Union members, has had little, if any, impact on bond yields. As Poland is now classified
as a developed market, we expect yields to edge lower toward Western Europe barring any major risk events.

Romania has been tracking a more emerging market course and strengthened marginally over the quarter.
Panic since the “greed tax” was announced has abated.
14    Sesfikile Capital

     Globally, bond yields have edged lower this quarter driven mainly by a more accommodative monetary policy
     stance by central bankers around the world. Post the shock in December, commentary by policy makers
     turned from tightening to accommodative showing that central bankers were ready to provide assistance
     to the markets when necessary. The US Fed is now expected to keep rates unchanged for 2019, the ECB
     promised to keep rates low, China is conducting both monetary and fiscal easing and the RBA is expected to
     cut rates. The recent rally in stocks comes in light of slowing corporate earnings, an inversion of the US yield
     curve and negative German bond yields which suggest more caution is warranted going forward.

     CHART 04

     LONG AND SHORT TERM TREND IN BOND YIELDS

                                                           SHORT TERM

 Nimble Wisdom SA Quarterly Q1 2019 15

                            Big Stan is a 20 410sqm warehouse
(based in Stoke-on-Trent, UK) owned by Equites Property Fund.
       Amazon is the tenant off a ten year lease signed in 2016.
16    Sesfikile Capital

     RECENT RESULTS

     Management across the board has not been shy in detailing how weak the fundamental operating environment
     has been. And while we believe them in this regard, they are not being quite so open as to the non-recurring
     items that are also currently being unwound from the earnings base. Both factors have resulted in probably
     one of the poorest set or results in recent memory.

     On a distribution level (excluding the UK) half the results were in line with expectations while the other half
     missed forecasts, highlighting the rapid pace of deterioration in market conditions and the high forecast risk
     at present. Guidance given by management was also, on average, below consensus estimates as illustrated
     below:

     Company                         Reporting        Initial DPS growth      DPS growth            Guidance
                                      period               guidance            reported             for FY19

     Emira                              H1 ‘19          Improvement on                    3.1%                 3.1%
                                                        2.5% achieved in
                                                                   FY18

     SA Corporate                       FY ‘18                     -5.5%                -6.0%                0.0%

     EPP                                FY ‘18               6.7% - 8.6%                 6.7%        Not provided

     Hyprop                             H1 ‘19                   5% - 7%                 2.5%                 2.0%

     NEPI Rockcastle                    FY ‘18                     10.0%                 9.5%                 6.0%

     MAS                                H1 ‘19                       15%                 5.5%                15.0%

     Growthpoint                        H1 ‘19                      4.5%                 4.5%                 4.5%

     Liberty 2 Degrees                  FY ‘18                       1.3%                 1.3%       0.0% to 2.0%

     Resilient                          H1 ‘19             -1.0% to -2.7%               -2.2%       1.4% and 5.2%

     Fortress B                         H1 ‘19             2.2% to -2.2%               -14.0%        -9% to -13.4%

     Intu                               FY ‘18             Not provided                 -67.1%       Not provided

     Hammerson                          FY ‘18             Not provided                  1.6%        Not provided

     Fairvest                           H1 ‘19                  8 to 10%                 8.3%             8 to 10%

                                                      Nimble Wisdom SA Quarterly Q1 2019 17

Emira       • Emira increased in interim DPS by 3.1% y/y to 72.86c and reported a 1.4% increase in NAV to
H1 ‘19         1 783c.
            • The portfolio performance was strong with like-for-like growth in NPI of 3.8%.
            • Emira’s balance position weakened with the LTV rising to 41%. However, Emira expects the LTV
               to normalise to 37% following the disposal of the office portfolio which was transferred after the
               reporting date.
            • Cross currency swaps on the GOZ and US investment are high at about 98% of the market value.
            • To date, Emira has acquired 6 retail convenience centres in the US at cash-on-cash yields of
               c.11%. The company plans to deploy a further USD 60m over the next 18 months.
            • For the full year, guidance is for c.3.1% growth in distributions.

Resilient   • Resilient declared a DPS of 263.6c for the 6 months to 31 December 2018.
H1 ‘19
            • The number is not comparable to the prior period due to the unbundling of Fortress B shares
               and only including interest income on Siyakha loans covered by the distribution.
            • NAV per share declined by 3.4% over the six-month period.
            • Growth in retail sales in the portfolio were well above peers at +4.7%.
            • On average, rentals reverted up by 1.3% on expiring leases and 6.3% on new leases.
            • Through store closures and space rationalisation, Resilient’s exposure to Edcon has fallen to
               6.4% of income.
            • Resilient has one of the strongest balance sheets in the sector with an LTV ratio of just 25.7% -
               this was lower than over the 6-month period due to the return of capital from Lighthouse.
            • Management revised its distribution forecast down to between 530c and 550c, down from
               between 550c and 560c.

Intu        • Intu reported a 4% decline in underlying EPS to 14.4p.
FY ‘18
            • There was no dividend declared for H2 ’19, and hence the dividend per share was 4.6p for the
               full year, down 67%.
            • Net rental income grew by 0.6% on a like-for-like basis. Tenant failures had eroded growth by
               190bps.
            • Lettings were concluded at 7% above previous passing rentals.
            • NAV declined 24% to 312p on the back of a GBP 1.4bn valuation write-down. The overall net
               initial yield increased by 62bps to 4.98% and ERV was down by 3.9%.
            • The total debt-to-assets ratio increased from 45.2% to 53.1%.
            • Management plan to reduce this ratio to below 50% by retaining cash rather than paying
               dividends (GBP 188m) and from disposal and part disposals in the UK and Spain.
18   Sesfikile Capital

     Hammerson       • For FY ’18, Hammerson delivered a 1.6% decline in adjusted EPS to 30.6p. Total dividend per
                         share was up 1.6% to 25.9p.
                     • NRI income grew by 0.3% on a like-for-like basis, hampered by CVA’s and lower occupancy
                         rates.
                     • EPRA NAV fell 4.9% to 738p. Asset values declined by 4.3% with UK flagship destinations and UK
                         retail parks falling 10.6% and 13.2% respectively. Premium outlets were the stand out performer
                         with a 2.4% increase in valuations.
                     • Hammerson concluded lettings at 6% above ERV and 5% above previous passing rent.
                     • Management have put future buy backs on hold.
                     • The company’s LTV is 38% (43% on a proportionately consolidated basis).
                     • The number one priority for Hammerson is to reduce debt. It plans to do so by continuing its
                         disposal programme, where GBP 500m of proceeds are expected. This will include an exit from
                         retail parks and decreasing exposure to France as pricing in Europe remains stronger than the
                         UK.

     Capital &       • EPRA NAV per share decreased by 2.4% to 325p owing to a negative fair value adjustment at
     Counties            Earls Court.
                     • The Earls Court valuation declined by 15.6% due to valuers being more conservative view on
                         gross development value, delivery costs and developers margin.
                     • Valuations at Covent Garden rose by 1.6% on a like-for-like basis. This was driven by ERV growth
                         of 3% while yields were largely unchanged.
                     • The LTV ratio decreased to 18% from 21% on the back of the sale of Empress State Building.
                     • Capco stated that preparations for the demerger are well advanced. Talks with a potential
                         acquirer of Earls Court appear to have stalled.

     Fairvest        • Fairvest increased its interim DPS by 8.3% y/y to 10.6c. This was in line with its guidance of
     H1 ‘19              between 8 and 11%.
                     • NAV advanced by 2.3% to 232c driven by a 5.1% increase in property valuations.
                     • NPI increased by 6.4% on a comparable asset basis. Vacancies were contained at 3.5% of GLA,
                         while reversions of 0.5% were achieved. Excluding large lease renewals, reversions would have
                         been 5.7%.
                     • Management described the current market conditions as the worse over the past 30 years.
                     • Trading densities increased by a sector beating 3.4% over the period.
                     • Fairvest’s LTV ratio is stable at 27.1%.
                     • Management expect distribution growth of between 8 and 10% for the full year.

                                                     Nimble Wisdom SA Quarterly Q1 2019 19

Liberty 2   • For the year end 31 December 2018, Liberty 2 Degrees reported a 1.3% increase in its DPS
Degrees       to 60c.
FY ‘18
            • NAV decreased 3.4% to 945c primarily on the back of the capital restructure.
            • NPI grew by a solid 4.0% on a comparable asset basis. This was owing to a 4.9% increase in
              rentals on expiry in the retail portfolio. For the office assets, rentals declined 5.5%. A reduction
              in vacancies also contributed to growth, declining from 6.0% to 3.4%.
            • Portfolio trading density growth was 2.5%.
            • Liberty 2 Degrees has one of the strongest balance sheets in the sector with an LTV of 16%.
            • Management provided guidance of 0 – 2% growth in FY ’19.

Hyprop      • DPS increased by 2.5% y/y to 385.6c. This was well below guidance of 5 - 7% as management
H1 ‘19        have cut its income from Africa in light of irrecoverably of income.
            • Tangible NAV/share decreased by 3% h/h to R100.6. The decrease was due to an impairment of
              the investment in AttAfrica and Manda Hill.
            • The overall vacancy rate reduced from 1.9% to 1.6% (1H19). Leases were renewed at a reversion
              rate of -2.2% and an average escalation rate of 7.3%.
            • As at 1H19, Edcon represented 9.2% of GLA and 7.6% of rental income in South Africa. Hyprop
              has agreed to support Edcon as part of its restructuring proposal, which may include Hyprop
              subscribing for an equity interest in Edcon. The financial effect of the transaction, should it be
              implemented, will be a reduction in Hyprop’s distributable earnings of 0.8% for FY19, and a
              further 2.3% reduction FY20.
            • The LTV ratio increased from 31.2% to 32.8% (1H19). On a look-through basis, Hyprop’s debt is in
              excess of 40%. While management argues that the Hystead debt has no recourse on the South
              African balance sheet, the level of financial leverage to bottom line earnings is significant.
            • Hyprop expects growth in DPS for the year ending 30 June 2019 of approximately 2%. This is a
              downward revision from the guidance provided in August 2018 of 5% to 7%, the main reasons for
              which are the decrease in distributable earnings from operations in sub-Saharan Africa (other
              than SA), the anticipated impact of the Edcon restructuring and the current difficult economic
              conditions in South Africa.
20 Sesfkile Capital
Fortress • The dividend for the A share increased from 71.20c to 74.73c. The B share dividend decreased
H1 ‘19 by 14% y/y to 77.49c owing to the limitation in the interest accrued on the Siyakha Trusts loans.
Nonetheless, the DPS was a significant miss on guidance.
• Income from the Edcon group represents 2.3% of total portfolio contractual rental income.
Management aims to reduce this exposure to approximately 1.1% in the next 12 months.
• Fortress supported Edcon in its restructure and recapitalisation programme by agreeing to
reduce the rental and receive equity in lieu of such reduction over a two-year rent period.
Fortress will include only the cash component of the rental received from Edcon in its future
distributions.
• Vacancies across the portfolio remained stable with the only notable decrease in vacancies
being in the industrial sector which reduced from 8.1% to 7.1% over the 6-month period. Office
vacancies remain high at 23.2%.
• Fortress disposed of 9 assets during the period for a total value of R493mn (8.7% yield, 10%
premium to book value.
• The LTV ratio increased marginally to 32.3% from 31.8% as a result of the return of capital by
Lighthouse Capital.
• Assuming distribution growth of 5% on the Fortress A share, Fortress expects distributions on
the Fortress B share of between 155c and 163c for FY19. The was previously between 175c and
183c.
NEPI • NEPI Rockcastle’s DPS grew by 9.5% y/y in FY ‘18.
Rockcastle
• NAV per share was flat at EUR 7.09. The retail portfolio fair value adjustments contributed to
FY ‘18
+3% to NAV growth, while the disposal of the listed portfolio detracted 3.6% of NAV/share
growth.
• The core portfolio has performed with well with like-for-like growth in NPI of 4.9%.
• Tenants’ sales also increased by 5.7% on a comparable basis.
• The portfolio vacancy rate remained low at 2.8% with a healthy portfolio collection rate of 99.9%
(gross rentals & service charges).
• The listed portfolio consists of two shares: Unibail-Rodamco-Westfield and Klépierre.
• NEPI Rockcastle has a EUR 800m development pipeline of which EUR 200m has been
committed. Yields are estimated at c.8%.
• No update was provided with regards to the size of the acquisition pipeline and no acquisitions
have been included in management’s forecast.
• The LTV ratio increased noticeably from 28% to 33% (FY18)
• Management is guiding towards +6% DPS growth for FY19
EPP’s landmark development in Warsaw
Source: Artist’s impression
Nimble Wisdom SA Quarterly Q1 2019 21
Growthpoint • Growthpoint delivered 4.5% y/y growth in its interim dividend per share, in line with the
H1 ‘19 company’s FY19 DPS growth guidance.
• Tangible NAV/share increased by 0.7% to 2 594c.
• Vacancies have increased across all SA sectors (including the V&A). The overall portfolio’s
vacancies (including GOZ) have risen from 4.7% to 5.6%.
• Growthpoint have opted to provide Edcon with an equity injection of R110mn as opposed
to taking the rental reduction. The equity stake will be debt-funded. Growthpoint has also
decreased its exposure to Edcon by c. 9 000sqm since December 2017. This is expected to
decrease further by at least 18 000sqm over the next two years.
• Once-off earnings included in distributable earnings are due to property sales made during the
period.
• The decreased withholding tax, together with the additional investment made in GOZ, had a
positive impact on the distribution received.
• The LTV ratio rose marginally from 35.4% to 35.9%.
• Like-for-like net property income growth was weak at 1.1% for SA, 3.2% for V&A Waterfront and
1.8% for GOZ.
• Part of Growthpoint’s strategy is to grow a R15bn fund management business over the next
three-to five-years. Growthpoint Investec Africa Properties Fund (GIAP) and Growthpoint
Healthcare Properties Holdings Fund have already been established.
• GIAP, a joint venture with Investec Asset Management, has raised $212mn from third-party
investors which is expected to be fully invested in assets on the continent by FY19.
• The Healthcare Fund already owns five healthcare assets valued at R2.6bn, consisting of
four hospitals and one medical chambers. The fund has attracted approximately R700mn in
investments from third-party investors thus far.
• Management has maintained its full year guidance for c.4.5% growth.
EPP • EPP’s dividend per share came in at the lower-end of guidance at 6.7% y/y
FY ‘18
• NAV per share decreased by 1.5% to EUR1.35 over the six-month period, but increased by 2.4%
over a 12-month period.
• The operational performance was strong with NPI growth of 4.2% on a like-for-like basis for its
retail portfolio, whilst the office portfolio was flat.
• Tenants’ sales growth was 1% y/y which outperformed the national average at -0.8% for 2018
• The LTV ratio increased from 47% to 52% (FY18), with the weighted average cost of debt rising
from 2.14% (FY17) to 2.33% (FY18). Management plan to reduce its borrowings through the
disposal of its office portfolio and potentially stakes in some retail assets.
• Management have stated that DPS growth would still be flat to marginally positive, even post
the reduction in its gearing levels.22 Sesfkile Capital
EPP’s landmark development in Warsaw
Black Friday at Middestad Mall, Fairvest’s 19 840sqm shopping centre
Situated in the Bloemfontein
Source: Artist’s impression CBD.
Nimble Wisdom SA Quarterly Q1 2019 23
Attacq • Attacq reported an interim DPS of 40.5c. There is no comparative dividend
H1 ‘19
• NAV per share decreased by 2.4% to 2 366c.
• Trading density growth in the retail portfolio of 6.9% was impressive. This was primarily achieved
at Mall of Africa (+12.7%) and Garden Route Mall (+4.8%).
• Developments measuring 57 431sqm are currently being undertaken. This includes the Deloitte
Head Office and The Ingress (PSG Wealth). Approximately 73% of developments are pre-let.
• Attacq’s effective Edcon Limited (Edcon) exposure will settle 3.0% of GLA.
• Attacq is participating in Edcon’s announced recapitalisation programme. The impact of the
recapitalisation programme on Attacq’s property valuations has been incorporated by reducing
the gross rental income for the 24 months commencing 1 April 2019. On implementation, the
impact on the distributable earnings for the 2019 financial year will be a R4.2m reduction.
• Gearing increased from 33.5% to 36.3% (1H19). The increase of the gearing ratio is largely as a
result of paying out a full year dividend in October 2018 and impairments to the investments in
Africa.
• One of management’s primary goals in the next 12 months is to improve its interest coverage
ratio through asset disposals.
• Attacq expects its total dividend per share for the full year ending 30 June 2019 to be between
79.6c and 81.0c which would result in growth of between 7.5% and 9.5% y/y. This is in line with
the guidance provided in September 2018.
SA • DPS decreased by 6.0% y/y to 42.22c. Management has cut its guidance through the year, and
Corporate in December 2018, suggested growth would be c.-5%.
FY ‘18
• NAV per share decreased by 1.2% to 508c.
• NPI increased by 1.0% on a like-for-like basis.
• Retail NPI growth of 6.8% (excluding the impact of disposals) was underpinned by strong
tenant retentions of 87.1%, and weighted average lease escalations of 7.6%. The retail like-for-like
(excluding developments) portfolio grew by 2.9%.
• Industrial NPI remained flat with the commissioning of a large logistics development. The like-
for-like portfolio NPI retracted by 2.7% resulting from negative reversions in respect of logistics
leases with long tenors and 33% increase in ground lease rentals at the Maydon Warf leasehold
properties.
• Afhco NPI grew by 25.4% due mainly through acquisitions. On a comparable asset basis, NPI
grew by 5.9%, mainly due to a 1.0% reduction in annual average vacancies and average residential
increases of 4% on the back of rental rebasing.
• The income from the investment in the Zambian joint venture increased by 4.6% with an overall
annual average vacancy reduction of 3.2%.
• LTV ratio increased from to 34.6%.
• Management provided DPS growth guidance of flat growth for FY19.NOTABLE COMPANY NEWS
Accelerate • Accelerate Property Fund issued a pre-closed update, wherein it downgraded its earnings
guidance to -8 to -11%.
• Management attribute this to worse than expected operating conditions, which seems odd
given that its previous guidance of c.-5% was provided just 5 months ago.
• The Fourways Mall extension has been delayed to August 2019.
• The equalisation payment has been estimated at R1bn which will be funded by a combination of
debt, the cancellation of a development loan, and disposals.
Delta • Delta issued a trading statement. Distributable income is expected to be down between 19
and 24%.
• In its pre-closed call, management also alluded to potentially reducing its dividend pay-out ratio
to retain cash for capital expenditure purposes.
• The company also updated the market on the status of lease renewals. To date, about 13% of the
bulk lease renewal package has been renewed.
Stor-age • Stor-age raised R585m through an accelerated bookbuild.
• Proceeds are to be used to fund the company’s expansion into UK.
• Earlier in March, Stor-age announced the acquisition of a storage business in the UK for R224m.
Equites • Equities concluded an accelerated bookbuild in February, where it raised R710m.
• The company plans to use the proceeds to fund its on-going development pipeline in SA
and UK.
• Post the capital raise and execution of capital investment, the company’s LTV is estimated
to settle at 32%.
Vukile • Vukile raised R700m, or 1.75x the initial planned amount, through an accelerate bookbuild.
• Proceeds of the capital raise are to be deployed to fund asset management opportunities in the
company’s Spanish subsidiary Castellana Properties.
RETAIL UNDER STRAIN...
Source: Sesfikile site visit of Forrest Hill
Nimble Wisdom SA Quarterly Q1 2019 25
MARKET OUTLOOK
Results season disappointed once again, reinforcing our recent calls that distributions must rebase off current
unsustainable levels. The forward yield of the sector compressed from 9.4% to 8.8%, partly due to growth in
the sector, but mainly as a result of earnings guidance being missed and cut across an array of counters with
Intu being the most prominent, cutting their entire distribution. And while we have started to see a material
rebasing across a lot of the sector, we believe that there is still more to come. We still see several once-off
earnings in the base as well as relatively aggressive funding structures that need to unwind.
In addition, the sector rating is also on the back foot as a result on normalised growth levels being hampered
by a weak operating climate in both South Africa and the UK. Operationally things haven’t been tougher
in recent memory, with tenant demand scarce as corporate South Africa is struggling with the reality of a
marginal GDP growth and the frustration of rolling power outages. The stand out region operationally, has
been Central and Eastern Europe, where GDP is still supporting healthy economic activity and demand for
space, these stocks are however pricing in the relative strength of the underlying businesses.
CHART 05
RATIO OF PROPERTY YIELDS VERSUS LONG BONDS
In general valuations are looking attractive, but yields are sitting cautiously high looking ahead to uncertainty
surrounding elections as well as the true impact of the recent Eskom fallout. We do see value, but value
accompanying volatility. Our updated graph reflecting the ratio of property yields versus that of the long
bond is telling us that the sector is cheaper then it has been on a relative basis over the last ten years. It also
however shows us that expected distribution growth is at the lowest it has been over the same time period.
We feel that valuations have even outshot the bearish growth outlook and have the potential to deliver circa
10% over the next 12 months, however there is still event risk lying in the upcoming elections as well as Brexit,
which is not necessarily priced into the numbers.26 Sesfikile Capital
OUR TEAM
Evan Jankelowitz, CFA® Mohamed Kalla, CFA® Kundayi Munzara, CFA®
Portfolio Manager and Analyst Portfolio Manager and Analyst Portfolio Manager and Analyst
BCom (Hons). Investment BCom. Investment Management Bsc. (Hons) Property Studies (UCT),
Management (UJ), Chartered (UP) Chartered Financial Analyst UK FSA, Chartered Financial Analyst
Financial Analyst 13 years experience 12 years experience
14 years experience
Naeen Tilly, CFA® Anil Ramjee
Head of Research Global REIT Analyst
BAcc (WITS), CA(SA), Masters Property Studies (UCT),
Chartered Financial Analyst BEconSci, MCom EconSci (Wits)
11 years experience 7 years experience
Nalika Pema Tinswalo Hlebela Nolwazi Maphalala
Operations Manager Performance Analyst Team PA | Office Manager
BCom. Finance and BSc. Mathematical Dip. Public Relations
Economics (UKZN) Sciences (Wits) Management (TUT)
12 years experience 11 years experience 3 years experienceThe information contained in this report is confidential and may be subject to legal privilege. Access to this information by anyone other than the intended recipient is unauthorized. This report is in its entirety specifically intended for use by institutional clients and is not intended for use and should accordingly not be relied upon by private individuals whether clients or otherwise. If you are not the intended recipient, you may not use, copy, disseminate, distribute and/or disclose the report or any part of its contents or take any action in reliance on it. If you have received this report in error, please notify us immediately by e-mail or telephone on (+27-11) 684 2677 and thereafter immediately destroy and/or delete the report. Sesfikile Capital (“Sesfikile”) makes no representations and gives no warranties of whatever nature in respect of the report and its contents including but not limited to the accuracy or completeness of any information, facts and/or opinions contained therein. The report is provided by Sesfikile solely for the recipient’s information, and all rights in and to the report including copyright and other intellectual property rights therein are proprietary to Sesfikile. Accordingly, the report may not be reproduced, distributed in any form and/or disseminated without the prior written consent of Sesfikile Capital.
You can also read