HDFC Life Insurance Investor Presentation - 12M FY20
←
→
Page content transcription
If your browser does not render page correctly, please read the page content below

HDFC Life Insurance
  Investor Presentation – 12M FY20

Agenda

         1   Performance Snapshot

         2   Our Strategy

         3   Managing Covid-19

         4   Customer Insights

         5   Annexures

         6   India Life Insurance

Page 2
Performance
    Snapshot

   Our Strategy

Managing Covid-19

 Customer Insights

    Annexures

India Life Insurance
                       1   Performance
                           Snapshot
Executive summary: FY20

                   Scale                                                           Profitability                           Customer centricity

                           Rs (Bn.) 74.1                                          New                 CY     25.9%                                 CY     88%
             Company                                                                                                              13th month
                                                                                  Business
             APE            Growth     18%                                                            PY     24.6%                persistency1     PY     84%
                                                                                  Margin

                            CY (%)     21.5                                                                                                      Rs (Bn.) 47.6
             Overall                                                                                                              NBP
                            PY (%)     20.7                                       IEV              Rs (Bn.) 206.5                                Growth   18%
                            CY (%)     14.2                                       EVOP              Growth   18.1%                               Rs (Bn.) 12.7
             Individual                                                                                                           APE
Mkt. Share                  PY (%)     12.5                                                                          Protection                  Growth   22%

                            Rs (Tn.) 1.3                                                           Rs (Bn.) 13.0                  Claim           FY20    99.1%
                                                                                  Profit After
             AUM                                                                                                                  settlement
                            Growth     1%                                         Tax               Growth   1%                                   FY19    99.0%
                                                                                                                                  ratio2

                              Mn      61.3                                                            CY     13.1%                Complaints      FY20    47
             NB Lives                                                             Operating
                                                                                                                                  per 10k
             Insured        Growth 19%                                            Exp. Ratio          PY     13.1%                                FY19    61
                                                                                                                                  policies

        1. Persistency for Individual business
        2. Computed basis NOPs for Individual Business
  4     The numbers throughout the presentation are based on standalone financial results of the Company
Consistent performance across key metrics (1/2)
    Leadership in new business premium (Rs Bn)                                     CAGR: 28%   Number of lives (Mn)                                                   CAGR: 41%

          15.8%             17.2%              19.1%          20.7%                21.5%

                                                                                                                                                                   61.3
                                                                                                                                               51.4
                                                                                   172.4
                                                               149.7
                                               113.5                                                                                33.2
                            86.2                                                                                     20.9
          64.9                                                                                     15.4

          FY16              FY17               FY18            FY19                 FY20           FY16              FY17           FY18       FY19            FY20
                                           Private Market Share

    Maintaining balanced Product Mix across cycles1                                            Focus on scaling proprietary channels1

          4%                 4%                9%
                                                               17%                 16%             15%                14%           17%
          17%                                                                                                                                   23%                24%
                            22%
                                               26%
                                                               27%                 27%                                34%
          29%                                                                                      42%                              35%         28%                25%
                            32%
                                               24%
           4%
                             3%                                24%                 26%                                20%
          15%                                   3%                                                 14%                                          24%                25%
                                                                                                                                    24%
                            14%                12%             5%
                                                               6%                  14%
          30%               25%                26%                                  6%             30%                32%                       25%                26%
                                                               21%                                                                  24%
                                                                                   11%

          FY16              FY17               FY18            FY19                FY20            FY 16             FY 17          FY 18       FY19               FY20
                                     Savings                      Protection
                                                                                                           Group Savings                    Group Protection

                       UL      Par     Non Par        Group   Term       Annuity                           Corporate Distributors           Proprietary Channels

5      1. As a % Overall NBP
Consistent performance across key metrics (2/2)
Strong growth in VNB, Industry leading VNB margins CAGR: 27%                           Healthy growth in Embedded Value                  CAGR: 19%   Rs Bn.

      19.9%           22.0%           23.2%           24.6%             25.9%          20.7%     21.7%         21.5%           20.1%   18.1%

                                                                                                                                       206.5
                                                                                                                               183.0
                                                                                                               152.2
                                                                                                 124.7
                                                                         19.2          102.3                                           65%
                                                                                                                               68%
                                                        15.4                                                   68%
                                       12.8                                                       67%
                       9.2                                                             68%
       7.4
                                                                                                                               32%     35%
                                                                                       32%        33%          32%

      FY16            FY17             FY18             FY19            FY20           FY16       FY17         FY18            FY19    FY20
                                         VNB Margin                                                      ANW    VIF    EVOP%

Consistent profitable growth (PAT)                                         CAGR: 12%   Steady accretion to AUM                           CAGR: 14%

      28.7%           25.7%            26.0%           24.6%           20.5%            11%       24%          16%             18%      1% 1

                                                                         13.0
                                                        12.8
                                        11.1
                        8.9                                              2.1
        8.2                                              3.8
                                        2.6
                        1.4
       1.4                                                                _
                                                                                                                               1,256   1,272
                                                                         10.9                                  1,066
                                        8.5              9.0                                      917
       6.8              7.5                                                             742

      FY16             FY17            FY18            FY19             FY20           FY16       FY17         FY18            FY19    FY20
              Policyholder Surplus    Shareholder surplus      Return on Equity                                   Growth

      1. FY20 growth in Unit linked fund: -15%, Non linked fund: 17%
6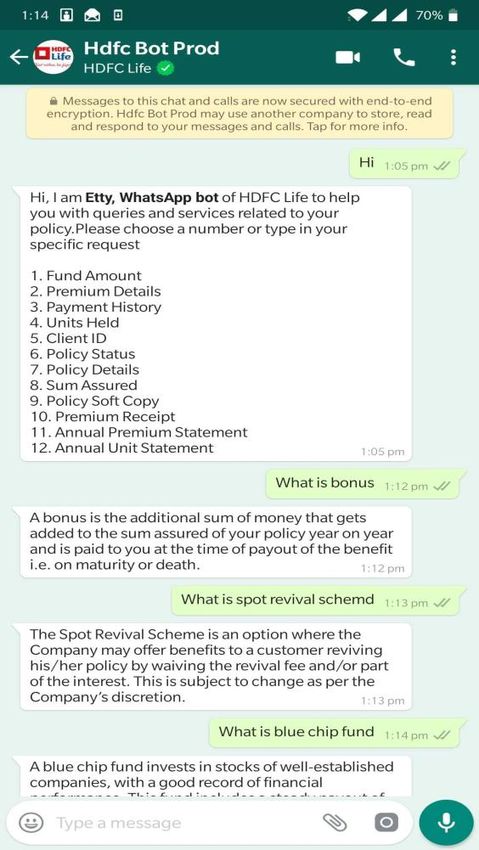
Performance
    Snapshot

   Our Strategy

Managing Covid-19

 Customer Insights

    Annexures

India Life Insurance
                       2   Our Strategy
Key elements of our strategy

         1                       2                       3                    4                       5

Focus on profitable           Balanced            Market-leading         Reimagining           Quality of Board
     growth               distribution mix         innovation             insurance            and management

Ensuring sustainable    Developing multiple     Identifying latent   Market-leading digital   Seasoned leadership
and profitable growth   channels of growth to   customer needs to    capabilities that put    guided by an
by identifying and      drive need-based        create new product   the customer first,      independent and
tapping new profit      selling                 propositions         shaping the insurance    competent Board; No
pools                                                                operating model of       secondees from
                                                                     tomorrow                 group companies

     Our continuous focus on technology and customer-centricity has enabled us to maintain
                       business continuity during the COVID-19 outbreak

 8
Focus on profitable growth

                                                                     FY17                            FY18         FY19                 FY20          Rs Bn.

                                                                                                                                                               Profitable
                                                                                                                                                                growth
             New business Margin                                     22.0%                          23.2%        24.6%                 25.9%
Economic
  Profit

             Value of new business                                    9.2                            12.8         15.4                 19.2

                                                                                                                                                               distribution mix
             Profit after tax (PAT)

                                                                                                                                                                  Balanced
                                                                      8.9                            11.1         12.8                 13.0
Accounting
  Profit

                 Underwriting profits                                 7.5                                8.5       9.0                 10.9

                 Shareholders’ surplus                                1.4                                2.6       3.8                  2.1

                                                                                                                                                              innovation
                                                                                                                                                                leading
                                                                                                                                                                Market
                                                  30.0

                                                  20.0

                                                                                                                                                               Reimagining
                                                                                                                                                                insurance
             Underwriting profits breakup                                                                                              29.9    17%
                                                                                                                  25.5
                                                  10.0                                                   19.1
                                                                     14.6

                                                   0.0

                                                                                                                                                              management
                                                                      -7.1

                                                                                                                                                               Board and
                                                                                                                                                               Quality of
                                                                                                     -10.6
                                                                                                                  -16.5                -19.1
                                                 -10.0

                                                 -20.0
                                                                     FY17                            FY18         FY19                 FY20
                                                                                                                                   1
                                                                                         New Business Strain    Backbook Surplus

                    1. Includes impact of provision for Yes bank AT1 bonds / lower renewal collections
             9
Analysis of change in IEV1
Rs Bn.
EVOP – 33.1
Profitable
EVOP1% - 18.1%
growth
1.5 -1.2
19.2 -10.0
0.4 206.5
13.7
Operating Change in
distribution mix
183.0 Economic ESOP
Balanced
variances Operating
Post over- variances exercises
assum ptions
Unwind run VNB
134.6
124.3
innovation
leading
Market
Adjusted Net worth (ANW) Value of in-force business (VIF)
71.9
58.8
Reimagining
insurance
IEV at 31st IEV at 31st
Mar 19 Mar 20
management
Strengthening assumptions to reflect emerging experience in UL persistency
Board and
Quality of
Operating variances continue to be in line with our assumptions
EVOP includes Covid reserve amounting to Rs 0.4 bn
1. IEV reviewed by Ernst & Young, an independent actuary (Review report appended with Financial disclosures)
10 2. EVOP% calculated as annualised EVOP (Embedded Value Operating Profit) to Opening EVBalanced distribution mix
Increasing share of proprietary channels 1
Strong and diversified network of 230+ traditional partners
Banks NBFCs and MFIs SFBs
Profitable
growth
11% 14% 19% 22%
12% 11%
5% 5% 13%
14%
4%
9%
distribution
Balanced
mix
72% 71% 64%
55%
FY17 FY18 FY19 FY20
innovation
leading
Market
Bancassurance Brokers and others Agency Direct 2
Developing alternative channels of distribution: 40+ partnerships
Consistent growth in proprietary channels 2
(Rs Bn.) in emerging eco-systems
Reimagining
insurance
CAGR: 49% CAGR: 25%
Health Ecommerce Auto Telecom Mutual Fund Fintech
FY20 13.5 FY20 8.8
FY19 10.2 FY19 6.7
management
Board and
Quality of
FY18 6.8 FY18 5.3
FY17 4.1 FY17 4.5
Direct Agency
1. Basis Individual APE
11 2. Direct includes Online channelUpdate on channel performance
Agency HDFC Bank
Profitable
growth
32% - Increase in agent productivity driven by greater 49% - Share of digital new business with YoY growth of 23%
engagement and ease of doing business
11% - Share of new business getting achieved through alternate
distribution
91% - Robust 13th month persistency due to sustained focus on (non-branch) channels
Balanced
quality of business
mix
Market share - Maintained market share in open architecture
32% - Business growth with 12% Term share environment
32% - Increase in recruitment of high productivity agent profiles Profitable growth – Focus on increasing Term share
(Financial Distributors, Homemakers, Retirees)
innovation
leading
Market
Online Brokers
Reimagining
insurance
76% - Contribution of Online channel from non-metros 164% - YoY growth in topline with focus on quality partners
indicating increasing geographical presence
Growing contribution from F2F partners – 83% in FY20 vis-a-
Building reach - Experimentation and scale up of new vis 43% in FY19
advertisement platforms
1200 bps - Improvement in 13th month persistency
Single journey – Launched for Term + Savings combination product
management
Board and
Increasing share in top partners – 36% in FY20 vis-a-vis 7% in
Quality of
for online partners
FY19 for the top 3 partners
ML capability – Used successfully for Term and now extended to
other product categories to increase leads and reduce cost per lead
12 1. PASA – Pre- Approved Sum Assured; F2F – Face to Face, FLS – Front Line SalesAddressing customer needs at every stage of life
20 – 30 years 30 – 40 years 40 – 50 years 50+ years
Profitable
Objective Simple Savings Borrowing Investments Asset Drawdown
growth
Pay off Risks
mortgage Addressed
distribution
Balanced
Medical care Mortality
mix
First Job Medical care
Net Worth Morbidity
Needs
innovation
Get married Plan for
leading
Market
retirement Retire
Medical care Medical care
Longevity
Buy new car
Child’s
education
Reimagining
insurance
Interest Rate
Buy Home
Savings Sanchay Plus Super Income Plan Sanchay Par Advantage
management
Board and
Quality of
Health Cardiac Care Cancer Care
Product
Offerings
Protection Click 2 Protect 3D Plus
Retirement Pension Guaranteed Plan
13Expanding market through consistent product innovation
Profitable
Guaranteed returns, with
growth
Retirement Woman option for life long income
& pension
FY15 FY17 FY18 FY19 FY20
distribution
Balanced
mix
Lifelong regular income
with payout flexibility and
Youngstar
innovation
whole life cover
leading
Market
Diversified product suite helps in managing Continued focus on protection 2
(Rs Bn.)
business cycles 1
16%
1% 2% 4%
5%
4% 5%
8% 7% 8%
Reimagining
7%
insurance
15% 33%
35% 28%
41%
18%
8.0
6.9
19%
53% 57% 55% 4.7
management
3.8 3.5
Board and
Quality of
28% 2.5
1.5 1.7
FY17 FY18 FY19 FY20 FY17 FY18 FY19 FY20
Savings Protection Ind Protection Group Protection
UL Par Non Par Term Annuity
1. As a % of individual APE
2. Based on new business premium. Group annuity included under annuity business
14Our approach to retiral solutions
Opportunity to grow the current retiral corpus2 of ~Rs 360 bn to 3x in the next 5 years
Profitable
growth
1. NPS 2. Individual income plans 1
▪ Ranked #1 amongst private owned Pension ▪ Providing long term retiral solutions
Fund Managers in terms of AUM ▪ Catering across age brackets & premium
▪ Registered strong growth of 60% in AUM frequencies
distribution
Balanced
mix
3. Immediate / deferred annuity 4. Group superannuation fund
innovation
▪ Largest player in the private sector
▪ Managing funds for over 150+ corporates
leading
Market
▪ Servicing 100+ corporates and >11,000
under superannuation scheme
individual lives covered till date
Preferred long-term retiral service providers
Reimagining
insurance
Increasing retiral corpus2
across corporates
Rs Bn.
management
Board and
Quality of
357
287
213
176
FY17 FY18 FY19 FY20
1. Comprises long term income and life long tenure options offered in Sanchay Plus and Sanchay Par Advantage
2. Includes NPS, Annuity, Group superannuation fund and long term variants of Sanchay Plus and Sanchay Par Advantage
15Product mix across key channels1
Segment FY17 FY18 FY19 FY20 Segment FY17 FY18 FY19 FY20
UL 26% 33% 26% 12%
Profitable
UL 61% 64% 67% 35%
growth
Par 57% 48% 40% 34%
Agency
Par 30% 26% 14% 17%
2
Banca
Non par savings 8% 8% 15% 44% Non par savings 6% 5% 17% 40%
Term 1% 1% 2% 2% Term 11% 11% 12% 12%
Annuity 0% 1% 2% 2% Annuity 2% 3% 5% 3%
distribution
Balanced
mix
UL 47% 58% 50% 33% UL 51% 47% 43% 28%
Par 29% 17% 8% 14% Par 3% 1% 1% 11%
Online
Direct
Non par savings 11% 9% 12% 20% Non par savings 1% 0% 15% 26%
Term 6% 5% 6% 4% Term 45% 52% 34% 32%
innovation
Annuity 7% 11% 24% 29% Annuity 0% 0% 6% 3%
leading
Market
Segment FY17 FY18 FY19 FY20 Q4 FY20
UL 53% 57% 55% 28% 26%
Company
Par 35% 28% 18% 19% 34%
Non par savings 8% 7% 15% 41% 26%
Reimagining
insurance
Term 4% 5% 7% 8% 10%
Annuity 1% 2% 5% 4% 4%
management
Total APE FY17 FY18 FY19 FY20 Total NBP FY17 FY18 FY19 FY20
Board and
Quality of
Protection
Term 8% 11% 17% 17% Term 22% 26% 27% 27%
Annuity 1% 2% 4% 4% Annuity 4% 9% 17% 16%
Total 9% 13% 21% 21% Total 26% 35% 44% 43%
1. Basis Individual APE, Term includes health business
2. Includes banks and other corporate agents
16Simplifying the customer journey using 5 building blocks
Profitable
growth
Platforms and Partner Journey Service Data Enrichment
Ecosystems Integration Simplification Simplification and Analytics
Insurance beyond digital: Products and services built on Customer sales journeys Simplified solutions for Continuous improvement in
distribution
Balanced
allow multiple participants to API for ease of partner simplified via mobility customers across the value raw data by gaining deeper
mix
connect, create & exchange integration applications for sales force chain insight into our customers’
value lives
Online payments & Artificial Intelligence:
Insta Suite
services: ~85% of renewal
via online / debit mode
Use of predictive analysis
for persistency,
innovation
One stop shop for Pre-approved sum Bringing our technological
leading
Market
underwriting and claims
retirement planning assured: Partner integrated capabilities on the mobile (fraud prevention)
KYC and income verification platform in order to empower
sales force Chat bot WhatsApp bot Big Data / Customer
Quick easy to understand
ELLE ETTY 360:
form filling: Seamless and
~90% of chats are self- Brings all customer data –
customer friendly user
Reimagining
serve via chat-bot interactions, transactions
interface
insurance
& relationships in one
3-step buying journey: Robotic Process place, in real time
End-to-end digital journey Automation: ~210+ bots
deployed Cloud Storage:
enabling partner’s customers
Data Lake (repository for
to buy the policy
entire enterprise data
Virtual Assist for
management)
Sales & Service, current
management
usages at ~1.76 million+
Board and
Quality of
Mobile app for on-boarding of Lead Lake (For effective
queries per month
prospective agents lead storage &
enrichment)
An omnichannel
conversational AI engine
17Journey Simplification: Digital agent on-boarding and platform solutions
InstaPRL – Mobile app for on-boarding of prospective LifeNext – End-to-end portal for group partners creating a
agents through journey simplification seamless journey with plug-n-play integration
1,200+
PRLs
3,600+
unique users Centralized float management, ease of payment,
claim management
Faster partner on-boarding, greater transparency
for partners & members
Expected to reduce TAT and improve efficiency
Improvement in efficiency of Group operations
Note: PRL: Pre Recruitment Licensing
18Service Simplification: NLP based WhatsApp bot
Get started by scanning this QR Code
Illustrative queries
What is my fund value
Fetch my policy details
Status of my policy
Or simply, send ‘Hi’ on WhatsApp
to +91 82918 90569 How do I get bonus
Powered by: What is mortality charge
An omnichannel conversational
AI engine for sales growth,
better customer engagement, ...and over 300 other queries!
and improved customer service
19Governance Framework
Board of Directors
Profitable
Independent and Experienced Board
growth
Committees
Corporate
Board
Risk Policyholder Nomination & Stakeholders’
Audit Investment With Profits Social
Management Protection Remuneration Relationship
Committee Committee Committee Responsibility
Committee Committee Committee Committee
distribution
Committee
Balanced
mix
Risk Council
Compliance Investment Claims Review
innovation
leading
Market
Council Council Committee
ALCO Standalone Councils
Committees/Councils
Information & Grievance
Management
Cyber Security Management Business and Innovation Internal Councils
Reimagining
Committee
insurance
Council
Products Technology Persistency
Disciplinary Independent and Experienced Board
Council Council Council
Panel for
Malpractices
Management
Board and
Quality of
Prevention of
Sexual
Harassment
Whistleblower
Committee
Additional governance through Internal, Concurrent and Statutory auditors
20 The above list of committees is illustrative and not exhaustiveFinancial risk management framework
Natural Hedges Product design & mix monitoring
▪ Protection and longevity businesses ▪ Prudent assumptions and pricing approach
▪ Unit linked and non par savings products ▪ Return of premium annuity products (>95% of
annuity); Average age at entry ~59 years
▪ Quantum of retail guaranteed products ~13% of AUM
▪ Deferred as % of total annuity business < 30%, with
limited deferment period (Summary of Milliman report on our ALM approach1
Scope of review Portfolios reviewed
• Assess appropriateness of ALM strategy to manage
Portfolio 1: Savings and Protection – All non-single premium
interest rate risk in non-par savings business
non-par savings contracts and group protection products
• Review sensitivity of value of assets and liabilities to
Portfolio 2: All immediate and deferred annuities
changes in assumptions
Description Stress scenarios tested Net asset liability position
Parallel shifts/ shape changes in yield curve within +- 150
Interest rate scenarios Changes by < 4.5%
bps of March 31st 2020 Gsec yield curve
Interest rate + Interest rate variation + changes in future persistency/
Changes by < 7%
Demographic scenarios mortality experience
100% persistency and 100% persistency with interest rates falling to 4% p.a. for
Still remains positive
low interest rates next 5 years, 2% p.a for years 6 -10 and 0% thereafter
Opinion and conclusion
ALM strategy adopted for Portfolios 1 and 2 is appropriate to:
meet policyholder liability cash flows
protect net asset-liability position thereby limiting impact on shareholder value
1. Opinion issued by Milliman Advisors LLP on ALM strategy (for non par business) included as part of our Financial disclosures
22Performance of wholly-owned subsidiary1 companies
HDFC Pension AUM, Rs Bn. HDFC International
Life and Re
82.7
51.7
11.6
0.5
Mar'15 Mar'17 Mar'19 Mar'20
Fastest growing PFM (Pension Fund Manager) under the Registered growth of 72% in gross reinsurance premium
NPS architecture (YoY growth of 60% in AUM) and 101% in net profits in FY20
Market share grew from 27% in Mar’19 to 31% in Mar’20 Continue to register positive net profit
amongst all private PFMs
As on December 30, 2019, S&P Global Ratings affirmed its
Ranks #1 in corporate subscribers base, #1 amongst all
long-term public financial strength rating of “BBB” while
PFMs in net fund flow, retail subscriber base and AUM
maintaining the outlook as “Stable”
POP operations commenced with enrolling of both retail
and corporate subscribers; 600+ corporate registrations till
Mar’20
23 1. Investment in subsidiaries not considered in Solvency MarginPerformance
Snapshot
Our Strategy
Managing Covid-19
Customer Insights
Annexures
India Life Insurance
3 Managing Covid-19Approach to manage impact of the COVID-19 outbreak
Immediate measures taken:
Opportunities
Accelerated Digital selling
Reinvent operating Higher demand for Consolidation of
Focus on selling products with end to model protection market share
end digital customer journeys Enhanced focus on Increasing awareness Product innovation
digital levels M&A
Work from home High protection gap
Digital servicing
Communication to customers about
digital touch-points for claims, Risks: Mitigants
renewal collections and customer
queries
Fall in growth: End-to- Adverse mortality Credit risk: Conservative
Employee engagement/ end digital journey experience: Stringent investment strategy;
facilitation underwriting on the back ongoing portfolio review
Initiatives to keep employee morale
of data analytics;
high; infrastructure enablement and increased pricing
collaboration tools for WFH option
Weak equity markets Fall in persistency: Expense over-run:
impacting solvency: Improved customer Focus on cost control
Prioritizing areas of focus Balanced product mix; engagement & measures, higher
healthy backbook surplus communication around proportion of variable
Dynamic review and assessment, need to retain cover costs
strengthening operating assumptions,
heightened focus on cost
25Managing impact of COVID-19 on business
New business / Customer Employee / Partner
purchase interaction engagement
▪ Digital sales journey - End-to-end
▪ Seamless support experience - ▪ e-learning platform - 7,500+ agents
digital sales, from prospecting till
Agency conversion, including customer
instA suite of applications for customer attending training programs daily
query resolution through mLearn / VC Platform
interactions
▪ New business mobilization - ▪ Integration with platforms -
▪ Gamified contests - Launched to
Promoting usage of netbanking, pre- Customers can buy, renew, and seek
Bancassurance approved sum assured offers and support through multiple apps /
drive adoption of digital engagement
initiatives
digital receipting at branches portals
▪ iEarn - AI based behavior influencing ▪ InstaServe - OTP based policy ▪ Engagement and capability
Direct (offline) tool, nudges field salesperson for servicing tool to handle customer building - VC based skill building
completion of specific tasks queries program on virtual selling skills
▪ Uninterrupted customer assistance ▪ 24*7 self-service options - ▪ Employee engagement - VC based
Direct (online) - Work from home solution enabled for Promotion of solutions through website skill building sessions with digital
contact center agents and employees along with service and claims FAQs partners (Twitter, Google, Facebook)
▪ Access to digital tools - Key partners ▪ ‘Resume’ application option - Post
▪ Partner trainings - Conducted via
Broker given access to instA and partner logins, customers can directly upload
digital collaboration tools
portal documents on our website
New initiatives launched to manage volatile business environment due to the Covid-19 outbreak
26Enabling end to end digital journey: Servicing
Renewal Collections Maturity / Claims payout Policy Servicing
~85% of renewal payments made Email, Whatsapp and customer portal 'My 73% increase in adoption of web and app
digitally via Website, Mobile app, Quick Account‘ enabled to upload necessary docs users after lockdown
Pay, PayZapp, PayTm, Bharat Bill
Simple '3 click claim' process for some 70% increase in the usage of WhatsApp bot
Tie-up with Insure Pay policies (99.96% claims settled in 1 day in ‘Etty’, chatbot ‘Elle’, Twitter bot (Neo)
Q4)
SVAR (voice bot for renewal calling) ~70% customer servicing team enabled to
Video based process enabled for Senior work from home
Cloud telephony used for employees customers to submit Life Certificate
working from home to do remote reminder 1.76 mn+ Monthly queries handled by
and service calling Robotic Process automation handled more InstA (virtual assistant), InstaServ (Mobile
than 175 processes remotely app enabled to service customers)
HDFC Life has settled ~3,000 maturity claims, settled ~ 300 death/health claims, made ~21,000 annuity payouts,
processed ~95k transactions in the first 15 days of lockdown
27Enabling end to end digital journey: New Business (1/2)
Suite of mobile apps to Faster integration with new Pre-conversion Verification Simplified insurance buying
facilitate customer on-boarding partners and self service via Chat through a 3-click journey
Mobility API1 Integration Chat PCV Pre- Approved Sum
Assured
Mobile Sales Diary or MSD Standard APIs set for NB Automated verification Intuitive UI/UX integrated
integration for retail & across all digital assets
InstaVerify (customer Group Allows customers to do self
verification at POS) verification with a very easy Analytics-based automated
Drives better information chat UI underwriting, data-driven de-
InstaGo (Geo-tagging security dupe
enabled partner / lead
management tool) No dependence on Offering InstaInsure to 15+
salesperson or call center partners
eCCD for paperless customer
consent >60% verifications
completed post Covid
During Lockdown period1 3,000+ agents onboarded digitally (30% increase), 6,000+ telemedicals done (50% increase), 50,000+
applications submitted through digital mode and 45,000+ policies issued
1. API: Application Program Interface
2. Number of transactions for the period 21st March to 13th April
28Enabling end to end digital journey: New Business (2/2)
Complete integration with key Lean front-end sales Gamification of buying Ecosystem for retirement
channel partners journey for POS1 products journey planning
HDFC Bank Journey POSP1 Hello Selfie Life99
Ease of customer acquisition Completely paperless, lean Mechanism to gamify the Single platform for all
whereby, new customer on- proposal form making the insurance-buying journey retirement services; avail
boarded every 60 seconds process simpler and faster especially for the new-age services on the go
customers (e.g., millennials)
Deep integration enabling Cloud native (deployed on Choose from 10+ pension &
auto populate several data AWS); journey can happen Initiate the buying journey by investment products
and knocking out documents without impacting TEBT scanning a QR code or visiting
basis Bank KYC selfie.hdfclife.com Check retirement readiness and
Payment gateway integrated as compare with peers
Present on Mobile banking a part of the sales journey
and Whatsapp banking 200 partners onboarded
platform of HDFC bank 10,000+ registered users
Policy issuance2 inPerformance
Snapshot
Our Strategy
Managing Covid-19
Customer Insights
Annexures
India Life Insurance
4 Customer InsightsCustomer Insights – Customer Behaviour/Preferences
Top reasons to buy Life insurance Customer behaviour / trend
2019 rank 2013 rank
The future intent to buy Life Insurance is the
Protect family in case of death 1 1
highest amongst financial products driven
To secure child’s education/marriage 2 2
primarily by 21-40 year olds
Old age security/retirement 3 3
Within LI, the intent to buy traditional policies
For disciplined saving 4 8 was highest, particularly by people in the ages of
Good returns 5 6 41-50
Safe investment option 6 7
The intent to buy term insurance was driven
Additional investment option 7 5
primarily by people in the age group of 22-30
Dual benefit of investment and insurance 8 9
The key differentiating factors for consumers were
Tax Saving 9 4
safety of investment and maturity value
To meet additional life cover 10 10
Major reasons to buy Life Insurance continue to be There has been significant pickup in intention to
protection for family, securing child’s needs and retirement buy term products in metros
planning over last 6 years
Online mode for premium collection shows an
Tax saving is the 9th reason to buy Life Insurance, compared increasing trend across geographies
to 4th in 2013
31 Source: Nielsen Syndicated U&ASome additional customer insights1
Buying behaviour Household Distribution
A repeat buyer is usually a metro 40% of families have exposure to Contribution of online customers
resident, with income > Rs 10 only one product category with income bracket >Rs 15 lakhs
lakhs and age > 35 years (Par/Non-Par/UL) is significantly higher in
proprietary channels as compared
50% of cross-selling takes place Family Policy Density is 3.7 v/s
to aggregators
within 6 months & 80% within 18 Client Policy Density of 1.3
months In FY19, the activation of agents
Between Mar 2013 and Nov 2018,
is quicker in tier III vis-à-vis
A typical repeat buyer has more customers below •30 years of age
activation in metros
than 3 credit cards and a home have grown by 11x in NOP as well
loan of Rs 30+ lakhs as EPI growth Agents between 36 – 50 years of
age are selling more of protection
In 40% of the households, the
plans as 1st policy
second member of the family is
likely to take a policy within 6
months of the first policy
1. Based on internal analysis
32Performance
Snapshot
Our Strategy
Managing Covid-19
Customer Insights
Annexures
India Life Insurance
5 AnnexuresIndividual persistency for key channels and segments1
Across key channels (%) CY (FY20)
91 92
85 88
83 83
78 79 77 76
74 72 71
69 68 69 66
64
54
48
Agency Banca Direct Company
13th month 25th month 37th month 49th month 61st month
Across key segments (%) PY (FY19)
91 88
83 81 84
80 77
72 75 72 74 75
70 70 67 70
66 66
51
43
Savings (Traditional) Savings (UL) Protection Company
13th month 25th month 37th month 49th month 61st month
1. Calculated as per IRDAI circular (based on original premium) for individual business
34VNB and NBM walkthrough
Rs Bn.
1.05 0.36 19.19
2.82 -0.41
Growth of 25%
15.37 vs. FY19
VNB
FY19 Impact of higher Change in New Business Expense impact FY20
APE assumptions Profile 1
NBM% 24.6% 0.0% -0.6% 1.4% 0.5% 25.9%
1. Reflects the impact of difference in mix of segment/distribution channel/tenure/age/sum assured multiple etc
VNB – Value of New Business
35 NBM – New Business MarginSensitivity analysis: FY20
% Change in Change in VNB % Change in
Analysis based on key metrics Scenario
VNB 1 Margin 1 EV
Change in
Increase by 1% -2.8% -0.7% -1.2%
Reference rate
Decrease by 1% 0.9% 0.2% 0.6%
Equity Market
Decrease by 10% -0.3% -0.1% -1.1%
movement
Increase by 10% -2.1% -0.5% -0.7%
Persistency (Lapse rates)
Decrease by 10% 2.1% 0.6% 0.8%
Increase by 10% -2.4% -0.6% -0.8%
Maintenance expenses
Decrease by 10% 2.4% 0.6% 0.8%
Acquisition Increase by 10% -14.9% -3.9% NA
Expenses Decrease by 10% 14.9% 3.9% NA
Increase by 5% -2.4% -0.6% -0.9%
Mortality / Morbidity
Decrease by 5% 2.4% 0.6% 0.9%
Tax rate2 Increased to 25% -20.0% -5.2% -7.7%
1. Post overrun total VNB for Individual and Group business
2. The tax rate is assumed to increase from 14.56% to 25% and hence all the currently taxed profits in policyholder/shareholder segments are taxed at a higher rate. It does not
36 allow for the benefit of policyholder surplus being tax-exempt as was envisaged in the DTC Bill.Stable capital position
Rs Bn.
Dividend paid 2.6 3.3 4.0 -
120.0 230% Impact on FY20 Solvency ratio
NB premium growth 33% 32% 32% 15%
210%
100.0 192% 192% Solvency as on
188%
Feb 29, 2020
194%
184% 190%
80.0 70.8 170%
Yes Bank AT1
62.7 -2%
bonds
150%
52.1 13.1
60.0
12.7
42.1 130%
Equity market
19.2 fall
-10%
11.3
40.0 16.7 110%
9.1
13.6
11.0 90% Lower NB and
renewals
2%
20.0 38.5
33.3
27.2 70%
22.0
Solvency as on
- 50%
Mar 31, 2020
184%
Mar 31, 2017 Mar 31, 2018 Mar 31, 2019 Mar 31, 2020
ASM1 RSM @100% Incremental RSM @150% Surplus Capital Solvency margin 2
Internal accruals have supported new business growth with no capital infused in last eight years (except through issuance of ESOPs)
No dividend declared for FY20, in lines with the IRDAI circular to conserve capital
1. ASM represents Available solvency margin and RSM represents Required solvency margin
2. Investment in subsidiaries not considered in solvency margin
37Assets under management
Assets Under Management Change in AUM 1 Rs Bn.
Debt 59% 61% 62% 71%
Equity 41% 39% 38% 29% 189 17
14
24% 82
16% 18%
1,550
1% 30% 95
1,350
93
-20%
67
1,150
-70%
950
-145
750
1,256 1,272 -120%
1,066
917
550
350
-170%
31st Mar 2019 31st Mar 2020
150 -220%
Net Fund inflow Net investment income Market movements
31st Mar 2017 31st Mar 2018 31st Mar 2019 31st Mar 2020
Net change in AUM1
AUM in Rs bn Growth in AUM vs LY
Continue to rank amongst top 3 private players, in terms of assets under management 2
More than 96% of debt investments in Government bonds and AAA rated securities as on Mar 31, 2020
1. Calculated as difference from April to March
2. Based on Assets under Management as on Dec 31, 2019
38Committed to Sustainability
Governance Social Environment
Corporate governance policy Swabhimaan - giving back to society - 23 CSR Water conservation and energy efficiency -
Self-assessment of Board Performance projects in education, health, environment, goal- oriented initiatives adopted
Board diversity policy livelihood, and disaster relief implemented across 25
Average Board experience is > 30 years states and 3 UTs, impacting > 280K beneficiaries in Access to clean drinking water - Set up water
India ATMs in 12 villages
Code of conduct policy
Insured > 40 million lives in microfinance Waste management initiatives - segregation
Risk management policy and enterprise risk of waste, use of biodegradable garbage bags,
management (ERM) framework - designed Robust talent management process - Programs ban on use of single use of plastic
and approved by the board such as Potential Review Process (PRP), STRIDE and
ZENITH assess the needs of employees Created ten city forests - using the Japanese
Sensitivity analysis and stress testing - Miyawaki method in Mumbai and Nashik
conducted periodically Contemporary and progressive employee
development programs - include web enabled,
Information security and cyber security - As a micro size learnings hoisted on platforms such as M-
part of the ISO 27001:2013 assessment program, Learn and M-Connect
independent auditors validated and certified the
controls implemented Employee satisfaction study - ESAT scores with
71% actively engaged employees covering 95% of
Data privacy policy - applicable to customers, workforce
employees, and service providers
Customer satisfaction surveys - conducted Focus on building a sustainable business
Focus on data privacy and cyber security - nil regularly with a culture that fosters inclusive
cases in FY19
Employee health and wellbeing - flexi working growth for all stakeholders, today and
Performance management system - deeply hours, childcare facility, paid paternity leave, paid tomorrow
entrenched in the principles of ‘balanced scorecard’ maternity leave are available. Diversity and
inclusiveness, health and fitness are key focus areas
39Performance
Snapshot
Our Strategy
Managing Covid-19
Customer Insights
Annexures
India Life Insurance
6 India Life InsuranceGrowth opportunity: Under-penetration and favourable demographics
1
Life Insurance penetration Life Insurance density US$ 2
(2018) (2018)
17.5% 16.8%
6.756 India remains vastly under-insured, both
in terms of penetration and density
6.7% 4,195
6.2% 3,835
Huge opportunity to penetrate the
3.6% 2,411
3.3% 2.7% 2.3% 339
237 225 underserviced segments, with evolution of
55
the life insurance distribution model
India
Malaysia
Hong Kong
Japan
Thailand
China
Singapore
Taiwan
India
Malaysia
Hong Kong
Japan
Thailand
China
Singapore
Taiwan
Life expectancy (Years) Population composition (Bn.) India’s insurable population is expected to
touch 750 million by 2020
1.3 1.6 1.7
6%
India’s elderly population is expected to
9% 15%
75.0 double by 2035 (as compared to 2015)
71.9 56%
61% Emergence of nuclear families and
60%
67.6 advancement in healthcare facilities lead to
increase in life expectancy thus facilitating
38%
30% 25% need for pension and protection based
2015 2035 2055
products
2015 2035 2055
Less than 20 years 20-64 years 65 years and above
1. Penetration as measured by premiums as % of GDP,
2. Density defined as the ratio of premium underwritten in a given year to the total population
41 Source: Swiss Re (Based on respective financial year of the countries), MOSPI, United Nations World Populations Prospects Report (2017)Low levels of penetration – Life Protection
172 mn 68 mn 1.7 mn Protection gap 2
(2014)
92.2%
88.3%
78.4%
73.3% 72.5% 70.2% India has the highest protection gap in
56.3% 56.0% the region, as growth in savings and
life insurance coverage has lagged
behind economic and wage growth
16.4%
Protection gap has increased over 4x in
last 15 years with significantly low
Indonesia
Japan
China
Thailand
Singapore
Taiwan
India
Malaysia
Hong Kong
insurance penetration and density
Trend of retail loans 3 (Rs Tn.) Retail credit has grown at a CAGR of
Urban Working Addressable Annual Policy 21% over last 6 years
Population Market Sales 30
(excl blue collared) Increasing retail indebtedness to spur
25
need for credit life products
20
16 Immense opportunity given:
Only 1 out of 40 people (2.5%) who can afford 14
it is buying a policy every year 1 10
12
Increasing adoption of credit
Even within the current set, Sum Assured as a Enhancement of attachment rates
multiple of Income isMacro Opportunity of Pension Segment
India’s pension market is under-penetrated at Improvements in life expectancy will lead to an average post
4.8% of GDP retirement period of 20 years
Pension Assets / GDP Ratio Life expectancy at age 60
130.7 22 22
120.5 20
19
18 18
17
16
56.4 60.8
43.2
4.8
India Hong Kong South Africa Japan USA Australia
India Hong Kong South Africa Japan USA Australia
1995-2000 2000-05 2011-12 2030E
Males Females
60+ population is expected to almost triple by 2050
Ageing population Average household size has decreased from 4.6 in 2001 to 3.9 in 2018
9% 19%
Total Pension AUM is expected to grow to Rs 47 Tn by 2025 (more
62% than 1/3rd accounted for by NPS)
62%
Mandatory schemes to increase coverage for both unorganized and
29% 19% organized sectors
2015 2050
AgeGovernment Bond Auctions
Government Bonds – Tenorwise Issuance Rs Bn.
29% 27%
34% 34% 38% 35% 35%
71% 73%
66% 65% 62% 65% 65%
FY14 FY15 FY16 FY17 FY18 FY19 FY20
>15yrs 1,93,000 2,06,000 2,25,000 1,54,520 1,80,529 2,04,000 2,38,000
15 year maturity bonds has been ~33% on an average facilitates writing annuity business at scale
Budget estimate plan for government borrowing for FY20 at Rs. 7.1 trillion on gross basis
The actual borrowing till Q4 is 96% of the budget
44 Source: CCIL & National Statistics Office, Union Budget,RBILife Insurance: A preferred savings instrument
Household savings composition Financial savings mix
23% 25% 22% 17%
3%
11% 11% 10%
12%
9% 13% 20%
18%
15%
51% 52% 26% 17%
67% 60%
65% 67%
50% 54%
49% 48%
33% 40%
FY07 FY10 FY13 FY18 FY07 FY10 FY13 FY18
Financial savings Physical savings
Currency & deposits Life insurance Provident/Pension fund Others
Household savings as % of GDP
Increasing preference towards financial savings with increasing financial literacy within the population
Various government initiatives to promote financial inclusion:
Implementation of JAM trinity – around 381 mn new savings bank accounts opened till date
Launch of affordable PMJJBY and PMSBY social insurance schemes
Atal Pension Yojana promoting pension in unorganized sector
45 Source: DBIE-RBI Statistics, RBI Annual Report, Economic Survey, CSO, www.pmjdy.gov.inIndustry new business1 trends
Individual WRP in Rs bn
Sensex
Private players 50% 57% 52% 46% 37% 38% 38% 49% 52% 54% 56% 58% 57%
Market share
Growth %
Private 86% 1% 7% -20% -24% 2% -3% 16% 14% 26% 24% 12% 5%
LIC 0% -22% 29% 4% 11% -4% -2% -27% 3% 15% 13% 5% 8%
Overall 31% -10% 17% -9% -5% -2% -3% -11% 8% 21% 19% 9% 6%
Private sector gained higher Market share than LIC for the first time in FY16, post FY11 regulatory changes
Amongst private insurers, insurers with a strong bancassurance platform continue to dominate with increasing market share
of the total private individual new business
1.Basis Individual Weighted Received Premium (WRP)
46 Source: IRDAI and Life Insurance CouncilPrivate industry: Product and distribution mix
Product mix 1
Distribution mix 2
Unit Linked Conventional Individual Agents Corporate Agents - Banks Corporate Agents - Others Brokers Direct Business
67%
7% 9% 10% 10% 12%
57% 56% 14% 18%
54% 5% 4% 3%
52% 51% 51% 49% 5% 3% 3% 3% 3%
49% 4% 3% 3% 3% 3%
48% 46% 3%
43% 44%
44%
33% 47% 52% 54% 54% 55% 51%
41%
36% 32% 30% 28% 25% 24%
FY14 FY15 FY16 FY17 FY18 FY19 9M FY20 FY14 FY15 FY16 FY17 FY18 FY19 9M FY20
Product mix has moved towards balanced mix between UL and Conventional business for the private players
Increasing thrust on protection business in recent times by top players has helped improve the new business margins
Banca sourced business has consistently increased on the back of increasing reach of banks while share of Agency has declined post
regulatory changes in FY11
1. Basis Overall WRP (Individual and Group);
2. Basis Individual New business premia
47 Source: IRDAI and Life Insurance CouncilAppendix
Financial and operational snapshot (1/2)

                                                                                                      FY20      FY19      FY18      FY17      CAGR

                  Total Premium                                                                       327.1      291.9     235.6     194.5    19%

                   New Business Premium (Indl. + Group)                                               172.4      149.7     113.5      86.2    26%

                   Renewal Premium (Indl. +Group)                                                     154.7      142.1     122.1     108.2    13%

                  Individual APE                                                                       61.4       52.0      48.9      37.4    18%

                  Overall APE                                                                          74.1       62.6      55.3      41.9    21%

                  Group Premium (NB)                                                                   87.8       73.3      54.1      44.2    26%

                  Profit after Tax                                                                     13.0       12.8      11.1      8.9     13%

                   Policyholder Surplus                                                                10.9        9.0       8.5       7.5    13%

                   Shareholder Surplus                                                                  2.1        3.8       2.6       1.4    14%

                                                                                               (1)
                  Dividend Paid                                                                          -        4.0       3.3       2.6

                  Assets Under Management                                                             1,272.3   1,255.5   1,066.0    917.4    12%

                  Indian Embedded Value                                                               206.5      183.0     152.2     124.7    18%

                                                                                               (2)
                  Net Worth                                                                            69.9       56.6      47.2      38.1    22%

                  NB (Individual and Group segment) lives insured (Mn.)                                61.3       51.4      33.2      20.9    43%

                                                                                               (3)
                  No. of Individual Policies (NB) sold (In 000s)                                      896.3      995.0    1,049.6   1,082.3   -6%

     1. Including dividend distribution tax (DDT)
     2. Comprises share capital, share premium and accumulated profits/(losses)
49   3. Including rural policies. Excluding rural policies, NOPs grew by CAGR of 2% between FY17-20
Financial and operational snapshot (2/2)
FY20 FY19 FY18 FY17
Overall New Business Margins (post overrun) 25.9% 24.6% 23.2% 22.0%
(1)
Operating Return on EV 18.1% 20.1% 21.5% 21.7%
Operating Expenses / Total Premium 13.1% 13.1% 13.5% 12.6%
Total Expenses (OpEx + Commission) / Total Premium 17.7% 17.0% 18.0% 16.7%
(2)
Return on Equity 20.5% 24.6% 26.0% 25.7%
Solvency Ratio 184% 188% 192% 192%
(3)
Persistency (13M / 61M) 88%/54% 84%/51% 83%/50% 81%/59%
Market Share (%)
- Individual WRP 14.2% 12.5% 13.3% 12.7%
- Group New Business 29.0% 28.4% 28.5% 24.3%
- Total New Business 21.5% 20.7% 19.1% 17.2%
Business Mix (%)
(4)
- Product (UL/Non par savings/Non par protection/Par) 28/45/8/19 55/20/7/18 57/9/5/28 52/9/4/35
(4)
- Indl Distribution (CA/Agency/Broker/Direct) 55/14/9/22 64/13/4/19 71/11/5/14 72/12/5/11
(5)
- Total Distribution (CA/Agency/Broker/Direct/Group) 23/7/3/17/51 26/7/2/16/49 33/7/2/10/48 32/7/2/7/52
- Share of protection business (Basis Indl APE) 7.6% 6.7% 5.1% 4.0%
- Share of protection business (Basis Overall APE) 17.2% 16.7% 11.3% 7.8%
- Share of protection business (Basis NBP) 27.6% 27.0% 25.9% 21.8%
1. During FY18, there was a one time positive operating assumption change off Rs 1.4 bn based on review by an external actuary as part of the IPO process. Excluding this one
time adjustment, Operating return on EV would have been 20.4% for FY18
2. Calculated using net profit and average net worth for the period (Net worth comprises of Share capital, Share premium and Accumulated profits)
3. Persistency ratios (based on original premium) for individual business
5. Based on individual APE. UL: Unit Linked, Trad: Traditional, Par: Participating & CA: Corporate Agents. Percentages are rounded off
6. Based on total new business premium including group. Percentages are rounded off
50Revenue and Profit & Loss A/c
Revenue A/c Profit and Loss A/c Rs Bn.
FY20 FY19 FY20 FY19
Premium earned 327.1 291.9 Income
Reinsurance ceded (4.8) (2.6)
- Interest and dividend income 3.6 2.9
Income from Investments (33.1) 90.3
- Net profit/(loss) on sale 0.8 1.1
Other Income 2.1 1.2
Transfer from Shareholders' Account 1.1 3.1 Transfer from Policyholders' Account 11.9 12.1
Total Income 292.2 383.8 Other Income 0.2 0.2
Commissions 14.9 11.3
Total 16.5 16.4
Expenses 42.7 38.0
Outgoings
GST on UL charges 3.5 3.4
Provision for taxation 1.5 2.3 Transfer to Policyholders' Account 1.1 3.1
Provision for diminution in value of investments 5.7 0.9 Expenses 0.3 0.3
Benefits paid 181.3 133.6 Provision for diminution in value of
2.0 0.1
investments
Change in valuation reserve 24.4 175.1
Provision for Taxation 0.2 0.1
Bonuses Paid 8.5 5.7
Total Outgoings 282.5 370.3 Total 3.5 3.6
Surplus 9.7 13.5 Profit for the year as per P&L
13.0 12.8
Statement
Transfer to Shareholders' Account 11.9 12.1
Interim Dividend paid (including tax) 0.0 (4.0)
Funds for future appropriation - Par (2.2) 1.4
Profit carried forward to Balance
Total Appropriations 9.7 13.5 13.0 8.8
Sheet
51Balance Sheet
Mar 31, 2020 Mar 31, 2019 Rs Bn.
Shareholders’ funds
Share capital (including Share premium) 24.2 23.8
Accumulated profits 45.7 32.7
Fair value change (1.9) (0.0)
Sub total 68.0 56.6
Policyholders’ funds
Fair value change 0.5 11.1
Policy Liabilities 652.7 536.3
Provision for Linked Liabilities 508.4 605.2
Funds for discontinued policies 33.4 28.6
Sub total 1,195.0 1,181.2
Funds for future appropriation (Par) 8.8 11.0
Total Source of funds 1,271.9 1,248.8
Shareholders’ investment 58.6 50.5
Policyholders’ investments: Non-linked 671.9 571.2
Policyholders’ investments: Linked 541.8 633.8
Loans 3.0 0.8
Fixed assets 3.3 3.3
Net current assets (6.7) (10.8)
Total Application of funds 1,271.9 1,248.8
52Segment wise average term and age1
Average Policy Term excluding annuity (Yrs) Average Customer Age excluding annuity (Yrs)
FY20: 19.6 (FY19: 14.6) FY20: 37.2 (FY19: 37.5)
12 UL 37
UL 38
11
Par 35
27 37
Par
15
Non-par Health 33
18 35
Non-par Health
10
Non-par Savings 38
11 35
Non-par Savings
13 34
Non-par Protection
34
39
Non-par Protection 57
35 Non-par Pension
54
11 58
Non-par Pension Annuity
11 58
FY20 FY19 FY20 FY19
Focus on long term insurance solutions, reflected in longer policy tenure
Extensive product solutions catering customer needs across life cycles from young age to relatively older population
53 1. Basis individual new business policies (excluding annuity)Indian Embedded value: Methodology and Approach (1/2)
Overview
Indian Embedded Value (IEV) consists of:
Adjusted Net Worth (ANW), consisting of:
– Free surplus (FS);
– Required capital (RC); and
Value of in-force covered business (VIF): Present value of the shareholders’ interest in the earnings distributable from
assets allocated to the covered business, after making sufficient allowance for the aggregate risks in the covered business.
Components of Adjusted Net Worth (ANW)
Free surplus (FS): FS is the Market value of any assets allocated to, but not required to support, the in-force covered business
as at the valuation date. The FS has been determined as the adjusted net worth of the Company (being the net shareholders’
funds adjusted to revalue assets to Market value), less the RC as defined below.
Required capital (RC): RC is the amount of assets attributed to the covered business over and above that required to back
liabilities for the covered business. The distribution of this to shareholders is restricted. RC is set equal to the internal target level
of capital equal to 170% of the factor-based regulatory solvency requirements, less the funds for future appropriations (“FFA”) in
the participating funds.
54Indian Embedded value: Methodology and Approach (2/2)
Components of Value in-force covered business (VIF)
Present value of future profits (PVFP): PVFP is the present value of projected distributable profits to shareholders arising
from the in-force covered business determined by projecting the shareholder cash flows from the in-force covered business
and the assets backing the associated liabilities.
Time Value of Financial Options and Guarantees (TVFOG): TVFOG reflects the value of the additional cost to shareholders
that may arise from the embedded financial options and guarantees attaching to the covered business in the event of future
adverse market movements. Intrinsic value of such options and guarantees is reflected in PVFP.
Frictional costs of required capital (FC): FC represents the investment management expenses and taxation costs
associated with holding the RC. VIF includes an allowance for FC of holding RC for the covered business. VIF also includes an
allowance for FC in respect of the encumbered capital in the Company’s holdings in its subsidiaries.
Cost of residual non-hedgeable risks (CRNHR): CRNHR is an allowance for risks to shareholder value to the extent that
these are not already allowed for in the TVFOG or the PVFP. In particular, the CRNHR makes allowance for:
– asymmetries in the impact of the risks on shareholder value; and
– risks that are not allowed for in the TVFOG or the PVFP.
CRNHR has been determined using a cost of capital approach. CRNHR is the present value of the cost of capital charge levied
on the projected capital in respect of the material risks identified.
55Embedded Value: Economic assumptions1
Forward rates % Spot rates %
Years
As at Mar 31, 2020 As at Mar 31, 2019 As at Mar 31, 2020 As at Mar 31, 2019
1 4.69 6.63 4.58 6.42
2 5.69 6.99 5.06 6.59
3 6.52 7.31 5.48 6.74
4 7.04 7.58 5.81 6.88
5 7.29 7.80 6.06 7.01
10 7.18 8.32 6.55 7.43
15 7.03 8.31 6.64 7.62
20 7.00 8.19 6.67 7.70
25 7.00 8.08 6.69 7.72
30+ 7.00 8.01 6.70 7.72
56 1. Forward rates are annualised and Spot rates are continuousGlossary (Part 1) APE (Annualized Premium Equivalent) - The sum of annualized first year regular premiums and 10% weighted single premiums and single premium top-ups Backbook surplus – Surplus accumulated from historical business written Conservation ratio - Ratio of current year renewal premiums to previous year's renewal premium and first year premium Embedded Value Operating Profit (“EVOP”) – Measure of the increase in the EV during any given period, excluding the impact on EV due to external factors like changes in economic variables and shareholder-related actions like capital injection or dividend pay-outs. First year premiums - Regular premiums received during the year for all modes of payments chosen by the customer which are still in the first year. For example, for a monthly mode policy sold in March 2019, the first instalment would fall into first year premiums for 2018-19 and the remaining 11 instalments in the first year would be first year premiums in 2019-20 New business received premium - The sum of first year premium and single premium. New business strain – Strain on the business created due to revenues received in the first policy year not being able to cover for expenses incurred 57
Glossary (Part 2) Operating expense - It includes all expenses that are incurred for the purposes of sourcing new business and expenses incurred for policy servicing (which are known as maintenance costs) including shareholders’ expenses. It does not include commission. Operating expense ratio - Ratio of operating expense (including shareholders’ expenses) to total premium Proprietary channels – Proprietary channels include agency and direct Protection Share - Share of protection includes annuity and health Persistency – The proportion of business retained from the business underwritten. The ratio is measured in terms of number of policies and premiums underwritten. Renewal premiums - Regular recurring premiums received after the first year Solvency ratio - Ratio of available solvency Margin to required solvency Margins Total premiums - Total received premiums during the year including first year, single and renewal premiums for individual and group business Weighted received premium (WRP) - The sum of first year premium and 10% weighted single premiums and single premium top-ups 58
Disclaimer

This presentation is for information purposes only and does not constitute an offer or invitation to sell or the solicitation of an offer or invitation to purchase any securities (“Securities”) of HDFC
Life Insurance Company Limited (formerly HDFC Standard Life Insurance Company Limited) (“HDFC Life” or the “Company”) in India, the United States, Canada, the People’s Republic of China,
Japan or any other jurisdiction. This presentation is not for publication or distribution, directly or indirectly, in or into the United States (including its territories and possessions, any state of the
United States and the District of Columbia). The securities of the Company may not be offered or sold in the United States in the absence of registration or an exemption from registration under
the U.S. Securities Act of 1933, as amended. The Company does not intend to register any securities in the United States. You confirm that you are either: (i) a “qualified institutional buyer” as
defined in Rule 144A under the U.S. Securities Act of 1933, as amended, or (ii) outside the United States. By receiving this presentation, you are agreeing to be bound by the foregoing and below
restrictions. Any failure to comply with these restrictions will constitute a violation of applicable securities laws.

This presentation should not, nor should anything contained in it, form the basis of, or be relied upon in any connection with any contract or commitment whatsoever. The information contained
in this presentation is strictly confidential and is intended solely for your reference and shall not be reproduced (in whole or in part), retransmitted, summarized or distributed to any other
persons without Company’s prior written consent.

The Company may alter, modify or otherwise change in any manner the contents of this presentation, without obligation to notify you or any person of such revision or changes. This presentation
may contain forward‐looking statements that involve risks and uncertainties. Forward‐looking statements are based on certain assumptions and expectations of future events. Actual future
performance, outcomes and results may differ materially from those expressed in forward‐looking statements as a result of a number of risks, uncertainties and assumptions. Although Company
believes that such forward‐looking statements are based on reasonable assumptions, it can give no assurance that your expectations will be met. Representative examples of factors that could
affect the accuracy of forward-looking statements include (without limitation) the condition of and changes in India’s political and economic status, government policies, applicable laws, the
insurance sector in India, international and domestic events having a bearing on Company’s business, particularly in regard to the regulatory changes that are applicable to the life insurance
sector in India, and such other factors beyond our control. You are cautioned not to place undue reliance on these forward-looking statements, which are based on knowledge, experience and
current view of Company’s management based on relevant facts and circumstances.

The data herein with respect to HDFC Life is based on a number of assumptions, and is subject to a number of known and unknown risks, which may cause HDFC Life’s actual results or
performance to differ materially from any projected future results or performance expressed or implied by such statements. Forecasts and hypothetical examples are subject to uncertainty and
contingencies outside Company’s control. Past performance is not a reliable indication of future performance.

This presentation has been prepared by the Company. No representation, warranty, express or implied, is made as to, and no reliance should be placed on, the fairness, accuracy , completeness
or correctness of the information and opinions in this presentation. None of Company or any of its directors, officers, employees, agents or advisers, or any of their respective affiliates, advisers
or representatives, undertake to update or revise any forward-looking statements, whether as a result of new information, future events or otherwise and none of them shall have any liability (in
negligence or otherwise) for any loss howsoever arising from any use of this presentation or its contents or otherwise arising in connection with this presentation. Further, nothing in this
presentation should be construed as constituting legal, business, tax or financial advice or a recommendation regarding the securities. Before acting on any information you should consider the
appropriateness of the information having regard to these matters, and in particular, you should seek independent financial advice.

    59
Thank you
You can also read