Dietary Intake of Essential, Toxic, and Potentially Toxic Elements from Mussels (Mytilus spp.) in the Spanish Population: A Nutritional Assessment ...
←
→
Page content transcription
If your browser does not render page correctly, please read the page content below
nutrients
Article
Dietary Intake of Essential, Toxic, and Potentially
Toxic Elements from Mussels (Mytilus spp.) in the
Spanish Population: A Nutritional Assessment
Ángel Rodríguez-Hernández 1 , Manuel Zumbado 1,2 , Luis Alberto Henríquez-Hernández 1,2 ,
Luis D. Boada 1,2 and Octavio P. Luzardo 1,2, *
 1   Toxicology Unit, Research Institute of Biomedical and Health Sciences (IUIBS), Universidad de Las Palmas
     de Gran Canaria, Paseo Blas Cabrera Felipe s/n, 35016 Las Palmas, Spain; anrodrivet@gmail.com (Á.R.-H.);
     manuel.zumbado@ulpgc.es (M.Z.); luis.henriquez@ulpgc.es (L.A.H.-H.); luis.boada@ulpgc.es (L.D.B.)
 2   Spanish Biomedical Research Centre in Physiopathology of Obesity and Nutrition (CIBERObn), Paseo Blas
     Cabrera Felipe s/n, 35016 Las Palmas, Spain
 *   Correspondence: octavio.perez@ulpgc.es; Tel.: +34-928-451-424

 Received: 28 March 2019; Accepted: 15 April 2019; Published: 17 April 2019

 Abstract: The levels of forty-three elements were determined in fresh, preserved, and frozen mussels
 (n = 208) with the purpose of evaluating their contribution to the recommended dietary intake of
 essential elements and their potential risk to Spanish consumers’ health. We found relevant differences
 in the element content in relation to the mode of conservation of mussels as well as in relation to their
 geographical origin, brand, or mode of production. According to our estimates, mussels are important
 contributors to the intake of most essential elements, contributing almost 70% of daily requirements
 of Se, 30–35% of Mo, Zn, and Co, and around 15% of Fe. At the same time, the pattern of average
 consumption of mussels in Spain does not seem to imply an excessive risk associated with any of the
 36 toxic elements studied. However, it should be noted that, in the high percentile of consumption
 the exposure to Cd and As may be high, in particular that associated with the consumption of fresh
 and/or frozen mussels. According to the results of this study, a moderate consumption of mussels can
 be recommended as a valuable and safe source of trace elements.

 Keywords: tolerable intake; essential elements; adequate intake; toxic elements; health risk assessment

1. Introduction
     Fishery products provide many beneficial nutritional components such as long-chain
polyunsaturated fatty acids (PUFAs), high-quality-proteins, essential elements, and vitamins [1,2].
Among them, mussels are considered an excellent source of proteins, and it is estimated that a 100 g
portion of mussel meat provides a quarter of an adult’s daily protein need. It is also considered that
the consumption of this amount of mussels provides the recommended daily intake of vitamin B12 [3].
It has also been reported that mussels are a relevant source of some essential trace elements, such as Se,
Fe, and Zn [3,4]. Taking into account all these nutritional facts and summing up that mussels have low
cholesterol levels and a low glycemic index, they should be considered a balanced, healthy, and dietary
food choice based on its contribution of nutrients.
     However, this mollusk is also a concern because, in addition to beneficial elements, it also has
the capacity to accumulate many other toxic or potentially toxic elements [5–9]. In fact, mussels
have been widely employed as sentinel organisms in coastal pollution monitoring, in particular in
regard to heavy metal contamination [10]. This is because the gill tissue of mussels is particularly
rich in metallothionein, and this attribute of mussels therefore constitutes a key interface for the
uptake of dissolved metals and their further incorporation into lysosomes and their transport in

Nutrients 2019, 11, 864; doi:10.3390/nu11040864                                www.mdpi.com/journal/nutrients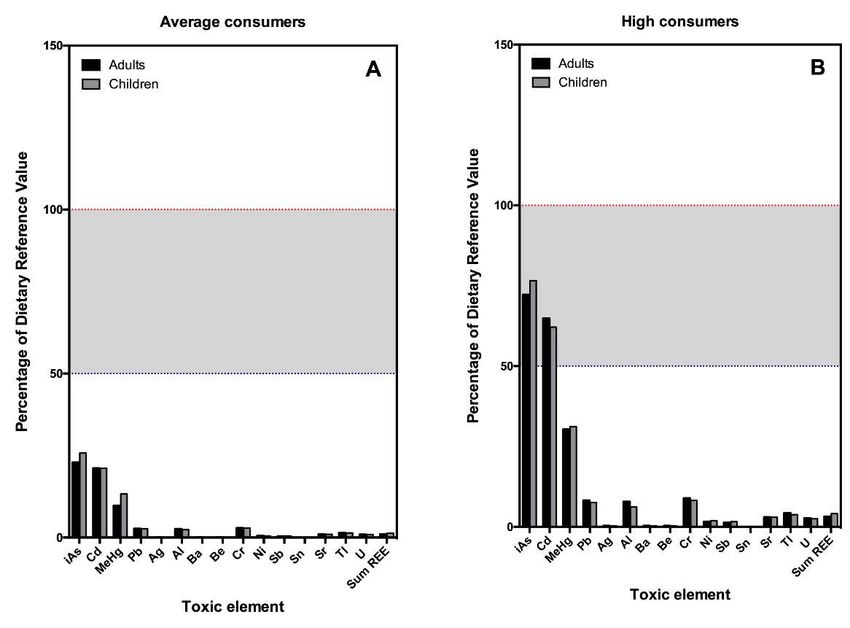
Nutrients 2019, 11, 864                                                                             2 of 18

blood plasma and circulating hemocytes [10]. In the case of mussels, apart from the abovementioned
characteristics, it is also important to consider that a good part of them is consumed in the form
of canned preserves, as mussels (similar to the other seafoods) are easily spoiled and very prone
to oxidation and to developing off-flavors due to wrong handling or incorrect storage. However,
very often, canned foods in general are perceived by consumers as low-quality products, which are
thought to be possibly produced using lesser quality raw ingredients, and fresh seafood is in general
perceived as the healthier alternative to frozen and processed products [11]. One of the consumers’
suspicions of worse food quality has to do with the packaging material and with the possibility that the
canned seafood, apart from their own content in heavy metals from the marine environment, may also
be contaminated by heavy metals during the canning process [12].
       The mussel canning industry is the recipient of two-thirds of the annual Spanish production of
mussels [13]. In general, Spanish mussel production is the second largest in the world, after China’s,
with an annual production of around 250,000 tonnes/year (14% of the world’s production) [14]. Mussels
are also the type of seafood most consumed by the Spanish population, which has about 15% of
regular consumers with an average consumption of around 20.5 kg/person/year (about half in children).
This amount is divided between the consumption of canned (40%), fresh (50%), and frozen (10%)
mussels [13]. This data is very relevant since, when determining the nutrient concentrations in foods,
it is important to consider the different ways of preserving them because they can modify the nutritional
composition in a very significant way. Therefore, if one wants to be precise in the estimation of the
intake of nutrients and/or contaminants through a certain type of food, all possible ways in which said
food is consumed should be considered. In the case of mussels, this would represent the estimation of
the intake through one of modes of consumption—canned, fresh, and deep frozen. However, although
there is abundant scientific literature documenting the levels of essential and toxic elements in mussels,
to the best of our knowledge, very few studies have made an exhaustive comparison of their levels
according to their mode of conservation [15,16], and none has taken into account this differential
content in the dietary intake estimation.
       Consequently, this study was conducted to determine the content of forty-three elements (essential
and toxic) in all the forms in which mussels are acquired and consumed in Spain (preserved, fresh,
and deep-frozen) with the aim of performing an accurate estimation of the contribution of this food
to the daily intake of these elements and of performing a risk–benefit evaluation by comparing the
estimated daily intake with dietary and toxic reference values.

2. Materials and Methods

2.1. Sampling and Collection
      In this research, we studied a total of 208 pooled mussel samples. Mussels were randomly
purchased between July and August of 2018 from supermarkets and fish markets of the Canary Islands
(Spain). We intended to cover the main forms of presentation of this food in the market, but avoided
purchasing preparations and processed mussels (with pickles, sauces, etc.). Thus, we analyzed 88
samples of canned mussels (only steamed and preserved in salted water), 80 samples of deep-frozen
mussels, and 40 samples of fresh mussels. Each sample for analysis consisted of 4–5 individual mussels
of each brand that were homogenized together. Regarding the origin, the samples were from Galicia
(Spain), Chile, and New Zealand, according to the following distribution (Table 1): i) the canned
samples were from Galicia (n = 72, 38 name brands, and 34 store brands) and from Chile (n = 16,
all name brands); ii) the frozen samples were from Galicia (n = 36, 8 of them were certified as organic
production), from Chile (n = 28), and from New Zealand (n = 12); and iii) the fresh samples were
all from Galicia (n = 40). In the sampling design, we tried to represent all the possible national and
international brands available throughout the Spanish territory. Thus, all the samples came from large
suppliers that serve the entire nation, and we consider that our results could be extrapolated and made
representative of the Spanish market. After the purchase, all the frozen and fresh mussel samples
Nutrients 2019, 11, 864 3 of 18
were kept on ice to maintain the cold chain until their arrival to the Laboratory of Toxicology of the
University of Las Palmas de Gran Canaria (ULPGC), where they were processed immediately.
Table 1. Sampling of the mussels according to the type of conservation, the production area, the type
of brand, and the method of production.
Galicia Chile New Zealand
Type of Type of Type of
Mode of Production Mode of Production Mode of Production
Brand Brand Brand
Name Store Conventional Organic Name Store Conventional Organic Name Store Conventional Organic
Preserved
38 34 72 - 16 - 16 - - - -
(n = 88)
Frozen
36 - 28 8 34 - 32 - 12 - 12
(n = 80)
Fresh
40 - 40 - - - - - - - - -
(n = 20)
2.2. Standards and Elements
We determined the concentration levels of 43 elements in mussels, including the essential elements
and those elements more classically studied because of their high toxicity. Additionally, we included a
suite of other elements, including 1) the elements in the ATSDR’s priority list and 2) the rare earth
elements (REEs) and other minority elements (ME) that are of increasing concern because of their
massive employment in the manufacturing of electric and electronic consumer products and therefore
are increasingly appearing as emerging environmental pollutants [17,18]. The complete list of elements
comprises the following: Ag (silver); Al (Aluminum); As (arsenic); Ba (barium); Be (beryllium);
Cd (cadmium); Ce (cerium); Co (cobalt); Cr (chromium); Cu (copper); Dy (dysprosium); Eu (europium);
Er (erbium); Fe (iron); Ga (gallium); Gd (gadolinium); Hg (mercury); Ho (holmium); In (indium);
La (lanthanum); Lu (lutetium); Mn (manganese); Mo (molybdenum); Nb (niobium); Nd (neodymium);
Ni (nickel); Pb (lead); Pd (palladium); Pr (praseodymium); Sb (antimony); Se (selenium); Sm (samarium);
Sn (tin); Sr (strontium); Ta (tantalum); Tb (terbium); Th (thorium); Tl (thallium); Tm (thulium);
U (uranium); Y (yttrium); Yb (ytterbium); and Zn (zinc).
Pure standards of elements in acid solution (5% HNO3 , 100 mg/L) were purchased from CPA
Chem (Stara Zagora, Bulgaria). Two standard curves (twelve points, 100–0.005 ng/mL) were made
to avoid interferences between elements: a) one using a commercial multi-element mixture (CPA
Chem Catalog number E5B8.K1.5N.L1, 21 elements, 100 mg/L, 5% HNO3 ) containing all the essential
elements and main heavy metals; and b) other multi-element mixture tailor-made in our laboratory
from individual elements (CPA Chem), which contained the REEs and MEs most frequently employed
in the high-tech industry [18].
2.3. Analytical Procedure
All the ready-to-eat canned samples were manually pooled using a metal-free Teflon mortar until
forming a homogeneous mass. The fresh and frozen samples required a shell opening and cooking
in their own juice. This was done by steaming them using a domestic food processor (Thermomix® ,
Vorwerk, Wuppertal, Germany) for a period of 10 min, and after this, the samples were processed in
the same way as the canned samples.
For the analysis of elements, mussel samples were acid-digested with the aid of a microwave
digester (Ethos Up, Milestone SRL, Italy). Briefly, 500 mg of mussel homogenate were weighed into
the digestion vessels, and 50 µL of the internal standard solution (Sc (scandium), Ge (germanium),
Rh (rhodium), and Ir (iridium) at a stock concentration of 20 mg/mL each) were added. Next, 2.5 mL
of concentrated sub-boiling HNO3 (65%) and 7.5 mL of Milli-Q water were added to each sample.
All samples were digested according to the following program: Step 1: a power (W), temperature (◦ C),
and time (min) of 1800, 100, and 5, respectively; Step 2: 1800, 150, and 5; Step 3: 1800, 200, and 8; Step 4:
1800, 200, and 7. After cooling, the digests were transferred into conic bottom polypropylene tubes andNutrients 2019, 11, 864 4 of 18
diluted up to 15 mL with Mili-Q water. Finally, an aliquot of each sample was taken for the analysis.
Reagent blanks were prepared similarly to the samples, and a reagent blank was included every 14
samples in the analytical batch.
For the instrumental analyses, we employed an Agilent 7900 ICP-MS (Agilent Technologies, Tokyo,
Japan) equipped with standard nickel cones and a cross-flow nebulizer with a Make Up Gas Port
(×400 Nebulizer, Savillex Corporation, MN, USA) for all measurements. All the data were acquired
and processed with Agilent MassHunter Data Analysis software (version 4.2, Agilent Technologies,
Palo Alto, CA, USA). On a daily basis, the ICP-MS was optimized using a tuning solution consisting of
a mixture of Cs (cesium), Co (cobalt), Li (lithium), Mg (magnesium), Tl (thallium), and Y (yttrium)
(Agilent Technologies, Palo Alto, CA, USA). All measurements were performed in triplicate from
each vial.
The entire/complete procedure was validated prior to its use in the analyses of samples. Recoveries
obtained ranged from 87 to 118% for toxic and essential elements. Linear calibration curves were found
for all elements (regression coefficients ≥0.998). Instrumental LODs and LOQs were calculated as the
concentration of the element that produced a signal that was three and ten times higher than that of
the averaged blanks, respectively. The sample LOQs were calculated by multiplying the instrumental
LOQ by the dilution factor suffered by the sample during the digestion procedure (1:10 v:v).
2.4. Dietary Intake Estimates, Nutritional and Health Risk Assessment
For the estimation of the intake of elements, the total consumption of mussels was taken into
account. That is, the consumption of each mussel type (g/day) [19] was multiplied by the median
values of each element (ng/g fresh weight) in that type of mussel. The total consumption of each
element (ng/kg body weight/day) was obtained by adding the individual consumptions obtained
for canned, fresh, and frozen mussels. Both average consumers and high consumers (those in the
97.5th percentile (P97.5 )) were considered, and the estimations were done for two age groups: adults
(>17 years) and children (7 to 12 years).
For the estimation of the risk–benefit ratio, the values of estimated daily intake (EDI) of elements
for each scenario (average and high consumers) and age group were compared with the reference
values. As dietary reference values (in the case of the essential elements, DRVs), the population
reference intake (PRI) values as reported by the European Food Safety Authority (EFSA) [20] were
used. According to the European standard, the PRI is the equivalent of the recommended dietary
allowances (RDAs) in the USA, that is, the daily dietary intake level of a nutrient considered sufficient
to meet the requirements of 97.5% of healthy individuals in each life stage and sex group. In those cases
in which the EFSA has not reported the PRI, the adequate intake (AI) was employed as the reference
value. AI is the average nutrient level consumed daily by a typical healthy population that is assumed
to be adequate for the population’s needs. For those estimates of essential elements that exceeded the
PRI or AI, the tolerable upper daily intake level (UL) was considered as well. The UL is the maximum
level of total chronic intake of a nutrient from all sources judged to be unlikely to pose a risk of adverse
health effects in humans [21,22]. As toxic reference values (TRVs), the non-carcinogen tolerable daily
intake (TDI) values from the US EPA [23] were employed. No TRV has been established for Pd and Th,
so these two elements were excluded from the risk analysis. No official TRV has been established either
for the REEs or the other MEs included in this research. However, some authors have proposed a daily
allowable intake of 61 µg/kg body weight (bw) for rare earth oxides [24,25], which was certificated
from human health surveys in REE mining areas and animal experimental results. We employed this
value as the TRV for these elements, considered as a group (sum REEs).
2.5. Statistical Analysis
Descriptive analyses were conducted for all variables. Arithmetic means, standard deviation
(SD), medians, and ranges were calculated for continuous variables. To those data below the LOQ butNutrients 2019, 11, 864 5 of 18
above the LOD, a random value between those two limits was assigned. Those data below LOD were
considered as non-detected.
The normality of the data was tested using both the Kolgomorov–Smirnov test (with
Dallal–Wilkinson–Lilie for p values), and the D’Agostin—Pearson omnibus test. As expected, most of
the data series did not follow a normal distribution. Consequently, we chose not to assume a normal
distribution in any case, and comparisons between the groups were performed using non-parametric
tests (Kruskal–Wallis test or Mann–Whitney U test).
We used PASW Statistics v 25.0 (SPSS Inc., Chicago, IL, USA) to manage the database of the
study and to perform statistical analyses. Probability levels ofNutrients 2019, 11, 864 6 of 18
Table 2. Concentrations of essential in mussels from different types of conservation in the Spanish market. Results are expressed in ng/g.
Preserved Mussels Frozen Mussels Fresh Mussels
p Value a
(n = 88) (n = 80) (n = 20)
Preserved Preserved Frozen vs.
Element Mean ± SD Median P25–P75 Mean ± SD Median P25–P75 Mean ± SD Median P25–P75
vs. Frozen vs. Fresh Fresh
34,945.1 ± 45,965.2 ± 24,427.6 ±
Fe 33,376.0 25,848.3–41,727.6 32,310.0 26,713.1–50,700.1 22,924.9 20,137.1–26,850.9 n.s.Nutrients 2019, 11, 864 7 of 18
Table 3. Concentrations of toxic elements in mussels from different types of conservation in the Spanish market. Results are expressed in ng/g.
Preserved Mussels Frozen Mussels Fresh Mussels
p Value a
(n = 88) (n = 80) (n = 20)
Preserved Preserved Frozen vs.
Element Mean ± SD Median P25–P75 Mean ± SD Median P25–P75 Mean ± SD Median P25–P75
vs. Frozen vs. Fresh Fresh
Major Toxic Elements
1869.8 ± 4008.1 ± 3696.5 ±
As 1641.9 1522.5–1973.1 3377.3 3017.5–4992.0 3785.0 3395.5–3994.6Nutrients 2019, 11, 864 8 of 18
In the main body of the article, we decided to present the results obtained according to the type
of conservation of the mussels, since we consider that it is one of the factors that most influences the
way in which the final consumer will be exposed. However, we have made other types of analysis,
considering the origin of production of the mussels, the type of brand (store brands vs. name brands),
and the type of production (conventional vs. organic). We present the results of these secondary
analyses as supplementary material (Tables S2–S4). Thus, one of the factors that seems to have a
decisive influence on the content of both trace elements and toxic elements of the mussels is their
geographical origin. In this research, we sampled mussels from three different geographical regions:
Galicia (Spain), Chile, and New Zealand, and statistically significant differences were found. Thus,
the mussels of New Zealand presented the highest levels not only of Fe, Mn, Mo, Cr, Co, and Ni but
also of As, Cd, Hg, Al, Ba, Sr, Th, Tl, and the sum of REEs. This latter case is particularly striking since
the levels of these elements in New Zealand mussels is around six times higher than those from the
other origins. On the other hand, Galician mussels presented much higher levels of Pb and of Zn, Cu,
Ag, Be, and Sn, although in this latter case it should be taken into account that canned mussels from
Galician origin are over-represented in this study, given their high presence in the Spanish market
(Table S2), and, as said above, Sn content is higher in canned mussels.
With mussels produced in Galicia, we could also make a comparison between those that were
used for canning in store brands and those canned under name brands, and we also found several
statistically significant differences between the two types of branding. Thus, store brands presented
significantly higher levels of not only 4 trace elements (Fe, Zn, Ni, and Cr) but also of two toxic elements
(As and Hg) compared with those of the mussels of name brands (Table S3). Pb levels were also slightly
higher in store brands as well, although this difference did not reach statistical significance. On the
contrary, name brands presented significantly higher levels of Ag, Ba, Be, Th, and the sum of REEs
compared with those of the store brands.
Finally, it is very interesting to note that we also observed that the concentrations of most of the
elements (including the toxic As, Hg, Pb, Ag, Ba, and U) were significantly higher in the mussels of
conventional production than in those of organic production (Table S4). The only exception was Al,
which was significantly more concentrated in organically produced mussels than in conventionally
produced ones. Additionally, in this case, we made the comparison between mussels from Galicia
(in this case, all of them were frozen mussels), given that among those of other origins or modes of
conservation we did not find organic brands in the Spanish market.
According to the legal limits, the only element for which the maximum residue limits were
exceeded was Cd (EU-MRL = 1 mg/kg ww [26]). This limit was exceeded in four samples of frozen
mussels from Chile, whereas the other four samples of frozen mussels, also from Chile, reached around
90% of this MRL. In relation to Hg, none of the samples exceeded the MRL established in the EU
(0.5 mg/kg ww [27]), and all the samples analyzed were well below this value. The most contaminated
sample in the whole series barely reached 10% of this legal limit. Regarding the Pb content, all the
concentrations were below the established limit (1.5 mg/kg ww [28]), and the most contaminated
sample did not even reach the 12 EU-LMR. No legal limits of As nor the rest of the elements studied
have been established in the EU for mussels, so we cannot put the levels found for these elements in a
legal context.
3.2. Estimated Daily Intake of Essential and Toxic Elements and Risk Assessment
The results of the estimation of the daily intake (EDI) of essential elements are presented in Table 4,
and those of toxic elements in Tables 5 and 6. The estimation can be considered as quite accurate,
since the partial contributions of the different types of mussels to the Spanish diet have been taken
into account. This is very important, since, as we have seen in the previous section, there are notable
differences in the concentrations of elements, depending on how they are conserved, so the exposure
should be calculated on the basis of the real consumption of each type of mussels.Nutrients 2019, 11, 864 9 of 18
Table 4. Estimated daily intake of essential elements through the consumption of mussels by adults
and children.
Adults (>17 y.o.)—68.48 kg/bw—Both Genders
EDI Average Consumer EDI High Consumer (P97.5 )
Essential Element Dietary Reference Value a
(µg/kg bw/day) b (µg/kg bw/day) c
Fe 160.63 d 24.89 74.41
Zn 175.23 d 34.45 105.54
Cu 18.98 e 1.09 3.33
Se 1.02 e 0.69 2.18
Mn 43.81 e 1.06 3.25
Mo 0.95 e 0.14 0.42
Co 0.12 d 0.04 0.12
Children (7–12 y.o.)—34.48 kg/bw—Both Genders
EDI Average Consumer EDI High Consumer (P97.5 )
Essential Element Dietary Reference Value a
(µg/kg bw/day) b (µg/kg bw/day) c
Fe 160.63 d 23.57 62.72
Zn 108.06 d 35.34 99.31
Cu 14.60 e 1.11 3.10
Se 0.51 e 0.77 2.29
Mn 21.90 e 1.09 3.05
Mo 0.37 e 0.14 0.40
Co 0.12 d 0.04 0.12
a b
For comparison purposes, the DRVs have been expressed in µg/kg·bw/day. A consumption of 31.94 g/day
of preserved mussels, 22.44 g/day of fresh mussels, and 1.87 g/day of frozen mussels in adults or 11.17 g/day of
preserved mussels, 15.96 g/day of fresh mussels, and 1.32 g/day of frozen mussels in children. c A consumption of
87.98 g/day of preserved mussels, 76.8 g/day of fresh mussels, and 6.4 g/day of frozen mussels in adults or 21.86 g/day
of preserved mussels, 52.6 g/day of fresh mussels, and 4.4 g/day of frozen mussels in children. d Population
reference intake is the term employed by the European Food Safety Authority (EFSA) instead of the recommended
dietary allowance (RDA) and represents the daily dietary intake level of a nutrient considered sufficient to meet the
requirements of 97.5% of healthy individuals in each life-stage and sex group. e Adequate intake as defined by the
EFSA. It represents the amount established that is firmly believed to be adequate for everyone in the demographic
group where no recommended dietary allowance (RDA) has been established. When a range of different values for
males and females was found, we considered the average value. y.o. years old
Given that the differences in the consumption data between men and women (or boys and
girls) are minimal [19], we considered it unnecessary to include the comparison between sexes and
have presented the results for adults and children, in general, without the consideration of sex. It is
noteworthy that the normalized daily intakes per kilo of body weight are practically identical in both
adults and children, because the annual consumption of mussels is also practically half in this age
group (10.4 kg/year in children vs. 20.5 kg/year in adults), but the average weight of children is half as
well. Even so, small differences are observed since the proportions of consumption of the different
types of mussels vary between children and adults (adults consume more canned mussels than fresh
mussels; in children, however, it is the reverse).
As summarized in Tables 4–6, we have considered two groups of consumers: those in the average
consumption and large consumption groups, considering as such those in P97.5 . It can be observed that
in the latter the exposure to all the elements is approximately three times that in the average consumer,
as the mussel consumption is almost triple as well.Nutrients 2019, 11, 864 10 of 18
As is logical, regardless of the level of consumption of mussels, the exposure to elements in
quantitative terms faithfully follows the concentrations found in the mussels, except in the case of
arsenic. That is to say, the highest EDIs are those of Zn, Fe, and Al, followed at a distance by Sr, Cu,
and Mo. As EDI does not follow the order of concentrations, although in the previous section we
saw that As is one of the most abundant elements in mussels, due to the fact that for the EDI we only
considered the fraction of inorganic As (estimated at 3.5% as indicated by the EFSA [29]).
However, the most relevant findings arise when the EDIs are compared to dietary or toxic reference
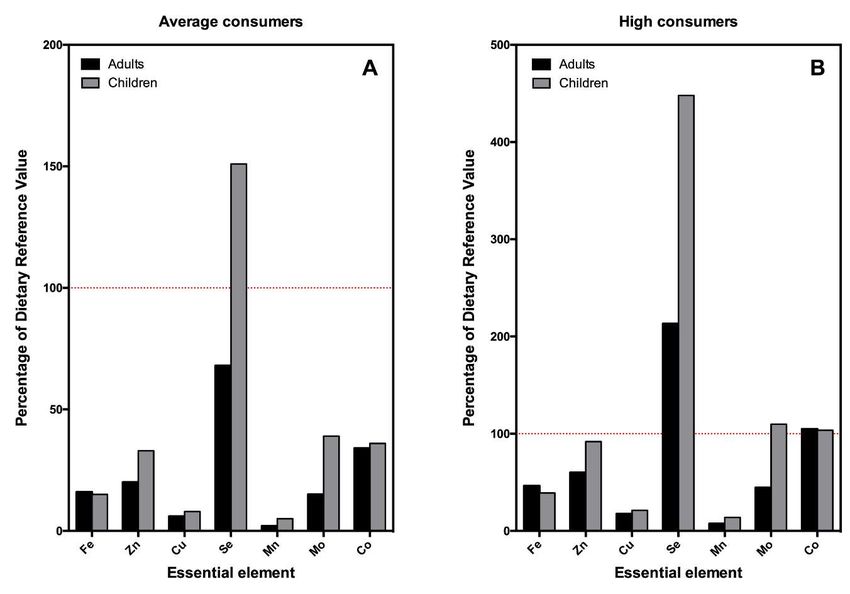
levels, which are shown in Figures 1 and 2 (essential and toxic elements, respectively). The average
adult consumer of mussels obtains between 2 (Mn) and 70% (Se) of the daily requirements of essential
elements through the consumption of mussels. In the case of children, this contribution is superior
in all cases. In neither of the two age groups does the average consumption of this food seem to
represent a very high risk due to exposure to As, Cd, Hg, or Pb, nor any of the rest of the toxic or
potentially toxic elements studied. However, it is important to note that, in children, the levels of
exposure to inorganic As and Cd would reach around 26% and 22% of the reference levels, respectively
(Figures 1A and 2A). It is also noteworthy that, in those with high mussel consumption, these levels of
exposure multiply, reaching almost 77% of the reference values for As in children and 62% of that of
Cd (Figures 1B and 2B).
Table 5. Estimated daily intake of major toxic elements through the consumption of mussels in adults
and children.
Adults (>17 y.o.)—68.48 kg/bw—Both Genders
EDI Average Consumer EDI High Consumer (P97.5 )
Toxic Element Risk Reference Value a
(µg/kg bw/day) b (µg/kg bw/day) c
iAs d 0.30 0.07 0.22
Cd 1.00 0.21 0.65
MeHg e 0.10 0.01 0.03
Pb 6.00 0.16 0.49
Children (7–12 y.o.)—34.48 kg/bw—Both Genders
EDI Average Consumer EDI High Consumer (P97.5 )
Toxic Element Risk Reference Value a
(µg/kg bw/day) b (µg/kg bw/day) c
iAs d 0.30 0.08 0.23
Cd 1.00 0.21 0.62
MeHg e 0.10 0.01 0.03
Pb 6.00 0.16 0.46
aWe have employed as risk reference values (RRVs) the non-carcinogen tolerable daily intake (TDI) values from the
US EPA. For comparison purposes, the RRVs have been expressed in µg/kg bw/day. b A consumption of 31.94 g/day
of preserved mussels, 22.44 g/day of fresh mussels, and 1.87 g/day of frozen mussels in adults or 11.17 g/day of
preserved mussels, 15.96 g/day of fresh mussels, and 1.32 g/day of frozen mussels in children. c A consumption of
87.98 g/day of preserved mussels, 76.8 g/day of fresh mussels, and 6.4 g/day of frozen mussels in adults or 21.86 g/day
of preserved mussels, 52.6 g/day of fresh mussels, and 4.4 g/day of frozen mussels in children. d Although in this
work we have not made arsenic speciation, we have taken the scientific consensus with respect to arsenic in seafood
as a reference, and considered that the inorganic arsenic content in mussels is 3.5% of the As measured. e We were
not able to perform mercury speciation, but it has been established that in fish and seafood the percentage of the
methyl form normally seems to vary between 50 and 80%. We were conservatively estimated that 80% of the total
mercury in the mussels is in the form of methylmercury. y.o. years oldNutrients 2019, 11, 864 11 of 18
Table 6. Estimated daily intake of other toxic or potentially toxic elements through the consumption of
mussels in adults and children.
Adults (>17 y.o.)—68.48 kg bw—Both Genders
EDI Average Consumer EDI High Consumer (P97.5 )
Element Risk Reference Value a
(µg/kg bw/day) b (µg/kg bw/day) c
Ag 5 0.00 0.01
Al 1000 26.48 78.21
Ba 200 0.22 0.66
Be 2 0.00 0.01
Cd 3,00 0,09 0,27
Ni 20,00 0,10 0,32
Pd N.A. 0.00 0.00
Sb 0.4 0.00 0.01
Sn 600 0.01 0.04
Sr 600 5.77 17.96
Th NA 0.01 0.02
Tl 0.07 0.00 0.00
U 3 0.03 0.08
Sum REE 61 0.59 1.97
Children (7–12 y.o.)—34.48 kg bw—Both Genders
EDI Average Consumer EDI High Consumer (P97.5 )
Element Risk Reference Value a
(µg/kg bw/day) b (µg/kg bw/day) c
Ag 5 0.00 0.01
Al 1000 24.04 61.99
Ba 200 0.21 0.54
Be 2 0.00 0.01
Cd 3.0 0.09 0.25
Ni 20.00 0.11 0.31
Pd NA 0.00 0.00
Sb 0.4 0.00 0.01
Sn 600 0.01 0.03
Sr 600 6.22 18.01
Th NA 0.01 0.02
Tl 0.07 0.00 0.00
U 3 0.03 0.07
Sum REE d 61 0.78 2.51
a We have employed as RRVs the non-carcinogen TDI values from US EPA. For comparison purposes, the RRVs
have been expressed in µg/kg bw/day. The REEs have been considered as a sum and compared to the TRV proposed
by other authors [24,25]. b A consumption of 31.94 g/day of preserved mussels, 22.44 g/day of fresh mussels,
and 1.87 g/day of frozen mussels in adults or 11.17 g/day of preserved mussels, 15.96 g/day of fresh mussels,
and 1.32 g/day of frozen mussels in children. c A consumption of 87.98 g/day of preserved mussels, 76.8 g/day of
fresh mussels, and 6.4 g/day of frozen mussels in adults or 21.86 g/day of preserved mussels, 52.6 g/day of fresh
mussels, and 4.4 g/day of frozen mussels in children. d This is the sum of the individual concentrations of Ce, Dy, Er,
Eu, Ga, Gd, Ho, In, La, Lu, Nb, Nd, Pr, Sm, Ta, Tb, Tm, Y, and Yb.Nutrients 2019, 10, x FOR PEER REVIEW 5 of 18
Nutrients 2019, 11, 864 12 of 18
Nutrients 2019, 10, x FOR PEER REVIEW 5 of 18
Figure 1. Bar plot indicating the percentage of the dietary reference values (DRVs) of essential
elements
Figure 1. provided
FigureBar1. plot by the
Bar indicating
plot consumption
indicating of mussels
the percentage in adults
of theofdietary
the percentage the and
reference
dietary children.
values
reference (A)(DRVs)
(DRVs)
values Averageof consumption
of essential elements
essential
(percentile 50); (B) high consumption (percentile 97.5). Red dotted line indicates 100%
elements provided by the consumption of mussels in adults and children. (A) Average consumption
provided by the consumption of mussels in adults and children. (A) Average of
consumption the DRVs of
(percentile
each (percentile
50); element. Shaded
(B) high consumption area consumption
50); (B) high between lines
(percentile indicates.
(percentile
97.5). Red 97.5). Red dotted line indicates 100% of the DRVselement.
dotted line indicates 100% of the DRVs of each of
Shadedeacharea
element.
betweenShaded area
lines between lines indicates.
indicates.
Figure 2. Bar plot indicating the percentage of the TDI of toxic elements provided by the
consumption
Figure 2. Bar plotofindicating
mussels inthe
adults and children.
percentage of the (A)
TDIAverage
of toxicconsumption (percentile
elements provided 50); consumption
by the (B) high
Figure 2. Bar plot indicating the percentage of the TDI of toxic elements provided
of mussels in adults and children. (A) Average consumption (percentile 50); (B) high consumption by the
consumption of mussels in adults and children. (A) Average consumption (percentile 50);
(percentile 97.5). Red dotted line indicates 100% of the TDI of each element. Red dotted line indicates (B) high1
2
TDI of each element.Nutrients 2019, 11, 864 13 of 18
4. Discussion
This study represents a very accurate approximation of the risk–benefit relationship of exposure to
trace elements through the consumption of mussels in the Spanish population. An exhaustive sampling
of mussels has been performed, attempting to reflect all the possible varieties that are acquired by
consumers, and a comprehensive determination of the content of elements has been made, covering all
the essential elements, a very large group of well-known toxic elements [30], and even those that are
currently being considered as potentially toxic or at least emerging contaminants of concern (the REEs
and other MEs related to the high technology industry) [18].
Firstly, regarding sampling, our main interest has been to evaluate as closely as possible the
exposure of Spanish consumers to elements. Numerous studies have described differences in the
levels of elements in mussels due to a multitude of variables. It should be considered that elements
in a marine environment have a more complex distribution than organic pollutants and reflect more
faithfully local anthropogenic inputs, natural sources, and hydrological conditions [31]. Therefore,
one of the most important of these variables is the geographical origin of the said mussels, which in
turn is related to the water quality of these regions [32–38]. However, according to food consumption
surveys, geographic origin is not the most important criterion that guides the purchase of mussels
by Spanish consumers, but their type of conservation. For this reason, in the design of the sampling,
we tried to reflect the different available varieties of the three types of mussels that are chosen by the
consumers of this country: fresh, canned, and frozen.
Very few studies have compared the differences in the element content according to the mode of
conservation of mussels [15,16], and as far as we know, none has included these three types of mussels.
In the mentioned papers, the authors investigated the differences in the content of some essential (Cu,
Mn, Se, and Zn) and toxic (Hg, Cd, Pb, Ag, and As) elements in a wide range of fresh, preserved,
and frozen fishery products. However, these authors did not include frozen mussels, and the number
of fresh and canned mussel samples studied was very small (n = 11 and 12, respectively) [15,16].
The results of these studies showed that there are significant differences in the concentrations of
elements of fishery products depending on their mode of conservation, including mussels. Our results
confirm that the differences according to the mode of conservation are remarkable in the case of this
mollusk, preserved mussels being those that in general have lower concentrations of elements. This is
possibly related to a smaller size and age of the mussels that are used in the bulk of the canning
industry (12 to 16 medium-size mussels per can is the most usual form of marketing) since most
metals bioaccumulate throughout life and lower concentrations are expected in the earlier stages of
life (medium-small size mussels). However, regardless of the size, canned mussels have the highest
levels of Al and Sn, probably as a result of contamination from the packaging in metal cans containing
these elements.
Nevertheless, although we have focused mainly on the conservation mode of the mussels when
building our exposure model, other variables such as geographical origin, mode of production,
and type of brand were recorded as well. With these variables, we could not force theoretical models
of consumption (for example, consumers of only organic products or consumers of only store brands)
because not all varieties are available, and therefore they could not all be sampled. However, we would
like to highlight some of the results obtained for some of these variables, since such results have never
been reported. As far as we know, this study is the first to compare canned mussels of name brands
with those of store brands. Surprisingly, although all mussels compared had the same origin (Galicia,
Spain), we found significant differences. Mussels of store brands contain slightly higher levels of all the
elements (both essential and toxic). This could indicate that mussels of slightly lower quality are used
to make these cheaper brands, although the differences are scarcely relevant. The opposite occurs when
we compare mussels of conventional production with those of organic production (all of them frozen
and of name brands), with the mussels of organic production being those that present lower contents of
elements (either essential or toxic). This could be linked to the conditions of the controlled production
that organic mussel farming must meet for its certification requirements, which are, for example,Nutrients 2019, 11, 864 14 of 18
a controlled source of the seed, a production unit below 500 rafts and always at a depth of less
than 20 m, and the prohibition of some paints [39]. Thereby, more studies should be carried out to
understand and confirm those differences since this type of production is in continuous development
and economic growth.
According to the exposure estimates for our typical consumer (a Spanish consumer that eats 50%
fresh mussels, 40% canned mussels, and 10% frozen mussels), we can summarize that for the average
consumption there is a good balance between a moderate to high contribution of trace elements and a
moderately low contribution of toxic elements. However, the estimates for toxic elements, in particular
As and Cd, can be worrisome, especially in the high percentile of consumption.
Thus, with respect to essential elements, the contribution of mussels to the intake of Se is
particularly noteworthy. A regular consumption of this food would contribute almost 70% of the
requirements of Se of adults and 150% of those of children. The contribution of Se from mussels is
so striking that children who are large consumers would intake up to 500% of their daily nutritional
requirements. This contribution would be even higher (more than double) if only fresh mussels were
consumed, surpassing around 3–10 times the DRV for this element. However, this contribution is still
far from reaching the UL for this element, so it would not pose a real problem of toxicity. This finding
is important as Se is a trace element required for different biological functions and is increasingly
considered to be a key nutraceutical component. Thus, selenoproteins play a variety of functions,
including antioxidant effects, T-cell immunity and implications in the thyroid hormone, and skeletal
and cardiac metabolism [40]. In terms of percentage of DRVs, the second element would be Co.
The nutritional requirements of Co are not high (of the order of 0.1 µg/kg/day); it is even considered a
toxic heavy metal which can cause toxic cardiomyopathy or polycythemia when the exposure to it is
excessive [41]. The nutritional contribution of Co is fundamentally associated with the vitamin B12
content of the food. Therefore, given that it has been widely described that mussels are rich in vitamin
B12 [42], it is not surprising that the average consumption of these molluscs represents a contribution
of around 40% of the daily requirements of Co. With regard to the rest of the essential elements, mussel
consumption is also a high source of Zn, Mo, and Fe. For Zn, a moderate consumption of mussels
contributes 20% of the nutritional requirements in adults and up to 35% in children. Zn is a key
component of cells and plays a role in the mechanism of action of several crucial enzymes, some of
them implicated in the binding of RNA molecules and protein–protein interactions [43]. In the case of
Mo, mussel consumption contributes around 15% of the daily requirement in adults and up to 40%
in children. This contribution would be even higher (almost double) if only preserved mussels were
consumed. Mo is an essential component of certain enzymes that catalyze redox reactions and is also
required for enzymes involved in the metabolism of aromatic aldehydes and the catabolism of amino
acids [44]. With regard to the contribution of mussels to Fe intake, these account for around 15% of the
nutritional requirements in both adults and children. The wide range of roles played by this metal is
well known, as it is essential for the maintenance of basic life functions in the form of hemoglobin and
is also necessary for electron transfer, oxidase activities, and energy metabolism [45]. On the contrary,
mussels represent only a discrete source of Cu or Mn (less than 7% and 4% of their respective DRVs).
Besides these seven essential elements, the exposure to 36 other toxic or potentially toxic elements
through the consumption of mussels was assessed. In general terms, it can be considered that, for the
average consumer, mussels pose a very moderate risk of exposure to toxic elements, As, Cd, and Hg
being those that reach higher levels. One of the most worrying values is that of the Cd, since, although
an average consumer would be exposed to 20% of Cd-TDI, by virtue of the concentrations found,
a child consumer who eats only frozen mussels could be exposed to this element so that it reaches up
to 40% or even 90%, whether in an average or a high consumer of mussels, respectively. Obviously,
this would imply that this type of consumer would greatly exceed the TDI of Cd if the total diet is
considered. Something similar happens with As. Our model assumed that 3.5% of the As measured in
the mussels is in the most toxic form, the inorganic As [29]. With these estimated values, an average
consumer of mussels (whether a child or an adult) would be exposed to approximately 23–25% ofNutrients 2019, 11, 864 15 of 18
the TDI of this element, which, although being relatively high value, is far from representing a real
problem of public health. However, it should be noted that mussel consumers in the high percentile
would be exposed to up to 75% of the toxicity reference value for this element, and could even surpass
it if they only consumed fresh or frozen mussels. The other toxic element that can be worrisome is Hg,
as it has also been described in fish [46,47]. Furthermore, in this case, we have made an assumption,
which is that 80% of the total measured is in the most toxic form (methylmercury) [48]. In that case,
an average consumer would reach around 10% of the TDI, but this value would increase more than
three times (>33% TDI) in individuals with high mussel consumption, which is especially worrisome
in children, given the special vulnerability of their developing nervous system to the toxic effects of
this heavy metal [48].
Of the rest of the toxic elements investigated, none exceeds 3% of their respective TDI. Among
them, there are elements whose toxicity has been demonstrated, and in fact, they have been included
in the priority list published every two years by the ATSDR [30] as elements that are also of increasing
concern because of their growing appearance as emerging environmental pollutants, as is the case of the
REEs [18]. For many of these, evidence of their toxicity is being provided by many researchers around
the world [49–51]. Recent studies have shown that mussels can accumulate these kinds of elements as
well [8,9] and might even be adversely affected by their presence [52]. In any case, according to the
results of this study, neither the REEs nor the toxic elements included in the ATSDR list pose a relevant
risk associated with the consumption of mussels.
Finally, it is important to note that, although the risks estimated in this study are not high, in this
model we have only considered mussel intake, and this should be taken into account in the global
risk assessment. Obviously, mussels are not the only pathway to the exposure to harmful elements in
humans, but other relevant foods and other sources, such as soil ingestion, dust inhalation, and dermal
contact, should be considered as well. The actual risk is the sum of all the exposure pathways and can
be much higher than the ones obtained in this study.
5. Conclusions
For the great majority of elements, there are significant differences in the levels of elements
depending on the mode of conservation of the mussels. In general, we found that canned mussels
were the ones that presented the lowest concentrations of essential and toxic elements, except Al
and Sn, which are two elements employed in the manufacture of cans. We also found significant
differences according to the geographic origin, the mode of production, and the type of brand. These are
interesting variables, but perhaps they condition less the consumer’s decision when buying mussels
(and consequently also their exposure to essential and toxic elements) than they do the mode of
preservation of this mollusk. Our exposure model indicates that the average consumption of mussels
by the Spanish population (around 20 kg/year in adults and 10 kg/year in children) represents a valuable
contribution of essential elements, particularly Se, Co, Zn, Fe, and Mo, without supposing a high risk
derived from the exposure to toxic elements. However, there are some worrying aspects, such as the
relatively high levels of Cd and As, which might cause high percentages in the reference values for
toxicity that could be reached in the case of high consumption of these mollusks. This suggests that a
moderate consumption of mussels should be recommended.
Supplementary Materials: The following are available online at http://www.mdpi.com/2072-6643/11/4/864/s1.
Table S1: Concentrations of rare earth elements and other minority elements in preserved, fresh, and frozen
mussels. Median values are provided and expressed in ng/gfresh weight . Table S2: Concentrations of essential and
toxic elements in frozen mussels from three different production areas. Median values are provided and expressed
in ng/gfresh weight . Table S3: Concentrations of essential and toxic elements in preserved mussels from name and
store brands. Median values are provided and expressed in ng/gfresh weight . Table S4: Concentrations of essential
and toxic elements in frozen mussels produced under two different production methods. Median values are
provided and expressed in ng/gfresh weight .Nutrients 2019, 11, 864 16 of 18
Author Contributions: conceptualization: O.P.L. and M.Z.; methodology: O.P.L., Á.R.-H., and M.Z.; validation:
O.P.L., Á.R.-H., and M.Z.; formal analysis: M.Z. and Á.R.H.; investigation: L.D.B. and L.A.H.-H.; data
curation: O.P.L. and L.A.H.-H.; writing—original draft preparation: Á.R.-H.; writing—review and editing:
O.P.L.; visualization: L.D.B.; supervision: O.P.L.; project administration: L.D.B. and O.P.L.
Funding: This research received no external funding.
Conflicts of Interest: The authors declare no conflict of interest.
References
1. Oehlenschlager, J. Seafood: Nutritional benefits and risk aspects. Int. J. Vitam. Nutr. Res. 2012, 82, 168–176.
[CrossRef] [PubMed]
2. Arnich, N.; Sirot, V.; Rivière, G.; Jean, J.; Noël, L.; Guérin, T.; Leblanc, J.-C. Dietary exposure to trace elements
and health risk assessment in the 2nd French Total Diet Study. Food Chem. Toxicol. 2012, 50, 2432–2449.
[CrossRef] [PubMed]
3. MAGRAMA (Ministerio de Agricultura, Alimentación y Medio Ambiente). El mercado del mejillón en España;
MAGRAMA: Madrid, Spain, 2015; pp. 1–29.
4. Chasapis, C.T.; Loutsidou, A.C.; Spiliopoulou, C.A.; Stefanidou, M.E. Zinc and human health: An update.
Arch. Toxicol. 2012, 86, 521–534. [CrossRef] [PubMed]
5. Rodríguez-Hernández, Á.; Camacho, M.; Henríquez-Hernández, L.A.; Boada, L.D.; Valerón, P.F.;
Zaccaroni, A.; Zumbado, M.; Almeida-González, M.; Rial-Berriel, C.; Luzardo, O.P. Comparative study of
the intake of toxic persistent and semi persistent pollutants through the consumption of fish and seafood
from two modes of production (wild-caught and farmed). Sci. Total Environ. 2017, 575, 919–931. [CrossRef]
[PubMed]
6. Miniero, R.; Abate, V.; Brambilla, G.; Davoli, E.; De Felip, E.; De Filippis, S.P.; Dellatte, E.; De Luca, S.;
Fanelli, R.; Fattore, E.; et al. Persistent toxic substances in Mediterranean aquatic species. Sci. Total Environ.
2014, 494–495, 18–27. [CrossRef]
7. Bogdanović, T.; Ujević, I.; Sedak, M.; Listeš, E.; Šimat, V.; Petričević, S.; Poljak, V. As, Cd, Hg and Pb in
four edible shellfish species from breeding and harvesting areas along the eastern Adriatic Coast, Croatia.
Food Chem. 2014, 146, 197–203. [CrossRef]
8. MacMillan, G.A.; Chetelat, J.; Heath, J.P.; Mickpegak, R.; Amyot, M. Rare earth elements in freshwater,
marine, and terrestrial ecosystems in the eastern Canadian Arctic. Environ. Sci. Process. Impacts 2017, 19,
1336–1345. [CrossRef]
9. Perrat, E.; Parant, M.; Py, J.S.; Rosin, C.; Cossu-Leguille, C. Bioaccumulation of gadolinium in freshwater
bivalves. Environ. Sci. Pollut. Res. 2017, 24, 12405–12415. [CrossRef]
10. Beyer, J.; Green, N.W.; Brooks, S.; Allan, I.J.; Ruus, A.; Gomes, T.; Brate, I.L.N.; Schoyen, M. Blue mussels
(Mytilus edulis spp.) as sentinel organisms in coastal pollution monitoring: A review. Mar. Environ. Res.
2017, 130, 338–365. [CrossRef]
11. Pieniak, Z.; Verbeke, W.; Scholderer, J. Health-related beliefs and consumer knowledge as determinants of
fish consumption. J. Hum. Nutr. Diet. 2010, 23, 480–488. [CrossRef]
12. Mol, S.; Alakavuk, D.U. Heavy metals in mussels (Mytilus galloprovincialis) from Marmara sea, Turkey.
Biol Trace Elem. Res. 2011, 141, 184–191. [CrossRef]
13. González Laxe, F.; Martín Palmero, F. El mercado de mejillón en España. Distribución y Consumo 2014, 102,
1–10.
14. MAGRAMA (Ministerio de Agricultura, Alimentación y Medio Ambiente). El mercado del mejillón en España;
Ministry of Agriculture, Food and Environment: Madrid, Spain, 2017; pp. 1–48.
15. Olmedo, P.; Hernandez, A.F.; Pla, A.; Femia, P.; Navas-Acien, A.; Gil, F. Determination of essential elements
(copper, manganese, selenium and zinc) in fish and shellfish samples. Risk and nutritional assessment and
mercury-selenium balance. Food Chem. Toxicol. 2013, 62, 299–307. [CrossRef] [PubMed]
16. Olmedo, P.; Pla, A.; Hernandez, A.F.; Barbier, F.; Ayouni, L.; Gil, F. Determination of toxic elements (mercury,
cadmium, lead, tin and arsenic) in fish and shellfish samples. Risk assessment for the consumers. Environ. Int.
2013, 59, 63–72. [CrossRef]
17. Hussain, M.; Mumtaz, S. E-waste: Impacts, issues and management strategies. Rev. Environ. Health 2014, 29,
53–58. [CrossRef]Nutrients 2019, 11, 864 17 of 18
18. Tansel, B. From electronic consumer products to e-wastes: Global outlook, waste quantities, recycling
challenges. Environ. Int. 2017, 98, 35–45. [CrossRef] [PubMed]
19. AECOSAN. ENIDE: National Survey of Dietary Intake (2009–2010); Results on Consumption Data; Agencia
Española de Seguridad Alimentaria y Nutrición; Gobierno de España: Madrid, Spain, 2011.
20. EFSA. Dietary Reference Value Finder. Available online: https://www.efsa.europa.eu/en/interactive-pages/
drvs (accessed on 22 February 2019).
21. European Food Safety Authority (EFSA). Scientific Committee on Food Scientific Panel on Dietetic Products,
Nutrition and Allergies; Tolerable Upper Intake Levels for Vitamins and Minerals; European Food Safety
Authority: Parma, Italy, 2006; pp. 1–482.
22. WHO. Assessment of Prenatal Exposure to Mercury: Standard Operating Procedures; WHO: Geneva,
Switzerland, 2018.
23. EPA. Integrated Risk Information System. Available online: https://www.epa.gov/iris (accessed on 22
February 2019).
24. Zhuang, M.; Wang, L.; Wu, G.; Wang, K.; Jiang, X.; Liu, T.; Xiao, P.; Yu, L.; Jiang, Y.; Song, J.; et al. Health risk
assessment of rare earth elements in cereals from mining area in Shandong, China. Sci. Rep. 2017, 7, 9772.
[CrossRef]
25. Zhuang, M.; Zhao, J.; Li, S.; Liu, D.; Wang, K.; Xiao, P.; Yu, L.; Jiang, Y.; Song, J.; Zhou, J.; et al. Concentrations
and health risk assessment of rare earth elements in vegetables from mining area in Shandong, China.
Chemosphere 2017, 168, 578–582. [CrossRef] [PubMed]
26. Commission Regulation (EU) No 488/2014 of 12 May 2014 Amending Regulation (EC) No 1881/2006 as
Regards Maximum Levels of Cadmium in Foodstuffs. Available online: https://eur-lex.europa.eu/legal-
content/EN/TXT/PDF/?uri=OJ:JOL_2014_138_R_0011&from=EN (accessed on 11 February 2019).
27. Commission Regulation (EC) No 1881/2006 of 19 December 2006 Setting Maximum Levels for Certain
Contaminants in Foodstuffs. Available online: https://eur-lex.europa.eu/legal-content/EN/ALL/?uri=
CELEX%3A32006R1881 (accessed on 11 February 2019).
28. Commission Regulation (EU) 2015/1005 of 25 June 2015 Amending Regulation (EC) No 1881/2006 as Regards
Maximum Levels of Lead in Certain Foodstuffs. Available online: https://eur-lex.europa.eu/legal-content/
EN/TXT/?uri=uriserv%3AOJ.L_.2015.161.01.0009.01.ENG (accessed on 11 February 2019).
29. EFSA. Dietary exposure to inorganic arsenic in the European population. EFSA J. 2014, 12, 1–68.
30. ATSDR. ATSDR’s Substance Priority List. Available online: https://www.atsdr.cdc.gov/spl/ (accessed on 4
April 2017).
31. Robinson, C.D.; Webster, L.; Martínez-Gómez, C.; Burgeot, T.; Gubbins, M.J.; Thain, J.E.; Vethaak, A.D.;
McIntosh, A.D.; Hylland, K. Assessment of contaminant concentrations in sediments, fish and mussels
sampled from the North Atlantic and European regional seas within the ICON project. Mar. Environ. Res.
2017, 124, 21–31. [CrossRef]
32. Besada, V.; Sericano, J.L.; Schultze, F. An assessment of two decades of trace metals monitoring in wild
mussels from the Northwest Atlantic and Cantabrian coastal areas of Spain, 1991–2011. Environ. Int. 2014,
71, 1–12. [CrossRef] [PubMed]
33. Besada, V.; Andrade, J.M.; Schultze, F.; González, J.J. Comparison of the 2000 and 2005 spatial distributions
of heavy metals in wild mussels from the North-Atlantic Spanish coast. Ecotoxicol. Environ. Saf. 2011, 74,
373–381. [CrossRef]
34. Chiffoleau, J.-F.; Cossa, D.; Auger, D.; Truquet, I. Trace metal distribution, partition and fluxes in the Seine
estuary (France) in low discharge regime. Mar. Chem. 1994, 47, 145–158. [CrossRef]
35. Squadrone, S.; Brizio, P.; Stella, C.; Prearo, M.; Pastorino, P.; Serracca, L.; Ercolini, C.; Abete, M.C. Presence of
trace metals in aquaculture marine ecosystems of the northwestern Mediterranean Sea (Italy). Environ. Pollut.
2016, 215, 77–83. [CrossRef] [PubMed]
36. Jović, M.; Stanković, S. Human exposure to trace metals and possible public health risks via consumption
of mussels Mytilus galloprovincialis from the Adriatic coastal area. Food Chem. Toxicol. 2014, 70, 241–251.
[CrossRef]
37. Falcó, G.; Llobet, J.M.; Bocio, A.; Domingo, J.L. Daily Intake of Arsenic, Cadmium, Mercury, and Lead by
Consumption of Edible Marine Species. J. Agric. Food Chem. 2006, 54, 6106–6112. [CrossRef]Nutrients 2019, 11, 864 18 of 18
38. Yap, C.K.; Cheng, W.H.; Karami, A.; Ismail, A. Health risk assessments of heavy metal exposure via
consumption of marine mussels collected from anthropogenic sites. Sci. Total Environ. 2016, 553, 285–296.
[CrossRef] [PubMed]
39. COMMISSION REGULATION (EC) No 710/2009 Amending Regulation (EC) No 889/2008 Laying down
Detailed Rules for the Implementation of Council Regulation (EC) No 834/2007, as Regards Laying down
Detailed Rules on Organic Aquaculture Animal and Seaweed Production. Available online: https://eur-lex.
europa.eu/legal-content/EN/TXT/?uri=uriserv:OJ.L_.2009.204.01.0015.01.ENG (accessed on 25 March 2019).
40. EFSA NDA Panel (EFSA Panel on Dietetic Products, Nutrition and Allergies). Scientific Opinion on Dietary
Reference Values for selenium. EFSA J. 2014, 12, 3846. [CrossRef]
41. Leyssens, L.; Vinck, B.; Van Der Straeten, C.; Wuyts, F.; Maes, L. Cobalt toxicity in humans-A review of the
potential sources and systemic health effects. Toxicology 2017, 387, 43–56. [CrossRef]
42. Watanabe, F.; Katsura, H.; Takenaka, S.; Enomoto, T.; Miyamoto, E.; Nakatsuka, T.; Nakano, Y. Characterization
of vitamin B12 compounds from edible shellfish, clam, oyster, and mussel. Int. J. Food Sci. Nutr. 2001, 52,
263–268. [CrossRef] [PubMed]
43. EFSA NDA Panel (EFSA Panel on Dietetic Products, Nutrition and Allergies). Scientific Opinion on Dietary
Reference Values for zinc. EFSA J. 2014, 12, 3844. [CrossRef]
44. EFSA NDA Panel (EFSA Panel on Dietetic Products, Nutrition and Allergies). Scientific Opinion on Dietary
Reference Values for molybdenum. EFSA J. 2013, 11, 3333. [CrossRef]
45. Mertz, W. The essential trace elements. Science 1981, 213, 1332–1338. [CrossRef] [PubMed]
46. Graci, S.; Collura, R.; Cammilleri, G.; Buscemi, M.D.; Giangrosso, G.; Principato, D.; Gervasi, T.; Cicero, N.;
Ferrantelli, V. Mercury accumulation in Mediterranean Fish and Cephalopods Species of Sicilian coasts:
Correlation between pollution and the presence of Anisakis parasites. Nat. Prod. Res. 2017, 31, 1156–1162.
[CrossRef] [PubMed]
47. Cammilleri, G.; Vazzana, M.; Arizza, V.; Giunta, F.; Vella, A.; Lo Dico, G.; Giaccone, V.; Giofre, S.V.;
Giangrosso, G.; Cicero, N.; et al. Mercury in fish products: what’s the best for consumers between bluefin
tuna and yellowfin tuna? Nat. Prod. Res. 2018, 32, 457–462. [CrossRef]
48. EFSA. Scientific Opinion on the risk for public health related to the presence of mercury and methylmercury
in food. EFSA J. 2012, 10, 2985–3226.
49. Pagano, G.; Aliberti, F.; Guida, M.; Oral, R.; Siciliano, A.; Trifuoggi, M.; Tommasi, F. Rare earth elements in
human and animal health: State of art and research priorities. Environ. Res. 2015, 142, 215–220. [CrossRef]
50. Pagano, G.; Guida, M.; Tommasi, F.; Oral, R. Health effects and toxicity mechanisms of rare earth
elements-Knowledge gaps and research prospects. Ecotoxicol. Environ. Saf. 2015, 115, 40–48. [CrossRef]
51. Henriquez-Hernandez, L.A.; Boada, L.D.; Carranza, C.; Perez-Arellano, J.L.; Gonzalez-Antuna, A.;
Camacho, M.; Almeida-Gonzalez, M.; Zumbado, M.; Luzardo, O.P. Blood levels of toxic metals and
rare earth elements commonly found in e-waste may exert subtle effects on hemoglobin concentration in
sub-Saharan immigrants. Environ. Int. 2017, 109, 20–28. [CrossRef]
52. Mestre, N.C.; Sousa, V.S.; Rocha, T.L.; Bebianno, M.J. Ecotoxicity of rare earths in the marine mussel Mytilus
galloprovincialis and a preliminary approach to assess environmental risk. Ecotoxicology 2019, 28, 294–301.
[CrossRef]
© 2019 by the authors. Licensee MDPI, Basel, Switzerland. This article is an open access
article distributed under the terms and conditions of the Creative Commons Attribution
(CC BY) license (http://creativecommons.org/licenses/by/4.0/).You can also read