Feature Learning for Stock Price Prediction Shows a Significant Role of Analyst Rating - MDPI
←
→
Page content transcription
If your browser does not render page correctly, please read the page content below
Article
Feature Learning for Stock Price Prediction Shows a Significant
Role of Analyst Rating
Jaideep Singh and Matloob Khushi *

                                          School of Computer Science, Faculty of Engineering, The University of Sydney, Sydney, NSW 2006, Australia;
                                          jsin9199@alumni.sydney.edu.au
                                          * Correspondence: mkhushi@uni.sydney.edu.au

                                          Abstract: Efficient Market Hypothesis states that stock prices are a reflection of all the information
                                          present in the world and generating excess returns is not possible by merely analysing trade data
                                          which is already available to all public. Yet to further the research rejecting this idea, a rigorous
                                          literature review was conducted and a set of five technical indicators and 23 fundamental indicators
                                          was identified to establish the possibility of generating excess returns on the stock market. Leveraging
                                          these data points and various classification machine learning models, trading data of the 505 equities
                                          on the US S&P500 over the past 20 years was analysed to develop a classifier effective for our cause.
                                          From any given day, we were able to predict the direction of change in price by 1% up to 10 days
                                          in the future. The predictions had an overall accuracy of 83.62% with a precision of 85% for buy
                                          signals and a recall of 100% for sell signals. Moreover, we grouped equities by their sector and
                                          repeated the experiment to see if grouping similar assets together positively effected the results but
                                          concluded that it showed no significant improvements in the performance—rejecting the idea of
                                          sector-based analysis. Also, using feature ranking we could identify an even smaller set of 6 indicators
                                while maintaining similar accuracies as that from the original 28 features and also uncovered the

                                          importance of buy, hold and sell analyst ratings as they came out to be the top contributors in the
Citation: Singh, J.; Khushi, M.
                                          model. Finally, to evaluate the effectiveness of the classifier in real-life situations, it was backtested
Feature Learning for Stock Price
                                          on FAANG (Facebook, Amazon, Apple, Netflix & Google) equities using a modest trading strategy
Prediction Shows a Significant Role of
                                          where it generated high returns of above 60% over the term of the testing dataset. In conclusion, our
Analyst Rating. Appl. Syst. Innov.
2021, 4, 17. https://doi.org/10.3390/
                                          proposed methodology with the combination of purposefully picked features shows an improvement
asi4010017                                over the previous studies, and our model predicts the direction of 1% price changes on the 10th day
                                          with high confidence and with enough buffer to even build a robotic trading system.
Academic Editor: Christos Douligeris
                                          Keywords: stock index prediction; feature engineering; machine learning in stocks
Received: 20 December 2020
Accepted: 9 February 2021
Published: 1 March 2021
                                          1. Introduction
Publisher’s Note: MDPI stays neutral
                                                There has been extensive research to predict a firm’s performance [1,2], with some of
with regard to jurisdictional claims in
                                          the earliest studies beginning in the 1980s. Yet, as expressed by Kiang [3], the progress in
published maps and institutional affil-
                                          this field has been limited primarily because of lack of willingness on behalf of security
iations.
                                          analysts to share their knowledge and their inability to articulate their knowledge in
                                          unambiguous and simple terms for the domain to be taken forward. Moreover, a popular
                                          idea, the Efficient Market Hypothesis by Malkiel and Fama [4] states that prices of stocks
                                          are informationally efficient i.e., the stock prices reflect all information available out there
Copyright: © 2021 by the authors.         and it is not possible to predict stock prices based on the trading data and nor is it possible
Licensee MDPI, Basel, Switzerland.
                                          to obtain excess returns by exploiting any predictability of prices. Yet, on the other hand,
This article is an open access article
                                          Cheung et al. [5] and Pesaran et al. [6] argued and established that to execute profitable
distributed under the terms and
                                          trading, forecasting just the direction is enough.
conditions of the Creative Commons
                                                Usually when trading, to evaluate the price of a security one of the 2 strategies is
Attribution (CC BY) license (https://
                                          adopted: the fundamental analysis [7] or the technical analysis [8]. Fundamental analysis
creativecommons.org/licenses/by/
4.0/).
                                          determines a security’s value by evaluating the underlying factors that affect a company’s

Appl. Syst. Innov. 2021, 4, 17. https://doi.org/10.3390/asi4010017                                               https://www.mdpi.com/journal/asi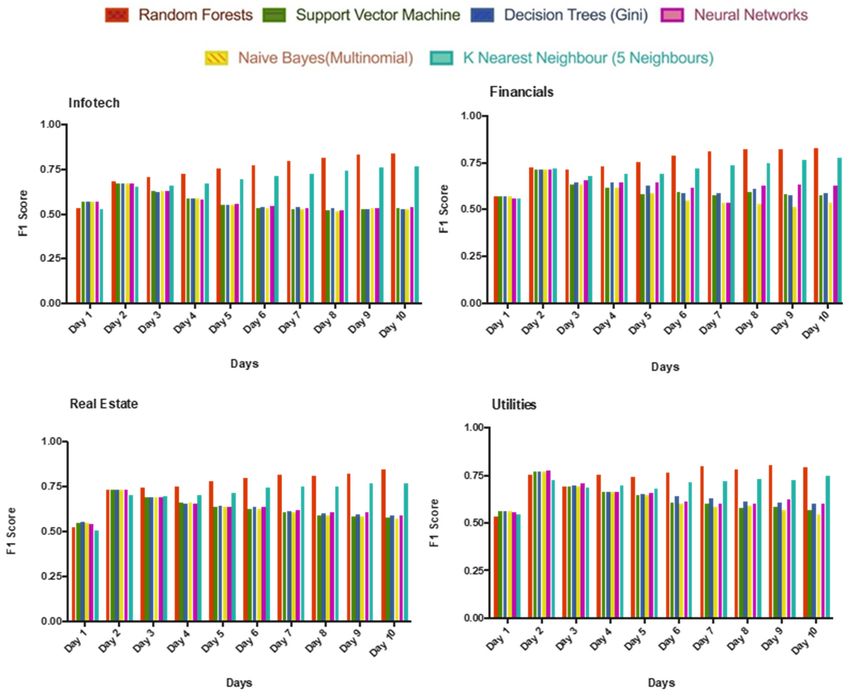
Appl. Syst. Innov. 2021, 4, 17                                                                                             2 of 17

                                 current business and its future prospects whereas technical analysis revolves around
                                 analysing statistical trends gathered from trading activity, such as price and volume move-
                                 ment and to identify windows of opportunities to invest. Both of these techniques approach
                                 the task from quite different angles and often are chosen one over the other depending
                                 upon the context of many factors including the market, equity in consideration, investment
                                 period such as long term or short term etc [9,10]. Typically, studies were carried to check the
                                 feasibility of one of those techniques [7,11,12] but in the study by R. A. Kamble [13], it was
                                 argued that technical indicators are not sufficient for long-term prediction of stock while
                                 fundamental and technical data together can make accurate long-term stock prediction
                                 possible. Thus, implying that no strategy serves as a silver bullet, and most strategies
                                 are developed and optimized specifically to work only in certain kind of markets or with
                                 certain kinds of equities. Thus, leaving a wide gap open and leaving room for further
                                 research in this domain.
                                       Parallelly, with improvements in machine learning and the availability of increased
                                 computational resources, many machine learning algorithms like Neural Networks [14–18],
                                 Random Forests [13], Bayesian Networks [19], hybrid models [20] and even very specific,
                                 optimised ML models [21] have all been applied in various scenarios to better predict
                                 the nature of the markets with a fair degree of success. Often, Support Vector Machines
                                 (SVM) have been leveraged for technical analysis to perform regression operations [16];
                                 for fundamental analysis, Neural Networks and its variations have been used to capture
                                 patterns and relationships by classifying the stocks based on the selected accounting
                                 indicators and macroeconomic factors. Despite these ML models being successful in
                                 predicting stock price trends [15] up to a certain level, as evident, they have been leveraged
                                 in very specific scenarios for very specific functions—making them fit primarily for the
                                 role they were chosen for.
                                       Thus, the key question in algorithmic trading is to identify how to define a set of
                                 rules on historical stock data like price, volume, market cap etc. as well as other publicly
                                 available information like a company’s annual reports, expert recommendations, overall
                                 market condition to accurately predict market behaviour and correctly identify trading op-
                                 portunities to generate excess returns. In this study, we collect features that were identified
                                 in various studies, study them, apply them and evaluate the possibility of predicting stock
                                 price movement whilst leveraging the advances in machine learning methods.

                                 2. Related Work
                                 2.1. Predicting an Equity’s Performance
                                       Inceptive research in fundamental analysis had mainly focused on using statistical
                                 methods to relate the performance of a stock with measurable parameters like finan-
                                 cial ratios, and then make suggestions to buy or sell, as the values of these parameters
                                 changed [11,22]. For instance, Ou [7] surveyed 61 accounting descriptors to shortlist 8 de-
                                 scriptors which were then run through various logistic regression models to establish
                                 that stock prices behave as if investors revise their expectations of future earnings based
                                 on non-earnings annual report numbers of the current year. Whereas Reinganum [22]
                                 by selecting merely 8 fundamental indicators was able to pick stock strategically to give
                                 returns 2–3 times higher than the S&P500 depending upon the selection strategy.
                                       Various studies [9–11,14,18,23] have established that fundamental analysis by incor-
                                 porating trading characteristics of the firm, such as the macroeconomic variable, present
                                 a possibility of good returns. Particularly, Beneish et al. [9] showed that the stocks cho-
                                 sen using such a strategy outperformed the losers by 8.7% to 17.8% over 12 months and
                                 Tirea and Negru [23] confirmed this claim by increasing the number of indicators and
                                 incorporating inputs on volatility, company management along with fundamental and
                                 macroeconomic indicators. Moreover, Anderson [10] established that fundamental signals
                                 can have different implications across the life-cycle of a firm i.e., an indicator that is highly
                                 correlated to growth in a start-up might loosely or even negatively correlate to success in a
                                 medium to a large-sized.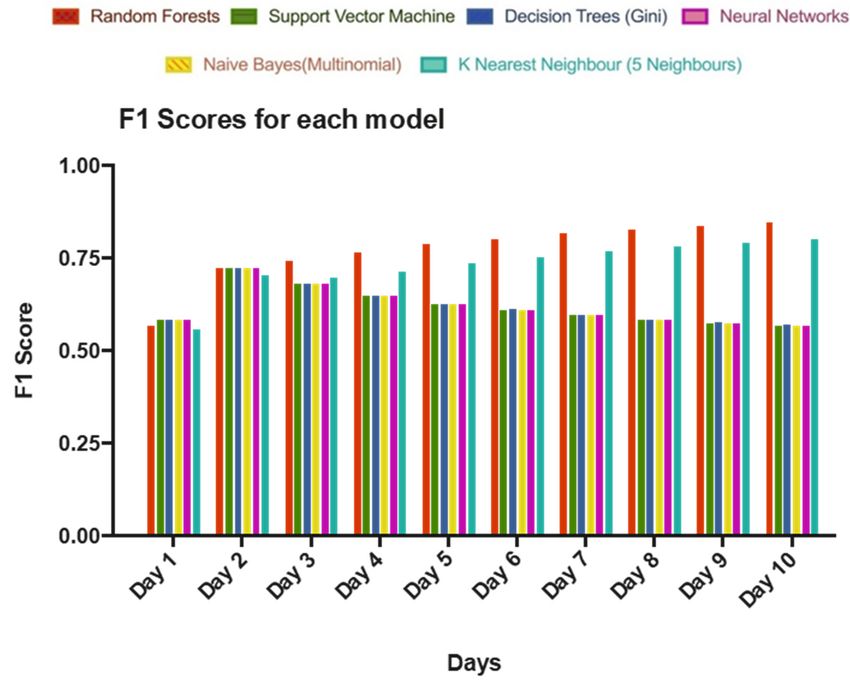
Appl. Syst. Innov. 2021, 4, 17                                                                                           3 of 17

                                      In the context of our study and machine learning, models learn and base their actions
                                 on the past, if a situation arises from beyond its domain of learning, by the nature of
                                 its design, the model is susceptible to performing really poorly or perhaps even break
                                 completely. The model is ‘only as good as what it is prepared for’. Yet if the stock
                                 predictions are based on fundamental analysis which promotes looking at a security’s
                                 intrinsic value than the market value, or the charts that represent the market value, the
                                 model could be made resilient to an extent. Thus, the amalgamation of the fundamental
                                 and technical factors is taken up as a potential solution.

                                 2.2. Machine Learning Strategies for Good Performing Stock
                                       As touched upon earlier, with the advent of Machine learning and increased compu-
                                 tational resources this field took a whole different course and since then many different
                                 kinds of ML models have been tried and tested in this domain. Though, more importantly,
                                 Kryzanowski et al. [18] reported that a Boltzmann machine (a kind of Artificial Neural
                                 network) successfully classified stock returns into Positive-Negative up to 72% based
                                 on the selected fundamental indicators and if the classification was changed to Positive-
                                 Neutral-Negative then the results weren’t as phenomenal but still better than a random
                                 guess. Overall, the ability of Neural Networks to perform better than random guess was
                                 confirmed when Yu et al. [24] utilized ANNs to select stocks or [17] used it to predict stock
                                 returns for Dow Price Index or Trigueiros [8] leveraged a Multilayer Perceptron to test
                                 their custom fundamental analysis strategy. In another interesting study by Lam [25], she
                                 investigated the ability of neural networks to integrate fundamental and technical analysis
                                 to predict the performance of a stock and developed a model averaging a return of 0.25398
                                 which outperformed the minimum benchmark but did not meet the maximum benchmark
                                 set at 0.278.
                                       Referring to the application of ANNs across financial markets [26–30] and for both
                                 fundamental and technical analysis, Yu et al. [21] acknowledged the wide application of
                                 ANNs but then proceeded to provide evidence that ANNs often suffer from over-fitting
                                 and local optimum problems. They also proposed that SVM’s based on the principle of
                                 structural risk minimization could avoid such problems and employed them to model
                                 stock markets. Moreover, they developed a novel Sigmoid function to combine discrete
                                 and continuous inputs and later used differential evolution algorithms to optimise the
                                 stock selection model to find out that this strategy was significantly more powerful and
                                 efficient than other designed benchmarks. Similarly, many other custom and very-tailored
                                 approaches were adopted included Huang et al. [20] proposing a Fuzzy-GA hybrid which
                                 beat the benchmarks and Kiang et al. [3] developed a custom “distributed knowledge
                                 acquisition system” which had dedicated components to perform specific analysis functions
                                 and when the output of it all was combined to select stocks, it outperformed NYSE and
                                 S&P500 on the parameters of monthly return, the Treynor Index and the Jensen Index.
                                 While Faustryjak et al. [31] used LSTM with statistical analysis of published messages to
                                 predict the direction of stock price and Paluch [32] combined technical and fractal indicators
                                 for the next day close price of the Polish stock market.
                                       Furthermore, insightful studies with the other kinds of ML models include Kamble [13]
                                 utilizing the Random Forest algorithm on selected indicators based on their short term and
                                 long-term impact and found that the accuracy of the model was 66.8% for buy signal for
                                 short term and 75.8% for long term. Whereas the experiments using Bayesian Networks by
                                 Tan et al. [19] aiming to model financial ratios of Malaysian plantation stocks around the
                                 period of the Great Recession (2007-2009) received limited success as the algorithm was
                                 completely unable to predict the crash but its accuracy to classify stocks into ‘buy’ and
                                 ‘don’t buy’ improved post the period of decline to 52.94% and 60.71% in 2009 and 2010
                                 respectively. For the authors, this was a success to an extent as despite such a massive
                                 market disruption the model was still able to predict stock returns up to a certain accuracy.
                                       Lastly, Dropsy [14] attempted to predict international equity risk premium using
                                 linear regression models and neural networks and benchmarked the results of each against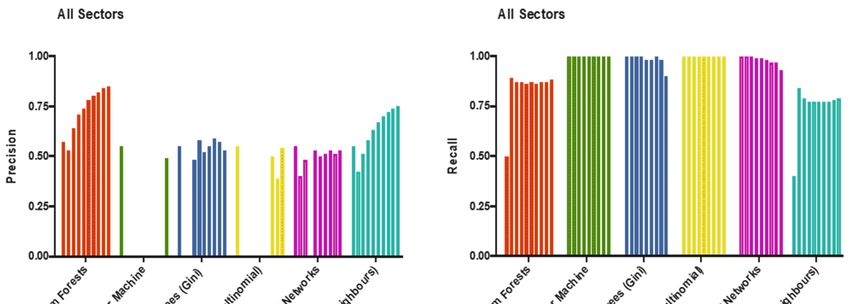
Appl. Syst. Innov. 2021, 4, 17                                                                                            4 of 17

                                 the statistical Random walk model. It was argued that linear (Linear Regression) and non-
                                 linear forecasts (Neural Network) are superior to random walk forecasts, but interestingly
                                 nonlinear forecasts did not significantly outperform linear forecasts and the unexpected
                                 result was attributed to the possibility of the neural network suffering misspecification.
                                 And G. Iuhasz, M. Tirea, and V. Negru [33] comparing 4 neural networks namely Standard
                                 Feed-Forward neural network, Elman and Jordan recurrent neural networks and a neural
                                 network evolved with neuro-evolution of augmenting topologies (NEAT) found out that
                                 NEAT computes a more accurate result and much faster than the others.
                                      Apart from the variety of the ML models used, different studies have relied on different
                                 features and indicators to predict stock prices. For example, in the Australian market, C.
                                 Hargreaves and Y. Hao [15] established that by using only a selected few parameters (less
                                 than 10) with either one of, a neural network or a decision tree to pick Australian stocks
                                 they could get a better yield than Australian Ordinary Index numerically 11.8 times better.

                                 2.3. Impact of Analyst Recommendations
                                      In a nutshell, analyst recommendations [34] are typically buy-hold-sell ratings pre-
                                 dicting an equity’s future performance and are issued in the public by industry experts.
                                 Womack [35] studied the effect of analyst ratings on investor sentiment and observed that
                                 stock prices adjusted up to five per cent for changes to buy recommendations or up to 11
                                 per cent for changes to sell recommendations. Taking it a step forward, Barber et al. [36]
                                 in 2001 investigated if the investors could profit from these publicly available recommen-
                                 dations and they reported that just by adopting the strategy of purchasing ‘strong buy’
                                 stocks and shorting ‘strong sell’ stocks they were able to generate excess returns of up
                                 to 4% but stated due to a substantial transaction costs the abnormal net returns for these
                                 strategies was not reliably greater than zero. Yet, about more than a decade later in 2018,
                                 Park et al. [37] used the same strategy to produce abnormal returns of 4.7–5.8% per year
                                 post accounting for transactions costs during the period of 2001–2016. They attributed
                                 this result to decreasing transaction costs and also to their more precise consideration
                                 of these costs rather than using a fixed number. Another recent study [38], suggested
                                 that it was possible to build profitable strategies based on analysts’ recommendations as
                                 they identified that the top-rated stocks generally deliver higher returns than the bottom
                                 rated stocks.
                                      While these ratings seem to possess the ability to sway the markets, they are known [39–42]
                                 to be biased because of these analysts’ affiliations with the investment banking realm that gen-
                                 erates pressure on them to produce relatively optimistic recommendations regarding affiliated
                                 stocks. Moreover, Chiang and Lin [43] established that there exists a level of herding in the
                                 recommendations issued by analysts and this phenomenon is more profound for hard-to-value
                                 firms, large firms or firms with high institutional ownership.
                                      Finally, analyst ratings haven’t always proven to be correct [44], as in the study by
                                 Nam et al. [45], they discovered that stocks with average analyst recommendation level
                                 of hold or worse on the S&P500 outperformed other stocks over the period 2009 to 2016.
                                 However, according to Nam, this result was driven by two factors: the impact of the
                                 period of 2009 and 2010, and low-priced stocks. Yet when the same strategy was applied
                                 since the beginning of 2011 or when the low-priced stocks were removed, no significant
                                 outperformance of these stocks was observed. This presented an interesting result as these
                                 supposedly poor performing stocks as described the analysts didn’t truly perform as poorly
                                 as predicted but rather managed to stay afloat and provided their investors just as many
                                 returns as the stocks with a positive rating if not more.

                                 2.4. Gap in Research
                                      Studies like [7,22] have highly advocated for fundamental analysis and to check for
                                 a security’s intrinsic value but as witnessed earlier, technical analysis has also shown
                                 promising results. Secondly, most studies seem to have overlooked the impact of analyst
                                 ratings in the interest of scope. Thirdly, with rapidly increasing capabilities of Machine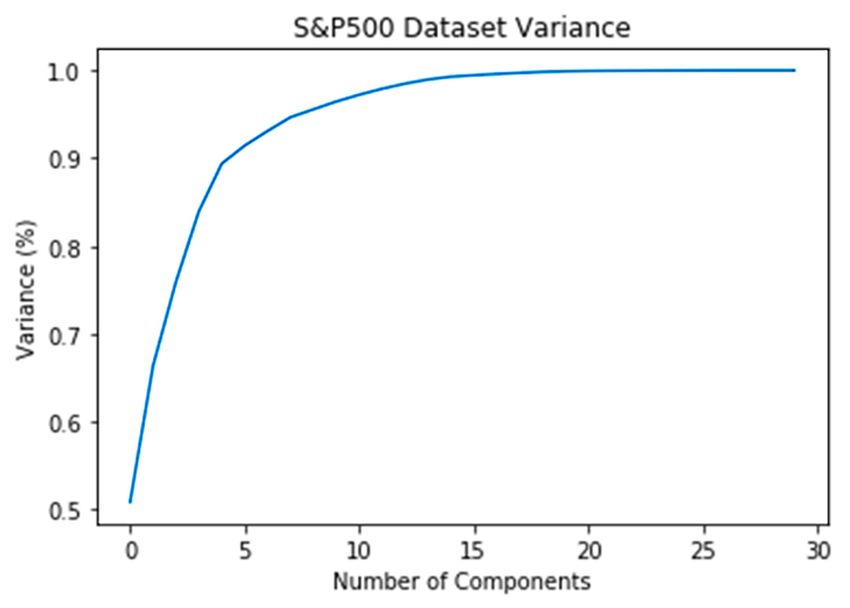
poorly as predicted but rather managed to stay afloat and provided their investors just as
many returns as the stocks with a positive rating if not more.
2.4. Gap in Research
Studies like [7,22] have highly advocated for fundamental analysis and to check for
Appl. Syst. Innov. 2021, 4, 17 5 of 17
a security’s intrinsic value but as witnessed earlier, technical analysis has also shown
promising results. Secondly, most studies seem to have overlooked the impact of analyst
ratings in the interest of scope. Thirdly, with rapidly increasing capabilities of Machine
learning, new
learning, new andand sophisticated
sophisticated methods
methods [3,21] havehave been
been used
used toto analyse
analyse the the markets,
markets,
each
each of
of which
which hashas achieved
achieved some some success
success inin their
their own
own way.way. Lastly,
Lastly,without
withouttaking
taking away
away
from
from any
any due
due credit,
credit, itit seems
seems because
because ofof these
these new
new tools
tools provided
providedby by machine
machinelearning
learningto to
map out trends, the focus has shifted from picking the right indicators
map out trends, the focus has shifted from picking the right indicators for evaluation to for evaluation to
merely
merely checking
checking howhow these
these tools
tools work
work inin the
the given
given scenario
scenario [13–15].
[13–15]. Thus,
Thus, withwith all
all these
these
movings
movings parts
parts and
and studies
studies focusing
focusing on on very
very specific
specific use-cases,
use-cases, there
there is
is aa wide
wide gap
gap toto be
be
explored
explored and
and toto be
be worked
worked in. in.
From
From an an application
application perspective,
perspective, we we realised
realised that
that most
most articles
articles predicted
predicted justjust the
the
direction
direction of stock movement or recommended in forms that present a high barrier to be
of stock movement or recommended in forms that present a high barrier to be
implemented
implemented in in aa real
real trading
trading system.
system. Therefore,
Therefore, wewe aimed
aimed to to propose
propose aa system
system which
which
could
could be
be used
used asas aa real
real trading
trading strategy
strategy andand plan
plan to
to achieve
achieve this
this by
by bringing
bringing the the above-
above-
mentioned
mentioned factors together and focusing on selecting the best possible indicators from
factors together and focusing on selecting the best possible indicators from
published
publishedstudies
studiescovering
coveringboth boththe fundamental
the fundamental andandtechnical realms
technical thatthat
realms could havehave
could the
maximum impact on a security’s price movement and by leveraging
the maximum impact on a security’s price movement and by leveraging the latest the latest advances
in machineinlearning
advances machine[46]. To meet
learning theTorequirements
[46]. of this objective
meet the requirements weobjective
of this also carried out
we also
backtesting
carried out backtesting of our classifier and evaluated the profits made along the way in
of our classifier and evaluated the profits made along the way as explained as
the sectionsinbelow.
explained Figurebelow.
the sections 1 explains our1analysis
Figure explainsworkflow.
our analysis workflow.
Figure 1.
Figure 1. Analysis
Analysis work-flow.
work-flow.
3. Experiment
3. Experiment Design
Design
The entire
The entireexperimentation
experimentationprocess
processcan
canbebedivided
divided into
into 4 stages
4 stages asas depicted
depicted in in Figure
Figure 1.
1. The data focused on the 505 stocks that formed the S&P 500 index and
The data focused on the 505 stocks that formed the S&P 500 index and covered the pastcovered the past
20 years
20 years until
until the
the 44 April
April 2019.
2019. For
For these
these equities,
equities, aa set
set ofof 28
28 features
features was
was identified,
identified,
collected and
collected and structured
structured after
after aathorough
thoroughanalysis
analysisofofprevious
previousliterature
literatureasas
summarised
summarised in
Table 1 and they ranged from fundamental indicators to technical indicators
in Table 1 and they ranged from fundamental indicators to technical indicators to analyst to analyst
recommendations.
recommendations.
Appl. Syst. Innov. 2021, 4, 17                                                                                                      6 of 17

      Table 1. Features and indicators used in this study. * BEst ratings (BEst EPS, BEst CAPEX etc) refer to ratings and numbers
      calculated and issued by Bloomberg’s internal division, Bloomberg Estimate.

              Type                              Indicator                      Symbol on Bloomberg                  Studies
 Fundamental                     PE Ratio                                   PE_RATIO                            [5,9,11,17,21,24]
 Indicators                      PB Ratio                                   PX_TO_BOOK_RATIO                        [1,19–21]
                                 EPS *                                      BEST_EPS                            [10,17,18,23,24]
                                 EPS Low *                                  BEST_EPS_LO                         [10,17,18,23,24]
                                 EPS High *                                 BEST_EPS_HI                         [10,17,18,23,24]
                                 CAPEX *                                    BEST_CAPEX                               [5,7,23]
                                 CAPEX Low *                                BEST_CAPEX_LO                            [5,7,23]
                                 CAPEX High *                               BEST_CAPEX_HI                            [5,7,23]
                                 Return on Asset                            RETURN_ON_ASSET                     [12,16,17,19,21]
 Technical                       Volume                                     PX_VOLUME                                   [9]
 Indicators                      Market Cap.                                CUR_MKT_CAP
                                 Historical Market Cap.                     HISTORICAL_MARKET_CAP
                                 Short Interest Ratio                       SHORT_INT_RATIO
                                 Short Interest                             SHORT_INT
 Analyst                         # of Analyst Ratings                       TOT_ANALYST_REC                      [12,27,28,30]
 Recommendations                 # of Buy Recs                              TOT_BUY_REC                          [12,27,28,30]
                                 # of Sell Recs                             TOT_SELL_REC                         [12,27,28,30]
                                 # of Hold Recs                             TOT_HOLD_REC                         [12,27,28,30]
                                 Equity Recommendation Consensus            EQY_REC_CONS                         [12,27,28,30]
                                 Analyst Rating *                           BEST_ANALYST_RATING                  [12,27,28,30]
 Others                          Closing Price                              PX_OFFICIAL_CLOSE                         [13]
                                 Long-Term Growth *                         BEST_EST_LONG_TERM_GROWTH
                                 Target Price for day *                     BEST_TARGET_PRICE
 Derived                         %age of Hold Recs                          hold_percent
 Indicators                      %age of Buy Recs                           buy_percent
                                 %age of Sell Recs                          sell_percent
                                 Standard Deviation in price over 5 days    std_5day
                                 Standard Deviation in price over 10 days   std_10day

                                       3.1. Approach for Transformation and Analysis
                                             Firstly, to achieve the primary aim for this study i.e., to evaluate if a set of technical
                                        or fundamental features can be used to predict the price movement of an equity or not,
                                       we structured this problem as a classification machine learning problem, similar to the
                                        approach adopted by [13,15,19]. Here, we labelled the equity a ‘buy’ if the price went up in
                                        the following days by 1% and ‘sell’ if the price went down by 1% or if it remained between
                                        those 2 thresholds then as a ‘hold’. Post this, classification machine learning models could
                                        then be run on these to check for an association between the features of an equity and the
                                        labels based on price movement for every day.
                                             Secondly, to investigate the price movement for up to 10 days from any given day,
                                        each instance in the data (aka row), representing one day, was given 10 labels [day1, day2,
                                        day3, day4, day5, day6, day7, day8, day9, day10]. Similar to above, each one of these labels
                                        stated ‘buy’, ’sell’ or ‘hold’ based on the price change on ‘day n’ in the future compared to
                                        the current day. For example, if the label ‘day30 of an arbitrary equity on 26/11/11 had a
                                       ‘buy’ value, that would mean that3 days in the future i.e., 29/11/11 the closing price of the
                                        equity was greater than its closing price on 26/11/11 by 1% (Table 2).

                                       Table 2. Criteria for Labels.

                                                      Label                   Numerical Equivalent                Criterion
                                                      Buy                               2                       Tn ≥ 1.01∗ T0
                                                      Hold                              1                 0.99∗ T0 < Tn < 1.01 ∗ T0
                                                      Sell                              0                       Tn ≤ 0.99∗ T0

                                            Thirdly, to prevent the machine learning models from reporting higher accuracies
                                       by incorporating biases and over-reliance on the trends it may pick up, like the Great
                                       Economic Recession of 2007–2008 or the Dot-com bubble of 1994 to 2000 or the following
                                       Dot-com crash of 2000–2001 where the market showed either meteoric rise or decline for an
Appl. Syst. Innov. 2021, 4, 17 7 of 17
extended period across the world especially the US, the data should be randomised before
forming training and testing sets for the machine learning to gauge nothing but purely the
effect of the chosen indicators.
To execute this approach, post-restructuring, calculating derived features and remov-
ing nulls, this transformed dataset is split into 70% and 30% which formed the training set
and the testing set respectively and then multiple models were tested, as listed in Table 3.
A second iteration of experiments was also run by grouping equities by their sector and
classifying each group separately to evaluate the effect of running classifiers on similar
kind of equities together.
Table 3. List of models used for experimentation.
Model Used Parameters
Support Vector Machines Linear Kernel
Gaussian
Naïve Baes
Multinomial
Random Forests No. of trees = 10
Gini Index
Decision Trees
Entropy Information gain
5 Neighbours
K Nearest Neighbours 7 Neighbours
9 Neighbours
Neural Networks 2 hidden layers containing 5 and 2 hidden units respectively
3.2. Approach for Evaluation
To do a comprehensive evaluation of the performance of the various models and
optimise the utility of the model in a real-world scenario, different metrics were chosen for
the individual signals and the overall performance of the model as depicted by Table 4.
Table 4. Metrics for different signals.
Entity Metric
Buy Signals Precision
Sell Signals Recall
Hold Signals F1 Score (Micro-Weighted)
Overall Model F1 Score (Micro-Weighted)
For the buy signals, it is important to have a higher precision against recall as we want
to make sure if we look at a buy signal produced by our program is truly a buy signal even
if we miss out on a few opportunities (i.e., recall, capturing all the signals) to invest here
and there.
For the sell signals, the opposite might be true as we would want to know about all
the times when we should be selling (i.e., recall, capturing all the signals) because if we do
not, then we might be heading towards an impending doom without knowing and can
lose all profits there. Thus, it does not hurt to sell a bit early (i.e., precision, if captured
should be correct) rather than waiting longer and hoping to generate more profits.
As for the hold signal, a low precision would mean one becomes vulnerable in
situations when they were supposed to either buy or sell but the classifier tells them
to hold making them rigid in terms of their portfolio position—consequently leading to
missed investment opportunities or even extreme losses. Similarly, for the recall value, one
would want to know about all the hold values because if they do not and are recommended
to either buy or sell, then in the best case they become extremely sensitive to the slightest
of market changes or worse off compromise their entire portfolio due to an incorrect buy
or sell. So, for hold signals, it makes sense to pay attention to both these values and the F-1
score would a great metric for such a situation, accounting for both precision and recall.Appl. Syst. Innov. 2021, 4, 17 8 of 17
Backtesting the Classifier
Being a system that needs to be applied in real life, merely calculating theoretical
accuracy of its various signals would not mean anything if it is unable to successfully
navigate the real world and generate profit. Thus, the test dataset, generated to evaluate
the effectiveness of the classifier in the earlier steps of the evaluation stage, was passed
into a custom backtesting library that would feed each days data one at a time to the
trained classifier and then make trades based on the recommendations issued by it—thus,
mimicking a real-world scenario of consuming data and making trades.
As the purpose of the backtesting library was merely to evaluate the effectiveness
of the classifier and the process of building an effective classifier was the actual focus of
this study, the library and its function were kept fairly straightforward where testing was
carried out only for one equity at a time and only one share could be held or traded at any
given time. Though the library enabled both buying and shorting of equities and even
broker fees were accounted for where it was set to a standard cost of $0.01 per transaction.
Moreover, as the classifier predicts the direction of price movements for a change of 1% in
either direction (as per Table 2), the ‘stop-loss’ and ‘take profit’ were also set to 1% because
when the classifier buys an equity it predicts that there shall be an increase of at least 1%,
thus when the price does start increasing, if it does, then it makes sense to exit the position
once it reaches that mark. This is achieved by the take profit parameter. Whereas on the
other hand if the price drops by 1% when it predicted otherwise, we know the classifier
made the wrong trade and to minimise any losses one should leave that position as soon
as possible.
In action, the algorithm makes trades based on the rules given in Table 5 and for its
very first trade, though not depicted in the table below for simplicity, it’s put in default
starting position where it chooses to buy or sell exclusively based on what the classifier
predicts as at that point there’s no previous trade that has taken place.
Table 5. Actions taken by the backtesting algorithm based on the previous trade and signal generated
by the classifier for the current day.
Previous Trade
Buy Short/Sell
Hold and check stop
Current Signal Buy Buy/Short Buy
conditions
Hold and check stop
Sell Sell
conditions
Though due to the labour-intensive nature of feeding data for only one equity at a
time, the backtesting was carried out only for the very popular FAANG equities (Facebook,
Apple, Amazon, Netflix, Google) as a proof of concept and the results of the same have
been shared in Section 4.4. This way the backtesting algorithm runs over ~250 days of data
for each of the equities, which is the size of the testing set generated earlier. Lastly, as every
trade is made, corresponding profit and loss is calculated on it and a tally of total profit
is maintained.
4. Results
Last 20 years of data (4 April 1999 to 4 April 2019) was analysed that consisted of 28
fundamental and technical indicators (Table 1).
4.1. Result 1: Model Predictions Are Most Effective for the 10th Day in the Future
Six classifiers (Table 3) were trained and tested on the entire S&P500 dataset with
28 features. Random Forest outperformed all the other classifiers with the maximum
micro-weighted F1 score aka accuracy of 83.62% on day 10, and in second place came the
K-Nearest Neighbour with an accuracy of 76.82%, as shown by Figure 2. Interestingly, theAppl. Syst. Innov. 2021, 4, 17 9 of 17
ability to predict the price of a stock of the two models increased as the days passed i.e.,
based on the “properties“ of an equity on a certain day our model made more accurate
predictions for 10th days into the future as compared to 5th day. Figure 3 depicts the
performance of models in predicting each of the label class from Day 1 to Day 10. Each
pl. Syst. Innov. 2021, 4, x FOR PEER REVIEW
bar represents the performance of a model on a given day and bars are10grouped
of 18
by the
model
Appl. Syst. Innov. 2021, 4, x FOR PEER type.
REVIEW 10 of 18
Figure 2. Performance
Figure 2. of various classifiers.
Performance variousMost models make the most accurate predictions for 10th day
for ahead for
in
Figure 2. of
Performanceclassifiers.
of variousMost models
classifiers. make
Most the most
models makeaccurate
the mostpredictions
accurate predictions
the future. 10th day ahead in the future.
10th day ahead in the future.
Figure 3. Precision
Figure forfor
3. Precision Buy
Buysignals
signalsand
andRecall
Recallfor
forSell
Sell signals of
of various
variousclassifiers
classifiersover
overthe
theS&P500
S&P500 dataset.
dataset. Bars
Bars areare ordered
ordered
from
Figure 3. Precision Day-1
for Buy to Day-10
signals andfrom left
Recall to
for
from Day-1 to Day-10 from left to right. right.
Sell signals of various classifiers over the S&P500 dataset. Bars are ordered
from Day-1 to Day-10 from left to right.
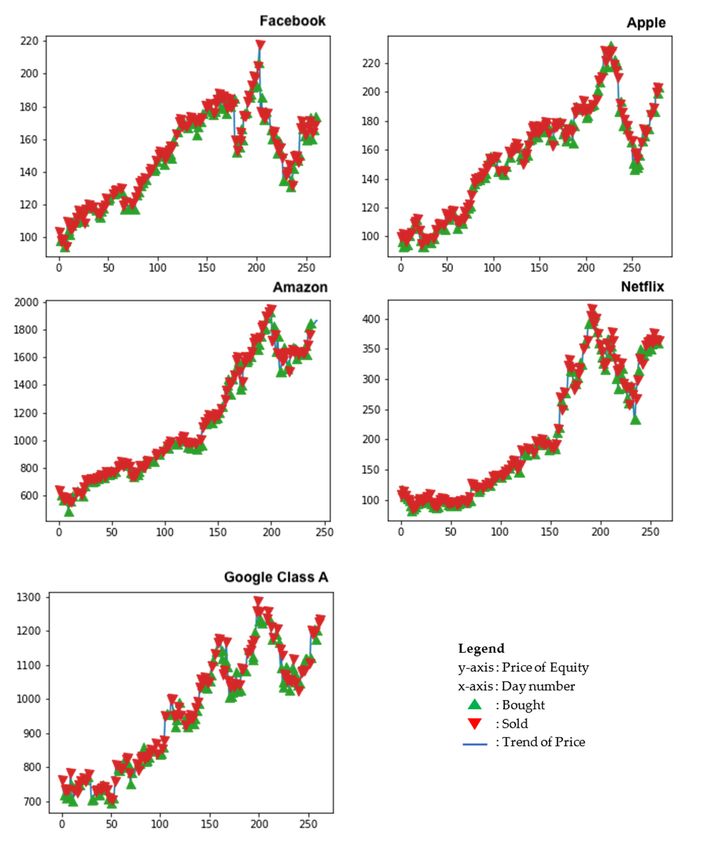
4.2. Result 2: Sector-Wise Analysis Didn’t Improve Performance
4.2. Result 2: Sector-Wise
StudiesAnalysis
by [9,10]Didn’t Improve
promoting Performance
contextual analysis, one would believe that grouping
Studies equities
by [9,10]belonging
promoting to the same industry
contextual sector
analysis, onewould
would result in improved
believe performances,
that groupingAppl. Syst. Innov. 2021, 4, 17 10 of 17
For the Buy signal predictions, the Random Forest classifier predicted buying oppor-
tunities with much greater precision when compared to other classifiers i.e., if the random
forest classifier predicted that an equity was a ‘buy’ then the chances of it truly being a
‘buy’ were a lot higher. It is important to be mindful here that being precise for buy didn’t
mean it predicted all the buy opportunities, it just meant out of the ones it was predicting
85% on day 10 were true buys and to build a reliable system that’s a property we need. The
classifiers like SVM and Naïve Bayes have failed to predict any buys on some of the days
which highlighted their failure on the particular dataset hence the missing bars in Figure 3.
For the Sell Signal predictions, the Random Forest classier, performed poor compared
to few other classifiers (Figure 3). The Random Forest recall was only 88% of the sell signals
correctly when the other classifiers except K-Nearest Neighbour showed a recall of 100%.
Though this should not be viewed as a shortcoming because classifier like SVM and Naïve
Bayes did not predict any buy signals on certain days meaning all the signals that were
produced were sell signals and thus the recall value of 1 for sell signals was merely a
consequence of not predicting any buy values.
Overall, the Random Forest classifier showed great results across the board with the
best values on the day 10: 85% precision for buy signals, 88% recall for sell signals and an
F1 score of 83.62%.
4.2. Result 2: Sector-Wise Analysis Didn’t Improve Performance
Studies by [9,10] promoting contextual analysis, one would believe that grouping
equities belonging to the same industry sector would result in improved performances,
Appl. Syst. Innov. 2021, 4, x FOR PEER REVIEW 11 of 18
however, our analysis showed this was not the case. Figure 4 shows that the trend remained
the same as for the overall data set from Figure 3. Moreover, not just the trend, even the
absolute values have remained relatively the same and with no major differences across
even the absolute values have remained relatively the same and with no major differences
the board. There have been instances of increases as well as decreases. For example, in
across the board. There have been instances of increases as well as decreases. For example,
thein
Energy sector, the accuracy of the random forest increased to 84.28% on day 10 but for
the Energy sector, the accuracy of the random forest increased to 84.28% on day 10 but
Healthcare, it dropped
for Healthcare, to 82.96%.
it dropped to 82.96%.
Figure
Figure 4. Performanceof
4. Performance ofclassifiers
classifiers in
in aafew
fewselected
selectedsectors.
sectors.
4.3. Result 3: Just 6 Indicators Can Be Used to Predict the Price Movement of Stocks to a High
Degree
We further investigated the possibility of dimensionality reduction by performing
Principal Component Analysis (PCA). The first 6 components captured more than 90% ofAppl. Syst. Innov. 2021, 4, 17 11 of 17
4.3. Result 3: Just 6 Indicators Can Be Used to Predict the Price Movement of Stocks to a
High Degree
We further investigated the possibility of dimensionality reduction by performing
Principal Component Analysis (PCA). The first 6 components captured more than 90% of
Appl. Syst. Innov. 2021, 4, x FOR PEER REVIEW 12 of 18
the variance while the first 15 components captured more than 99% of the variance in the
data as shown in Figure 5.
Figure5.5. Variance
Figure Variancecaptured
capturedby
byprincipal
principalcomponents.
components.
Since
Sincethethefirst
first6 PCA
6 PCA exhibited most
exhibited variance
most in theindata
variance the we
datafurther investigated
we further which
investigated
were the most important features in these components by looking
which were the most important features in these components by looking at their at their eigenvalues
against each PCA.
eigenvalues againstTheeach
eigenvalue
PCA. Thecould have an absolute
eigenvalue could havevalue
an from 0 to 1,
absolute so infrom
value this exper-
0 to 1,
iment, if the feature eigenvector had a value 0.1 or greater for a principal component
so in this experiment, if the feature eigenvector had a value 0.1 or greater for a principal then
it was considered to be making a “valid contribution” to a given component. Furthermore,
component then it was considered to be making a “valid contribution” to a given
a feature contributing to the PC-1 was more valuable, in terms of variance representation
component. Furthermore, a feature contributing to the PC-1 was more valuable, in terms
than to a feature contributing to PC-6. Thus, their occurrences were been weighted for 6 to
of variance representation than to a feature contributing to PC-6. Thus, their occurrences
1. For a feature making a valid contribution to PC-1 was give 6 points, to PC-2 was given
were been weighted for 6 to 1. For a feature making a valid contribution to PC-1 was give
5 and so on until a feature present in PC-1 was given a single point. The results of this
6 points, to PC-2 was given 5 and so on until a feature present in PC-1 was given a single
process were summed up in Table 6. The column “Occurrences” was a metric, stating out
point. The results of this process were summed up in Table 6. The column “Occurrences”
of the 6 principal components (PC) how many principal components did a feature make a
was a metric, stating out of the 6 principal components (PC) how many principal
valid contribution to.
components did a feature make a valid contribution to.
From Table 6, it was clear that the features that come from analyst rating, “Total Hold
From Table 6, it was clear that the features that come from analyst rating, “Total Hold
Recommendation” was the most significant feature that contributing in the first 5 PCA,
Recommendation” was the most significant feature that contributing in the first 5 PCA,
following by “Total Buy” and “Total Sell” recommendation by the market analysts. Of 28,
6following by “Total
features were Buy” in
not listed and “Total
Table 6 asSell”
theyrecommendation
were consideredby to the market
be not analysts.to
contributing Ofthe
28,
6 features were not listed in Table 6 as they
first 6 PCA since their eigenvalue was lower than 0.1. were considered to be not contributing to the
first 6 PCA since their eigenvalue was lower than 0.1.
Table 6. The occurrence of each feature in the first 6 PCA components.
Feature Occurrences Weighted Occurrence
TOT_HOLD_REC 5 20
TOT_BUY_REC 4 17
TOT_SELL_REC 4 16
TOT_ANALYST_REC 3 11
hold_percent 3 11
sell_percent 3 11
BEST_TARGET_PRICE 3 10
PX_OFFICIAL_CLOSE 2 9Appl. Syst. Innov. 2021, 4, 17 12 of 17
Table 6. The occurrence of each feature in the first 6 PCA components.
Feature Occurrences Weighted Occurrence
TOT_HOLD_REC 5 20
TOT_BUY_REC 4 17
TOT_SELL_REC 4 16
TOT_ANALYST_REC 3 11
hold_percent 3 11
sell_percent 3 11
BEST_TARGET_PRICE 3 10
PX_OFFICIAL_CLOSE 2 9
EQY_REC_CONS 2 9
BEST_ANALYST_RATING 2 9
BEST_EPS 2 9
BEST_EPS_LO 2 9
BEST_EPS_HI 2 9
CUR_MKT_CAP 2 7
HISTORICAL_MARKET_CAP 2 7
BEST_CAPEX 2 7
BEST_CAPEX_LO 2 7
BEST_CAPEX_HI 2 7
buy_percent 1 6
SHORT_INT 2 5
SHORT_INT_RATIO 1 1
RETURN_ON_ASSET 1 1
4.4. Result 4: The Randomforest Classifier Generates Strong Results in Scenarios Mimicking
Real Life
Backtesting: We devised a simple backtesting system to test the trading system, the
code is available at https://github.com/mkhushi/mkbacktester (accessed on 1 February
2021). We tested trading on five major S&P500 stocks known as FAANG (Facebook, Apple,
Netflix, Google). The transaction cost is set to be $0.01 per share and we traded a single
share at ever opptunity of buy or shorting the stock as show in Figure 6. As shown by
the statistics in Table 7, the random forest classifier with the 6 indicators as identified by
from the principal component analysis, was able to generate very strong returns during
backtesting. Despite the FAANG being only a small share of the S&P500, it still speaks
to the ability of the classifier to effectively predict price movements and generate profits.
Such results were seen with a very simple trading strategy and an elementary backtesting
algorithm. With improvements to the backtesting algorithm coupled with the use of other
common trading strategies, this classifier can prove to be an effective foundation of a more
complex system.
Table 7. Profits generated when backtesting on test data for the FAANG equities.
Price of Equity at the
Equity Profit Generated Return Percentage
Beginning of the Term
Facebook $85.63 $102.97 83.16%
Amazon $479.30 $636.99 75.25%
Apple $87.30 $99.96 87.34%
Netflix $118.12 $107.66 109.72%
Google $466.83 $761.53 61.30%Appl.Syst.
Appl. Syst.Innov.
Innov.2021,
2021,4,4,17x FOR PEER REVIEW 1314ofof1718
Figure 6. Visual representation of the transactions made during backtesting of the FAANG equities.
Figure 6. Visual representation of the transactions made during backtesting of the FAANG equities.
4.5.
Table 7. Comparison
Profits with
generated Other
when Studies on test data for the FAANG equities.
backtesting
Kamble [13] leveraged various classification models to predict if a set of 1000 Indian
Equity Profit Generated Price of Equity at the Beginning of the Term Return Percentage
stocks would achieve the set target price of 110%, they managed to achieve an accuracy of
Facebook $85.63 $102.97
66.8% for the Buy Signals in their short term model and a precision of 75.82% 83.16%
in their long
Amazon $479.30
term model. On the other hand, Hargreaves$636.99 et al. [15] received an overall75.25%
sensitivity of
Apple $87.30
92% and specificity of 55% implying that $99.96
their system was able to successfully 87.34%
capture 92%
Netflix $118.12 $107.66 109.72%
of all buy signals and only 55% of the sell signals which is impressive but doesn’t reflect
Google on how many signals of the other category
$466.83 $761.53 were incorrectly captured also,61.30%
this reflects a
possible bias of the system towards the buy signals.
4.5. Dai [47] modelled
Comparison stockStudies
with Other price to predict for both short and the long term i.e for the next
day orKamble
the next[13]
n-days
leveraged variousDifferent
respectively. typesmodels
classification of learning algorithms
to predict such
if a set as logistic
of 1000 Indian
regression, quadratic discriminant analysis, and SVM were utilized in price modelling
stocks would achieve the set target price of 110%, they managed to achieve an accuracy on
historic data ranging from September 2008 to August 2013. The highest accuracy
of 66.8% for the Buy Signals in their short term model and a precision of 75.82% in theirachievedAppl. Syst. Innov. 2021, 4, 17 14 of 17
in the next-day prediction model was 58.2%, while the accuracy can be as high as 79.3% in
the SVM based long-term model with a time window of 44. This was further improved to
96.92% with a time window of 88 days.
Considering the above studies which tackle the problem of stock prediction, one
can see that an overall accuracy of 83.62%, 85% precision for buy signals, 88% recall for
sell signals certainly means that the use of a combination of technical and fundamental
indicators mentioned in Table 1 can improve the performance of the system. We labelled
stocks based on the 1% increase/decrease in the price; with a precision of 85% on 10th day,
there is potential for an investor to make 25% annual returns on investment, given that
there are 250 working days in the US market.
5. Discussion and Conclusions
Predicting the price of an equity is a complex task. There, have been multiple studies
in this area, each achieving success in their own way. This study combines the 2 schools of
thought to identify a set of fundamental and technical indicators that could successfully
predict the price movement of equities on the S&P500 and consequently be used to generate
excess returns on the stock market.
Overall, our model showed high promise with strong numbers in all regards including
accuracy, precision and recall. Specifically, our model’s recall of 100% means that the model
performed really well for sell signals which could be used for shorting strategy. A shorting
strategy is a strategy in which trader borrow and sell in a hope that the equity of the
equity we decrease in future when it could be bought to settle the trade. This strategy is
considered riskier and is usually adopted by experienced traders, however, an appropriate
stop loss with the confidence in machine learning along with the context of our study’s
results traders can be assured of a profit-making strategy. On the other hand, we have
achieved a good precision of 85% on predicting the possibility of a stock’s price going up
by 1% on 10th day. This means that though the model missed a few buying opportunities,
the ones that were predicted were true buys. In our opinion, this property is important
for investors as they wouldn’t mind to miss out on a few opportunities as long as they
are comfortable and know that the stock they’ve invested in is indeed going to give them
at least 1% profit. This also means that for 250 US working days there is a possibility of
generating a minimum of 25% annual return (1% minimum gain on every 10th day) on
investment which beats the S&P 500 annual return.
The PCA analysis showed 15 components to be representative of ~ 99% variance in
the data, suggesting that though most of the 28 features were contributing towards the
predictions yet it was these 15 forming the foundation of the data. By aggregating based
on eigenvalue, we further identified a subset of 6 features that contribute most in the
PCA-components and could predict stock prices almost as well as the original 28 features.
Through this, we also established that the indicators ‘Total Hold’, ‘Total Buy’ and ‘Total Sell
Recommendation’ which come from the analyst recommendations were highly significant
in predicting the stock prices.
Finally, during the backtesting of the classifier, it generated promising returns on the
initial investment. Though we acknowledge that it was carried out on a small set of equities
due to the manual nature of the task, but with more sophisticated backtesting algorithms
and combination of other common trading strategies, the positive returns should hold
even for other kinds of equities in the S&P500, if not simply now. Another factor for future
research is that our model did not consider the effect of buying of selling on the equity
price movement, especially in the case of large funds whose actions of buying or selling
immediately change the market dynamics. However, we still believe that our model is
immediately useful for a small investor and the focus of the study was always on long-term
fundamental investing and not based on the patterns of the trading chart.
Finally, with rapid improvements in the tools offered by Machine learning and deep
learning [2,48], this is an ever-evolving field and our quest to understand how the markets
work and identify trends is never-ending. Going forward, the results from this studyAppl. Syst. Innov. 2021, 4, 17 15 of 17
could be tested in a different market like The Bombay Stock Exchange or the Shanghai
Stock Exchange or the results could be further drilled down to identify the most optimal
subset. In summary, we provide a complete workflow which is very easy to understand
and implement for a real-trading system and our rigorous testing shows that the system
has a potential to gain excess returns compared to the usual S&P 500 annual returns.
Author Contributions: Conceptualization, J.S. and M.K.; methodology, J.S. and M.K.; software, J.S.;
validation, J.S.; formal analysis, J.S.; investigation, J.S.; resources, J.S. and M.K.; data curation, J.S.;
writing—original draft preparation, J.S.; writing—review and editing, J.S. and M.K.; visualization,
J.S.; supervision, M.K.; project administration, J.S. All authors have read and agreed to the published
version of the manuscript.
Funding: This research received no external funding.
Data Availability Statement: The code is available from http://mkhushi.github.io/ (accessed on
1 February 2021).
Acknowledgments: The data was analysed at a Bloomberg Finance L.P. Terminal located at The
University of Sydney.
Conflicts of Interest: The authors declare no conflict of interest.
Dataset License: License under which the dataset is made available (CC0, CC-BY, CC-BY-SA,
CC-BY-NC, etc.).
References
1. Meng, T.L.; Khushi, M. Reinforcement Learning in Financial Markets. Data 2019, 4, 110. [CrossRef]
2. Hu, Z.; Zhao, Y.; Khushi, M. A Survey of Forex and Stock Price Prediction Using Deep Learning. Appl. Syst. Innov. 2021, 4, 9.
[CrossRef]
3. Kiang, M.Y.; Chi, R.T.; Tam, K.Y. DKAS: A Distributed Knowledge Acquisition System in a DSS. J. Manag. Inf. Syst. 1993, 9, 59–82.
[CrossRef]
4. Malkiel, B.G.; Fama, E.F. Efficient Capital Markets: A Review of Theory and Empirical. J. Financ. 1970, 25, 383–417. [CrossRef]
5. Cheung, Y.W.; Chinn, M.D.; Pascual, A.G. Empirical exchange rate models of the nineties: Are any fit to survive? J. Int. Money
Financ. 2005. [CrossRef]
6. Pesaran, M.H.; Timmermann, A. Predictability of Stock Returns: Robustness and Economic Significance. J. Financ. 1995, 50, 1201.
[CrossRef]
7. Ou, J.A. The Information Content of Nonearnings Accounting Numbers As Earnings. J. Account. Res. 1990, 28, 144–163. [CrossRef]
8. Trigueiros, D.; Sam, C. Discovering the optimal set of ratios to use in accounting-based models. Int. J. Soc. Syst. Sci. 2018, 10, 110.
[CrossRef]
9. Beneish, M.D.; Lee, C.M.C.; Tarpley, R.L. Contextual Fundamental Analysis through the Prediction of Extreme Returns. Rev.
Account. Stud. 2001, 6, 165–189. [CrossRef]
10. Anderson, M.; Hyun, S.; Yu, D. Fundamental Analysis Conditioned on Firm Life Cycle. In University of Calgary Working Paper;
University of Calgary: Calgary, AB, Canada, 2017.
11. Thomsett, M.C. Mastering Technical Analysis; Dearborn Trade Publishing: Chicago, IL, USA, 1999.
12. Beyaz, E.; Tekiner, F.; Zeng, X.-j.; Keane, J. Comparing Technical and Fundamental Indicators in Stock Price Forecasting. In
Proceedings of the IEEE 20th International Conference on High Performance Computing and Communications; IEEE 16th
International Conference on Smart City; IEEE 4th International Conference on Data Science and Systems (HPCC/SmartCity/DSS),
Exeter, UK, 28–30 June 2018; pp. 1607–1613. [CrossRef]
13. Kamble, R.A. Short and Long Term Stock Trend Prediction using Decision Tree. In Proceedings of the International Conference
on Intelligent Computing and Control Systems (ICICCS), Madurai, India, 15–16 June 2017; pp. 1371–1375.
14. Dropsy, V. Do macroeconomic factors help in predicting international equity risk premia?: Testing the out-of-sample accuracy of
linear and nonlinear forecasts. J. Appl. Bus. Res. 1996, 12, 120–132. [CrossRef]
15. Hargreaves, C.; Hao, Y. Does the use of technical & fundamental analysis improve stock choice? A data mining approach applied
to the Australian stock market. In Proceedings of the International Conference on Statistics in Science, Business and Engineering:
“Empowering Decision Making with Statistical Sciences”, Langkawi, Malaysia, 10–12 September 2012; pp. 109–114. [CrossRef]
16. Tkáč, M.; Verner, R. Artificial neural networks in business: Two decades of research. Appl. Soft Comput. J. 2016, 38, 788–804.
[CrossRef]
17. Lin, M.; Lin, F. Analysis of financial data using neural nets. Ai Expert. 1993, 8, 36.
18. Kryzanowski, L.; Galler, M.; Wright, D.W. Using Artificial Neural Networks to Pick Stocks. Financ. Anal. J. 1993, 49, 21–27.
[CrossRef]Appl. Syst. Innov. 2021, 4, 17 16 of 17
19. Tan, C.S.; Yong, C.K.; Tay, Y.H. Modeling financial ratios of Malaysian plantation stocks using Bayesian Networks. In Proceedings
of the IEEE Conference on Sustainable Utilization and Development in Engineering and Technology, STUDENT 2012—Conference
Booklet, Kuala Lumpur, Malaysia, 6–9 October 2012; pp. 7–12. [CrossRef]
20. Huang, C.F.; Chang, C.H.; Chang, B.R.; Cheng, D.W. A study of a hybrid evolutionary fuzzy model for stock selection. In Proceedings
of the IEEE International Conference on Fuzzy Systems (FUZZ-IEEE 2011), Taipei, Taiwan, 27–30 June 2011; pp. 210–217. [CrossRef]
21. Yu, L.; Hu, L.; Tang, L. Stock Selection with a Novel Sigmoid-Based Mixed Discrete-Continuous Differential Evolution Algorithm.
IEEE Trans. Knowl. Data Eng. 2016, 28, 1891–1904. [CrossRef]
22. Reinganum, M.R. The Anatomy of a Stock Market Winner. Financ. Anal. J. 1988, 44, 16–28. [CrossRef]
23. Tirea, M.; Negru, V. Intelligent stock market analysis system—A fundamental and macro-economical analysis approach. In
Proceedings of the 16th International Symposium on Symbolic and Numeric Algorithms for Scientific Computing, SYNASC 2014,
Timisoara, Romania, 22–25 September 2014; pp. 519–526. [CrossRef]
24. Yu, L.; Wang, S.; Lai, K.K. Neural network-based mean–variance–skewness model for portfolio selection. Comput. Oper. Res. 2008,
35, 34–46. [CrossRef]
25. Lam, M. Neural network techniques for financial performance prediction: Integrating fundamental and technical analysis. Decis.
Support Syst. 2004, 37, 567–581. [CrossRef]
26. Qi, L.; Khushi, M.; Poon, J. Event-Driven LSTM for Forex Price Prediction. In Proceedings of the IEEE Asia-Pacific Conference on
Computer Science and Data Engineering (CSDE), Gold Coast, QLD, Australia, 16–18 December 2020.
27. Zeng, Z.; Khushi, M. Wavelet Denoising and Attention-based RNN- ARIMA Model to Predict Forex Price. In Proceedings of the
International Joint Conference on Neural Networks (IJCNN), Glasgow, UK, 19–24 July 2020; pp. 1–7.
28. Zhang, Z.; Khushi, M. GA-MSSR: Genetic Algorithm Maximizing Sharpe and Sterling Ratio Method for RoboTrading. In
Proceedings of the International Joint Conference on Neural Networks (IJCNN), Glasgow, UK, 19–24 July 2020; pp. 1–8.
29. Zhao, Y.; Khushi, M. Wavelet Denoised-ResNet CNN and LightGBM Method to Predict Forex Rate of Change. In Proceedings of
the IEEE International Conference on Data Mining Workshops (ICDMW), Sorrento, Italy, 17–20 November 2020.
30. Kim, T.W.; Khushi, M. Portfolio Optimization with 2D Relative-Attentional Gated Transformer. In Proceedings of the IEEE
Asia-Pacific Conference on Computer Science and Data Engineering (CSDE), Gold Coast, QLD, Australia, 27 December 2020.
31. Faustryjak, D.; Jackowska-Strumiłło, L.; Majchrowicz, M. Forward forecast of stock prices using LSTM neural networks with
statistical analysis of published messages. In Proceedings of the International Interdisciplinary PhD Workshop (IIPhDW),
Swinoujście, Poland, 9–12 May 2018; pp. 288–292.
32. Paluch, M.; Jackowska-Strumiłło, L. Hybrid Models Combining Technical and Fractal Analysis with ANN for Short-Term
Prediction of Close Values on the Warsaw Stock Exchange. Appl. Sci. 2018, 8, 2473. [CrossRef]
33. Iuhasz, G.; Tirea, M.; Negru, V. Neural network predictions of stock price fluctuations. In Proceedings of the 14th International
Symposium on Symbolic and Numeric Algorithms for Scientific Computing, SYNASC 2012, Timisoara, Romania, 26–29 September
2012; pp. 505–512. [CrossRef]
34. Premti, A.; Garcia-Feijoo, L.; Madura, J. Information content of analyst recommendations in the banking industry. Int. Rev. Financ.
Anal. 2017, 49, 35–47. [CrossRef]
35. Womack, K.L. Do Brokerage Analysts’ Recommendations Have Investment Value? J. Financ. 1996, 51, 137–167. [CrossRef]
36. Barber, B.; Lehavy, R.; McNichols, M.; Trueman, B. Can Investors Profit from the Prophets? Security Analyst Recommendations
and Stock Returns. J. Financ. 2001, 56, 531–563. [CrossRef]
37. Park, S.J.; Park, K.Y. Can investors profit from security analyst recommendations? New evidence on the value of consensus
recommendations. In Finance Research Letters; Elsevier: Amsterdam, The Netherlands, 2018. [CrossRef]
38. Zaremba, A.; Konieczka, P. The profitability of following analyst recommendations on the polish stock market. e-Finanse
2015, 11, 22–31. [CrossRef]
39. Liao, M.H.; Chang, C.Y. Analysts’ forecasts and institutional investors’ behavior. In Proceedings of the 8th International
Conference on Innovative Mobile and Internet Services in Ubiquitous Computing, IMIS 2014, Birmingham, UK, 2–4 July 2014;
Institute of Electrical and Electronics Engineers Inc.: Piscataway, NJ, USA, 2014; pp. 575–579. [CrossRef]
40. Murg, M.; Pachler, M.; Zeitlberger, A.C.M. The impact of analyst recommendations on stock prices in Austria (2000–2014):
Evidence from a small and thinly traded market. CEJOR 2016, 24, 595–616. [CrossRef]
41. Jegadeesh, N.; Kim, J.; Krische, S.D.; Lee, C.M.C. Analyzing the Analysts: When Do Recommendations Add Value?; Analyzing
the Analysts: When Do Recommendations Add Value? J. Financ. 2004, 59, 1083–1124. [CrossRef]
42. Marks, J.; Yezegel, A. Do aggregate analyst recommendations predict market returns in international markets? Int. Rev. Financ.
Anal. 2018, 59, 234–254. [CrossRef]
43. Chiang, M.T.; Lin, M.C. Market sentiment and herding in analysts’ stock recommendations. North Am. J. Econ. Financ. 2019.
[CrossRef]
44. Corredor, P.; Ferrer, E.; Santamaria, R. The role of sentiment and stock characteristics in the translation of analysts’ forecasts into
recommendations. North Am. J. Econ. Financ. 2019, 49, 252–272. [CrossRef]
45. Nam, J.; Wang, J.; Xing, C.; Zhang, G. Are hated stocks good investments? North Am. J. Econ. Financ. 2018. [CrossRef]
46. Khushi, M.; Dean, I.M.; Teber, E.T.; Chircop, M.; Arthur, J.W.; Flores-Rodriguez, N. Automated classification and characterization
of the mitotic spindle following knockdown of a mitosis-related protein. BMC Bioinform. 2017, 18, 566. [CrossRef]You can also read