Examining the Walking Accessibility, Willingness, and Travel Conditions of Residents in Saudi Cities - MDPI
←
→
Page content transcription
If your browser does not render page correctly, please read the page content below
International Journal of
           Environmental Research
           and Public Health

Article
Examining the Walking Accessibility, Willingness,
and Travel Conditions of Residents in Saudi Cities
Muhammad Tauhidur Rahman 1, *                    and Kh. Md. Nahiduzzaman 2
 1    Department of City and Regional Planning, King Fahd University of Petroleum and Minerals,
      KFUPM Box 5053, Dhahran 31261, Saudi Arabia
 2    School of Engineering, The University of British Columbia (UBC)—Okanagan, 1137 Alumni Ave,
      Kelowna 1V1 1V7, BC, Canada; nahid@kfupm.edu.sa
 *    Correspondence: mtr@kfupm.edu.sa; Tel.: +966-13-860-7364

 Received: 26 December 2018; Accepted: 12 February 2019; Published: 14 February 2019

 Abstract: Rapid urban expansion and population growth in Saudi cities over the past four decades
 have increased vehicular accidents and traffic congestion and have impacted the daily walking
 conditions of the residents. Walking has various health and environmental benefits. In North
 American and European countries, three factors have been found to motivate a resident to walk within
 their community: their accessibility to community social and business facilities, their perception
 and willingness, and the safety conditions of the roads and sidewalks within their community for
 walking. This study examined these factors and their role in the walking habits of the residents
 in the neighborhoods of Doha and Dana districts in Saudi Arabia’s eastern city of Dhahran. Data
 were collected through field observations and by randomly sampling and interviewing 200 residents.
 Geographic Information Systems (GIS) and SPSS statistical software were used for data analysis.
 The results show that most of the community facilities are randomly placed in the districts. Mosques
 are the closest facility to each resident with an average accessibility distance of 242m. Almost 43% of
 the respondents prefer daily walking while the rest are hesitant due to hot weather during summer
 and narrow and poorly designed sidewalks. The sidewalks were also found to be blocked by trees,
 street signals, and illegally parked vehicles. Future studies should explore the accessibility to facilities,
 willingness, climate, and health conditions of the residents, and the road and sidewalk conditions for
 walking in other cities of the Kingdom.

 Keywords: walkability; built environment; accessibility; willingness and perception; safety;
 road conditions

1. Introduction
      Every day, millions of adults and children in both developed and developing countries
are diagnosed with obesity-related health issues including diabetes, cardiovascular diseases, and
cancer [1–4]. For them, a simple but daily 30 minutes of physical activity, such as walking, can be
a path to reducing or managing body weight and obesity related co-morbidities, as well as, living
a long and healthy life [5]. Walking has economic and environmental benefits as well. By reducing
the trips made in private vehicles, residents see a decline in their monthly expenses for gasoline and
maintenance of their vehicles and also lessen the vehicle emissions and air pollutions within their
city [6,7]. Over the past 20 years, extensive studies in various major cities in the world have focused on
determining the reasons and factors that increase a person’s willingness to walk for its health benefits,
recreation, and as a mode of transportation to reach destinations and fulfill his or her basic needs
within the local community [8–11].
      While numerous factors have been identified in these studies, they can primarily be placed into
three major categories. First, objective measures such as accessibility and close proximity, pattern,

Int. J. Environ. Res. Public Health 2019, 16, 545; doi:10.3390/ijerph16040545    www.mdpi.com/journal/ijerph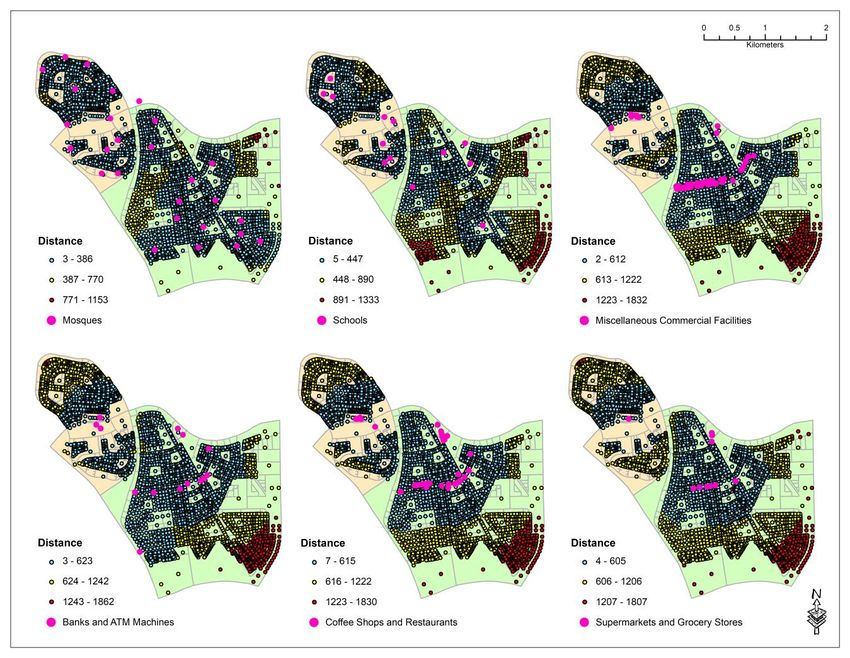
Int. J. Environ. Res. Public Health 2019, 16, 545                                                    2 of 16

and density of facilities are some of the most crucial factors to be associated with an urban resident’s
inclination for walking [8,12–14]. Examining the distances between a resident’s house and to the
nearest service center in the city of Paris, France, [15] found that residents are more likely to walk to
near facilities than service centers at distant locations irrespective of their socio-economic conditions.
In San Diego [16] observed that neighborhoods with high-walkability rates had a high concentration
of commercial centers (restaurants, banks, grocery and convenient stores) along the main roads of
residential neighborhoods. Surveying older Australians, [11] showed that residents who lived near
facilities that are close and accessible are more likely to walk and be active than distant residents.
Second, subjective measures such as a person’s perception and attitude towards walking will likely
impact their daily walking habits and behaviors. Surveying school children’s commuting behavior to
schools in the morning, [17] concluded that the perception and attitude of the parents towards their
kids walking to school was one of the main predictors of their children commuting actively. Perceptions
of street connectivity and traffic safety were also found to be the factors affecting the walking behaviors
of senior adults [18]. Finally, studies have linked various neighborhood street characteristics including
traffic flow, the presence of green environment, and width and conditions of the sidewalk with the
amount people walk within their neighborhoods [19]. While green environments with wider, cleaner,
and obstacle-free sidewalks stimulated people to walk [20–22], the presence of crime, discontinued or
lacking sidewalks, and traffic safety concerns discouraged residents from walking and biking in their
communities [23,24].
      Since the early 1970s, cities in the Kingdom of Saudi Arabia have increased significantly in size
and experienced rapid population growth due to rising economic growth and prosperity [25,26]. Such
growth of cities has had various environmental, social, and economic consequences, including air and
water pollution, frequent incidence of flooding, rising land surface temperatures, lack of affordable
housing, and rising energy demand [27–32]. It is also increasing the total number of vehicles in each
city and affecting their transportation systems and road networks by causing more traffic congestion,
frequent accidental injuries and deaths, increasing average trip time, and reducing the available parking
spaces in the commercial centers and residential neighborhoods [33,34]. Thus, it has directly impacted
the walking conditions of the residents in Saudi cities. However, only few studies have examined the
behavior and walking conditions of the residents within these cities. [35] examined socio-cultural factors
on the walking behavior of the residents in the Saudi capital city of Riyadh. Also for Riyadh, [36]
analyzed the incidents and injury patterns among pedestrians and vehicle accidents between 1997 and
1999. [6] explored the difficulties that are faced by pedestrians within a small national park in the Saudi
eastern coastal city of Dammam and discussed how smart solutions can be utilized to resolve some of
those difficulties. Finally, [37] attempted to redesign the old souk (shopping center) of the southwestern
coastal city of Jizan to improve its walking conditions and overall quality for its visitors.
      As none of the abovementioned studies have investigated the previously discussed three main
factors affecting walkability in Saudi cities, this study aims to fulfill that gap. It will do so by
first examining the distribution patterns of community services in the Doha and Dana residential
neighborhoods within the city of Dhahran in the Eastern Province of the Kingdom. Using a detailed
survey questionnaire, the study will then investigate the travel behavior, perceptions, and the resident’s
willingness to walk to the community service centers. Finally, it will assess the designs and conditions
of the streets and sidewalks within the two neighborhoods. In the following sections, a brief description
of the study areas is given in Section 2. Section 3 highlights the detailed methodology used in the
study. The results are provided in Section 4 and are discussed in Section 5. Finally, the concluding
remarks and the path for future studies are provided in Section 6.

2. Study Area
      The residential neighborhood districts of Doha and Dana with a total area of almost 9 sq. km
within the city of Dhahran were chosen as the area of interest for this study. Dhahran, along with the
cities of Al-Khobar and Dammam, are the three cities that are part of the greater Dammam Metropolitan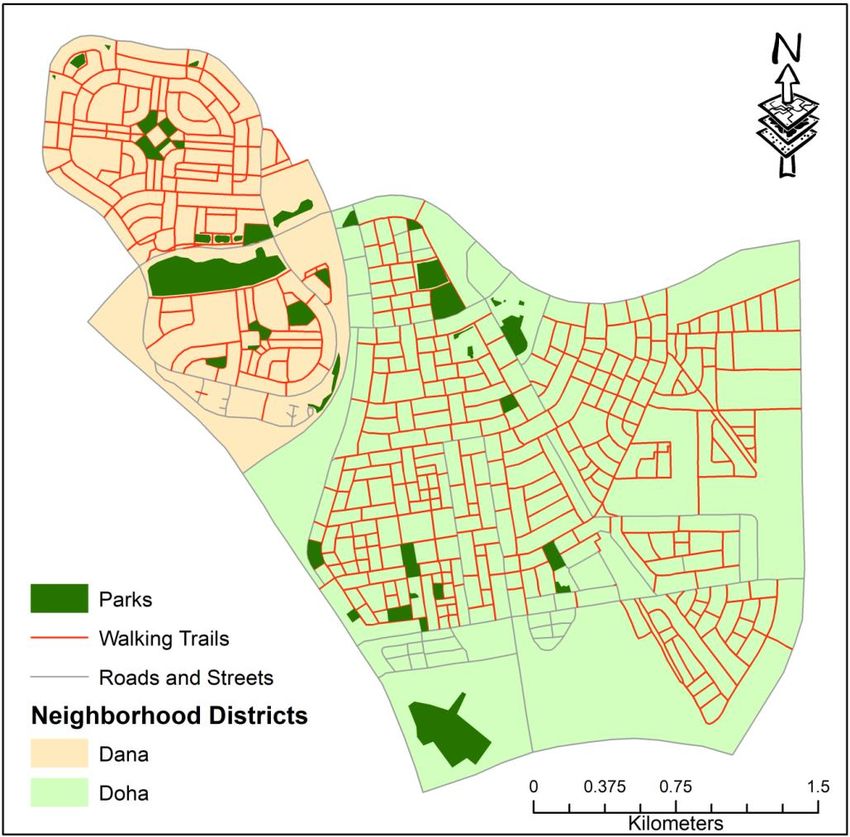
Metropolitan Area in the Eastern Province of the Kingdom of Saudi Arabia (Figure 1). The
  population of Dhahran has increased tremendously over the past several decades after oil was
  discovered in the region and the establishment of the headquarters of the Arabian American Oil
  Company (later renamed Saudi ARAMCO) along with the King Fahd University of Petroleum and
  Minerals (KFUPM) in 1963. Today, the city has a population of approximately 200,000 with an
Int. J. Environ.
  annual         Res. Public
             growth    rate Health 2019,
                             of 6.5%     16, 545
                                      [38].                                                            3 of 16
          To provide housing and daily needs of the residents in the city, several planned residential
  areas had been developed over the past three decades. Doha and Dana are two of such major
Area in the Eastern Province of the Kingdom of Saudi Arabia (Figure 1). The population of Dhahran
  residential communities housing mostly regular and contracted employees of Saudi Aramco along
has increased tremendously over the past several decades after oil was discovered in the region and
  with few faculty members and students of KFUPM. While the residents are mostly Saudis, there are
the establishment of the headquarters of the Arabian American Oil Company (later renamed Saudi
  also expatriates residing in the communities from the neighboring Arab, south, and southeast Asian
ARAMCO) along with the King Fahd University of Petroleum and Minerals (KFUPM) in 1963. Today,
  countries. The city experiences a desert climate with hot and humid summers (temperatures ranging
the
  fromcity21
           has   a population
              °C–49   °C) and coolof approximately  200,000
                                      and dry (10 °C–23      with an[39].
                                                        °C) winters   annual growth rate of 6.5% [38].

                                    Figure 1.
                                    Figure 1. Study
                                              Study Area
                                                    Area in
                                                          inthe
                                                             theCity
                                                                CityofofDhahran.
                                                                         Dhahran.

  3. Data and Methods
      To provide housing and daily needs of the residents in the city, several planned residential areas
had been
       Thedeveloped
             data for this over  the past
                              study   werethree   decades.
                                             collected   by theDoha  and Dana
                                                                  authors   and two are two  of such
                                                                                        research      major residential
                                                                                                   assistants  in three
communities      housing     mostly   regular  and    contracted   employees       of Saudi
  primary phases to fulfill the three goals of the study. In the first phase, the distributionAramco     along  with of
                                                                                                            patterns  few
faculty  membersservices
  the community       and students      of KFUPM.
                               were examined            While GPS
                                                 by utilizing   the residents
                                                                     and Geographicare mostly   Saudis,Systems
                                                                                          Information      there are  also
                                                                                                                  (GIS)
expatriates   residing
  technologies.   A totalinofthe   communities
                               6 separate           from
                                           field visits     the neighboring
                                                         during  the month ofArab,       south,ofand
                                                                                   September      2013southeast
                                                                                                         were madeAsian
                                                                                                                     to
countries.  Thetypes
  10 different    city experiences
                         of individuala community
                                         desert climate    with hot
                                                       services  andand    humid
                                                                       facilities    summers
                                                                                   (Table       (temperatures
                                                                                           1) and  their latitudesranging
                                                                                                                    and
from  21 ◦ C–49were
  longitudes      ◦ C) and
                        recorded    using
                             cool and   drya(10  ◦ C–23 Juno
                                              Trimble     ◦ C) winters
                                                                SB portable
                                                                        [39]. GPS unit. The coordinates were
  transferred into the ArcGIS v.10 software (ESRI, Redlands, CA, USA) and using available paper
3.maps
   Data and
         and Methods
              imagery from Google Earth, the streets and all the individual land parcels within the
  study
     The datawere
         area         manually
                 for this         digitized
                           study were        in theby
                                         collected   ArcGIS    software.
                                                        the authors   andThe
                                                                           twodistances
                                                                                  research between
                                                                                            assistantseach   individual
                                                                                                        in three primary
  parcel and the nearest facilities were then calculated. The Nearest Neighbor Index (NNI) for each
phases  to fulfill the three goals of the study. In the first phase, the distribution patterns of the community
services were examined by utilizing GPS and Geographic Information Systems (GIS) technologies.
A total of 6 separate field visits during the month of September of 2013 were made to 10 different
types of individual community services and facilities (Table 1) and their latitudes and longitudes were
recorded using a Trimble Juno SB portable GPS unit. The coordinates were transferred into the ArcGIS
v.10 software (ESRI, Redlands, CA, USA) and using available paper maps and imagery from Google
Earth, the streets and all the individual land parcels within the study area were manually digitized
in the ArcGIS software. The distances between each individual parcel and the nearest facilities were
then calculated. The Nearest Neighbor Index (NNI) for each type of community service facility were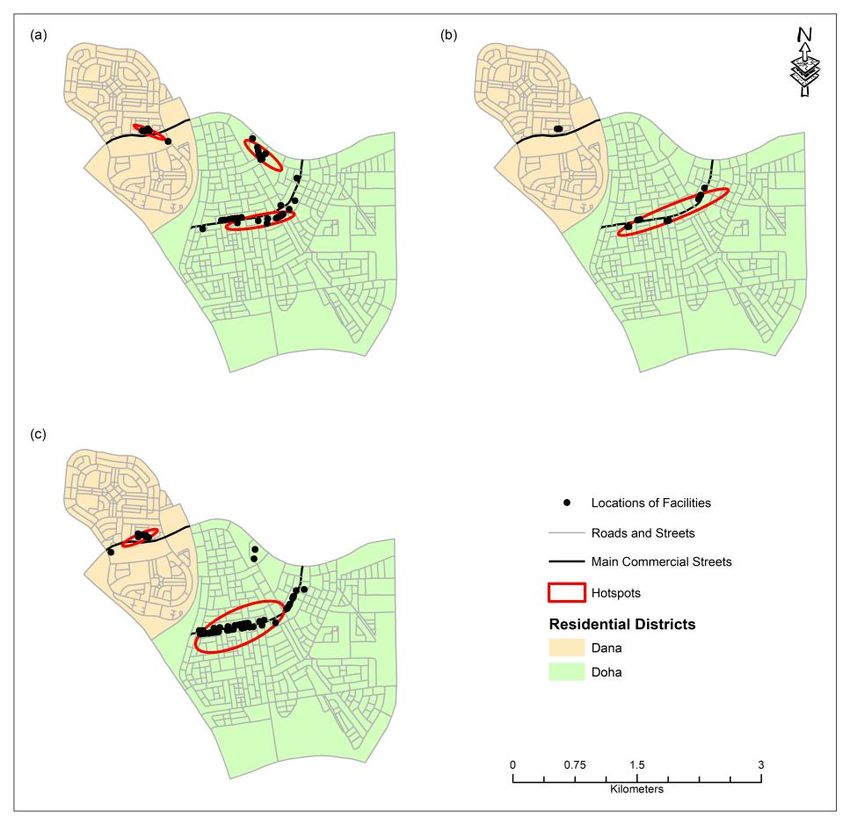
Int. J. Environ. Res. Public Health 2019, 16, 545 4 of 16
calculated in ArcGIS to examine their pattern of distribution by knowing if the locations of the facilities
are systematically clustered together or if they are dispersed or randomly built throughout the study
area. The NNI was calculated in ArcGIS using the following equation where D nnd is the average
distance between each facility and the nearest facility and Dran is the distance that would be expected
if the facilities were randomly distributed:
D nnd
NN I = Dran
; where
∑in=1 di
q (1)
A
D nnd = n and Dran = 0.5 × n
In the equations, n is the total number of facilities within the study area; di is the distance between
each facility and its nearest neighboring facility and A is the total area for study (8,775,460 m2 ). The NNI
value near 0 indicates clustering while value close to 1 suggests the facilities are randomly distributed.
Values greater than 1 suggests that the points are spatially dispersed. For facilities that had a clustering
pattern, hotspot analyses using the Nearest Neighbor Hierarchical Clustering (NnH) algorithm in the
CrimeSTAT v. 3.3 software platform (The National Institute of Justice, Washington D. C., WA, USA)
were performed.
In the second phase, attempts were made to examine the perception and willingness of the
residents of the neighborhood towards walking to gather an in-depth understanding on the nature of
walkability within the neighborhoods of Doha and Dana. To do so, a detailed survey questionnaire
consisting of both open ended and multiple choice questions categorized into three major groups
was created. The first set of questions focused on the basic needs and requirements that are fulfilled
by the respondents and the mode of transportation that is used to fulfill them. The second set of
questions investigated the typical daily walking distance and frequency for the respondents who
preferred walking. Finally, the reasons why the respondents who are hesitant to walk were explored.
The questionnaires were completed by a total of 200 respondents (from separate households) selected
through systematic random sampling method from various parts of the study areas between September
and December of 2013. The data were then entered into SPSS v. 17 statistical software package (SPSS
Inc., Chicago, IL, USA) for further analysis.
Finally, in the third phase, nine separate field visits were made in the months of January and
February of 2014 across the study area to examine the neighborhood walking conditions. During the
visits, detailed auditing of the streets and sidewalks including the presence and structural conditions
of sidewalks for walking, their vacancy, and usability were noted using a standardized checklist
and captured through digital photographs using a D3200 Digital Single Lens Reflex (DSLR) digital
camera (Nikon, Tokyo, Japan). Width of sidewalks were also measured using a Vata 30 m fiberglass
measuring tape.
4. Results
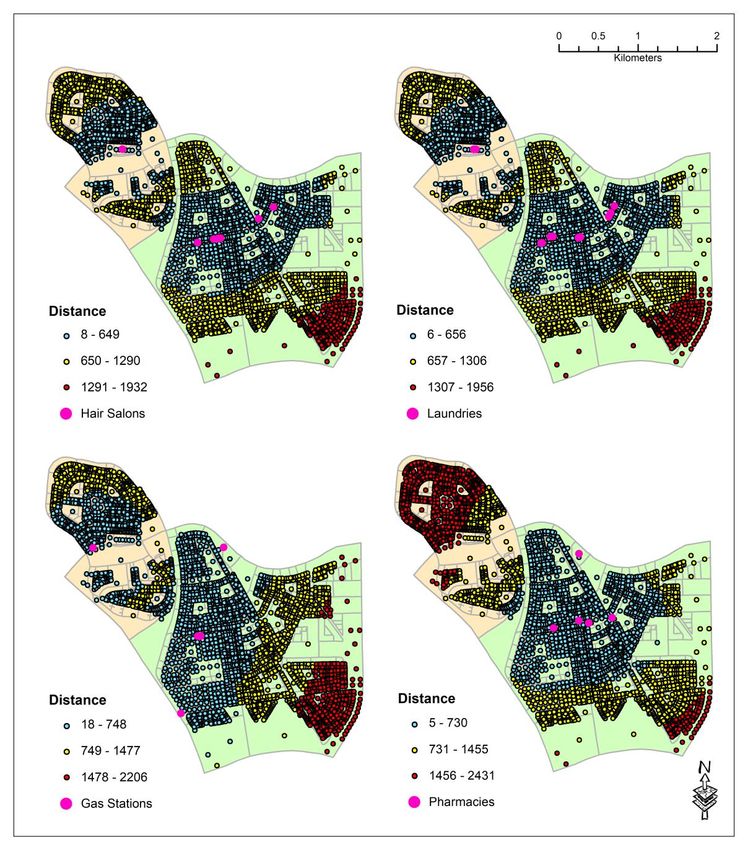
4.1. Patterns and Distribution of Community Services
Based on the field surveys, it was found that the commercial and community service facilities
within the two residential neighborhoods can be grouped into 10 major categories. The category of the
facilities, their numbers, and their distribution type based on the NNI values are provided in Table 1.
For this study, NNI values below 0.25 were considered to indicate clustering, values between 0.25 and
1 indicated random pattern, and above 1 were considered to indicate dispersed pattern. Based on
the NNI values, mosques and gas stations are all dispersely located in the study area. The schools,
hair salons, banks and ATMs, pharmacies, supermarkets and grocery stores are randomly established
whereas coffee shops and restaurants, various miscellaneous commercial facilities, and laundry services
are clustered within certain areas. Therefore, hotspot analysis using the Nearest Neighbor Hierarchical
Clustering (NnH) algorithm using the parameters shown in Table 2 was performed on the latter three
features. These parameters produced the logical numbers of clusters for each category of facility.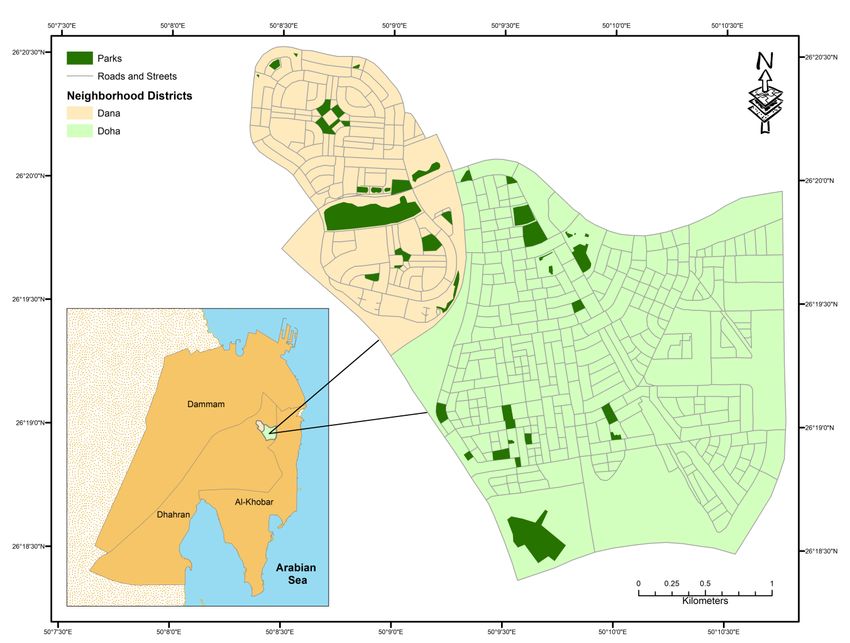
Int. J. Environ. Res. Public Health 2019, 16, 545 5 of 16
Int. J. Environ. Res. Public Health 2019, 16, x 5 of 15
type were
Figure then the
2 shows calculated.
hotspotsThe minimum,
produced maximum,
for each category.and the
The mean distances
distances betweenfortheeach category
centroid of
of each
services are
digitized shown in
residential Table
land 3 and
parcel andtheir distributions
to the are shown
nearest facility by typein Figure
were then3 calculated.
and FigureThe4. minimum,
maximum, and the mean distances for each category of services are shown in Table 3 and their
Table 1. The
distributions are community facilities3considered
shown in Figures and 4. in the study and their distribution pattern based on the
NNI values.
Table 1. The community facilities considered in the study and their distribution pattern based on the
Observed Mean
NNI values. Number of Distribution
Type of Facility Mean Random NNI
Facility Pattern
Distance (m) Distance (m)
Number of Observed Mean Mean Random Distribution
LaundriesType of Facility 9 39.17 (m) 493.72 NNI
Facility Distance Distance (m) 0.08 Clustered
Pattern
Misc. Commercial Facilities 71 30.97 175.78 0.18 Clustered
Laundries 9 39.17 493.72 0.08 Clustered
Coffee
Misc. Shops & Restaurants
Commercial Facilities 38
71 57.37
30.97 240.28
175.78 0.240.18 Clustered
Clustered
Supermarket
Coffee Shops&&Grocery
Restaurants 38 57.37 240.28
10 228.10 468.39 0.490.24 Clustered
Random
Stores
Supermarket & Grocery Stores 10 228.10 468.39 0.49 Random
Pharmacies
Pharmacies 55 362.82
362.82 662.40
662.40 0.550.55 Random
Random
Banks & ATMs
Banks & ATMs 14
14 221.50
221.50 395.86
395.86 0.560.56 Random
Random
Hair Salons 8 294.26 523.67 0.56 Random
Hair Salons 8 294.26 523.67 0.56 Random
Schools 13 315.56 410.80 0.77 Random
Schools
Gas Stations 135 315.56
771.56 410.80
662.40 0.771.16 Random
Dispersed
Gas Stations
Mosques 527 771.56
357.15 662.40
285.05 1.161.25 Dispersed
Dispersed
Mosques 27 357.15 285.05 1.25 Dispersed
Figure 2. Hotspots of
2. Hotspots of coffee shops
shops and restaurants (a), laundry facilities (b), and miscellaneous
commercial
commercial facilities (c).
(c).
Table 2. The ideal parameters (threshold distance and the minimum number of facility per hotspot)
Table 2. The ideal parameters (threshold distance and the minimum number of facility per hotspot)
considered for hotspot analysis.
considered for hotspot analysis.
Number of
Threshold MinimumMinimum
Number of Number Number of Number
Number of Facilities
of
Type of Facility Threshold Hotspots
Type of Facility
Distance (m) Distance
Facility per of Facility
Hotspot Hotspots Facilities
per per
Hotspot
(m) Produced
per Hotspot Produced Hotspot
Coffee Shops
Coffee & & Restaurants
Shops 500 5 3 8,
500 5 3 8,5,5,and
and1010
RestaurantsLaundries 1000 5 1 7
Miscellaneous
Laundries Commercial Facilities
1,000 1000 5 5 1 2 7 and7 50
Miscellaneous
1,000 5 2 7 and 50
Commercial FacilitiesTable 3. Statistics about the distances between the residential parcels and the nearest facility.
Statistics of Distances (in meters)
Int.Type of Facility
J. Environ. Res. Public Health 2019, 16, 545 Standard6 of 16
Minimum Maximum Mean
Deviation
Mosques 3 1153 242 140
Table 3. Statistics about the distances between the residential parcels and the nearest facility.
Schools 5 1333 430 240
Miscellaneous Statistics of Distances (in meters)
Type of Facility 2 1832 576 383
Commercial Facilities Minimum Maximum Mean Standard Deviation
Banks & ATMs 3 1862 590 368
Mosques 3 1153 242 140
Coffee Shops &Schools 5 1333 430 240
7 1830 596 380
Miscellaneous
Restaurants Commercial Facilities 2 1832 576 383
SupermarketBanks
& & ATMs 3 1862 590 368
4
Coffee Shops & Restaurants 7 1807 1830 649
596 380 356
Grocery Stores & Grocery Stores
Supermarket 4 1807 649 356
Hair SalonsHair Salons 8 8 1932 1932 663
663 378 378
Laundries Laundries 6 6 1956 1956 670
670 383 383
Gas Stations 18 2206 807 458
Gas Stations 18 2206 807 458
Pharmacies 5 2431 963 607
Pharmacies 5 2431 963 607
Figure 3.
Figure 3. Distances
Distances in
in meters
meters between
between the
the residential
residential parcels
parcels and
andtheir
theirnearest
nearestmosque,
mosque,school,
school,bank
bank and
ATM machine, coffee shop and restaurant, supermarket and grocery store, and salon.
and ATM machine, coffee shop and restaurant, supermarket and grocery store, and salon.Int. J. Environ. Res. Public Health 2019, 16, 545 7 of 16
Int. J. Environ. Res. Public Health 2019, 16, x 7 of 15
Figure 4. Distances in meters between the residential parcels and their nearest laundry, gas station,
Figure 4. Distances in meters between the residential parcels and their nearest laundry, gas station,
and pharmacy.
and pharmacy.
4.2. Travel and Walking Behavior, and the Willingness to Walk by the Residents
4.2. Travel and Walking Behavior, and the Willingness to Walk by the Residents
Among the 200 surveyed respondents, 138 (69%) were male and 62 (31%) were female with a
meanAmong the 200
age of 30.33 surveyed
(standard respondents,
deviation 138The
of 11.23). (69%)firstwere
set ofmale and 62
questions (31%) on
focused were
thefemale with a
requirements
meangroceries,
(i.e., age of banking,
30.33 (standard deviation
school, etc.) of 11.23).
that are fulfilled Therespondents
by the first set of andquestions
the mode offocused on the
transportation
requirements (i.e. groceries, banking, school, etc.) that are fulfilled by the respondents
that is used to fulfill them. The results for these set of questions are shown in Tables 4 and 5. Second, and the mode
of transportation that is used to fulfill them. The results for these set of questions
the typical daily walking distance and frequency for the respondents who preferred walking were are shown in Tables
4 and 5. Second,
investigated. the typical daily
Approximately walking
42.5% of thedistance and frequency
respondents preferredfor the respondents
walking. who preferred
Among them, 84% are
male, 91.5% of them usually walk up to 1 km. daily, while the remaining 8.5% walk between Among
walking were investigated. Approximately 42.5% of the respondents preferred walking. 1–2 km.
them,
per 84%
day. are male,
Finally, 91.5% of them
the gender-wise usually
reasons whywalk up to 1 km. are
the respondents daily, whiletothe
hesitant remaining
walk 8.5% walk
were explored and
between 1-2 km. per day. Finally, the gender-wise
the summary of their answers are provided in Table 6. reasons why the respondents are hesitant to walk
were explored and the summary of their answers are provided in Table 6.Int. J. Environ. Res. Public Health 2019, 16, 545 8 of 16
Table 4. Distribution of the percentage of sampled residents (stratified by gender and age) who are
required to fulfill the daily basic necessary needs.
Gender Age in Years
Basic Needs Classification Male Female 60
n = 138 n = 62 n = 28 n = 98 n = 25 n = 30 n=9 n = 10
Grocery 83.33 69.35 82.1 90.8 84.0 70.0 11.1 30.0
Recreation 71.01 38.71 60.7 78.6 64.0 36.7 0.0 10.0
Banking 31.16 11.29 17.9 26.5 44.0 23.3 0.0 10.0
School & Employment 40.58 22.58 53.6 37.8 24.0 30.0 11.1 20.0
Others 43.48 27.42 42.9 36.7 32.0 43.3 22.2 60.0
Table 5. Mode of transportation to fulfill the basic necessary needs.
Mode of Transport (Percentage of Total Sampled Respondents)
Basic Needs Classification
Private Vehicle Public Transport Biking Walking
Grocery 95.5 9.1 9.1 59.1
Recreation 94.1 0 11.8 64.7
Banking 100 0 0 57.1
School & Employment 88.9 11.1 11.1 66.7
Table 6. Gender wise distribution of the percentage of total respondents and their reasons for not
willing to walk.
Gender
Reason for not Willing to Walk
Male Female
Hot and humid weather 36.3 32.4
Poorly designed sidewalk 15.6 8.7
Sidewalk is discontinuous 14.2 20.2
Unsafe road crossing 15.9 16.8
Design not suitable for walking 8.4 0
Narrow sidewalk 0 12.7
Sidewalk occupied by other establishments 9.5 9.2
4.3. Neighborhood Walking Conditions
Results from the field survey and GIS analyses show that the two neighborhoods have a total
street distance of approximately 107 km. Among them, 82.9 km (77.4%) have sidewalks or walking
trails (Figure 5). However, their usability for walking is limited for several reasons. First, the sidewalks
were found to be quite narrow (less than 1 meter) and poorly designed with date and palm trees
along with lamp posts and street signs erected in the middle. Second, 24% of the sidewalks were
seen to be occupied by parked vehicles of the surrounding residents. Almost 21% of the sidewalks
have permanent constructions including walking ramps and carports. Streets and sidewalks were also
found to be blocked with construction materials and hanging date leaves. These observations were
also noted by the surveyed respondents (as shown in Table 6) that deter their willingness to walk.Int. J. Environ. Res. Public Health 2019, 16, 545 9 of 16
Int. J. Environ. Res. Public Health 2019, 16, x 9 of 15
Figure 5. Streets with walking trails within the two residential neighborhood districts.
Figure 5. Streets with walking trails within the two residential neighborhood districts.
5. Discussion
5. Discussion
5.1. Patterns and Distribution of Community Services
5.1. Patterns and Distribution of Community Services
The results reveal that mosques are the most dispersely (NNI = 1.25) located facilities within the
studyThe results
area. reveal they
However, that mosques are the(mean
are the closest most dispersely
distance of(NNI 242 m)= 1.25) located
facilities facilities
to every within
single the
parcel.
study area.
Saudi Arabia However, they are of
is the birthplace theIslam
closest
and(mean distance
praying of 242 m) facilities
in congregation in mosques to every single part
is a major parcel.
of
Saudi Arabia is the birthplace of Islam and praying in congregation in mosques
the religion and culture. Therefore, it is necessary and logical for mosques to be the closest features is a major part of the
religion
and withinandwalking
culture.distances
Therefore,fromit is each
necessary
parcel.and logical
This findingfor mosques to be thetoclosest
also corresponds features and
the dispersed and
within walking distances from each parcel. This finding also corresponds
decentralized distribution patterns of religious places of worship found in American and European to the dispersed and
decentralized distribution patterns of religious places of worship found in American
cities [40]. Surprisingly, it was found that parcels located in the north-eastern and central-western part and European
cities
of the [40].
studySurprisingly,
area are quiteitfar was found
from that parcels
the nearest mosque located
(Figure in 3).
theThis
north-eastern
can be attributedand central-western
to the size and
part of the study area are quite far from the nearest mosque (Figure 3).
boundary of the study area. It is quite possible that few mosques that are within walking distancesThis can be attributed to the
size and
from theseboundary
parcels were of the
notstudy area. Itbecause
considered is quiteofpossible that few
their location just mosques
outside the that are within
boundary walking
of the study
distances from these parcels were not considered because of their location
area. Therefore, further analysis needs to be conducted for not only mosques within the two districts just outside the boundary
of the
but study encompassing
perhaps area. Therefore,mosquesfurther analysis
within the needs to city
entire be conducted
of Al-Khobar for not
areaonly mosques within
to understand the
their true
two districtspattern.
distribution but perhaps encompassing mosques within the entire city of Al-Khobar area to
understand their true distribution
Contrary to mosques, pattern.
supermarkets and grocery stores are the least randomly located commercial
Contrary to mosques, supermarkets
centers among all the features within the two districts. and grocery It wasstores
found are
that the least randomly
the average located
distance between
commercial
parcels and thecenters
nearestamong all the features
supermarket is 649 m within
(Tablethe3).two districts.
However, in ItDana,
was found
only one that the average
small grocery
store is serving the people of the entire neighborhood and since it is located almost in the center ofonly
distance between parcels and the nearest supermarket is 649 m (Table 3). However, in Dana, the
one small grocery
neighborhood, peoplestoreliving
is serving
in thethe people of theand
northwestern entire neighborhood
southeastern partsand since
of the it is located
district have toalmost
travel
in the center
between 605 m of and
the neighborhood,
1.2 km to reachpeople living
this store. in the northwestern
In Doha, there are 9 grocery and southeastern
stores, but they partsareofvery
the
district have to travel between 605 m and 1.2 km to reach this store. In
near to each other and effectively serving the residents in the central and northwestern parts of the Doha, there are 9 grocery
stores, but they are very near to each other and effectively serving the residents in the central and
northwestern parts of the district. Towards the eastern parts of the district, the distance between the
parcels, supermarkets, and grocery stores increases slowly from 605 m to over 1.8 km (Figure 3).Int. J. Environ. Res. Public Health 2019, 16, 545 10 of 16
district. Towards the eastern parts of the district, the distance between the parcels, supermarkets, and
grocery stores increases slowly from 605 m to over 1.8 km (Figure 3).
The NNI value of pharmacies shows that they are slightly more random than supermarkets and
grocery stores (Table 1). On the contrary, gas stations are spread throughout the city. Due to the low
number of pharmacies and gas stations (only five) within the study area, the NNI values for these
features seem to be logical (Table 1). However, the locations of additional pharmacies and gas stations
are necessary to accurately recognize their distribution pattern throughout the city. The results also
show that pharmacies and gas stations are the farthest facilities from each parcel (Table 3). Examining
by districts, it was observed that within Dana district, most of the parcels are more than 730 m away
from the nearest pharmacy, but the nearest gas stations are within 748 m from each parcel (Figure 4).
In Doha district, all the parcels on the western side of the main commercial street are within 813 m
from the nearest pharmacy and 748 m from gas stations. Towards the eastern side of the Doha district,
the nearest gas stations and pharmacies are approximately 1.5 km away. It was found that unlike
mosques, there are no pharmacies or gas stations nearby in the areas surrounding the eastern border
region of Doha district. This variation may be attributed to the area’s comparatively sparse and recently
expanding residential housings in the past few years.
It was quite intriguing that the financial institutions such as banks and ATM machines have
the same NNI values (0.56) as that of the hair salons although the former is numbered almost twice
the latter (14 vs. 8). In terms of distance from each parcel, both categories of features are within an
average of 627 m (Table 3). It was quite interesting that parcels in the northwestern corner of the Dana
district are more than 623 m from both Banks and ATM machines and 649 m from hair salons. This
phenomenon can be due to the salons and ATM machines in Dana district being inside a mini-mall
located along the main street running through the center of the district. Similar situation was also
observed in Doha district. The banks and ATM machines, as well as salons, are also situated along the
main commercial street of the district. Therefore, as residents move farther away from the main street
towards the southeastern parts of the district, the distances between these facilities and each parcel
increases gradually from 623 m to almost 1.9 km (Figures 3 and 4).
Among all the random patterned facilities, schools have the highest NNI value (0.77) since eight
out of the 13 schools are in Dana district although Doha is more than three times larger in area than
Dana. This is due to Dana being closer to the Saudi ARAMCO headquarters and schools are built
in Dana and the adjacent parts of the eastern Doha district so that the children of the ARAMCO
employees can attend the schools by walking or biking in these neighborhoods due to their short
distances (within 448 m as shown in Figure 3). In the eastern parts of the Doha district, only one school
is present causing the children of these neighborhoods to travel between 448 m to 1.3 km. It is difficult
for these children to walk or ride their bicycles and they most likely commute by private vehicles or
school buses. Due to the rising population and housing densities in this part of the district, newer
schools are planned to be built within the next couple of years.
Coffee shops and restaurants, laundry facilities, and miscellaneous commercial facilities are all
clustered in the study area with an average distance of 614 m from each parcel (Table 3). However,
the NNI values of these facilities indicate that laundries are more clustered than miscellaneous
commercial centers, while the latter is more clustered than coffee shops and restaurants (Table 1).
In Dana, coffee shops, restaurants, and miscellaneous commercial centers are all clustered in the center
of the district while in Doha district, they are clustered along the main street (Figure 2). It is interesting
to note that in Dana district where coffee shops, restaurants, and laundry facilities are located in a
central mall, majority of the residents must travel more than 600 m to reach them whereas in Doha
district where these service facilities are elongated along the main street, residents living near the
southeastern part of the district must travel more than 1.2 km to reach them (Figures 3 and 4). This
finding suggests that a central location is more convenient for the residents than the elongated location
along the main street. This is probably true for a small district. However, as the district size increases,
none of the central or elongated locations are convenient for the residents. Instead, several clustersInt. J. Environ. Res. Public Health 2019, 16, 545 11 of 16
of services scattered over the larger geographical area may be more convenient for the residents
for walking.
5.2. Walking Behavior and Willingness to Walk by the Residents
When examining the walking pattern of the residents, this study found that although the male
population is known as the main actors in fulfilling the daily needs, females are also responsible and
active in carrying out some of the daily needs. Along with the male members of the households,
women are taking care of the groceries, banking needs, and dropping of the children to school daily.
Previous studies have found that females are more proficient, punctual, and organized when it comes
to fulfilling these duties [41]. It should be noted that prior to June, 2018, women were not allowed to
drive in the Kingdom and they were driven around by their male relatives (father, husband, brothers,
or son) or the family driver due to the Kingdom’s custom and regulations to fulfill their daily needs.
It is expected that 3 million Saudi women will obtain driver licenses by 2020 and will have a large
impact on the traffic and travelling conditions of the roads in the Kingdom. It will also have a high
impact on the walking conditions as well.
When it comes to age and carrying out daily basic needs, the young teenagers, and residents
between the age of 21-30 years old are the most active among all the age groups. The teens and the
middle-aged (31-50) population are also engaged in various daily activities which require them to use
different modes of transportation during different hours of the day and different days of the week.
Therefore, it is necessary to explore what portion of the daily need-based transportation is made on
foot as opposed to by motorized and non-motorized vehicles.
In terms of various transportation modes used by the residents, private vehicles ranked the
highest with 90% of the residents using private vehicles to fulfill their daily activities. Almost 10%
of the respondents use public transportation and bicycles for traveling to work, schools, and to buy
groceries. This percentage of public transportation and bicycle use is significantly lower than European
cities (i.e. Amsterdam and Copenhagen) but is at par with American cities where an average of almost
5% of few city commute by biking [42,43].
The study found that approximately 60% of the residents walk to their nearest facilities and almost
65% walk for recreation and health benefits. While residents of Canadian cities had a similar percentage
(70%) of urban walkers, it is significantly higher when compared to American cities as only 3.4% of the
Americans walk to schools or their place of employment [44,45]. Most of these pedestrians walk in the
study area during winter seasons since being in a desert climate (where daily average temperatures
reach almost 50 ◦ C with very high humidity during the summer months), walking can be difficult
and even hazardous for the health of the residents who can suffer from heat exhaustion and heat
strokes. While hot weather limited walkability in this study’s neighborhoods, it is cold temperature,
snow, and rain that has been found to modify and reduce walkability in previous studies [46,47].
The hot and humid weather was also the number one reason residents were hesitant to walk during
the summer months (Table 6). However, Saudi cities have a large expatriate population and most
them are low-income laborers who cannot afford private vehicles. For them, walking is a necessity
rather than a choice and they are forced to walk throughout the year. Previous studies have found a
similar group of residents in cities of other developed countries as well [45]. However, unlike these
other cities where low-income residents had a walking safety concern in their neighborhoods due
to crimes and violence [48], Saudi cities have very few crimes and being safe from crimes was not
one of the cause that hindered residents from walking. The attitude and walking behaviors of the
residents were also gendered dependent where males were found to be more inclined to walk on the
streets when compared to the women respondents. Similar results were also found by [35] for the
city of Riyadh. They found that women prefer walking in indoor facilities such as grocery stores and
shopping malls whereas men walk on urban streets. Also, due to the conservative nature of the Islamic
culture, women’s presence on the streets for walking is limited during certain times of the day [35].Int. J. Environ. Res. Public Health 2019, 16, 545 12 of 16
5.3. Neighborhood Walking Conditions
The results from the field survey and GIS analysis show that approximately 77% of the streets in
the study area are designed with sidewalks and walking trails (Figure 5). However, it is often difficult
for the pedestrians to utilize these streets due to narrow designs, blockades by trees and street signals,
and illegal parking of private and commercial vehicles. The General Theory of Walkability proposed
by Jeff Speck highlights that walkable streets should fulfill four primary conditions: be useful, safe,
comfortable, and interesting [49]. The streets in the study area were created to be useful. However,
safety, comfort level, and aesthetic designs were not considered when they were designed and built.
Recent studies have found inequalities in the street designs of American cities and pedestrians who are
minorities, above 65 years old, uninsured, and members of low-income households are at high risk of
being killed from car accidents while walking [50]. This study did not find such inequalities but rather
streets were poorly designed throughout the study area irrespective of the socio-economic conditions
of the surrounding residents. Unlike European cities that try to provide a high level of comfort for
their pedestrians by providing them with benches for sitting, shading for the rain and summer heat,
and reducing noise levels, such facilities are non-existent in the streets of the study area [51].
Based on the above-mentioned problems and widespread poor street designing for pedestrians
in all parts of the residential neighborhoods within the study area, several recommendations could
be made to the Dhahran municipality for their improvements. First, the city municipality needs to
regularly monitor the city neighborhoods to find vehicles parked off-street on driveways and sidewalks
and possibly penalize the drivers for such behaviors. The authorities also need to take a strong role and
all necessary actions to encourage drivers for on-street parking and making public spaces available
for daily pedestrians. Having more on-street vehicles will reduce road widths and create a physical
separation between moving vehicles and walking pedestrians. They are also expected to reduce the
moving vehicle speeds and traffic volumes in the residential neighborhood streets. Second, utility poles
and trees that are placed and planted in the middle of the sidewalks should be removed and relocated
so that they do not block the sidewalks. Utility poles can perhaps also be eliminated by placing utility
power lines underground (where feasible) and their densities can be reduced. A minimum distance
(i.e. 1.5 m as required for some American cities) should be maintained when planting new trees next to
sidewalks. They should also be carefully placed so that they do not obstruct the views of the drivers in
the streets and not enabling them to see the pedestrians on the sidewalks. Perhaps planting strips can
even be introduced within the residential neighborhoods to create and improve the aesthetical views of
the streets. Third, it was observed that in various locations, sidewalks were discontinuous with visible
bare sands and dirt which are littered with wastes. The municipality should make sure these areas are
cleaned and continued paved surfaces are created to make walking easier for the pedestrians. Fourth,
traffic signals and lights along with speed bumps or roundabouts should be installed and introduced
in busy intersections to reduce the vehicle speeds and avoid an accidental collision with other moving
cars and pedestrians. Finally, the municipality and the regional government should initiate awareness
programs to educate the residents about the benefits of walking and encourage them to make it part of
their daily habit.
5.4. Study Limitations
As in all studies, there are several limitations to this study. First, this study area was limited to only
within two residential neighborhoods in the city of Dhahran. Distribution of facilities, perceptions of
residents towards walking, and walking conditions in other neighborhoods of Dammam metropolitan
area should also be investigated. Second, the impacts of climate are not considered in this study.
While it is known that summer heat is a major factor that hinders people from walking in the summer,
the actual temperature and humidity above which people are hesitant or feel discomfort should
be examined. Third, the physical conditions of the respondents were not measured and correlated
with their responses. The relationship between the weight, height, presence of heart diseases and
diabetes, and other health issues with walking perception and behavior should be investigated. Fourth,Int. J. Environ. Res. Public Health 2019, 16, 545 13 of 16
the study did not consider the nationality of the residents. The perception and walking behavior of
expatriate residents are expected to be different when compared with the Saudi nationals as evidenced
in other GCC countries [52]. Finally, the walking behavior of the residents was not explored in relation
to the distances to the nearest facilities. For example, it did not explore whether having a mosque
rather than a laundry closer to home affect a person’s walking behavior. Also, the study did not
explore whether the structural quality of the streets and sidewalks had any particular geographical
distribution patterns (i.e. random or clustering) in the two neighborhoods.
6. Conclusions
This study has examined the distribution patterns and accessibility to community facilities and
services by the residents of two neighborhoods in the eastern coastal city of Dhahran, Saudi Arabia.
It also explored the travel behavior and the willingness to walk by the residents in the neighborhoods.
Finally, the conditions and safety concerns for walking along the sidewalks and major streets are
explored. The results show that most of the community facilities are randomly placed in the study area
and while mosques are the closest facility to each residential land parcel, gas stations and pharmacies
are the furthest. The results also show that almost half the sampled respondents are willing to walk
on daily basis while the rest are hesitant to do so due to the hot weather during summer and poorly
designed sidewalks. Finally, the study found that the streets in the neighborhoods are not suitable for
walking due to them being too narrow and blocked by trees, street signals, and illegally parked private
and commercial vehicles. The government and city officials should implement rules and regulations
to reduce these blockages to make the streets safer and pedestrian friendly. Future studies should
investigate the distance and impacts of various facilities on the walking behavior of the residents in
the two neighborhoods. Further studies should explore the distribution pattern and accessibility to
facilities, physical conditions of the residents and their willingness to walk, and the conditions of the
streets in other parts of Dammam metropolitan area as well as in other cities of the Kingdom.
Author Contributions: Conceptualization, K.M.N.; methodology, K.M.N. and M.T.R.; formal analysis, K.M.N.
and M.T.R.; data curation, K.M.N. and M.T.R.; writing—original draft preparation, M.T.R.; writing—review and
editing, M.T.R.; supervision, K.M.N.; project administration, K.M.N.; funding acquisition, K.M.N. and M.T.R.
Funding: The authors acknowledge and appreciate the financial support provided by the Deanship of Scientific
Research (DSR) of King Fahd University of Petroleum and Minerals (KFUPM) through their Internal Project
(#IN101019) and all the necessary supports and assistance during the execution period of this study.
Acknowledgments: The authors would like to thank the three anonymous reviewers for their invaluable
comments to improve the manuscript.
Conflicts of Interest: The authors declare no conflict of interest.
References
1. De Pergola, G.; Silvestris, F. Obesity as a major risk factor for cancer. J. Obes. 2013, 2013, 1–11. [CrossRef]
[PubMed]
2. Calle, E.E.; Thun, M.J. Obesity and cancer. Oncogene 2004, 23, 6365–6378. [CrossRef]
3. Lavie, C.J.; Milani, R.V.; Ventura, H.O. Obesity and Cardiovascular Disease. Risk Factor, Paradox, and Impact
of Weight Loss. J. Am. Coll. Cardiol. 2009, 53, 1925–1932. [CrossRef]
4. Al-Goblan, A.S.; Al-Alfi, M.A.; Khan, M.Z. Mechanism linking diabetes mellitus and obesity. Diabetes Metab.
Syndr. Obes. Targets Ther. 2014, 7, 587–591. [CrossRef] [PubMed]
5. Boston, G. The Many Benefits of Walking 30 Minutes a Day. Available online: https:
//www.washingtonpost.com/lifestyle/wellness/the-many-benefits-of-walking-30-minutes-a-day/
2015/10/19/cf12c938-71e1-11e5-9cbb-790369643cf9_story.html?utm_term=.5064ea52b381 (accessed on
13 February 2018).
6. Atef Elhamy Kamel, M. Encouraging walkability in GCC cities: Smart urban solutions. Smart Sustain.
Built Environ. 2013, 2, 288–310. [CrossRef]Int. J. Environ. Res. Public Health 2019, 16, 545 14 of 16
7. Litman, T.A. Economic Value of Walkability. Transp. Res. Rec. 2003, 10, 3–11. [CrossRef]
8. Humpel, N. Environmental factors associated with adults’ participation in physical activity A review. Am. J.
Prev. Med. 2002, 22, 188–199. [CrossRef]
9. Butler, G.P.; Orpana, H.M.; Wiens, A.J. By your own two feet. Factors associated with active transportation
in Canada. Can. J. Public Heal. 2007, 98, 259–264.
10. Owen, N.; Humpel, N.; Leslie, E.; Bauman, A.; Sallis, J.F. Understanding environmental influences on
walking: Review and research agenda. Am. J. Prev. Med. 2004, 27, 67–76. [CrossRef] [PubMed]
11. Booth, M.L.; Owen, N.; Bauman, A.; Clavisi, O.; Leslie, E. Social-cognitive and perceived environment
influences associated with physical activity in older Australians. Prev. Med. 2000, 31, 15–22. [CrossRef]
12. Saelens, B.E.; Handy, S.L. Built environment correlates of walking: A review. Med. Sci. Sports Exerc. 2008, 40,
550–566. [CrossRef]
13. Handy, S.L.; Boarnet, M.G.; Ewing, R.; Killingsworth, R.E. How the built environment affects physical
activity: Views from urban planning. Am. J. Prev. Med. 2002, 23, 64–73. [CrossRef]
14. McCormack, G.; Giles-Corti, B.; Lange, A.; Smith, T.; Martin, K.; Pikora, T. An update of recent evidence
of the relationship between objective and self-report measures of the physical environment and physical
activity behaviours. J. Sci. Med. Sport 2004, 7, 81–92. [CrossRef]
15. Charreire, H.; Weber, C.; Chaix, B.; Salze, P.; Casey, R.; Banos, A.; Badariotti, D.; Kesse-Guyot, E.; Hercberg, S.;
Simon, C.; et al. Identifying built environmental patterns using cluster analysis and GIS: Relationships
with walking, cycling and body mass index in French adults. Int. J. Behav. Nutr. Phys. Act. 2012, 9, 1–11.
[CrossRef] [PubMed]
16. Saelens, B.E.; Sallis, J.F.; Black, J.B.; Chen, D. Neighborhood-Based Differences in Physical Activity:
An Environment Scale Evaluation. Am. J. Public Health 2003, 93, 1552–1558. [CrossRef] [PubMed]
17. Panter, J.R.; Jones, A.P.; van Sluijs, E.M.F.; Griffin, S.J. Europe PMC Funders Group Attitudes, social support
and environmental perceptions as predictors of active commuting behaviour in school children. J. Epidemiol.
Community Health 2010, 64, 41–48. [CrossRef] [PubMed]
18. Maisel, J.L. Impact of Older Adults’ Neighborhood Perceptions on Walking Behavior. J. Aging Phys. Act.
2016, 24, 247–255. [CrossRef]
19. Chiang, Y.C.; Sullivan, W.; Larsen, L. Measuring neighborhood walkable environments: A comparison of
three approaches. Int. J. Environ. Res. Public Health 2017, 14, 1–12. [CrossRef]
20. Sugiyama, T.; Leslie, E.; Giles-Corti, B.; Owen, N. Associations of neighbourhood greenness with physical
and mental health: Do walking, social coherence and local social interaction explain the relationships?
J. Epidemiol. Community Health 2008, 62, e9. [CrossRef]
21. Corazza, M.V.; Di Mascio, P.; Moretti, L. Managing sidewalk pavement maintenance: A case study to increase
pedestrian safety. J. Traffic Transp. Eng. 2016, 3, 203–214. [CrossRef]
22. Ewing, R.; Schroeer, W.; Greene, W. School location and student travel. Transp. Res. Rec. 2004, 1895, 55–63.
[CrossRef]
23. Davidson, K.K.; Lawson, C.T. Do attributes in the physical environment influence children’s physical activity?
A review of the literature. Int. J. Behav. Nutr. Phys. Act. 2006, 3, 1–17.
24. Gomez, J.E.; Johnson, B.A.; Selva, M.; Sallis, J. Violent crime and outdoor physical activity among inner-city
youth. Prev. Med. 2004, 39, 876–881. [CrossRef] [PubMed]
25. Rahman, M.T. Detection of land use/land cover changes and urban sprawl in Al-Khobar, Saudi Arabia:
An analysis of multi-temporal remote sensing data. ISPRS Int. J. Geo-Inf. 2016, 5, 15. [CrossRef]
26. Aina, Y.A.; Merwe, J.H.V.; Alshuwaikhat, H.M. Urban Spatial Growth and Land Use Change in Riyadh:
Comparing Spectral Angle Mapping and Band Ratioing Techniques. In Proceedings of the Academic Track
of the 2008 Free and Open Source Software for Geospatial (FOSS4G) Conference, Incorporating the GISSA
2008 Conference, Cape Town, South Africa, 29 September–3 October 2008; pp. 51–57.
27. Rahman, M.T.; Aldosary, A.; Nahiduzzaman, K.M.; Reza, I. Vulnerability of flash flooding in Riyadh, Saudi
Arabia. Nat. Hazards 2016, 84, 1807–1830. [CrossRef]
28. Alrashed, F.; Asif, M. Trends in Residential Energy Consumption in Saudi Arabia with Particular Reference
to the Eastern Province. J. Sustain. Dev. Energy, Water Environ. Syst. 2014, 2, 376–387. [CrossRef]Int. J. Environ. Res. Public Health 2019, 16, 545 15 of 16
29. Alhubashi, H.H. Housing Sector in Saudi Arabia: A Study of Challenge and Opportunities of Homeownership for
the Middle and Low Income; Polytechnic University of Cataonia: Barcelona, Spain, 2012.
30. Rahman, M.T.; Aldosary, A.S.; Mortoja, M.G. Modeling Future Land Cover Changes and Their Effects on
the Land Surface Temperatures in the Saudi Arabian Eastern Coastal City of Dammam. Land 2017, 6, 36.
[CrossRef]
31. Dehwah, A.; Asif, M.; Rahman, M.T. Prospects of PV application in unregulated building rooftops in
developing countries: A perspective from Saudi Arabia. Energy Build. 2018, 171, 76–87. [CrossRef]
32. Rahman, M.T. Examining and modelling the determinants of the rising land surface temperatures in arabian
desert cities: An example from Riyadh, Saudi Arabia. J. Settlements Spat. Plan. 2018, 9, 1–10. [CrossRef]
33. Aljoufie, M.; Zuidgeest, M.; Brussel, M.; Maarseveen, M.V. Spatial–temporal analysis of urban growth and
transportation in Jeddah City, Saudi Arabia. Cities 2013, 31, 57–68. [CrossRef]
34. Algadhi, S.; Mufti, R.; Malick, D. Estimating the Total Number of Vehicles Active on the Road in Saudi
Arabia. J. King Abdulaziz Univ. Eng. Sci. 2002, 14, 3–28. [CrossRef]
35. Almahamood, M.; Scharnhorst, E.; Carstensen, T.A.; Jorgenses, G.; Schulze, O. Mapping the gendered city:
Investigating the socio-cultural influence on the practice of walking and the meaning of walkscapes among
young Saudi adults in Riyadh. J. Urban Des. 2017, 22, 229–248. [CrossRef]
36. Al-Ghamdi, A.S. Pedestrian-vehicle crashes and analytical techniques for stratified contingency tables.
Accid. Anal. Prev. 2002, 34, 205–214. [CrossRef]
37. Shokry, H.; Maksoud, R. Improving Walkability within Existing Urban Design. In Proceedings of the
3rd International Conference on Liveable Cities—A Joint Conference with International Conference on
Engineering, Innovation & Technology (ICLC2015 & EIT2015), Kuching, Malaysia, 15–17 August 2015;
pp. 1–11.
38. Dhahran Population. Available online: http://population.city/saudi-arabia/dhahran/ (accessed on
26 November 2018).
39. World Weather and Climate Information. Average Weather in Al-Khobar, Saudi Arabia.
Available online: http://www.weather-and-climate.com/average-monthly-Rainfall-Temperature-Sunshine,
al-khobar,Saudi-Arabia (accessed on 5 November 2014).
40. Myint, S.W. An exploration of spatial dispersion, pattern, and association of socio-economic functional units
in an urban system. Appl. Geogr. 2008, 28, 168–188. [CrossRef]
41. Chebat, J.C.; Gélinas-Chebat, C.; Therrien, K. Gender-related wayfinding time of mall shoppers. J. Bus. Res.
2008, 61, 1076–1082. [CrossRef]
42. McLeod, K. WHERE WE RIDE: Analysis of Bicycling in American Cities; The League of American Bicyclists:
Washington D. C., WA, USA, 2013.
43. Nabielek, K.; Hamers, D.; Evers, D. Cities in Europe: Facts and Figures on Cities and Urban Areas; PBL
Netherlands Environmental Assessment Agency: The Hague, The Netherlands, 2016.
44. Friedman, L. Here Are The States Where The Most People Walk Or Bike To Work. Available
online: http://www.businessinsider.com/here-are-the-states-where-the-most-people-walk-or-bike-to-
work-2014-7 (accessed on 15 November 2018).
45. Kitchen, P.; Williams, A.; Chowhan, J. Walking to work in Canada: Health benefits, socio-economic
characteristics and urban-regional variations. BMC Public Health 2011, 11, 212. [CrossRef] [PubMed]
46. Cravo, V.S.; Cohen, J.E. The impact of weather on transit revenue in New York City. In Proceedings of the
Proceedings of the 88th Annual Meeting of the Transportation Research Board, Transportation Research
Board of National Academies, Washington, DC, USA, 11–15 January 2009.
47. Clarke, P.; Hirsch, J.A.; Melendez, R.; Winters, M.; Gould, J.S.; Ashe, M.; Furst, S.; McKay, H. Snow and Rain
Modify Neighbourhood Walkability for Older Adults. Can. J. Aging 2017, 36, 159–169. [CrossRef]
48. Yang, Y.; Roux, A.V.; Auchincloss, A.H.; Rodriguez, D.A.; Brown, D.G. Exploring walking differences by
socioeconomic status using a spatial agent-based model. Heal. Place 2012, 18, 96–99. [CrossRef]
49. Laker, L. Where is the World’s Most Walkable City? Available online: https://www.theguardian.com/cities/
2017/sep/12/walkable-city-worlds-most-new-york-melbourne-fes-el-bali (accessed on 18 November 2018).
50. Budds, D. The Hidden Inequality Of America’s Street Design. Available online: https://www.fastcodesign.
com/3067055/the-hidden-inequality-of-americas-street-design (accessed on 21 November 2018).You can also read