Win & Save Exploring the potential of a lottery savings scheme in the UK - Nicole Gicheva - Social Market Foundation
←
→
Page content transcription
If your browser does not render page correctly, please read the page content below
Win & Save
Exploring the potential of a lottery savings scheme in the UK

Nicole Gicheva
SOCIAL MARKET FOUNDATION

FIRST PUBLISHED BY
The Social Market Foundation, September 2019
11 Tufton Street, London SW1P 3QB
Copyright © The Social Market Foundation, 2019
ISBN: 978-1-910683-73-6

The moral right of the author(s) has been asserted. All rights reserved. Without limiting the rights
under copyright reserved above, no part of this publication may be reproduced, stored or
introduced into a retrieval system, or transmitted, in any form or by any means (electronic,
mechanical, photocopying, recording, or otherwise), without the prior written permission of both
the copyright owner and the publisher of this book.

THE SOCIAL MARKET FOUNDATION
The Foundation’s main activity is to commission and publish original papers by independent
academic and other experts on key topics in the economic and social fields, with a view to
stimulating public discussion on the performance of markets and the social framework within
which they operate. The Foundation is a registered charity and a company limited by guarantee.
It is independent of any political party or group and is funded predominantly through sponsorship
of research and public policy debates. The views expressed in this publication are those of the
author, and these do not necessarily reflect the views of the sponsors or the Social Market
Foundation.

CHAIR                                              DIRECTOR
Mary Ann Sieghart                                  James Kirkup

TRUSTEES
Baroness Grender MBE
Nicola Horlick
Tom Ebbutt
Rt Hon Nicky Morgan MP
Rt Hon Dame Margaret Hodge MP
Peter Readman
Melville Rodrigues
Trevor Phillips OBE
Professor Tim Bale

KINDLY SUPPORTED BY

2
WIN & SAVE

CONTENTS

ACKNOWLEDGEMENTS ............................................................................................................ 4
ABOUT THE AUTHORS .............................................................................................................. 4
EXECUTIVE SUMMARY ............................................................................................................. 5
CHAPTER 1: INTRODUCTION ..................................................................................................... 7
CHAPTER 2: THE CONCEPT OF A WIN & SAVE LOTTERY............................................................ 13
CHAPTER 3: INTERNATIONAL EVIDENCE ON LOTTERY SAVING SCHEMES ................................. 15
CHAPTER 4: WIN & SAVE VERSUS TRADITIONAL PRIZE-LINKED SAVINGS PRODUCTS ................ 19
   Why the UK should pursue Win & Save ................................................................................ 19
   Why there is a case for encouraging consumers to participate in W&S rather than lotteries .. 22
CHAPTER 5: MECHANISM AND DELIVERY ................................................................................ 26
   Summary: Flow of funds ..................................................................................................... 32
   Next steps to delivery ........................................................................................................ 33
ENDNOTES ............................................................................................................................ 34

                                                                                                                                      3
SOCIAL MARKET FOUNDATION ACKNOWLEDGEMENTS The SMF is grateful to the Provident Financial Group for sponsoring this report. The views in the report do not necessarily reflect those of the Provident Financial Group. The Social Market Foundation retains full editorial independence with respect to its research. The author is grateful to all those who participated in the roundtable discussion held as part of the work. The author would like to thank Nigel Keohane and Andrew Barlow for their input during the project. ABOUT THE AUTHOR Nicole Gicheva Nicole was a researcher at the SMF until November 2019. She has worked in a range of fields including education, savings policy, and competition. Prior to her appointment, Nicole worked as a research assistant at the Department of Economics at Royal Holloway, University of London while studying for her MSc in Economics. She also holds a BSc (Hons) in Economics. 4
WIN & SAVE

EXECUTIVE SUMMARY
This report assesses the potential merits of an innovative policy designed to help address the
weak financial resilience and low savings levels among lower-income households: a Win & Save
Scheme, a hybrid savings and lottery product. The report goes on to describe how it could
potentially benefit households on lower income and to identify how such a scheme could best be
introduced and would operate.

The problem

Household savings provide financial resilience, help smooth spending over time and cover
unexpected costs. However, saving in the UK is declining: 46% of the population did not save
any money in the past two years, and many who do save are under-saving.

Households on lower incomes are not only more likely to have a lower level of savings; they are
also more likely not to have saved in the past two years and not to hold any saving stock (in a
savings account or a cash ISA).

Specific circumstances and behaviours affect the ability and willingness of households on lower
incomes to save. For example, volatile incomes can act as a barrier to committing to a traditional
form of regular saving behaviour observed among more affluent households. Consumers may
distrust financial services, potentially because of past experiences such as hidden charges, and
financial products themselves may be perceived to be (and actually be) inappropriate for
households seeking to set aside small sums irregularly.

Government policies, such as the Savings Gateway and increasing the personal tax-free
allowance on ISAs, have not succeeded in incentivising short-term savings, especially among
lower-income households, who would benefit the most from having a safety net in place.

The concept: Win & Save

Participants would purchase a ticket in order to win a monetary prize, but a proportion of the
ticket price would be deposited into a savings account held by the purchaser, with the remainder
going towards a lottery prize fund. Structuring the product in this way would attract consumers
from other gambling products to Win & Save and boost their financial resilience. We argue that
building up a savings buffer would be of greater value to lower income consumers than
contributing to ‘good causes’ through the National Lottery. Meanwhile, putting some of the
principal into the prize fund means that prizes can be larger and the chances of winning greater
than they would be under a traditional prize-linked savings approach. International evidence and
academic studies suggest that savings schemes with a prize element can be particularly
attractive to lower-income groups.

In short, the intention would be to transform the habit of gambling into a form of saving.

What it would mean for consumers

Assuming a ticket price of £2.50, and a government subsidy, this would mean that a person
buying two tickets a week could save around £250 within a year. If the scheme were to attract a
consumer base equivalent to 10% of National Lottery users, this would generate just over
£681,000 in weekly prize money. The prizes should be ‘life-changing’ sums for lower-income

                                                                                                5
SOCIAL MARKET FOUNDATION
groups but not set at the same levels as some lottery prizes. We propose a selection of various
prize breakdowns in the report, with the top prize being a six-figure sum up to £250,000.
W&S would be available in shops and other outlets as well as online.
• The savings would be channelled either into a default savings account run by NS&I or into
an individual’s pre-existing savings account with a financial services provider.
• The Government would provide a subsidy to the savings as it does for ISAs and Help to
Save.
Win & Save allows individuals to experience the excitement of entering a lottery whilst creating
a ‘win-win’ situation by building up their savings resources at the same time.
How the policy could be introduced
We envisage that the policy would require new regulation as this would be a hybrid financial
services and gambling product. The report argues that the most effective way of introducing the
product would be for the Government to ask the National Lottery to develop this product as part
of the renewal of its licence in 2023.
6WIN & SAVE
CHAPTER 1: INTRODUCTION
This chapter analyses the underlying reasons behind the low savings rate and stock of savings
among households on modest and low incomes, from volatile incomes to the failure of existing
savings schemes to increase the financial resilience of these households.
The UK’s savings challenge
Why savings matter
Household savings are vital for wellbeing, living standards, and economic growth. They provide
financial resilience and help households smooth their spending over time and prepare for
unexpected events.
Individuals and households on low incomes are especially in need of a short-term savings buffer
as they may be more likely to experience income shocks through unemployment or a reduction
in hours. Factors such as ill-health and family breakdown could lead to a more significant
additional material disadvantage, as there is less room for manoeuvre budgets to cope with such
shortfalls. In addition, households on low incomes are likely to find it more difficult to manage
unanticipated costs such as a car repair or white good replacement. Research shows that four in
ten people on a lower income who struggle to save experience an income shock, such as a
broken boiler or car repairs, at least once every six months. 1 To help cover unexpected bills, six
in ten people would turn to borrowing, and a third would cut back on essentials, such as food or
heating. 2
Having a buffer can provide reassurance and strengthen wellbeing, as well as reduce reliance on
expensive forms of credit. For instance, analysis by Stepchange finds that if every household in
the UK had at least £1,000 in accessible savings, the number of households in problem debt
could be reduced by 500,000. 3
Low savings rate and lack of financial resilience among lower income households
Saving rates have, however, been declining for several decades. Historically, UK households
have saved less than the European (EU28) average. 4 In the first quarter of 2017, the domestic
savings ratio fell to its lowest level in 20 years and continues to be well below the historic national
average. 5 Many households are not saving and many who are, are under-saving. Previous SMF
research revealed that 26.5 million working age adults had less than three months’ salary in
savings in 2012-2014. 6 The Money Advice Service estimates that two in five working age adults
have less than £100 in savings. 7
Our analysis of the Wealth and Assets Survey reveals that 46% of the UK population have not
saved any money during the past two years. Non-saving behaviour is predominant among the
young and those working in lower-skilled (and lower-paid) occupations. Three in five (59%) of
individuals from semi-routine and routine socio-economic backgrounds did not save over the
past two years. As illustrated in Figure 1, the proportion of savers is higher among older working
age groups and among higher-skilled occupations.
7SOCIAL MARKET FOUNDATION
Figure 1: Savings activity - Proportion of UK adults who did not save in the past two years
% of population 46%
16-24 56%
25-44 48%
45-64 46%
64-74 40%
75+ 43%
Managerial and professional 32%
Intermediate 42%
Small employer & own account 54%
Lower supervisory & technical 47%
Semi-routine & routine 59%
0% 10% 20% 30% 40% 50% 60% 70%
Source: SMF analysis of Wealth and Assets Survey (Wave 5, 2014-2016)
As well as being more likely not to have saved any money in the past two years, people from lower
socio-economic backgrounds are also much less likely to hold a stock of savings. Figure 2
outlines the proportion of people with no stock of savings (those without a savings account or a
cash ISA, and those who do have a savings account or a cash ISA opened in their name, but
currently have a balance of zero pounds deposited). Over half (54%) of people in semi-routine
and routine occupations have no liquid savings, 8 compared to one in four (26%) amongst
individuals from a managerial or professional background.
Figure 2: Stock of savings – Proportion of UK adults who hold no stock of savings
63%
All 75%
54%
38%
Managerial and professional 57%
26%
46%
Intermediate 62%
31%
55%
Small employer & own account 71%
43%
55%
Lower supervisory & technical 73%
43%
65%
Semi-routine & routine 77%
54%
80%
Never worked/ long term unemployed 91%
75%
0% 10% 20% 30% 40% 50% 60% 70% 80% 90% 100%
Savings account Cash ISA Savings account nor cash ISA
Source: SMF analysis of Wealth and Assets Survey (2014-2016).
Note: in each category, we consider individuals who do not have each type of product and individuals who do, but
currently have a zero-balance
Finally, we observe that when low-income households do hold savings, they have much less in
reserve. Individuals in semi-routine and routine occupations had an average of £5,055 deposited
into a cash ISA and £1,000 in a savings account (given that the balance in each account was
8WIN & SAVE
positive), whereas the average person from managerial and professional background had saved
£8,000 in a cash ISA and £3,600 in a savings account.
Figure 3: Median stock of savings, by type of savings account and socio-economic group
£9,000
£8,000
£8,000
£7,000 £6,084 £6,168
£6,000 £5,700
£6,000 £5,055 £5,000
£5,000
£4,000 £3,600
£3,000 £2,500 £2,500
£2,040 £1,800
£2,000 £1,000 £1,000
£1,000
£0
Median Managerial Intermediate Small Lower Semi-routine Never
and employer & supervisory & & routine worked/ long
professional own account technical term
unemployed
Cash ISA Savings account
Source: SMF analysis of Wealth and Assets Survey (2014-2016)
Financial inclusion has improved with the number of unbanked adults falling in recent decades,
however 1.5m adults were unbanked in 2015/16. 9 Households rely on a range of sources of credit
through their lives, but analysis by the FCA shows that 15% of the population are over-indebted,
3.1 million people had an unauthorised overdraft over a 12-month period and a similar number
used high-cost credit. 10
Why savings levels are low among households on modest incomes
Factors explaining why households on lower incomes struggle to save
We know from behavioural science that a set of biases and heuristics contribute to under-saving,
thus meaning that individuals do not smooth their consumption in ways that economists predict
would be efficient. Individuals can be focused on the short-term, they can view saving as a loss,
and they may lack the discipline or information to save at a level which would allow them to
accumulate a sufficient savings buffer. 11
Specific circumstances and behaviours affect lower income households in particular. Barriers
include:
Due to volatile incomes, households find it difficult to commit to a traditional form of
regular saving behaviour observed among more affluent households. A USA study found
that many lower-income households thought it pointless to save since they could never
do so with regularity, and, when they could, the amounts saved were small. 12
Consumers may distrust financial services, potentially because of past experiences (e.g.
with overdrafts).
Products may be perceived to be (and actually be) inappropriate for households seeking
to set aside small sums irregularly.
There may be an absence of positive social norms around saving behaviour among their
peer groups. 13
9SOCIAL MARKET FOUNDATION
In a low-interest environment, the compound interest rates offered by standard savings
accounts may not act attract households unable to save large sums.
Weakness of policies directed at lower-income savers
Government policies have not succeeded in incentivising short-term savings, especially among
lower-income households, who would benefit the most from having a safety net in place. Below,
we outline the most recent policy developments in this space and evaluate the reasons
underpinning their inability to help low-income earners to put money aside.
ISAs
Individual Savings Accounts (ISAs) are a regulated product, provided by a variety of financial
institutions such as banks, building societies, and credit unions. Recent policy has focused
around increasing ISA allowances: an individual can now save up to £20,000 in ISAs the 2018/19
tax year, which is eligible for tax-free earnings. ISAs come at a high cost to the Treasury: in
2017/18, income tax relief for (adult) ISAs is forecast to reach £2.9bn. 14
As previously argued by the SMF, ISAs largely act as subsidies to savers on higher incomes. 15
Above, we showed that a majority of those on lower incomes do not have a cash ISA. Figure 4
shows that most ISA users on lower incomes put in far below the maximum threshold. Increasing
the threshold further therefore has mainly benefited higher-income savers.
Figure 4: Number of individuals subscribing to ISAs in 2015-16, by income (y axis) and amount of
subscription (legend)
£150,000 or more
£100,000-£149,999
£50,000-£99,999
£30,000-£49,999
£20,000-£29,999
£10,000-£19,999
£5,000-£9,999
£0-£4,999
0% 10% 20% 30% 40% 50% 60% 70% 80% 90% 100%
£1-£2,499 £2,500-£4,999 £5,000-£7,499 £7,500-£9,999
£10,000-£12,499 £12,500-£14,999 £15,000-£15,239 £15,240
Source: SMF analysis of HMRC data 16
Help to Save
Fully launched in September 2018, Help to Save (HTS) accounts are the latest government
initiative to incentivise regular saving among lower-income households. Account holders can
save a maximum of £50 per month, which earns a 50% tax-free interest for 4 years. To qualify,
individuals must be either recipients of Universal Credit and earn at least the equivalent of
working 16 hours at the national living wage or be eligible to receive Working Tax Credits or Child
Tax Credits. 17
10WIN & SAVE
The Treasury predicted that 350,000 individuals will use Help to Save, which translates into only
one in ten of eligible workers. 18 An eight-month pilot stage saw Help to Save attract around
45,000 customers who saved over £3m. 19 This equates to £67 saved per account holder on
average over the 8-month period, which is just over the maximum contribution allowance per
month. The IFS noted that the funding for scheme in 2020-21 assumed that each eligible saver
would receive a contribution of £20 in that year. 20 This would assume that each eligible saver
saves £40.
The Government’s intention behind HTS is to help those on low incomes ‘build up a rainy day
fund’. 21 This is the right aim. However, it is questionable whether the scheme is structured
correctly around the behaviours and needs of low-income consumers. First, HTS is premised on
regular monthly contributions, but evidence shows that low-income households struggle to
commit to regular savings payments. Second, the size of reward is linked to the highest balance
achieved during the first two years and the subsequent two years. This means there is a strong
disincentive to withdraw money, yet we know that flexibility and access are important features
for saving accounts for low-income consumers.
Savings Gateway
The pilot schemes of the Savings Gateway provide useful insights about the behaviour of lower-
income households with respect to saving. Effectively the predecessor to HTS, the Savings
Gateway also offered a bonus of 50p per £1 saved, but the maximum monthly contribution was
capped at £25 and accounts were only active for two years.
The two pilot schemes, in 2002 and 2007 respectively, saw over £5m deposited in savings by
over 220,000 individuals. 22 Whilst many individuals are unlikely to have saved the full amount
allowed, the Savings Gateway incentivised regular saving, with six in ten participants saving
regularly two years after the pilot, compared to 40% of participants before the pilot was launched.
In addition, participants were also more engaged with the financial market: over eight in ten had
a savings account in a bank or building society two years after the pilot, in comparison to around
65% before. 23
Table 1: Summary of tax reliefs and subsidies for savings products
Help to Save Cash ISA Savings Gateway
Subsidy 50% 20% or 40% 50%
(based on income)
Limit £50 per month £20,000 in 2018/19 £25 per month
Expiry 4 years Year-on-year 2 years
The need for innovation and tailored products
As the Government has acknowledged, there is good reason to seek to innovate to develop
products that can help meet the financial needs of lower-income consumers. In the October 2018
Budget, the Treasury committed to ‘launching a pilot of a new prize-linked saving scheme for
credit unions’, to boost financial resilience and awareness of credit unions. 24 This is an important
and welcomed step.
11SOCIAL MARKET FOUNDATION
Government policy has sought to establish a culture of saving, to encourage people to take
responsibility and to value their future selves more highly today. As the SMF has argued
previously, there is merit in seeking to foster a stronger culture of saving behaviour and for
individuals to take more responsibility for their long-term futures. 25 However, we should also
focus on facilitating activities which result in the accumulation of assets, irrespective of whether
or not they promote savings habits. In other words, it is the end as much as the means that
matters.
Purpose of this report
The purpose of this report is to assess the potential merits of an innovative policy designed to
help address the problem described above: a Win & Save Scheme, a hybrid savings and lottery
product. The report goes on to describe how it could benefit lower-income households and to
identify how such a scheme could best be introduced and would operate. 26
The questions this research address include:
What is a Win & Save scheme and what would be the features of a hybrid savings and
lottery product?
Why might a lottery-based product help increase savings levels of lower-income
households? Who might we expect to participate?
What is the case for and against pursuing a Win & Save policy rather than traditional prize-
linked savings?
How could the concept best operate in practice? And, how should such a scheme be
regulated and overseen by policy?
The rest of the report is structured as follows:
• Chapter 2 presents the concepts of prize-linked savings and a Win & Save lottery and
analyses participation in the National Lottery;
• Chapter 3 outlines the appeal of prize-linked savings products to policymakers through a
select number of international examples;
• Chapter 4 introduces our proposed product and its advantages over traditional prize-
linked savings schemes;
• Chapter 5 discusses the practicality and design of the scheme and the support which
would be needed from the Government.
Research methods
This research was conducted using data from the Wealth and Assets Survey (Wave 5, 2014-
2016) 27 to identify the demographics of non-savers, and holders of premium bonds. Data from
the Health Survey for England (2016) 28 was used to identify gamblers who play the National
Lottery. Please note that the results from the Wealth and Assets Survey are UK-wide, whereas
analysis of the Health Survey for England covers individuals in England only.
The report also draws on an expert roundtable discussion hosted by the SMF, which helped
develop the concepts discussed below. Participants included consumer groups and charities,
financial service providers, civil servants, and academics.
12WIN & SAVE
CHAPTER 2: THE CONCEPT OF A WIN & SAVE LOTTERY
This chapter describes:
The concept of a Win & Save lottery
Established history of prize-linked savings in the UK
Why schemes with a lottery element may attract people to save and why they may work
for those on modest incomes
Introducing the concept of a Win & Save Lottery
The SMF originally set out the concept of a lottery savings scheme in 2011 in our Savings on a
Shoestring report. 29 The SMF considered the National Lottery’s 14 million-to-one odds 30 and
expected return of £0.45 on every £1, 31 and questioned whether the share of National Lottery
tickets (currently 22%) which was paid towards ‘good causes’ benefited low income consumers,
and whether a better ‘good cause’ for those on low incomes would be their future selves. We
hypothesised that attracting participants from gambling would mean that the scheme engaged
many on lower incomes and non-savers.
Win & Save would be designed fundamentally as a consumption product, with a lottery element
and a savings element. Participants would purchase a ticket in order to win a monetary prize, but
a proportion of the ticket price would be deposited into a savings account held by the purchaser,
with the remainder going towards the lottery prize fund. Putting some of the principal at risk
would mean that the prize could be set at an attractive level. We view the trade-off between this
risk and the opportunity to win a major prize as a self-imposed savings tax - in this way, our
product entices individuals to play in order to save (rather than to save in order to play, as
traditional prize-linked savings schemes do).
Win & Save would be aimed at casual gamblers and specifically at lower-income households with
high proportions of lottery expenditure and irregular (or non-existent) savings habits.
The intention would be to transform the habit of gambling into a form of saving: the player has an
opportunity to win major prizes while a proportion of the ticket price is directed into a personal
savings account. Modelled after the National Lottery’s contribution to ‘good causes’, this
consumption product would see participants contribute instead to their future financial resilience
by having a proportion of the price diverted into a savings account. An additional advantage of
the policy is that the habit of participating in the lottery may act as a gateway to saving and
develop a habit of saving among non-savers.
The history of prize-linked savings in the UK
Saving through gambling is not a new idea. Prize-linked savings (PLS) accounts were first offered
in the UK in 1694 in a bid to raise revenue for English participation in the Nine Years War against
France. 32 Lottery bonds, an early form of PLS, were found in many of the financial markets across
Europe in the early 19th Century. 33
UK Premium Bonds, which offer prizes but no base interest rate, have been popular with British
consumers since their introduction in the mid-1950s. Premium Bonds are a traditional form of
prize-linked savings. PLS accounts differ to standard savings accounts by substituting fixed
interest returns with a lottery-like element. Instead of every account holder receiving regular and
13SOCIAL MARKET FOUNDATION marginal returns, a few randomly chosen account holders win cash prizes. The chances of winning are proportional to the balance of the account, which encourages people to grow their savings. Each £1 Premium Bond is entered in a monthly draw with the chance to win tax free prizes ranging from £25 to £1million. The maximum an individual can invest is capped at £50,000. SMF analysis reveals that one in ten people in the UK currently own Premium Bonds. We discuss the demographics of Premium Bonds holders in Chapter 4. In the private sector, Halifax UK operates a Savers Prize Draw, a form of PLS which offers its customers with a chance to win one of 1,603 cash prizes every month. 34 However, as one of the qualifying criterion is having £5,000 in savings, and therefore excludes non-savers by default, our research does not seek to mirror this product. Why schemes with a lottery element may attract people to save and why they may work for those on modest incomes Savings with a lottery element may attract consumers for a number of reasons. First, the products are fun in a way that financial products – for the wider population – are not. They may be able to attract those who are excluded (fully or partially) from traditional financial services. Second, depending on their design, lottery saving schemes can combine partial or full security of the principal with a degree of exposure to upside risk. 35 For instance, under traditional prize- linked savings, the format can be described as ‘heads you win, tails you don’t lose’. This may appeal to the loss averse. Third, more generally, behavioural economics suggests that some consumers may view saving as a monetary loss (because they cannot consume now). A lottery element may help them overcome this loss aversion. Fourth, analysis of gambling behaviours also suggests that people on average suffer from unrealistic optimism: they misestimate small probabilities and overestimate their own chances of winning. 36 Subsequently, they purchase lottery tickets based on the size of the jackpot rather than the probability of winning the jackpot. 37 Therefore, existing consumer demand for low-probability, large prize gambling products, such as a lottery, can be leveraged to encourage saving. Academic research on prize-linked savings identifies an unmet consumer demand for saving products which offer the (remote) prospect of changing wealth status, rather than incrementally building wealth with certainty. 38 14
WIN & SAVE
CHAPTER 3: INTERNATIONAL EVIDENCE ON LOTTERY SAVING SCHEMES
This chapter assesses international evidence on savings with a gambling element, with a focus
on prize-linked savings (PLS) schemes where the evidence base is impressive. It shows that:
In surveys, lower-income households are positive towards savings with a gambling
element.
Schemes can be attractive to a broad range of demographics.
Low income/non-savers are particularly likely to open PLS accounts.
There is evidence of a substitution effect from gambling to prize-linked saving. Prize
winners, on average, invest more rather than divest and PLS account holders increased
total savings by an average of 1% of annual income.
There has been increasing adoption of the concept in US states, including enabling
legislation / regulation.
Polling suggests interest in lottery-based saving schemes
A 2010 US survey found significant interest in prize-linked savings products among individuals
with little actual savings, without regular saving habits, who play lotteries extensively, and are
optimistic. 39 Non-savers were 70% more likely to demonstrate interest in PLS than those who
regularly saved; individuals with savings between $1 and $2,000 were 2.5 times more likely to
demonstrate interest than those with $50,000 or more. 40 Individuals who had spent over $100
on lottery tickets in the previous six months were 2.9 times more likely to demonstrate interest
than individuals who had not. 41
Academics have suggested that prize-linked savings are popular among lower-income
households as they offer a perceived solution to the ‘poverty trap’, 42 regardless of how small the
chances are of winning a large prize which would radically change their material conditions. A
2006 survey found that more than 20% of Americans considered winning the lottery as the most
likely way for them to accumulate several hundred thousand dollars; this increased to 40% for
individuals earning under $25,000. 43
USA: Save to Win
Prize-linked savings were introduced in the USA in 2009 in the form of Save to Win (STW), a
product piloted by nine credit unions in Michigan. STW has since expanded and is now offered
by over 120 credit unions across 12 states. 44 As of October 2018, its success has led to 29 states
passing legislation or relaxing restrictions to allow banks and credit unions to offer prize-linked
savings products, with the state of California being the latest to change its laws. 45 In December
2014, the Senate removed legal impediments to federally chartered banks from offering such
schemes. As of May 2018, there were 17 active prize-linked savings products available in the USA
and a number being under development. 46
Save to Win: How it works
A minimum $25 opening deposit gives a member a 12-month share certificate. Every $25
deposit each month earns entry into a monthly, quarterly and annual draw, with a maximum of
10 entries each month. Prizes vary according to each state: monthly prizes range from between
$25 to $50 and quarterly prizes from $1000 to $5000. Annual grand prizes vary more
substantially but are generally significant sums of money. There are penalty fees for early
15SOCIAL MARKET FOUNDATION
withdrawal to encourage saving. Participating credit unions pay Commonwealth, the non-profit
service provider which operates STW, an upfront fee to administer the draws and provide
marketing and branding for the product. 47
Save to Win and other smaller prize-linked savings schemes offered by credit unions in the USA
have encouraged members to open over 82,000 PLS accounts since 2009. 48 Between 9%-14%
of these accounts were opened by new members who joined the credit union in order to access
the product. Participants have saved a cumulative $190 million with an average of $2,409 saved
in each account; $2.73 million in total prizes has been awarded to over 30,000 winners. 49
Exposure to upside risk does appear to incentivise saving in a financial context.
The popularity of Save to Win among lower-income households and non-regular savers is
encouraging. Between 86%-90% of STW account holders are classified as financially vulnerable,
i.e. those who are non-regular savers, asset poor, on low to moderate income, with high debt or
no emergency savings. 50 More specifically, 51%-66% had no emergency savings (of $400) and
40%-67% did not save regularly. STW account holders also reported an abnormally high
propensity to gamble, as Figure 5 below shows (representing 2011 survey data from Michigan). 51
Figure 5: Proportion of Michigan Save to Win account holders who:
Had less than $5000 in financial assets 31%
Visited casinos or racetracks 38%
Had never saved before 43%
Were unable to pay three months' expenses 50%
Regularly played the lottery 63%
0% 10% 20% 30% 40% 50% 60% 70% 80% 90% 100%
Source: SMF analysis of Commonwealth survey data (2011)
It is likely that the true amount of gambling among STW account holders is higher; it is well
established that informal surveys investigating topics with an attached stigma such as gambling
suffer from underreporting biases. 52
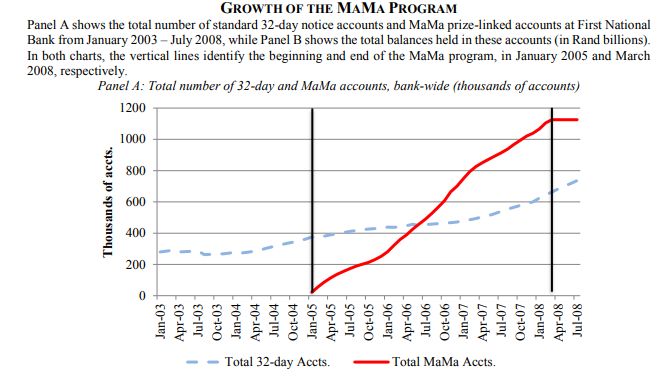
South Africa: Million a Month Account
In South Africa, a prize-linked savings product Million a Month Account (MaMa) launched by First
National Bank, the country’s third largest bank, attracted R1.4 billion in deposits during the three
years it was offered between 2005 and 2008. 53 This is a striking amount when compared to the
R4.5 billion total savings held at the bank at the time. Individuals with no existing standard
savings accounts were 12.2% more likely to open a MaMa account than those with savings
accounts. 54 Individuals who had borrowed more than average were more likely to open MaMa
16WIN & SAVE
accounts, further suggesting the appeal of PLS to the financially insecure. 55 Reassuringly, prize
winners were no more likely to close their accounts than non-winners and they often re-invested
more than their prize winnings.
Figure 6: Growth of the MaMa program
Source: Cole, Iverson and Tufano, ‘Can Gambling Increase Savings? Empirical Evidence on Prize-linked Savings Accounts
(Aug 2014)
Elsewhere
A 2002 study focussing on prize-linked savings products offered by two banks with a presence
across South and Central America found that PLS was particularly appealing to low-income
households and attracted both the ‘unbanked’ as well customers from other banks. 56
Prize-linked savings initiatives have also proved popular in developing countries, with
successful products offered in Indonesia, Kenya and Pakistan among others.
Academic evidence on prize-linked savings
Academic studies have assessed why prize-linked savings schemes could be attractive to
policymakers.
PLS products discourage the early withdrawal of savings
Experiments have been carried out as part of academic studies into the impact of prize-linked
savings in India and the US. One experiment gave participants an endowment and a choice
between different savings vehicles (including PLS) and withdrawal. It found that participants
were much less likely to withdraw cash from their savings if the funds were kept in a PLS account
rather than a standard savings account. 57 The difference was most marked among low savers
and self-reported lottery players. The average savings rate was also higher when PLS was
available as one of the options for saving (rather than only a traditional savings product).
17SOCIAL MARKET FOUNDATION There is a strong substitution effect between PLS participation and consumer gambling A study examining county by county data corresponding to the roll out of Save to Win (STW) in Nebraska in 2012, found that counties where STW was available experienced a 3.75% to 10.2% reduction in gambling in casinos that year. 58 There is also evidence that prize-linked savings schemes are substitutes to lottery gambling specifically, depending on the size of the prize fund. In South Africa, deposits into MaMa accounts were particularly high in periods where the South African national lottery jackpot was small; similarly, deposits were low during rollovers and high jackpots. 59 Meanwhile, research shows that prize-linked savings participation mainly crowds out early withdrawal activity rather than other forms of savings, unless the interest rate available is high. 60 The study suggests that PLS will be successful in increasing a saving rate without reducing traditional savings especially when a saving rate is low and when an interest rate is low. 61 Both of these conditions are exhibited in the current UK landscape. PLS products increase net savings A 2014 study found the introduction of prize-linked savings products increased total savings by an average of 12%. 62 Crucially, the demand for PLS accounts came from a reduction in lottery expenditure and general consumption. 63 It did not lead to a significant reallocation of demand away from other existing forms of saving. The study also found that the increase in total savings was most pronounced among those with the least reported savings. This finding is supported elsewhere. 64 In the US, PLS products accounted for more than $685m of savings in over 287,000 accounts since introducing the first such scheme in 2009. 65 18
WIN & SAVE
CHAPTER 4: WIN & SAVE VERSUS TRADITIONAL PRIZE-LINKED SAVINGS PRODUCTS
This chapter explains why policymakers should pursue Win & Save (W&S) in preference to other
saving products and other prize-linked savings products. Advantages could include:
It would be designed to compete with lottery products rather than other savings products,
and thus substitute activity away from gambling rather than saving. Such people are much
more representative of lower socio-economic groups than holders of Premium Bonds.
It could appeal to low-income consumers who distrust traditional financial services
institutions or products, and to those who are unable to commit to regular savings
behaviour.
It could help overcome loss aversion, which can often thwart saving, by focusing attention
on the prize rather than the immediate loss of money saved.
Larger prizes would be available to attract participants compared to traditional PLS
products because part of the principal is made available for the prize fund.
It could be more readily accessible through more distribution channels.
Costs of entry could be lower.
In addition, the chapter discusses why Win & Save could have positive implications:
Given that lower socio-economic groups are as likely to participate in lotteries as more
affluent groups, lotteries such as the National Lottery are a more regressive mechanism
for funding social causes than taxes such as income tax.
Analysis has suggested that historical NL ‘good cause’ funding has not been weighted
towards more disadvantaged areas.
Why the UK should pursue Win & Save
Our central argument is that a hybrid product like Win & Save would be the approach most likely
to help lower-income consumers build up a savings buffer. We should not make the best the
enemy of the very good.
In developing policy, there is a trade-off between opting for a product that would be objectively
best for the consumer versus choosing an approach that in practice is most likely to attract non-
savers and enable them to build up savings. Proponents of prize-linked savings can justifiably
argue that their accounts are a very good savings product for those who participate, because the
principal is never at risk. However, we describe below why, on balance, W&S is likely to be more
successful at increasing the number of consumers on lower incomes who build up a savings
buffer; and that the product would remain a good mechanism for them to build up their financial
resilience.
W&S better reflects the behaviours and norms among low-income consumers
Analysis for the Financial Inclusion Taskforce at the University of Bristol has identified a range of
barriers that prevent low-income households from saving. Their analysis concluded that
consumers need help to prioritise saving over spending, and that saving for non-specific reasons
was particularly difficult to achieve. 66 The researchers also found that fluctuating incomes and
expenditures mean that such households find it problematic to commit to a traditional form of
regular saving behaviour practiced by more affluent households. Instead, there is significant
informal saving as well as sporadic saving taking place. Many people on a lower income do not
19SOCIAL MARKET FOUNDATION perceive that it is affordable to regularly put money aside into a separate savings account. 67 Indeed, a higher proportion of low-income households were saving informally rather than formally into a savings account. 68 Informal channels include savings stamps, irregular cash savings and saving clubs. The attractions of informal saving include: ‘the ability to save small and varying amounts conveniently, as and when people could afford to do so’; trust and familiarity with specific organisations; cultural traditions; and the fact that some schemes fulfilled a social function. 69 The research identified barriers including: access to products; trust of suppliers; and lack of appropriateness of formal savings products. 70 Given what we know about the behaviours and constraints affecting lower-income consumers, Win & Save could provide such households with an accessible, simple, and easy to understand method to start building a savings pot. Additionally, we hope that in the long term, Win & Save could act as a gateway to developing a more regular savings behaviour and encouraging further participation in the financial market. Practically, Win & Save, as a consumption product, is more accessible than a formal savings product. Participants build up savings by playing a game rather than depositing money into a specific account. Crucially, Win & Save also provides an alternative to lottery participation as it converts gambling activity into cash savings. Advantages of being branded as a ‘gambling’ rather than a ‘savings’ product Research has shown that lower-income consumers find the formal concept and label of ‘saving’ as disempowering. Mistrust of financial services and banks has been shown in qualitative research to be a contributing factor to low income households not engaging with financial services. 71 Few lower-income households identify positively with being a ‘saver’, tending instead to identify with the ‘non-savers’ whom they saw as ‘normal’. 72 By being designed and marketed as a gambling product with other benefits, W&S may be less affected by these negative norms and perceptions than a financial services product offered through financial service institutions. A product marketed as a gambling product may also help overcome loss aversion. Evidence suggests that individuals may view savings as a loss. This has led to initiatives to help pre- commit consumers to saving behaviour so that they overlook this perceived ‘loss’. Examples include Save More Tomorrow. A number of Community Development Finance Institutions (CDFIs) and charities use debt repayments as a springboard for building up short-term savings, either by asking consumers to contribute larger sums than are needed purely to pay off the debt or by seeking to encourage consumers to continue contributing payments after the debt is paid off. W&S would be better aimed at the target demographic of lower income consumers Prize-linked savings initiatives in the UK are dominated by Premium Bonds. The most recent annual report revealed that Premium Bonds have 21 million customers and more than £75 billion invested. 73 Investors can put a minimum of £100 or £50 for existing holders by standing order or electronic transfer. 74 The maximum that an individual can hold is £50,000. Each month two £1 million jackpots in the Premium Bonds prize draw are drawn, along with many smaller prizes. Figure 7 shows that holders of Premium Bonds tend to be older, retired, and from higher socio- economic groups. As such, they are likely to have other assets and other types of savings. 20
WIN & SAVE

Premium bonds are popular among savers: one in five of those who saved over the past two years
hold at least one premium bond, compared to 8% ownership rate among those who did not save.
In short, individuals for whom the Premium Bonds market works well are not in our target
demographic of non-savers (and those) on low incomes.

Figure 7: Proportion of UK adults who hold Premium Bonds

              % of population                                         10%
                  % of savers                                                                         20%
             % of non-savers                                    8%
                        16-24               3%
                        25-44                              7%
                       45-64                                                             16%
                        65-74                                                                                 22%
                          75+                                                                              21%
                    Employed                                               11%
               Self-employed                                                           15%
             ILO unemployed                 3%
                      Retired                                                                                22%
  Managerial and professional                                                                      19%
                 Intermediate                                                               17%
Small employer & own account                                                             16%
Lower supervisory & technical                                        10%
       Semi-routine & routine                              7%
                                0%             5%                10%               15%             20%              25%
Source: SMF analysis of Wealth and Assets Survey (Wave 5, 2014-2016)

In contrast, in England, we note that participation in the National Lottery is evenly spread over
socio-economic background, with 46% of gamblers being in lower supervisory and technical
occupations and 45% coming from managerial and professional backgrounds. Analysis of the
Health Survey for England shows that 41% of the population spent money on a National Lottery
ticket in 2015.

Figure 8: Proportion of adults in England who played the National Lottery in the last 12 months

              % of population                                                                41%
                       16-24                                     22%
                       25-34                                                                 41%
                       35-44                                                                       46%
                       45-54                                                                         48%
                       55-64                                                                        47%
                       65-74                                                                 42%
                         75+                                                     31%
  Managerial and professional                                                                    45%
                 Intermediate                                                                 42%
Small employer & own account                                                                  42%
Lower supervisory & technical                                                                      46%
       Semi-routine & routine                                                                41%
                                0%          10%            20%             30%         40%         50%         60%
Source: SMF analysis of Health Survey for England (2016)

                                                                                                                      21
SOCIAL MARKET FOUNDATION Traditionally, UK Premium Bonds have required a minimum £100 deposit. This price is much higher than the ticket price for Win & Save. The comparatively low cost of Win & Save should help low-income households with the transition from informal to formal methods of saving. Larger gambling element and higher prize available through W&S To date, all forms of prize-linked savings have involved sacrificing the standard interest return on savings for a chance to enter a prize draw. Whilst the principal remains secure, the size of the prize funds is limited. As noted above, the financial product available in PLS arguably has benefits over W&S. First, none of the principal is at risk. This may offer assurance to the consumer, as well as ensuring that £1 is saved for each £1 purchased. Second, the act of purchasing a PLS ticket through a social lender such as a credit union may act to promote financial inclusion by establishing a relationship between the purchaser and the institution. However, this approach restricts the lottery element of the product and, consequently, its potential appeal to non-typical savers. The increased risk (when compared to traditional PLS) makes Win & Save a more exciting product than Premium Bonds, which could widen its appeal to gamblers and regular lottery participants. Under a traditional PLS scheme, only the assumed yield (rather than the principal) is contributed to the prize pot, which results in lower prizes to be won. This may be insufficient to attract gamblers or tempt those who play other lotteries. Positioning our product close to gambling products such as those for the Lotto and Euromillion games, as well as scratch cards, is likely to offer strong opportunities for substitution. W&S aims to substitute gambling activity not saving activity. Why there is a case for encouraging consumers to participate in W&S rather than lotteries The National Lottery The National Lottery’s overarching objective is to maximise returns for ‘good causes’ through selling Lottery products in an efficient and socially responsible way. 75 Since its launch in November 1994, the UK National lottery has paid out over £59 billion in prizes while raising over £35 billion for good causes across the country. 76 Whilst National Lottery draws are the most popular form of gambling, participation has been declining over the years. 77 National Lottery funding for ‘good causes’ is handed out by six distributors, including the Big Lottery, Heritage Lottery Fund, Arts Council, British Film Institute, Sport England and Sport UK (there are also separate bodies in the devolved nations in some cases). 78 Concerns about the regressivity of lotteries The National Lottery has periodically come under scrutiny for its raising and allocation of funding for ‘good causes’, most recently with a number of MPs calling for more transparency over the distribution of Lottery sales and spending. 79 In academic and political debate, there is an established concern as to whether lotteries act like regressive taxes. 80 Lotteries may be regressive in multiple ways. First, lower-income groups may be more likely to play the lottery than more affluent groups, and to purchase tickets more frequently. 81 ONS data shows that there is no clear pattern in terms of annual spending on Camelot National Lottery tickets across households. 22
WIN & SAVE

Figure 9: Average contribution towards the Camelot National Lottery Fund of all households, by decile of
(equivalised) disposable income (£)

 All households                                                                   £61
            Top                                                                     £64
             9th                                                                          £70
             8th                                                             £59
             7th                                                                           £72
             6th                                                                                        £86
             5th                                                              £60
             4th                                                             £58
             3rd                                                   £47
            2nd                                                       £51
         Bottom                                                   £46
                   £0    £10     £20         £30         £40      £50       £60      £70         £80    £90     £100

Source: SMF analysis of ONS data, 2017/18   82

Figure 8 shows that individuals in lower-skilled occupations are as likely to purchase lottery
tickets as better paid workers. Academic research argues that the ‘good causes’ element of the
lottery tax leads to revenues being raised very inefficiently 83 as individuals from lower socio-
economic backgrounds are more likely both to play National Lottery games, and to spend more
money on these games. 84 Academic research has shown that a small chance of winning a large
reward is a more powerful motivation for participation in lotteries among lower-income
populations. 85

Second, lower-income groups spend a higher share of their (lower) disposable income on
lotteries, and, therefore, contribute more to ‘good causes’ (as a proportion of their disposable
income). This is shown in Figure 10, which illustrates households’ contribution towards the
Camelot National Lottery Fund in 2017/18. Although the average annual contributions of all
households amount to 0.18% disposable income, only households from the top three disposable
income deciles contribute less to ‘good causes’ than the UK average. Alarmingly, households in
the lowest decile contribute more than double the share of the UK average, at 0.48% of their
disposable income. Therefore, this method of funding social causes is much less progressive
than taxes such as income tax (which fall more heavily on those who have higher incomes).

Figure 10: Average contribution towards the Camelot National Lottery Fund of all households, by decile of
(equivalised) disposable income

 All households                                          0.18%
            Top                0.07%
             9th                                 0.14%
             8th                                 0.14%
             7th                                               0.21%
             6th                                                         0.28%
             5th                                                 0.23%
             4th                                                      0.26%
             3rd                                                   0.24%
            2nd                                                                    0.32%
         Bottom                                                                                                 0.48%

              0.00%             0.10%                0.20%              0.30%                   0.40%          0.50%

Source: SMF analysis of ONS data, 2017/18   86

                                                                                                                        23
SOCIAL MARKET FOUNDATION
A third factor that has led to concerns about the progressivity of the National Lottery is whether
those on lower incomes benefit as much as more affluent groups from ‘good causes’. These
issues are discussed in more detail below. Note, our intention here is not to question the social
benefit of specific ‘good causes’.
Distribution of National Lottery ‘good cause’ funding
It is difficult to assess fully the distributional implications of funding for ‘good causes’. Our
analysis highlights that regional spending on ‘good causes’ does not correspond closely to
participation in the National Lottery. Since 1995, a disproportionately high share of the funding
for ‘good causes’ has flowed to London (£984 per capita 87) while the East of England and the
South East attracted the lowest amount of funding per capita (£321 and £354, respectively).
There is significant redistribution across regions: London and the North East are net
beneficiaries, whilst the North West, the East of England, the South West and the South East are
net losers (in terms of participation versus £ of good causes spent).
Figure 11: National Lottery players and National Lottery spending on Good Causes, by region
£1,200 17% 18%
£984 16%
£1,000
13% 13% 14%
£800 13% 11% 12%
£644 10% 9%
9% 10%
£600 £528 £509
£499 £489 £480 8%
5% £354
£400 £321 6%
4%
£200
2%
£0 0%
North East North York & East West East of London South East South
West Humber Midlands Midlands England West
Per capita spending on Good Causes (since 1995) Distribution of lottery players (in 2015/16)
Source: SMF analysis of Health Survey for England (2016) and National Lottery data
Past research has suggested that more affluent areas win a larger share of funds from the
National Lottery. Research finds that there is a tendency for big cities in the UK to win a
disproportionate share of lottery grants, especially when it comes to arts funding: in the period
1995-2004, local authorities in metropolitan counties are estimated to have been granted per
capita arts funding approximately £50 more than other local authority areas (controlling for
education, social class, and ethnicity variation). 88 In London, this premia rises to £92 per
capita. 89 MPs have complained that this preference felt by cities leads to less funding reaching
towns, including in former coalfield and industrial communities. Analysis completed by Gloria De
Piero MP of NL funding in 2014/15, found that the Cities of London and Westminster
constituencies received £206m – compared with £73,000 for the Castle Point constituency. 90
This straightforward geographic dimension does not properly capture the beneficiaries of this
spending as people are likely to travel into centres to access services funded by ‘good causes’.
24WIN & SAVE
Research completed in 2007 analysed the distributional impact of good cause funding across
communities. Funding for each of the six categories of ‘good causes’ was shown to increase in
accordance with the proportion of graduates in the area. 91 Allocation of grants was also
associated with social class, especially in the arts and heritage categories – each percentage
point increase in the proportion of ‘professionals’ (social class 1 or 2) raises the predicted per
capita funding of heritage projects in the area by £2.27 (relative to the mean of £36.99). 92 It
remains very difficult to assess with any great precision who benefits from National Lottery ‘good
causes’.
We note that funding from the National Lottery grant distributors contributes to important
schemes which benefit many in society, including schemes that aim specifically to benefit low
income groups. For instance, Big Lottery funding is being used to help design a financial inclusion
scheme which will benefit from funding that the Government is releasing from dormant bank
accounts. 93
25You can also read