Waitaki District Coastal Hazards - Prepared for the Otago Regional Council January 2019
←
→
Page content transcription
If your browser does not render page correctly, please read the page content below
Waitaki District Coastal Hazards
 Prepared for the Otago Regional Council

 January 2019
Prepared by:
Cyprien Bosserelle
Murray Hicks
Jo Bind

For any information regarding this report please contact:
Cyprien Bosserelle
Hydrodynamics Modeller
Hydrodynamics
+64-3-341 2840
cypprien.bosserelle@niwa.co.nz

National Institute of Water & Atmospheric Research Ltd
PO Box 8602
Riccarton
Christchurch 8011

Phone +64 3 348 8987

NIWA CLIENT REPORT No: 2018035CH
Report date: January 2019
NIWA Project: ORC18502

 Quality Assurance Statement

 Reviewed by: Richard Measures

 Formatting checked by: Rachel Wright

 Approved for release by: Helen Rouse

Front page: View of the coastline between Bridge Point and Orore Point. [Jo Bind, NIWA]

© All rights reserved. This publication may not be reproduced or copied in any form without the permission of
the copyright owner(s). Such permission is only to be given in accordance with the terms of the client’s contract
with NIWA. This copyright extends to all forms of copying and any storage of material in any kind of
information retrieval system.

Whilst NIWA has used all reasonable endeavours to ensure that the information contained in this document is
accurate, NIWA does not give any express or implied warranty as to the completeness of the information
contained herein, or that it will be suitable for any purpose(s) other than those specifically contemplated
during the Project or agreed by NIWA and the Client.
Contents

Executive summary ............................................................................................................. 6

1 Introduction .............................................................................................................. 7
 1.1 Project overview ....................................................................................................... 7

2 Coastal inundation hazard........................................................................................ 10
 2.1 Review of Lane et al. (2008) ................................................................................... 10
 2.2 Updated sea-level rise scenarios ............................................................................ 15
 2.3 Methodology for updated mapping of inundation hazard zones .......................... 16
 2.4 Results ..................................................................................................................... 17

3 Coastal erosion hazard ............................................................................................. 28
 3.1 Introduction ............................................................................................................ 28
 3.2 Methodology .......................................................................................................... 29
 3.3 Results ..................................................................................................................... 49

4 Discussion ............................................................................................................... 74
 4.1 Overview of the results ........................................................................................... 74
 4.2 Impact of accelerated sea-level rise on the erosion hazard ................................... 74
 4.3 Effectiveness of coastal protection to reduce erosion hazard ............................... 75
 4.4 Coastal monitoring.................................................................................................. 75

5 Conclusion ............................................................................................................... 78

6 Acknowledgements ................................................................................................. 79

7 References............................................................................................................... 80

8 List of supplementary material supplied separately from this report ......................... 83

Waitaki District Coastal Hazards
Tables
Table 2-1: Wave runup prediction. 12
Table 2-2: Sea-level scenarios for coastal inundation prediction. 16
Table 2-3: Predicted extreme water levels (m above MSL) for four average recurrence
 interval (ARI). 17
Table 2-4: Inundation depth for different extreme water level scenarios and sea level rise
 scenarios at Esplanade Road. 19
Table 3-1: Imagery data source used in the shoreline detection. 30
Table 3-2: Wide gravel barrier geometry parameters used in equation 3.6 for the Waitaki
 River mouth. 46
Table 3-3: Location of clifftop on profiles surveyed by Otago Regional Council. 64

Figures
Figure 1-1: Location of the study area. 8
Figure 2-1: Comparison of measured and predicted inundation extent in Kakanui. 14
Figure 2-2: Predicted inundation depth for the 100-year ARI storm and +0.0 m SLR for
 Oamaru. 18
Figure 2-3: Predicted inundation depth for the 100-year ARI storm and +1.3 m SLR for
 Oamaru. 19
Figure 2-4: Predicted inundation depth for the 100-year ARI storm and +0.0 m SLR for
 Kakanui. 20
Figure 2-5: Predicted inundation depth for the 100-year ARI storm and +1.3 m SLR for
 Kakanui. 21
Figure 2-6: Inundation depth for the 100-year ARI storm and +0.0 m SLR for Hampden. 22
Figure 2-7: Inundation depth for the 100-year ARI storm and +1.3 m SLR for Hampden. 23
Figure 2-8: Inundation depth for the 100-year ARI storm and +0.0 m SLR for Moeraki. 24
Figure 2-9: Inundation depth for the 100-year ARI storm and +1.3 m SLR for Moeraki. 24
Figure 2-10: Coastal inundation hazard zone extents for Oamaru. 25
Figure 2-11: Coastal inundation hazard zone extents for Kakanui. 26
Figure 2-12: Coastal inundation hazard zone extents for Hampden. 26
Figure 2-13: Coastal inundation hazard zone extents for Moeraki. 27
Figure 3-1: Armouring of the backshore cliff on Katiki Road (7/12/2017). 29
Figure 3-2: Example of shoreline detection along Beach Road, south of Oamaru. 31
Figure 3-3: Example of transects perpendicular to the coast. 32
Figure 3-4: Example of intersection point between the transects and detected shorelines.
 32
Figure 3-5: Example of shoreline trend analysis. 33
Figure 3-6: Oamaru (central) beach profiles surveyed by Otago Regional Council. 34
Figure 3-7: Erosion rates simulated for Oamaru using SCAPE+. 35
Figure 3-8: Example of probabilistic coastal hazard zone prediction. 37
Figure 3-9: Coastal morphology types along the Waitaki District coast. 38
Figure 3-10: Example of bedrock cliff morphology. 40

 Waitaki District Coastal Hazards
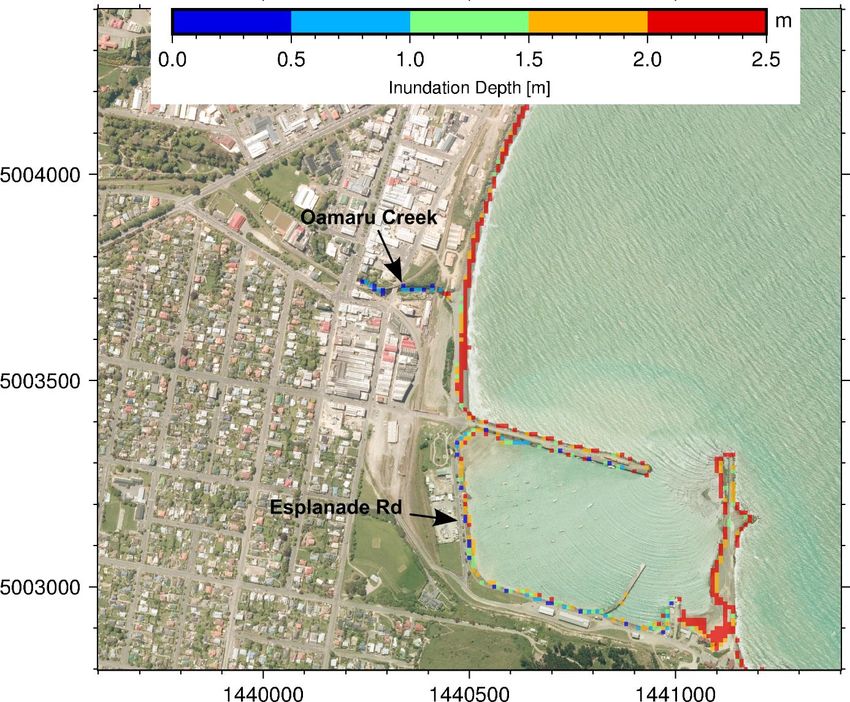
Figure 3-11: Example of unconsolidated cliff morphology: north of Oamaru. 41
Figure 3-12: Example of unconsolidated cliff morphology: Beach Road. 42
Figure 3-13: Example of unconsolidated cliff morphology: Hampden. 42
Figure 3-14: Four main types of perched beaches. 44
Figure 3-15: Example of geologically controlled beach: South Katiki Beach. 45
Figure 3-16: Example of thin sand/gravel barrier morphology: Kakanui barrier. 47
Figure 3-17: Calculated shoreline trends for the Waitaki District coast. 50
Figure 3-18: Calculated shoreline trends for the Oamaru area. 51
Figure 3-19: Calculated shoreline trends for the Kakanui area. 52
Figure 3-20: Calculated shoreline trends for the Hampden and Moeraki area. 53
Figure 3-21: Calculated shoreline trends for the Shag Point and Shag River mouth area. 54
Figure 3-22: Calculated shoreline trends along Beach Road. 55
 th
Figure 3-23: 95 percentile of the short-term retreat for beach and cliff shores. 56
Figure 3-24: Difference in elevation between 2004 and 2016 near Oamaru based on LiDAR
 surveys. 58
Figure 3-25: Elevation profiles near Weaver Road. 59
Figure 3-26: Elevation profile near Usk Street. 59
Figure 3-27: Elevation profile north of Oamaru Creek. 60
Figure 3-28: Difference in elevation between 2004 and 2016 near Kakanui based on LiDAR
 surveys. 61
Figure 3-29: Elevation profile at Kakanui through a recent slump that removed part of the
 road. 62
Figure 3-30: Elevation profile of the gravel barrier at Kakanui. 62
Figure 3-31: Difference in elevation between 2004 and 2016 on Katiki Beach based on
 LiDAR surveys. 63
Figure 3-32: Elevation profile on Katiki Beach. 63
Figure 3-33: Elevation profile in Katiki Beach. 64
Figure 3-34: Result of the cliff erosion simulation for the shore north of Oamaru. 65
Figure 3-35: Histogram of predicted 100-year erosion hazard zone width for the most likely
 realisation (50th percentile). 66
 th
Figure 3-36: Histogram of predicted 100-year erosion hazard zone width for the 95
 percentile realisation. 66
 th th
Figure 3-37: Coastal hazard zone width for 95 percentile (CHZ95) and for 50 percentile
 (CHZ50) for 100-year prediction for the entire Waitaki District coastline. 68
 th th
Figure 3-38: Coastal hazard zone width for 95 percentile (CHZ95) and for 50 percentile
 (CHZ50) for 100-year prediction for Oamaru. 69
 th th
Figure 3-39: Coastal hazard zone width for 95 percentile (CHZ95) and for 50 percentile
 (CHZ50) for 100-year prediction for Beach Road. 70
 th th
Figure 3-40: Coastal hazard zone width for 95 percentile (CHZ95) and for 50 percentile
 (CHZ50) for 100-year prediction for Kakanui. 71
 th th
Figure 3-41: Coastal hazard zone width for 95 percentile (CHZ95) and for 50 percentile
 (CHZ50) for 100-year prediction for Hampden and Moeraki. 72
Figure 3-42: Coastal hazard zone width for 95th percentile (CHZ95) and for 50th percentile
 (CHZ50) for 100-year prediction for Shag Point / Matakaea. 73
Figure 4-1: Riprap section on Beach Road viewed on satellite imagery of 02/09/2006. 76
Figure 4-2: Riprap section on Beach Road viewed on satellite imagery of 03/10/2012. 77

Waitaki District Coastal Hazards
Executive summary
This study analysed the inundation and erosion hazards along the Waitaki District coast. The study,
conducted by NIWA for the Otago Regional Council (ORC), found that while the erosion hazard is
widespread, the inundation hazard only applies to relatively small parts of the populated area of the
district (mostly Kakanui Estuary and Oamaru Port foreshore).

Coastal hazard zones were mapped for both the inundation and erosion hazards considering a 100-
year planning time frame.

Inundation hazard zones are based on inundation extent across the populated area of the district and
were adapted from previous work. Critical limitations in the available analysis, in particular with the
estimates of extreme water levels and wave runup, constrained the use of the inundation hazard
zone to low lying inland areas and does not allow the evaluation of the coastal inundation hazard in
areas where wave impact is likely to be significant (e.g., Kaika, Karita, Katiki Road and Beach Road).
Further study is recommended to refine the extreme water levels and wave runup and revise the
inundation hazard zones.

The coastal erosion hazard zone was calculated for the entire length of the Waitaki District coast.
This was based on extrapolation of historical erosion rates derived from analysis of aerial and
satellite imagery and an allowance for short-term shoreline retreat due to storm erosion or cliff
slumping/collapse. In areas where sufficient information was available, the erosion due to the future
acceleration of sea-level rise was also taken into account. Separate simulation of the evolution of the
cliffs north of Oamaru was undertaken using a numerical morphological model, and this showed that
acceleration in sea-level rise should have little impact on the cliff retreat rate on that part of the
coast.

The coastal erosion hazard zone was mapped for two outlook periods (50 and 100 years) and two risk
levels: the CHZ95 zone mapped the line where there should only be a 5% chance that the erosion
hazards could extend up to or landward of the line; and the less conservative CHZ50 zone mapped
the line where there is a 50% chance that erosion hazards could extend up to or landward of the line.
Decision makers should select the most suitable line depending on the planning horizon, value, and
vulnerability of the assets potentially impacted by the predicted erosion.

The coastal erosion hazard zone width proposed for the 100-year outlook at 95-percentile
confidence (CHZ95) is 65 m wide just north of Oamaru near Waitaki Boys High School. The CHZ95
width further north is close to 100 m which is similar to the 100 m width of the hazard zone
previously proposed for the Waitaki District Council.

Much infrastructure (mostly roads) and many assets are within the CHZ95 zone. No new erosion
hotspots were identified, with continued erosion expected at the current hotspots of Katiki Beach,
Beach Road, Kakanui, and North Oamaru. Any plans to stabilise these shores with protective
structures would need to ensure that the structures are properly built and maintained. Monitoring at
these hotspots will help to refine estimates of the hazard zone widths and to better plan the nature
and timing of hazard mitigation/adaptation.

The hazard zone estimates provided herein are based on a hybrid-probabilistic approach that can be
reproduced and refined as new data become available.

6 Waitaki District Coastal Hazards
1 Introduction
The Waitaki District is experiencing long-term retreat of its coastline. In particular, the coast north of
Oamaru is experiencing a rapid recession of the soft sediment cliffs with reported retreat of
0.5 m/year (Gibb 1978). Coastal erosion in the District threatens communities, infrastructure, and
assets. The Otago Regional Council is committed to better understanding of coastal hazards in the
Otago Region. This focus in coastal hazards has come about through several recent drivers:

 ▪ Recent storm-related erosion events in Oamaru.

 ▪ The high cost associated with the repair and movement of coastal roads and
 breakwaters near Oamaru.

 ▪ The required update of the Waitaki District Plan.

 ▪ The need to address the effects of sea-level rise on coastal hazards as required by the
 NZ Coastal Policy Statement (NZCPS, 2010).

 ▪ A limited understanding of erosion rates along the coastline.

To address these concerns there is a need to understand and predict future coastal hazards and
incorporate this understanding into future planning of development in the Waitaki District.

1.1 Project overview
The aims of this project are to:

 1. Assess and update the existing coastal inundation information, including:

 ▪ Provide feedback regarding the suitability of Lane et al. (2008) study

 ▪ Advise the Otago Regional Council where additional information and studies are
 required

 ▪ Update the inundation map with the new sea-level rise scenarios.

 ▪ Convert the inundation information into hazard zoning for the 100-year average
 recurrence interval and two sea-level rise scenarios.

 2. Evaluate the coastal erosion hazard for the Waitaki District including:

 ▪ Map current shoreline position

 ▪ Evaluate shoreline retreat rates using mapped shoreline position

 ▪ Predict future shoreline position and construct hazard zones.

This project does not investigate the inundation related to tsunami, groundwater, river floods or
urban flooding.

The study calculates the inundation hazard zone for a 100-year average recurrence interval (ARI)
extreme water level. Coastal erosion hazard zones are calculated based on 50-year and 100-year
projections of shoreline position following an adapted version of the shoreline recession approach
proposed by Gibb (1982).

Waitaki District Coastal Hazards 7
The study addresses coastal erosion for the entire Waitaki District and inundation hazards for
Oamaru and the settlements of Kakanui, Hampden, Moeraki township and Boulders, and Shag
Point/Matakaea (Figure 1-1).

Figure 1-1: Location of the study area. Northing and easting are given in the New Zealand Transverse
Mercator projection (NZTM).

8 Waitaki District Coastal Hazards
Time constraints on the project did not allow for new field data collection nor even comprehensive
field inspection of all the Waitaki District coast, but recommendations are made for future coastal
hazard monitoring. This suggested monitoring is targeted to reduce the uncertainties where the
coastal hazard risk is high and where communities and assets are more vulnerable.

The project outputs include:

 ▪ This report, which includes commentary on the methods and assumptions
 underpinning this hazard mapping.

 ▪ GIS files mapping the extents of the coastal inundation and erosion hazard zones.

 ▪ Four supplementary documents showing the different coastal inundation maps for
 storms with 20, 50, 100, and 500-year ARI and sea levels ranging from 0.0 to 1.3 m
 above present level.

Note that all the maps and all the northings and eastings in this report are given in the New Zealand
Transverse Mercator projection (NZTM).

Waitaki District Coastal Hazards 9
2 Coastal inundation hazard
Coastal inundation occurs when the elevation of the sea level exceeds that of the land, allowing
water to flow inland and flood. Elevated sea levels are caused by a combination of normal tides
(including neap and spring tides), storm surge due to the inverse barometer effect (i.e., lifting of the
sea level by low atmospheric pressure) and wind, mean sea level anomalies (MSLA), and the release
of wave energy at the coast causing wave setup and wave runup. The effects of future climate
change, predominantly sea-level rise, will add to these factors.

For this project, the coastal inundation hazard due to storm tide (combined storm surge and tide),
waves, and rising sea level was assessed in three steps:

 ▪ Review of Lane et al. (2008) for the prediction of coastal inundation extent from
 extreme water levels and waves in the Otago region. This step evaluated the
 suitability of the previous work for use in hazard zoning and advised on possible
 improvements.

 ▪ Updating the extents of the inundation hazard in Waitaki District by applying the
 results from Lane et al. (2008) to future sea-level rise scenarios that are in-line with
 guidance from the Ministry for the Environment.

 ▪ Convert the inundation extent into hazards zoning for the 100-year ARI extreme
 water level and two sea-level rise (SLR) scenarios.

2.1 Review of Lane et al. (2008)
Lane et al. (2008) used historical and hindcast data to describe the probability of extreme water
levels from storm surge, tide, mean sea level anomaly and waves. Based on these probability
distributions they calculated the 20, 50, 100 and 500-year ARI inundation events for the populated
coastal areas of Oamaru, Kakanui, Hampden and Moeraki. Using the extreme water level and an
estimate of wave runup, the report then shows inundation extent and inundation depths using a
‟bathtub”-type analysis applied over a coastal digital elevation model derived from the 2004 LiDAR
survey gridded at a 10 m resolution. The report shows the impact of sea-level rise by applying sea-
level rises of 0.3 m and 0.5 m to the bathtub analysis of the storm tide and wave runup.

The main finding of Lane et al. (2008) is that, in the Waitaki District, only the Kakanui River mouth
area is at high risk of coastal inundation from storm tide in the 100-year ARI storm event. Most other
populated coastal areas (Oamaru, Hampden, Moeraki and Shag Point) are located sufficiently above
the present mean sea-level to avoid storm surge flooding.

The general methodology used in Lane et al. (2008) is sound but contains significant limitations in the
analysis of wave runup, analysis of extreme water level and in the inundation mapping. The wave
setup included in the extreme water levels is non-conservative, the analysis of wave runup is non-
conservative (i.e., low), and the inundation mapping method (bathtub) is conservative. So, the results
from Lane et al. (2008) potentially underestimate inundation depth along the coastline where wave
runup occurs but overestimate the inland extend of inundation. The main other limitations are the
short historical record, a simplistic approach to combining wave setup and storm surge, and lack of
process-based simulation of storm surge and wave propagation over the bathymetry. Despite these
limitations, improving the accuracy of the methodology used in Lane et al. (2008) is unlikely to
significantly change the inundation mapping in the most populated locations in the Waitaki District
because most populated coastal areas are located high above the storm surge levels. Kakanui and

10 Waitaki District Coastal Hazards
Oamaru Port are the only areas where improvement to the extreme analysis and inundation
simulation would refine the predicted inundation extent. This is because Kakanui is near the river
mouth, is relatively low lying, and is only protected from elevated sea levels by a 20 m wide
gravel/shingle barrier. The results from Lane et al. (2008) do not apply to rural parts of the Waitaki
coast, thus the available information about topography and extreme water levels is insufficient to
evaluate the coastal inundation hazard along these parts of the coast.

For the purposes of this work, we have used Lane et al. results, but as requested by ORC a detailed
review of four aspects of the methodology (historical data, statistical model, inundation simulation
and climate change impact) used by Lane et al. (2008) to assess the coastal inundation hazard is
provided below. In addition, we note the potential improvements to the work that could be
considered in the future.

2.1.1 Historical data
The validity of extreme water level estimates depends on the initial data used to produce the
probability density function (PDF) which is then used in the extreme statistical model. The data used
in the 2008 analysis were derived from a combination of wind, tide record and hindcast model
results.

The historical storm surge (1961 – 2005) was reconstructed by combining the inverse barometer and
wind setup component following Wild et al. (2005) using atmospheric pressure and wind data from
Taiaroa Head (75 km south from Oamaru). Tidal information was extracted from the tidal model of
Walters et al. (2001). The wave height was extracted from the wave model from Gorman et al.
(2003).

Potential improvements to the work that could be considered in the future: improving the
reconstruction approach and extending the hindcast to include recent storms would improve the
extreme statistical model. This would better constrain the empirical PDF of the storm surge and
reduce the uncertainty for the estimated 100-year ARI extreme water level and wave height.
Developing and implementing improved methods is out of scope for this project but could be
considered in future studies.

2.1.2 Statistical model used to evaluate extreme water levels
The statistical model used in Lane et al. (2008) is a type of stationary bivariate analysis which
assumes that storm surge and large waves do not occur independently. This is used to describe co-
occurrence of extreme storm surge and wave setup. The joint probability of storm surge and wave
setup are calculated for set return intervals and then combined with tide level and mean level of the
sea to obtain extreme water levels. This method for estimating extreme water levels corresponds to
the present standard methodology but more recent methodologies may be more robust (e.g.,
Stephens and Robinson 2016). However, these more robust approaches require more data and
analysis beyond the scope of this report.

The extreme water levels calculated from Lane et al. (2008) appear to be consistent with those
predicted with more robust analysis. For example, they estimated the 100-year ARI extreme water
level (storm surge + tide + mean sea level anomaly + wave setup) south of Dunedin at 2.05 m
(relative to Dunedin Vertical Datum 1958, DVD58). If we remove from this value the estimate of the
wave setup component of 0.5 m for south of Dunedin (Figure 3.8 in Lane et al. 2008), the predicted
storm tide from Lane et al. (2008) is comparable to the 1.58 m (above DVD58) storm tide estimates
reported by Stephens and Robinson (2016) using a more modern extreme analysis.
Waitaki District Coastal Hazards 11
Beyond the approach used in the 2008 study, recent developments in the analysis of extremes may
improve the statistical robustness and reduce the uncertainty of the derived storm surge
distribution. Recent methods use multivariate analysis (e.g., following Gouldby et al. 2014 or Rueda
et al. 2016) that account for multiple wave parameters (wave height, period and direction), separate
components of the storm surge (wind setup and inverse barometer) and mean sea level anomaly.

Recent developments in coastal inundation research also aim to include seasonal and inter-annual
variability in extreme distributions, with the aim of better understanding how a changing climate
affects extreme events. This methodology often relies on weather pattern analysis and the non-linear
relationship between the weather pattern and the interdependent components that contribute to
the total water level and wave parameters. Although the necessary data is available in the Waitaki
region through weather, wave and storm surge hindcasts, this type of analysis is laborious and
generally applicable to large regions. Preliminary work by Rueda et al. (in review) applied this
methodology to analyse the wave climate of New Zealand’s South Island and found strong inter-
annual variability of large wave events.

Potential improvements to the work that could be considered in the future: Improvements to the
method used in the 2008 report should better reflect the actual joint-occurrence of waves, storm
surges and mean sea level anomaly along the Waitaki coastline. In addition, these modern methods
are less conservative in predicting extreme events and would likely reduce the predicted extreme
water levels. Developing and implementing improved methods is out of scope for this project but
should be considered in future studies.

2.1.3 Wave runup calculations
The wave runup estimates from Lane et al. (2008) were calculated based on the empirical formula
from Stockdon et al. (2006) using hindcasted wave conditions for the Waitaki coastline from Gorman
et al. (2003). While the wave hindcast and empirical formula are robust, the values presented for
runup in Lane et al. (2008) appear lower than expected when compared to nearby observations of
beach morphology and runup estimates from South Canterbury. For example, the value for the
maximum runup presented for the 100-year ARI event at Oamaru is 1.38 m (excluding wave setup),
which is far smaller than the 6.0 m wave runup presented by Stephens et al. (2015) for Wainono
Lagoon. It is likely that Lane et al. (2008) underestimated the beach slope or miscalculated how the
extreme waves were determined, and therefore underestimated their runup predictions.

Table 2-1: Wave runup prediction. Source: Lane et al. (2008).

 Location Averaged predicted wave runup (m) Maximum predicted wave runup (m)

 Moeraki 0.28 0.85

 Hampden 0.36 1.09

 Kakanui 0.44 1.33

 Oamaru 0.46 1.38

Potential improvements to the work that could be considered in the future: The wave runup results
presented by Lane et al. (2008) are not realistic and require new calculations. This analysis is beyond
the scope of this project but is critical for inundation hazard assessments.

12 Waitaki District Coastal Hazards
2.1.4 Inundation simulation
The total water level calculated at the coast is extrapolated over land using a bathtub analysis where
the total water level is assumed to reach a uniform elevation, and depth of inundation is then the
difference in elevation between the water level and the land. This methodology cannot take into
account how the storm surge flows over the land and underestimates attenuation of the propagating
storm surge as it spreads inland over vegetation (Sheng et al. 2012), around obstructions (e.g.,
buildings) or interacts with permeable surfaces (e.g., gravel barriers), nor does it account for
morphodynamic changes during such a storm. These two factors result in conservative estimates of
inundation extent and depth, particularly at greater distances inland.

In addition, the analysis in Lane et al. (2008) applies a single value of wave setup and runup to each
DEM grid, underestimating (or overestimating) the runup where wave focusing locally produces
higher (or lower) runup and overestimating (or underestimating) runup for areas locally sheltered (or
exposed) to waves.

Another process that is not explicitly considered in the 2008 analysis is the contribution of
infragravity waves on the runup. These low frequency waves are generated from the breaking of
wave groups in the surf zone, and they can further raise the water level at the shore for several
minutes. Although their behaviour is tied to swell dissipation, they can excite resonant modes in bays
and harbours and locally cause a significant amplification of the maximum water level. Infragravity
waves also play a significant role in triggering overtopping and landward ‟rollover” of gravel barrier
beaches and overtopping of coastal structures (McCall et al. 2015).

The limitations of the methodology used in Lane et al. (2008) can be evaluated by comparing the
inundation extent predicted by the report with the extensive inundation observed at Kakanui from
the recent storm of July 2017. Drone footage by Robertson (2017) collected immediately following
the storm on 21st July 2017 was used to identify the maximum extent of inundation as indicated by
debris (driftwood, seaweed etc.). The July 2017 event was a ‟compound” event, with coincident high
storm surge (equivalent to the 1-year ARI storm tide in Timaru based on the Stephens et al. (2015)
analysis) and river flooding stemming from heavy rainfall (largest recorded 24-hour rainfall
accumulation in Oamaru since the record began in 1950), which renders the contribution of storm
surge hard to separate from that due to river flooding. However, the extent of the inundation
observed, in particular on the left bank of the river, appears to align best with the 20-year ARI
inundation prediction with present day sea level (Figure 2-1). This result suggests that the inundation
extent is more strongly controlled by topographical features on the floodplain than by the elevation
of the storm surge.

Waitaki District Coastal Hazards 13
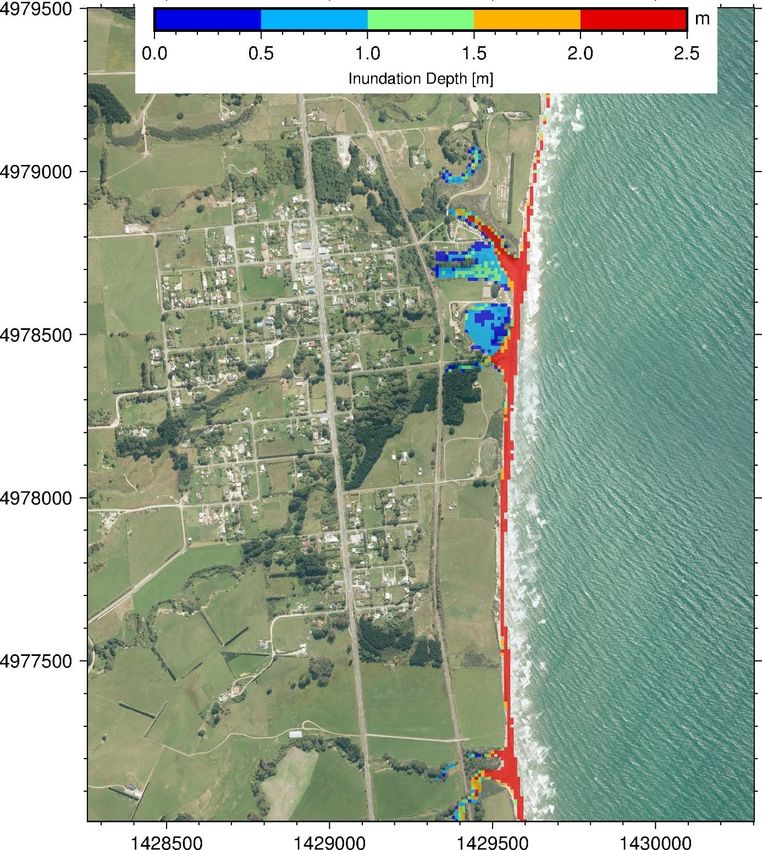
Figure 2-1: Comparison of measured and predicted inundation extent in Kakanui. Comparison of the
predicted 20-year ARI inundation depths on present-day sea level (shading) with the observed July 2017
inundation extent (black crosses) at Kakanui. [Sources: modelled inundation extent Lane et al. (2008),
inundation extent: Robertson 2017].

Potential improvements to the work that could be considered in the future: Improvement from using
process-based simulations of the inundation is likely to lead to a somewhat smaller inundation extent
for Kakanui, but the improvement may only be minor as the inundation extent is predominantly
controlled by topographical features on the floodplain.

2.1.5 Climate change impacts
Lane et al. (2008) assume that the extreme distribution of storm surge would be stationary; that is,
they assume (for lack of better information) that climate change is not going to significantly affect
the distribution of waves, wind and storm surge. Challenging such an assumption is difficult because
no regional scale climate model to date achieves a level of precision and accuracy that would allow
an analysis of how climate change is going to affect these parameters. One solution to this issue is to
analyse the relationship of the weather patterns and the distribution of processes that contribute to
the water level and waves such as discussed above and apply these relationships to future weather
patterns predicted from climate models. Ministry for the Environment (MfE 2017) recommends to
“undertake sensitivity testing for coastal engineering projects and for defining coastal hazard
exposure areas out to 2100, using:

 ▪ A range of possible future increases across New Zealand of 0–10 per cent for storm
 surge out to 2100.

 ▪ A range of possible future increases across New Zealand of 0–10 per cent for
 extreme waves and swell out to 2100.

14 Waitaki District Coastal Hazards
▪ Changes in 99th percentile wind speeds by 2100 and incorporating these for the
 relevant RCP scenario from MfE (2017) on climate change projections, to assess
 waves in limited-fetch situations, such as semi-enclosed harbours, sounds, fjords
 and estuaries.”

Although Lane et al. (2008) do not consider the effect of climate change on storm surge and waves,
they do consider the effect of sea-level rise. Their report presents inundation hazard maps for three
sea-level rise scenarios including a present day and two future scenarios:

 1. Present mean level of the sea (MLOS).

 2. MLOS + 0.3 m.

 3. MLOS + 0.5 m.

However, no justification was given in the report for how the sea-level rise scenarios were selected.

Implications for this project: Further assessments of climate change effects is out of scope for this
project but should be considered in future analysis and may be completed with a reanalysis of the
predicted runup in a more detailed study of the extreme inundation hazards in the Waitaki district.

The future sea level scenarios are no longer in line with Ministry for the Environment
recommendations. Updating the sea-level rise scenarios and the impact of sea-level rise on the
coastal inundation extent is part of the scope of this report and is described in section 2.2 below.

2.1.6 Final remarks on Lane et al. (2008)
The general methodology used in Lane et al. (2008) is sound but contains significant limitations in the
analysis of wave runup, analysis of extreme water level and in the inundation mapping. Addressing
many of these limitations is beyond the scope of this report but should be considered in future
analysis.

Improved sea-level rise estimates for New Zealand and guidance for councils of what sea-level rise
scenarios to consider have been published since Lane et al. (2008). The present study uses up-to-date
sea-level rise scenarios and updates the coastal inundation extent using the results of storm surge
and wave runup from Lane et al. (2008).

2.2 Updated sea-level rise scenarios
The most recent national guidance on coastal hazards from the Ministry for the Environment (MfE
2017) recommends that different sea-level rise scenarios be used in an adaptive planning framework.
This means that for different assets near the coast a different future timeframe and sea-level
scenario may be used, with the timeframe and sea-level rise values proportional to the risk profile.
For example, for the most high-risk assets, MfE (2017) suggest that: ‟Councils considering coastal
subdivision, greenfield developments and major new infrastructure (Category A) should avoid hazard
risk by using sea-level rise over more than 100 years and the H+ scenario1”. For lower risk profiles
(Category B, C and D), a shorter time frame and hazard outlook can be used.

To provide the Otago Regional Council with a range of options fit for the full range of assets, this
study simulated additional sea-level rise scenarios, ranging from 0.3 m to 1.3 m above the present
mean level of the sea, in increments of 0.2 m. Each of these scenarios corresponds to a different

1 The H+ scenario is based on the RCP8.5 (83rd percentile) projection from Kopp et al. (2014)

Waitaki District Coastal Hazards 15
timeframe for different IPCC emission scenarios (IPCC 2013) instead of simulating sea-level rise
values directly tied to a single emission scenario and timeframe. The approximate timeframes for
each simulated sea-level rise occurring under the different IPCC emissions scenarios are listed in
Table 2-2.

Thus, in this study we consider sea-level rise up to 1.3 m above the present mean level of the sea,
corresponding to the upper bound of the likely range of sea-level rise by 2115 under the RCP8.5
emission scenario, as well as intermediate sea-level rise values corresponding to earlier outlooks
and/or lower emission scenarios.

Table 2-2: Sea level scenarios for coastal inundation prediction. Outlooks are based on emission scenarios
from IPCC (2013). RCP2.6 is a low emissions, effective mitigation scenario; RCP8.5 is a high emissions, no
mitigation scenario; the upper bound of the likely range of the estimate for RCP8.5 scenario is similar to the
higher, more extreme scenario projection from Kopp et al. (2014) also referred to as H+ by MfE (2017).

 Relative sea-level Outlook for RCP2.6 Outlook for RCP4.5 Outlook for RCP8.5 Outlook for RCP8.5
 above present mean Maximum likelihood Maximum likelihood Maximum likelihood upper bound of
 level of the sea (m) likely range
 + 0.3 2070 2060 2055 2050
 + 0.5 2115 2095 2080 2070
 + 0.7 -- 2125 2100 2085
 + 0.9 -- -- 2115 2095
 + 1.1 -- -- 2125 2105
 + 1.3 -- -- -- 2115

2.3 Methodology for updated mapping of inundation hazard zones
In this study, we updated the coastal inundation prediction of Lane at al. (2008) by combining their
results on extreme water level and wave runup (Table 2-3 and Table 2-1) with updated sea-level rise
scenarios (Table 2-2). This was performed for the most populated areas of the coast (Moeraki,
Hampden, Kakanui and Oamaru). Other areas of the Waitaki district may experience coastal
inundation but the wave and storm surge information have not been calculated with sufficient
details to assess inundation extent in these areas.

As with the study from Lane et al. (2008), the inundation was calculated on a 10-m resolution Digital
Elevation Model (DEM) created from the 2004 Lidar survey, with the vertical datum set to the mean
level of the sea (2008), 0.11 m above the Dunedin Vertical Datum 1958.

In Moeraki, Hampden, Kakanui and Oamaru, the inundation depth was calculated as:

 = + × ℎ + − (2.1)

where is the inundation depth (i.e., the maximum depth of inundation). is the
combined storm surge height, mean sea level anomaly, tide, and wave setup (Table 2-3), as
calculated by Lane et al. (2008). is the maximum wave runup as calculated by Lane et al.
(2008) and is only applied where ℎ is 1. ℎ is a flag which includes or excludes the
contribution of wave runup, and is only applied to those parts of the DEM grids that are located on
the shoreface (i.e., beach, coastal defences, cliffs); it is excluded in parts of the DEM that are on land,
in estuaries or inside marinas/ports. is the sea-level rise, and is the ground elevation.

16 Waitaki District Coastal Hazards
While LiDAR data provide high resolution topography information, it is important to consider the
overall limitations of the Lane et al. (2008) analysis. Lane et al. wrote: “The high resolution of the
LIDAR allows the correct representation of smaller features such as sand-dunes which contain rises in
sea level and protect the land behind. However, an important caveat to note is that due to the high
resolution of the LIDAR data, very precise maps of inundation will be produced. The precision of these
maps does not, however, imply an equivalent level of accuracy in the predictions, which may be
affected by imprecise knowledge of sea-level phenomena. The simplifying assumptions involved in
making the sea-level estimates, and the consequent limitations of the values produced, should be
kept in mind when examining and interpreting the maps.”

Furthermore, the inundation is calculated as a “bathtub” model which only maps constant levels of
water. It does not account for the propagation of the flood water, momentum and head loss due to
the roughness of the environment, nor does it contain any information about the duration of the
inundation. The model also does not account for any rainfall or river flow that may contribute to the
inundation. Although the simulation includes allowance for future sea-level rise, it does not account
for any change in the wave climate that may occur in the future. This type of simulation is a first
order assessment that is well suited for identifying vulnerable areas, but more detailed assessments
are required for risk assessment of assets and values in those areas.

Table 2-3: Predicted extreme water levels (m above MSL) for four average recurrence interval (ARI).
Extreme water level here is a combination of storm surge height, mean level of the sea, tide, and wave setup.
These values are given relative to the mean level of the sea (2008). [Source: Lane et al. 2008].

 Location 20-year ARI 50-year ARI 100-year ARI 500-year ARI

 Moeraki 1.60 1.67 1.71 1.83

 Hampden 1.84 1.91 1.96 2.07

 Kakanui 1.96 2.03 2.08 2.20

 Oamaru 2.01 2.08 2.14 2.26

Maps of the modelled inundation depth were created for each of the four ARIs of extreme water
level and seven sea-level scenarios at each site. Based on these maps, three coastal inundation
hazard zones were created using the 100-year ARI extreme water level and three sea-level rise
scenarios:

 1. An intermediate emission scenario (RCP 4.5) sea-level rise for 2125 of 0.7 m;

 2. A high emission scenario (RCP 8.5) sea-level rise for 2125 of 1.1 m; and

 3. Extreme scenario of 1.3 m sea-level rise for 2125 based on the RCP 8.5 (upper bound
 of likely range) similar to the H+ scenario suggested by MfE (2017).

The results of the inundation modelling follow.

2.4 Results
For each area of interest (Oamaru, Kakanui, Hampden, Moeraki), we present below the maps of the
predicted inundation for the 100-year ARI extreme water level at the 2008 mean sea level

Waitaki District Coastal Hazards 17
(referenced to Dunedin Vertical Datum 1958 + 0.11 m.) (+0.0 m SLR) and for the 100-year ARI
extreme water level at future sea-level rise of 1.3 m (+1.3 m SLR) (forecast for 2115 for the RCP8.5
upper bound of likely range). The inundation for 20, 50 and 500-year ARI at present MLOS, +0.3 m,
+0.5 m, +0.7m, +0.9 m, +1.1 m and +1.3 m SLR are presented in a supplementary document.

2.4.1 Oamaru
The inundation extent for the 100-year ARI event at present MLOS along Oamaru is limited to the
coastal beach and extends up Oamaru Creek by approximately 300 m (Figure 2-2). The intermediate
sea-level rise scenarios show a gradual increase to the inundation extent, with the areas landward
from Esplanade Road only predicted to be inundated with the highest sea-level rise scenario of
+1.3 m SLR (Figure 2-3).

Figure 2-2: Predicted inundation depth for the 100-year ARI storm and +0.0 m SLR for Oamaru.

18 Waitaki District Coastal Hazards
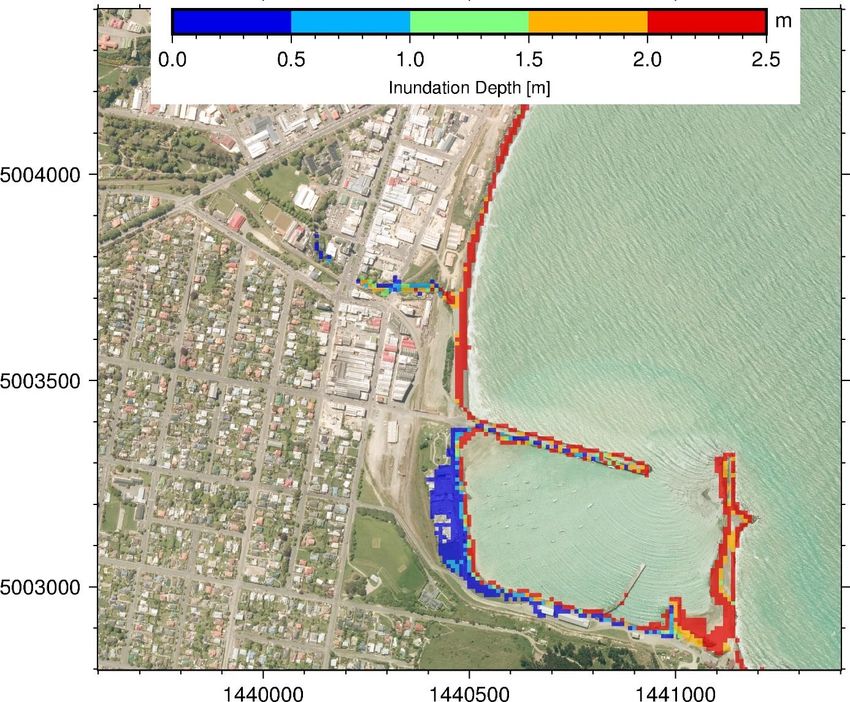
Figure 2-3: Predicted inundation depth for the 100-year ARI storm and +1.3 m SLR for Oamaru.

Sea-level rise increases the coastal inundation risk in Esplanade Road and the area of the port behind
that road. However, the model shows inundation of Esplanade Road only for the higher sea-level rise
scenario for the most extreme events (Table 2-4).

Table 2-4: Inundation depth for different extreme water level scenarios and sea-level rise scenarios at
Esplanade Road. Double dash means no inundation. These values were extracted from a single point located
near the center of Esplanade Road (E1440470, N5003200).

 Sea-level rise (m) 20-year ARI 50-year ARI 100-year ARI 500-year ARI
 (2.01 m) Extreme (2.08 m) Extreme (2.14 m) Extreme (2.26 m) Extreme
 water level water level water level water level

 +0.0 -- -- -- --

 +0.3 -- -- -- --

 +0.5 -- -- -- --

 +0.7 -- -- -- --

 +0.9 -- -- -- 0.11

 +1.1 0.06 0.13 0.20 0.32

 +1.3 0.26 0.33 0.40 0.52

Waitaki District Coastal Hazards 19
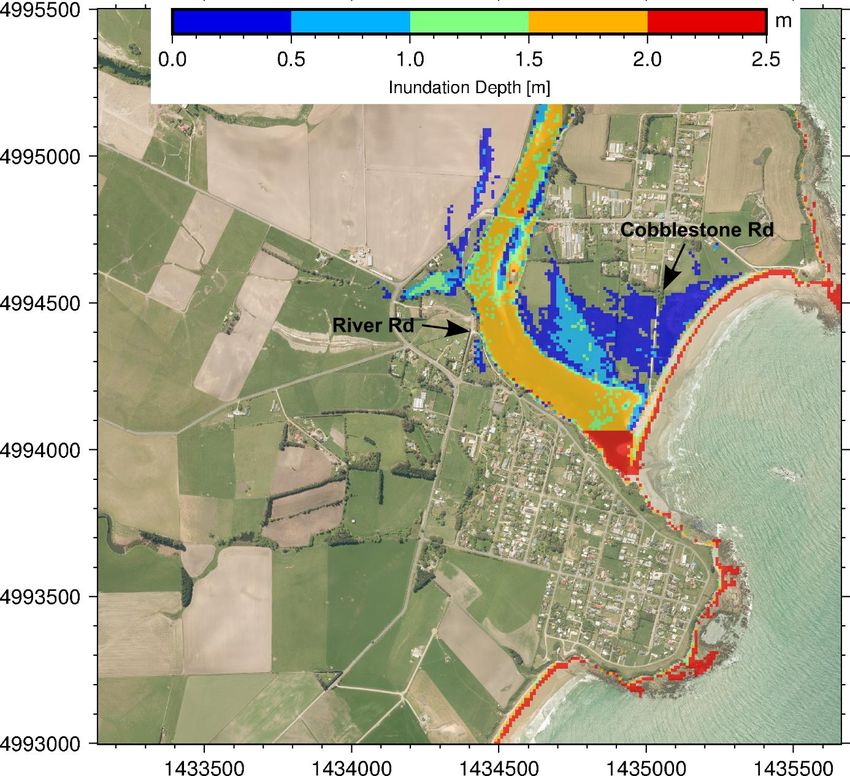
2.4.2 Kakanui
The inundation extent at Kakanui for the predicted 20-year ARI event closely matches the inundation
extent of the recent 2017 storm (Error! Reference source not found.Figure 2-4). In both cases, the
waves overtop the gravel barrier and gravel spit and significantly inundate the backshore, while
inundation flows will also enter via the Kakanui River mouth. Sea-level rise increases the inundation
extent, covering all the fields on the north side of the estuary and reaching the properties at the
south end of Cobblestone Road. On the south side of the estuary, inundation is predicted near the
bridge and in the area encircled by River Road (Figure 2-5).

Figure 2-4: Predicted inundation depth for the 100-year ARI storm and +0.0 m SLR for Kakanui.

20 Waitaki District Coastal Hazards
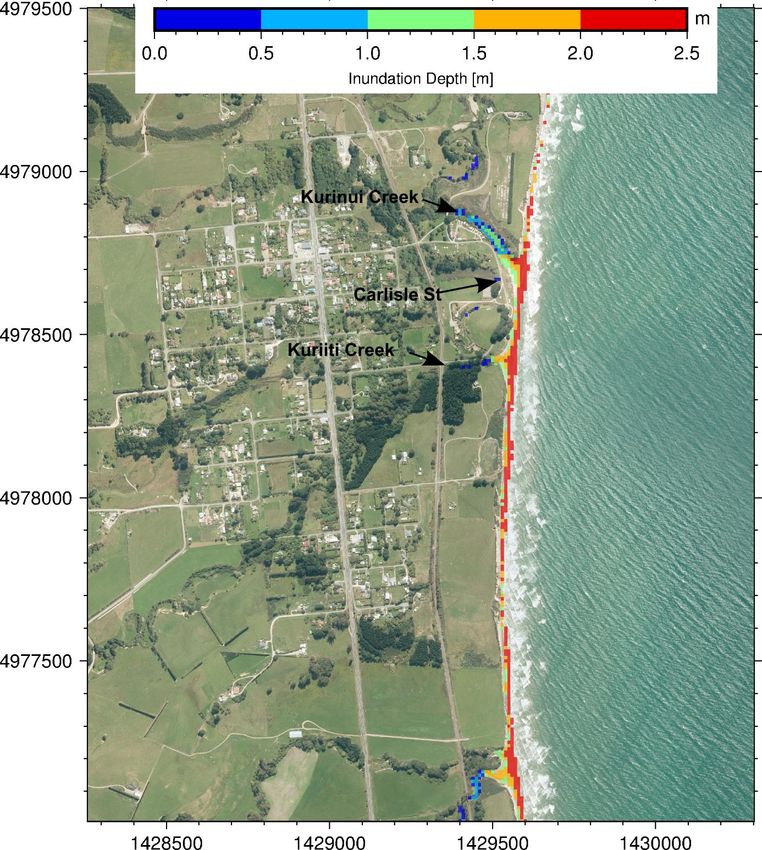
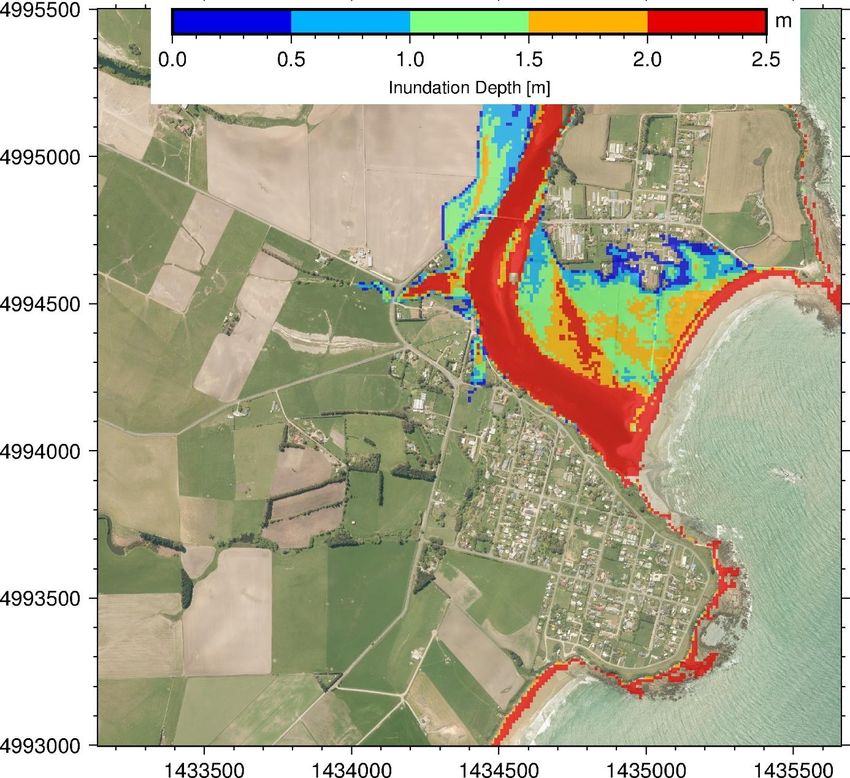
Figure 2-5: Predicted inundation depth for the 100-year ARI storm and +1.3 m SLR for Kakanui.

2.4.3 Hampden
The inundation extent in Hampden for a 100-year ARI storm at present day sea-level is limited to the
coastal fringe and areas adjacent to and 200 m upstream from the mouths of Kurinui Creek and
Kuriiti Creek (Figure 2-6). For the highest sea-level rise scenario (+1.3 m SLR) the inundation extends
further inland to Carlisle Street and covers the wetlands located on the landward side of Carlisle
Street and between the creek mouths (Figure 2-7). The intermediate sea-level rise scenarios are
included in supplementary material and show a gradual increase of wetland inundation between the
present day and the +1.3 m sea-level rise scenario.

Waitaki District Coastal Hazards 21
Figure 2-6: Inundation depth for the 100-year ARI storm and +0.0 m SLR for Hampden.

22 Waitaki District Coastal Hazards
Figure 2-7: Inundation depth for the 100-year ARI storm and +1.3 m SLR for Hampden.

2.4.4 Moeraki
The predicted inundation extent at Moeraki for a 100-year ARI storm under the present-day sea level
scenario is confined to the coastal fringe (Figure 2-8). The inundation extent for the highest sea-level
rise scenario (+ 1.3 m SLR) increases slightly to cover the area between the old and new jetty (Figure
2-9).

Waitaki District Coastal Hazards 23
Figure 2-8: Inundation depth for the 100-year ARI storm and +0.0 m SLR for Moeraki.

Figure 2-9: Inundation depth for the 100-year ARI storm and +1.3 m SLR for Moeraki.

2.4.5 Coastal inundation hazard zones
Coastal inundation hazard zones were developed using the predicted inundation depth for the 100-
year ARI extreme water level event and considering three sea-level rise scenarios:

24 Waitaki District Coastal Hazards
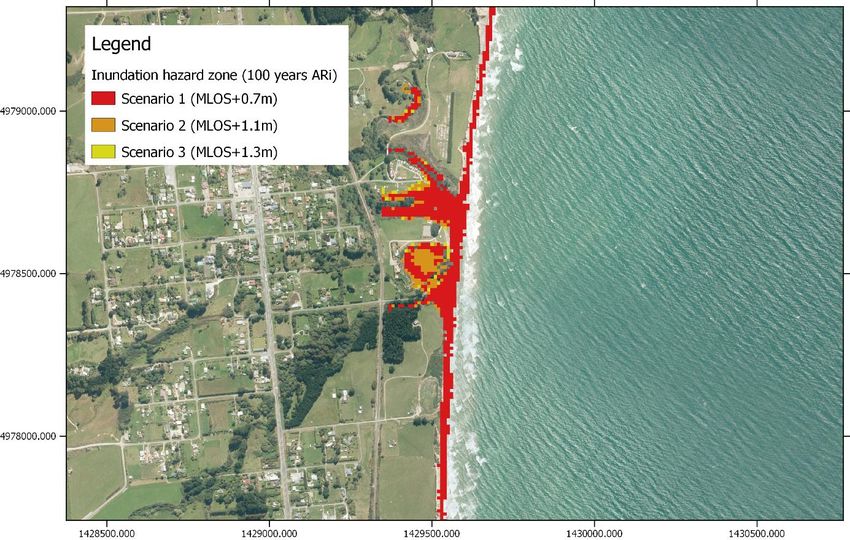
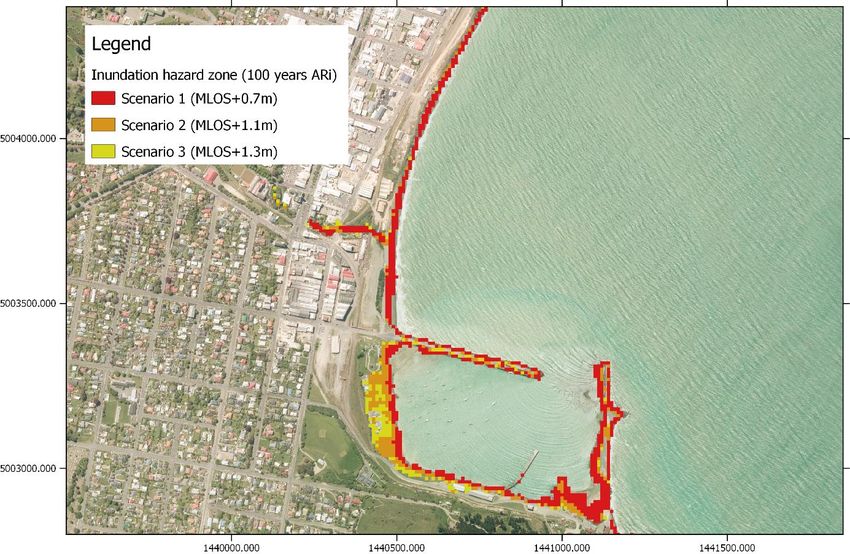
1. Sea-level rise of 0.7 m above present MLOS.

 2. Sea-level rise of 1.1 m above present MLOS.

 3. Sea-level rise of 1.3 m above present MLOS.

Note that the contributions to inundation from terrestrial (river and urban) and groundwater
flooding are not included.

The hazard zones for each scenario are presented in Figure 2-10 to Figure 2-13. Showing the varying
degree of area exposed to coastal inundation hazard when accounting for sea-level rise. Note only
red areas are flooded under scenario 1; red and orange areas are flooded under scenario 2; red,
orange and yellow areas are flooded under scenario 3; where only red is visible, all three zones
coincide.

For the Ministry for the Environment’s guidance to coastal hazards and climate change, Scenario 3
corresponds to the transitional response for development planning category A (Coastal subdivision,
greenfield developments and major new infrastructure) whereas Scenario 1 and 2 are part of the
information that can be used to define the transitional response for Category B and C of the
development planning (MfE 2017).

Figure 2-10: Coastal inundation hazard zone extents for Oamaru. Zones are based on the 100-year ARI
inundation event and a SLR of +0.7 m (Scenario 1), +1.1 m (Scenario 2) and +1.3 m (Scenario 3).

Waitaki District Coastal Hazards 25
Figure 2-11: Coastal inundation hazard zone extents for Kakanui.Zones are based on the 100-year ARI event
and a SLR of +0.7 m (Scenario 1), +1.1 m (Scenario 2) and +1.3 m (Scenario 3) above present day MLOS.

Figure 2-12: Coastal inundation hazard zone extents for Hampden. Zones are based on the 100-year ARI
event and a SLR of +0.7 m (Scenario 1), +1.1 m (Scenario 2) and +1.3 m (Scenario 3) above present day MLOS.

26 Waitaki District Coastal Hazards
Figure 2-13: Coastal inundation hazard zone extents for Moeraki. Zones are based on the 100-year ARI event
and a SLR of +0.7 m (Scenario 1), +1.1 m (Scenario 2) and +1.3 m (Scenario 3) above present day MLOS.

Waitaki District Coastal Hazards 27
3 Coastal erosion hazard
3.1 Introduction
The shore of Waitaki District is very diverse, alternating between cliffs and beaches. High cliffs with
hard bedrock dominate the landscape of Cape Wanbrow, Moeraki Point to Katiki Point, Shag Point,
and most of the coast south of the Shag River. Cliffs formed in softer, sedimentary material (loess,
gravel, or mudstone) occur between the Waitaki River mouth and Oamaru and along much of the
shore between Moeraki and Beach Road, south of Cape Wanbrow. Sand, gravel, or mixed-sand-and-
gravel beaches are present in most bays, often backed by low cliffs and sometimes fronted by reef
platforms. The main estuaries are fronted with gravel or sand spits.

Waitaki District has historically experienced dramatic shoreline retreat. This has been focussed in
several ‟hotspots”:

 ▪ Oamaru to the Waitaki River.

 ▪ Beach Road.

 ▪ Kakanui.

 ▪ Hampden.

 ▪ Katiki Beach.

The area north of Oamaru was reported to be eroding as early as the 1870s when port development
was begun at Oamaru (Carruther 1871). The reported erosion rates there have proven variable
(1.4 m/y – 0.1 m/y), averaging around 0.5 m/y (Gibb 1978). Over decadal time scales, the erosion
rates north of Oamaru vary alongshore and with time – in response to the occurrence of storms and
localised cliff collapse. Over longer time scales, the rates would appear to be more uniform, as
evident from the straight coastline.

South from Oamaru, the road to Kakanui (Beach Road) has experienced severe erosion events in
recent years, with a retreat of 12 m between 2006 and 2014 and the closure of a section of the
coastal road despite the protective armouring. Along this road, the erosion is cutting back into a low
alluvial backshore flat, composed of interbedded lenses of fine rounded gravel with shelly coarse
sand (estuarine/beach depositional-environment) and clay/silt lenses in places (swale deposits), with
a loess cap topped by soil/peat, sometimes with a thin sand-dune cap. The beach material is coarse
and of similar composition to the material within the cliff, suggesting that the beach is formed
exclusively of the eroded material.

At Kakanui, the gravel barrier at the river mouth has been retreating landward, with rates of 5 m/y
reported by Gibb (1978). This particularly high rate may be the result of both the
removal/destruction of the pier in the bay in the 1970s and particularly severe storms in 1974 (Pattle
1974). More recent rates of erosion have lowered to 1 m/y (Johnstone 2001).

North of Hampden, a calcareous muddy sandstone and greensand capped by clay-rich gravelly sand
is producing many slumps, with the top of the cliff retreating rapidly. The coast south of Hampden is
formed in the same lithology and is also eroding (as evident by the Moeraki boulders being left on
the beach) but no report has been made of the rates of erosion observed there.

28 Waitaki District Coastal Hazards
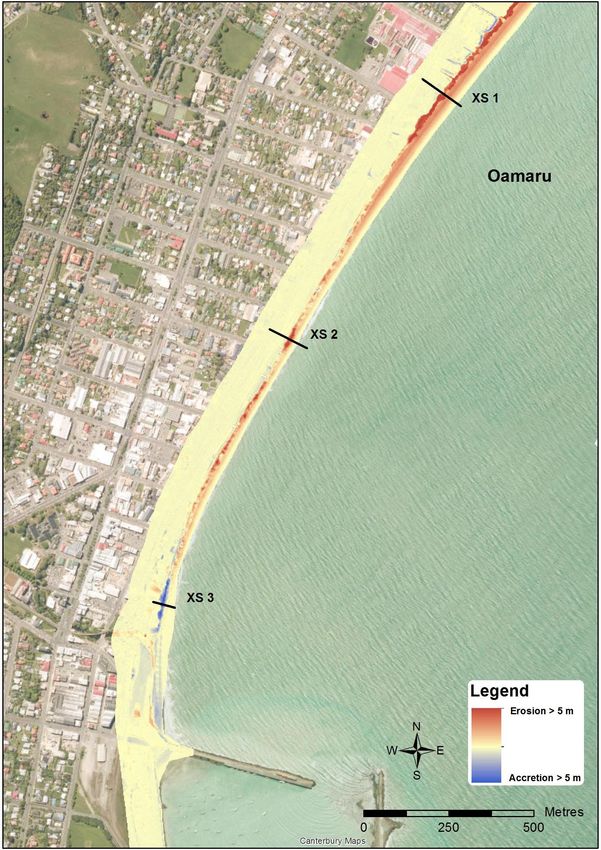
Katiki beach is showing multiple spans of erosion, several reaching close to State Highway 1 (SH1).
There, patches of riprap have been under construction (Figure 3-1). Older riprap was observed to be
in a poor state (i.e., settled in the beach or partially dismantled by waves with scattered rock visible
on the beach), implying that these are not performing as a long-term shoreline control.

Figure 3-1: Armouring of the backshore cliff on Katiki Road (7/12/2017).

The purpose of our study was to compile information on historical erosion rates and to develop
coastal erosion hazard zones, with emphasis on these hotspots.

3.2 Methodology
Although existing reports of erosion provide information on erosion rates in the Waitaki District, they
are insufficient for predicting future shoreline position and defining coastal erosion hazard zones.
The prediction of future shoreline position requires up-to-date and systematic analysis of the time-
trend in the shoreline position and a consistent analysis of the associated errors. The shoreline trend
analysis undertaken here is based solely on the shoreline positions detected from aerial and satellite
imagery. While this produced a consistent, uniform-alongshore dataset suitable to analyse shoreline
trend for the whole coast of Waitaki District it does not account for site specific backshore geologies.
Other estimates of shoreline evolution based on repeat LiDAR surveys, beach profiles and
morphological model simulation are also used here to validate and complement the information
calculated from the imagery-based shoreline detection.

3.2.1 Shoreline detection
Shoreline positions were manually extracted from historical aerial photography and satellite imagery
(Table 3-1). The features extracted were the vegetation line along beach environments (often
corresponds to the toe of dunes) or the cliff top along cliff-backed shores/beaches, following Boak
and Turner (2005). In areas where coastal defence structures are present (e.g., rock wall in Oamaru)
the rear-facing toe of the structure was used to define the shoreline.

Waitaki District Coastal Hazards 29
More sets of historical imagery were found apart from those listed in Table 3-1, but these other sets
were not used, either because the resolution of the imagery was too low or because distortion of the
image would not allow for suitable geo-referencing.

For each set of imagery, the shoreline position was digitized at a scale of 1:600, with points digitised
at a spacing that averaged 6.75 m (e.g., Figure 3-2). In each set of imagery, the error in the shoreline
position was calculated as the sum of a shoreline-digitising error (typically 3 pixels width) and a geo-
referencing error (measured as the offset of permanent features between georeferenced imagery
and the LINZ 2014 baseline imagery). The error for each shoreline position was variable, ranging from
1.2 m to 7 m. The historical shorelines were archived as ArcGIS shapefiles.

For the span of shore between Oamaru and the Waitaki River, a valuable early historical shoreline fix
from 1871 was also available. This was derived from photogrammetric analysis of cadastral maps (as
reported by Hicks and Bind 2013).
Table 3-1: Imagery data source used in the shoreline detection.

 Date Area Estimated error (m) Source

 1860s-1870s Waitaki River mouth to Oamaru 20 Cadastral map

 30 Aug 1955 Waitaki River mouth to Oamaru, Beach 6–8 Retrolens
 Road
 12-13 Mar 1979 Waitaki River mouth to Oamaru, Katiki 5–8 Retrolens
 Rd, Hampden

 Jan-Feb 2000 Waitaki River mouth to Oamaru 7–8 LINZ

 Jan-Feb 2006 All of Waitaki 2 LINZ

 02 Sep 2006 Moeraki, Hampden, Cape Wanbrow 7 DigitalGlobe

 04 Dec 2007 Shag Point, Stony Creek 8 DigitalGlobe
 19 Jan 2012 North Oamaru 6–8 DigitalGlobe

 24 Mar 2012 Waitaki River mouth to North Oamaru 6–8 DigitalGlobe
 03 Oct 2012 Beach Road, Kakanui, All Day Bay 6–8 DigitalGlobe

 28 Oct 2012 Pleasant River to Waianakarua River 7 DigitalGlobe
 26 Nov 2012 Te Hakapureirei Beach, Kakanui Point, 6–8 DigitalGlobe
 Oamaru Port, North Oamaru
 22 Mar 2013 Oamaru 7 DigitalGlobe

 Jan – Feb 2014 All of Waitaki 1 LINZ

 14 Mar 2015 North Oamaru to Waitaki River 7 DigitalGlobe

 09 Jun 2015 North Hampden 7 DigitalGlobe
 27 Feb 2016 North Hampden to Beach Road 6 DigitalGlobe
 20 Oct 2016 Beach Road to North Oamaru 6 DigitalGlobe

30 Waitaki District Coastal Hazards
Figure 3-2: Example of shoreline detection along Beach Road, south of Oamaru. Black line shows the
detected shoreline corresponding to the background image (Jan - 2014) [Image source: LINZ].

3.2.2 Shoreline analysis
The dataset of historical shoreline positions was used to calculate historical average retreat rates at
stations every 5 m along the entire Waitaki District coast (19,408 stations in total). Transects
perpendicular to the coast were constructed at each station using the AMBUR software (Jackson et
al. 2012) (Figure 3-3). Then, the intersections between the mapped shorelines and each of the
transects were captured and their offset from an arbitrary reference offshore was calculated (Figure
3-4).

Waitaki District Coastal Hazards 31
Figure 3-3: Example of transects perpendicular to the coast. The distance alongshore between each
transect is 5 m. [Image source: LINZ].

Figure 3-4: Example of intersection point between the transects and detected shorelines. The coloured
points represent the intersection between shorelines and the transects. [Image source: LINZ].

32 Waitaki District Coastal Hazards
For each of the transects, a weighted least square fit was used to calculate a linear time-trend in
shoreline position, using the inverse of the shoreline position error estimate as the weighting factor
(e.g., Figure 3-5). The trend rate and its standard error contained large alongshore variability which
was smoothed using a moving-average filter with a width of 30 points along sections of uniform
morphology (i.e., 15 points covering 75 m either side of the target point were averaged). The filtered
shoreline trend and its standard error were recorded to be used in defining the coastal erosion
hazard zones. In addition, for each transect, the residuals of the trend (distance between the trend
and historical shoreline position) were also calculated for use in the coastal hazard zone calculations.

Figure 3-5: Example of shoreline trend analysis. The black line is the linear trend. The grey area represents
the 95th percentile confidence interval around where the true trend-line could be. The black dots are the
shoreline distance from the offshore edge of the transect, with associated error bars.

3.2.3 LiDAR volume change
For a number of areas along the coast, a recent LiDAR survey from 2016 existed in addition to an
older LiDAR survey from 2004, which covered the entire Otago shoreline. The data of both surveys
were used to create Digital Elevation Models (DEMs) with a ground resolution of 2 m. These DEMs
were analysed in areas of particular interest (Oamaru township, Kakanui and Katiki Beach). This
provided elevation changes to show a 2-dimensional overview of areas of erosion and accretion
between the 2004 and 2016 surveys.

Results of the LiDAR volume change analysis are presented in section 3.3.3.

3.2.4 Beach profiles
Profile survey data for 12 sites north of Oamaru were provided by Otago Regional Council. Repeat
surveys were available for some of these profiles which enabled independent analysis of the top-of-
cliff retreat rates. The data from these profiles were also valuable for setting-up the shoreline
simulation model. However, the limited number of repeat surveys meant that the profiles could not
be used to assess the cliff erosion rate or the modes of erosion.

The surveyed beach profiles for Oamaru central are shown in Figure 3-6, with the top of cliff
illustrated to show measured retreat rates.

Waitaki District Coastal Hazards 33
You can also read