THE LABOR FORCE
  PARTICIPATION RATE
      SINCE 2007:
CAUSES AND POLICY IMPLICATIONS

           July 2014
←
→
Page content transcription
If your browser does not render page correctly, please read the page content below

THE LABOR FORCE
PARTICIPATION RATE
SINCE 2007:
CAUSES AND POLICY IMPLICATIONS
July 2014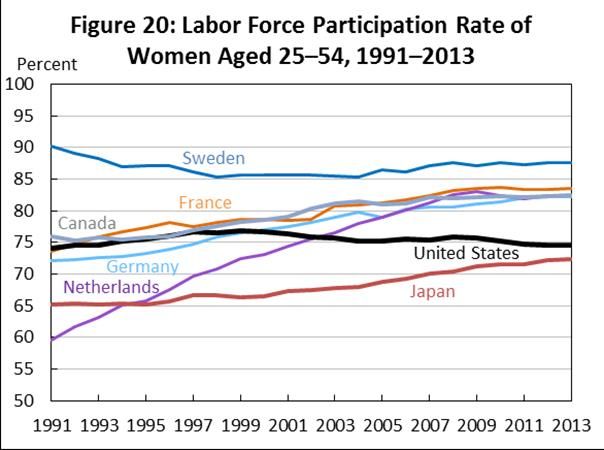
Introduction and Executive Summary

In 2008, the U.S. economy collided with two historic forces. The first force was the Great
Recession, the most severe economic crisis in a generation. While the economy has recovered
considerably over the last five years, there is little doubt that more work remains to address some
of the challenges left in the wake of the Great Recession. The turmoil of 2008 inflicted
tremendous pain on millions of families, overshadowing the fact that 2008 also marked a unique
milestone in U.S. economic history. That year, the first baby boomers (those born in 1946) turned
62 and became eligible for Social Security early retirement benefits. This second force—the
demographic inflection point stemming from the retirement of the baby boomers—was felt far
less acutely than the Great Recession, but will continue to have a profound influence on the
economy for years to come, well after the business cycle recovery from the Great Recession is
considered complete.

In addition to these inflection points in 2008, a number of longer-term trends had been playing
out in the U.S. labor force prior to 2008—and have continued since then. These include the nearly
continuous decline in labor force participation rates for prime-age males (i.e., age 25-54) since
the mid-1950s and the dramatic rise in labor force participation rates for prime-age females in
the 1970s and 1980s followed by a stalling and slight trend decline after the late 1990s.

Many dimensions of the economy’s performance over the last several years can only be properly
evaluated when the effects of the Great Recession, the retirement boom, and the longer-term
labor force trends are taken into account. One of the clearest illustrations of this point is the labor
force participation rate, which represents the fraction of the adult population either working or
looking for work. Changes in labor force participation reflect not just current economic conditions
like job availability and workers’ assessments of job-finding prospects, but also more structural
factors like the age distribution of the population and other aspects of society that impact
people’s decisions to participate in the labor force.

This report analyzes the evolution of the labor force participation rate since late 2007 and
attempts to quantify the effects of these various forces. We examine the period since 2007 to
focus on how each of the two largest forces, the Great Recession and the retirement of the baby
boomers, has impacted labor force participation in recent years. We find that the combination
of demographic changes and the drop in labor force participation that would have been expected
based on historical business cycle patterns explain most but not all of the recent drop in labor
force participation. This implies that other factors, likely including both a continuation of pre-
existing trends in labor force participation by certain groups and the unique effects of the Great
Recession have also been important. This report also discusses the labor force participation rates
for different groups, discusses potential future scenarios for the participation rate, and lays out
policies that would help to boost participation in the years to come.

                                                  2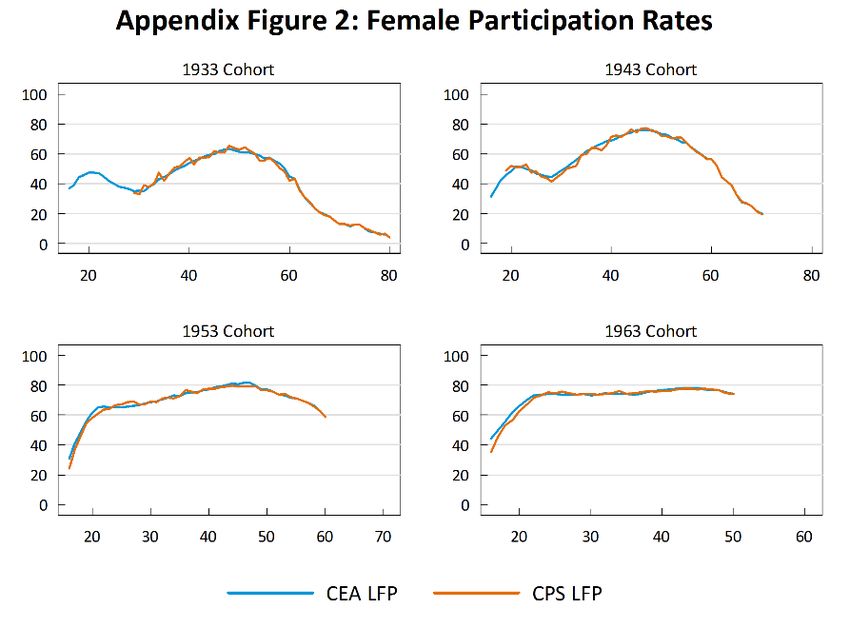
Summary of the Main Results
Since the final quarter of 2007, the labor force participation rate has fallen from 65.9 percent to
62.8 percent in the second quarter of 2014, a decline of 3.1 percentage points. In this report, the
Council of Economic Advisers estimates that this 3.1 percentage point decline can be attributed
to three main sources:
About half of the decline (1.6 percentage point) is due to the aging of the population.
Because older individuals participate in the labor force at lower rates than younger
workers, the aging of the population exerts downward pressure on the overall labor force
participation rate. While older workers today are participating in the labor force at higher
rates than older workers of previous generations, there is still a very large drop-off in
participation when workers enter their early 60s.
About a sixth of the decline in the overall participation rate (0.5 percentage point) is a cyclical
decline in line with historical patterns in previous recessions.
While the unemployment rate has come down from a peak of 10.0 percent in October
2009 to 6.1 percent in June 2014, it has remained elevated for the last several years.
Historically, elevation in the unemployment rate is associated with a decline in labor force
participation, as potential workers may decide to defer looking for a job until the economy
improves. A portion of the most recent decline in the participation rate reflects this
historical pattern, which this report refers to as the “cyclical” effect.
About a third of the decline (1.0 percentage point) arises from other factors, which may include
trends that pre-date the Great Recession and consequences of the unique severity of the Great
Recession.
In particular the two elements of this “residual” not explained by the standard factors are:
The fact that participation rates conditional on age were declining for many groups in
the run-up to 2008, including for prime-age men from the 1950s and for prime-age
women from the late 1990s, may also have contributed to the decline in participation.
This would have been expected to result in a decline in the participation rate above
and beyond the pure aging effect even in the absence of a recession. Note, these
effects were partly offset by other pre-existing trends, like a rise in the participation
rate for older workers.
The severity of the Great Recession, which has resulted in an unusual pattern of a very
large share of long-term unemployed relative to total unemployment, may have
lowered the participation rate more than would have been expected through normal
channels. In fact, we find that a declining participation rate is historically correlated
with the elevation of long-term unemployment, suggesting that both issues have a
common cause or cause each other.
3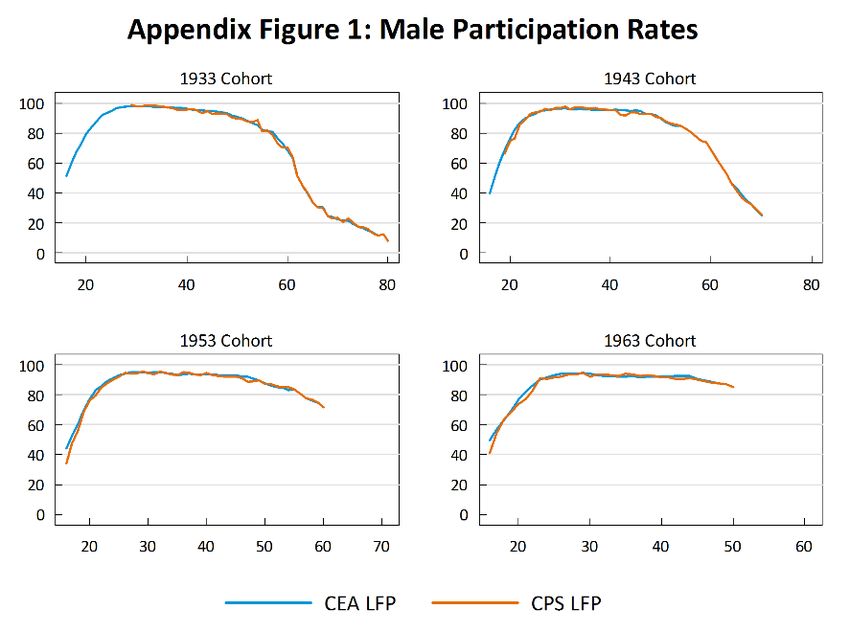
In the last few years the aging of the population has been an increasingly important source of
the decline in the participation rate. From the beginning of 2011 to the second quarter of 2014,
the participation rate fell by 1.4 percentage points. Around 70 percent of that decline (1.0
percentage point) can be directly attributed to the aging of the population and increased
retirements.

Overview of the Report
Section I of this report provides historical context with a broad look at the participation rate since
1948. Then Section II surveys the literature on the participation rate in the Great Recession and
subsequent recovery. Most researchers have found that long-term trends including the aging of
the population explain a majority of the recent decline in participation, and that cyclical effects
explain about a quarter of the decline. Section III explains CEA’s decomposition of movements in
the participation rate into the aging of the population, the business cycle, and other factors.

Section IV takes a deeper look at the trends in participation for several demographic groups:
young men and women, older workers, prime-age women, prime-age men, and black men.
Participation among young men and women has decreased steadily over the past decade, largely
reflecting decreased participation among students and increased enrollment. Meanwhile, older
workers have been participating at increasing rates over the last few decades. Black male
participation has been on a troubling downward trend since the mid-1970s, falling about 10
percentage points over that time, while a similar, albeit slightly more muted decline has been
seen among all men.

Section V lays out potential scenarios for the participation rate going forward assuming no policy
changes are made. The aging of the population will likely continue to exert downward pressure
on the overall participation rate. At the same time, continued recovery of the economy from the
Great Recession would put upward pressure on participation. Assuming no change in policy we
estimate that the recovery in the participation rate from cyclical factors will be roughly offset by
the aging effect, leading to a mostly unchanged participation rate on net. However, it is difficult
to know how much recovery in the residual will occur as the economy improves, and participation
may rise as those additional workers are pulled back into the labor force. Once the cyclical
rebound fades, however, assuming no policy or other structural changes, the participation rate
will resume its downward trend driven mainly by aging. This discussion lays out a baseline for
what might happen in the absence of policy steps to promote participation in the workforce.

Section VI lays out policy measures that can boost participation and in so doing, expand the
economy’s long-run growth potential. First, immigration reform would raise the size of the labor
force as well as boost participation rates and could largely offset further declines in participation
due to aging. Second, adopting family-friendly workplace policies can boost female labor force
participation. For instance, many states are currently considering adopting paid leave policies,
and evidence suggests that the availability of paid leave and other family-friendly policies could
increase the participation of women by about 7 percentage points (Blau and Kahn, 2013). Third,
the long-run decline in participation among men, especially minority men, is unsustainable, and

                                                  4
the Obama Administration is aggressively pursuing policies aimed at stemming these declines.
Finally, in the near-term, the recovery from the Great Recession remains incomplete, and steps
to strengthen the economy and encourage best practices for hiring the long-term unemployed
can still make a major difference. These types of steps are critical for combating the portion of
the decline in the participation rate that reflects the unique severity of the Great Recession and
the major challenges left in its wake.
5I. The Labor Force Participation Rate Over the Past 50 Years
The labor force participation rate is the share of the civilian population over age 15 that is either
working or searching for work (i.e., unemployed). Increases in the participation rate reflect
individuals joining the workforce, either by looking for a job or taking one, while decreases in the
participation rate can reflect an increase in retirements, people taking time out of the labor force
for a variety of reasons (e.g., to go to school, care for a young child, etc.), or unemployed
individuals who become discouraged and stop looking for a job. Decreased labor force
participation may or may not be desirable, depending on the reason. Achieving a labor force
participation rate of 100 percent is not the goal, since many people who leave the labor force are
engaged in important nonmarket activities, such as schooling, raising children, or retirement.
However, discouraged workers dropping out of the labor force would be a cause for concern and
would motivate enacting policies to return these workers to the labor force. In the long run, the
growth rate of the labor force underpins the growth rate of employment, which, along with
productivity growth, is a key determinant of the growth rate of potential GDP.
Figure 1: Total Civilian Labor Force Participation Rate
Percent
70
2014:Q2
68
66
64
62
60
58
1948 1958 1968 1978 1988 1998 2008
The labor force participation rate in the United States since 1948 has three key features, as shown
in Figure 1. The first is the striking inverted U-shaped trend in the participation rate: while just
under 59 percent of civilian adults were in the labor force in 1963, this rose to approximately 66
percent in 1990 and peaked at 67 percent in 2000, but since 2000 the participation rate has
generally fallen. As discussed in more detail below, this inverted U-shaped pattern can be more
fully understood by looking at the separate trends for men and women. In general, the left (rising)
side of the inverted U-shape reflects a historic surge of women into the labor force in the second
half of the twentieth century, as well as the baby boomers reaching their prime working years.
The right (falling) side reflects the plateauing of female participation, combined with the
retirement of the baby-boom generation and the massive shock of the Great Recession.
6The second key feature of the participation rate visible in Figure 1 is the procyclical pattern. In
other words, participation rises during an expansion and falls during a recession. For example,
these cyclical patterns, which occur with a lag, are clearly visible in the 1990 recession. During
the strong labor force growth of the 1970s and 1980s, the procyclical movements do not produce
distinct declines in the participation rate, but instead produce temporary plateaus, as the cyclical
decline was mitigated by an upward underlying trend that resumed after the recovery was under
way. Similarly, because the participation rate was on a downward trajectory during the first half
of the 2000s, the cyclical decline during and after the 2007 recession combined with the
underlying demographic trend to produce a particularly sharp drop.
The third feature of the participation rate visible in Figure 1 is that the series exhibits considerable
volatility around the long-term trends and cyclical movements. For example, during the recovery
from the 1990 recession, the participation rate rose more than half a percentage point in the first
half of 1992, only to subsequently fall by nearly the same amount. Much of this volatility stems
from factors like the normal statistical noise that exists in any data series based on a limited
sample and seasonally adjusted.
As noted earlier, the inverted U-shaped trend in the overall participation rate can be better
understood by considering the separate trends for male and female labor force participation.
The male labor force participation rate has been falling since data collection began in 1948, as
shown in Figure 2. Some of this decline reflects the increasing longevity of men over time and the
resulting lengthening of their retirement. However, the rate of participation among prime-age
men has also fallen over this time period, although to a lesser extent.
In contrast, women’s labor force participation rose through much of that period, with a surge
from the mid-1960s through the 1990s. This profound shift in America’s economy and society
reflected changes in social norms and access to education, including the legalization of oral
contraceptives in the early 1960s, reductions in discrimination through legislation like Title VII of
the Equal Rights Act and Title IX of the Educational Amendments to the Equal Rights Act, and
developments in labor-saving household technology. The rise in women’s labor force
participation exceeds the decline in men’s participation so that overall adult participation
increased during this interval.
7Figure 2: Male and Female Labor Force
Percent Participation Rates
90
2014:Q2
80
Men
70
60
Women
50
40
30
1948 1958 1968 1978 1988 1998 2008
Since 2000, the participation rates of men and women have both declined, although the rate of
decline has been slower for women than for men. Participation rates have long been influenced
by an aging population, however its impact became more pronounced starting in 2008 when the
first cohort of baby boomers (those born in 1946) turned 62 and became eligible for early Social
Security benefits. Starting in 2008, the share of the working age population over age 55 began to
rise rapidly (Figure 3). Also, while the share of the population over age 65 has risen gradually
since 1960 due to increased longevity, the increase accelerated in 2008 and is now rising faster
than at any point since 1960. This sharp and predictable retirement of a large cohort coincided
with the start of the Great Recession, making it difficult to separate the effects of the economy
and normal demographic patterns on participation. Even though these baby boomers are more
likely to work at older ages than their predecessors, the employment rates at older ages are still
much lower than for younger workers.
Figure 3: Share of the Adult Population Over
Percent Age 55
40
2013
35
30
55+
25
20
65+
15
10
1960 1970 1980 1990 2000 2010
8II. Literature on the Labor Force Participation Rate in the Great
Recession and Subsequent Recovery
There has been considerable research on the decline in the participation rate in recent years.
Table 1 lists the findings of several recent studies of the participation rate, showing how much of
the decline each study attributes to long-term trends and cyclical factors. The time periods
covered by each of these analyses vary, so the results are not always directly comparable—
although we provide CEA’s estimates to match the time periods of each of the studies. While
some studies estimate either the trend or cycle component and then infer the other component
indirectly, this table only shows direct estimates of these components.
Despite differences in data and methods, several broad conclusions are common across the
literature. Taken together, the aging of the population and the business cycle account for the
vast majority of the decline in the participation rate since 2007 in all of the studies. While there
are some differences in the share attributed to the aging of the population, the median estimate
is that half of the decline is due to aging.
Table 1: Comparison of Participation Rate Estimates
CEA Estimated Shares of Total
Shares of the Total Decline
Time Period Decline Over Same Time Period
Trend Cycle Trend Cycle
CEA (2014) 2007:Q4 - 2014:Q2 52% 16% -- --
Beginning in 2007
Erceg & Levin (2013) 2007 - 2012 25% 60% 55% 35%
Shierholz (2012) 2007 - 2011 30% -- 50% 52%
Van Zandweghe (2012) 2007 - 2011 42% 58% 50% 52%
CBO (2014) 2007:Q4 - 2013:Q4 50% 33% 49% 20%
Fallick & Pingle (2013) 2007:Q4 - 2013:Q2 75% 16% 55% 29%
Aaronson et al. (2006) 2007 - 2013 80% -- 49% 20%
Kudlyak (2013) 2007 - 2012 80% 20% 55% 35%
Other Time Periods
Aaronson, Davis & Hu (2012) 2000 - 2011 40% -- 46% 38%
Fujita (2014) 2000:Q1 - 2013:Q4 65% 30% 42% 16%
CEA (2014) 2011:Q1 - 2014:Q2 69% -34% -- --
Note: Thi s ta bl e onl y i ncl udes di rect es ti ma tes of the trend a nd cycl i ca l components . CEA-equi va l ent decompos i ti ons
for ti me peri ods l i s ted on a n a nnua l ba s i s a re computed from Q4 to Q4 of the corres pondi ng yea rs .
CEA estimates that the long-term trend of an aging population explains just over half of the
decline in participation since the end of 2007, putting CEA’s estimate in the middle of the range
of estimates. Across most of these studies, the effects of an aging population typically account
for a third to half of the decline, and the other longer-term trends account for a varying
proportion of the decline. The estimates of the trend component from Aaronson et al. (2006),
Kudlyak (2013), and Fallick and Pingle (2013) also include notable effects from other long-term
trends, and so are correspondingly about 25 to 30 percentage points larger than estimates of the
aging effects alone.
9In analyzing the effects of the business cycle on participation, the literature is split between a
group of analyses that attribute about 25 percent of the decline to the Great Recession and its
aftermath, and a few studies that estimate the cyclical component to be at least a majority of the
decline. Each paper takes a different approach to estimating the cyclical portion. Both CEA’s
estimate and Van Zandweghe (2012) are based on time series evidence but arrive at different
conclusions.
While some studies recognize an unexplained or residual component of the decline in
participation, others hold that the full decline in participation can be explained by a combination
of longer-term trends and cyclical effects. CEA estimates that about one quarter of the decline is
not explained by either trend or historical estimates of cyclical movements, but there is some
evidence that this residual may be related to the current recession through its unusually high
long-term unemployment rate. The Congressional Budget Office (CBO) estimates a slightly
smaller residual component and suggests that it may be due to elevated Social Security Disability
Insurance (SSDI) rolls. Other possible explanations for the residual component include increased
enrollment in school (Fujita 2014).
10III. Explaining the Decline in the Participation Rate Since 2007
CEA’s analysis of the decline in the labor force participation rate since the end of 2007 is based
on a variety of methodologies, including direct measurement of the aging trend, panel data, and
time series analysis—all of which produce generally similar results in disentangling three effects:
the pure aging effect, the standard cyclical effect, and a residual which picks up a combination of
pre-existing trends unrelated to aging and factors unique to the Great Recession.
The Aging of the Workforce
The largest single factor in the decline of the participation rate since the end of 2007 is the aging
of the workforce—something that was predicted well before the Great Recession. Every year
since 2000, the Economic Report of the President has mentioned the post-2008 decline in the
labor force participation rate as a factor slowing growth of potential real GDP. In 2004, the first
year in which their ten-year forecast included the 2007-2013 period, CBO predicted that
participation would fall by 1 percentage point between 2007 and 2013 due to aging. Also, in 2006
researchers from the Federal Reserve predicted, based solely on aging and other trends, that the
participation rate would fall to 63.3 percent in 2013—the exact value to which it fell (Aaronson
et al. 2006).
Labor Force Participation over the Life Cycle
Labor force participation varies considerably over the course of a person’s life, rising rapidly at
early ages before flattening out through the working years and falling as workers retire. In order
to understand how an aging population will affect overall labor force participation, it is helpful to
look at how the participation rates of different age groups have changed over time. Figures 4 and
5 show the participation rates for men and women over the course of their lives for various birth
cohorts. For both men and women, participation rises rapidly throughout the 20s as individuals
leave full-time schooling and enter the workforce, then flattens out at a high level during prime
working-age years, before falling to low levels of participation again as individuals enter their 60s.
In the decade leading up to age 65, participation for both men and women falls by at least 40
percentage points, and continues to fall by nearly 20 percentage points over the subsequent
decade of the life cycle.
11Figure 4: Male Labor Force Participation by Age &
Percent Birth Year
100
Birth Year
90
1933
80 1943
70 1953
1963
60
50
40
30
20
10
0
21 26 31 36 41 46 51 56 61 66 71 76
Figure 5: Female Labor Force Participation
Percent by Age & Birth Year
100
90 Birth Year
80 1933
1943
70 1953
60 1963
50
40
30
20
10
0
21 26 31 36 41 46 51 56 61 66 71 76
The pattern of participation among prime-age women has shifted dramatically over the past half
century. Women born in 1933 decreased their participation over the course of their 20s—the
ages of maternity and childrearing--before slowly increasing their participation in their 30s and
40s. The cohort of women born ten years later, in 1943, had much the same pattern of decreasing
and increasing participation, but over the course of their lifetime participated at a rate about five
to ten percentage points higher. In subsequent cohorts, women participated at much higher rates
in their 20s and 30s, while participation rose only slightly in older years. Most of this increase is
likely due to women in more recent cohorts returning to the labor force more quickly after
bearing children than previous generations.
12Male participation has shown less variation from cohort to cohort, but there are two notable
changes. The first is that among prime working-age men, each successive cohort has participated
slightly less on average, demonstrating that the long-run decline in male participation has been
partially driven by the behavior of prime-age men. The second is that more recent cohorts of
older men have increased their participation. Men born in 1943 participated at age 65 at a rate
about five to ten percentage points higher than men born in 1933. It is also worth noting that
men born in 1943 had a life expectancy roughly 5 years longer than those born in 1933. Despite
this increase in participation relative to previous cohorts, there is still a very large drop off in
participation at older ages, and so an aging population will, all else equal, reduce the economy-
wide labor force participation rate. The substantial aging of the population that has begun to
occur and will continue to unfold for years to come is discussed in the next subsection.
Aging and the Retirement of the Baby Boomers
In the immediate aftermath of World War II, the U.S. birth rate spiked, as couples who were
reunited following the war were able to settle down and have children, while others took
advantage of the relative sense of peace and prosperity that emerged in the 1950s and 1960s to
expand their families (Figure 6). The birth rate remained elevated into the mid-1960s before
dropping sharply, and it has not since returned to anywhere close to what it was during the baby
boom. Consequently, the baby boomers, who are currently between the ages of 49 and 67, are
more numerous than any previous or subsequent cohort of Americans.
Figure 6: U.S. Birth Rate
Births per thousand people
32
2013
28
24
20
16
12
1910 1930 1950 1970 1990 2010
As Figure 7 shows, the distribution of the population by age becomes more heavily tilted toward
older ages as the baby boomers age. The first baby boomers reached retirement age in 2008, and
over the next decade and a half, increasingly-large cohorts of baby boomers will follow suit. In
2009, 16 percent of the adult population was at or above the retirement age; the Social Security
Administration projects this fraction will grow to 25 percent by 2029, increasing by half over two
decades.
13Figure 7: U.S. Population Distribution By Age
Millions
2019 Population Projection 2013 Population
5
Estimates
4
3
Baby Boomers
2
1
0
20 25 30 35 40 45 50 55 60 65 70
The retirement of the baby boom generation is particularly consequential for the participation
rate, because the labor force participation rate falls sharply as workers grow older. Both men and
women decrease their participation by at least 40 percentage points in the decade leading up to
age 65, and participate at even lower rates afterwards. Because older individuals participate in
the labor force at lower rates than other age groups, the shift in the age structure from aging
baby boomers is responsible for a substantial portion of the decline in the participation rate.
Although the participation rate of those over age 60 has risen in recent years and the
participation of older baby boomers is continuing to rise relative to previous cohorts, this effect
is relatively small compared to the typical decline as people age and so does little to mitigate the
substantial negative effect that aging of the population has on the overall participation rate. The
participation rate for the male cohort born in 1943 fell more than 40 percentage points as they
aged from 55 to 65, even though their participation was about 10 percentage points higher than
those in the previous cohort at age 65. The pattern for women is largely similar, as the increase
in participation at older ages from cohort-to-cohort is much smaller than the drop in participation
over the lifecycle.
Modeling the Effect of Aging on the Participation Rate
Two longer-term trends contribute to movements in the participation rate: first, the effect of an
aging population, and second, ongoing trends in participation within age groups that are
unrelated to aging. The magnitude of the trend can be estimated in several ways, each of which
captures long-term movements in participation differently, with some capturing only the effects
of aging and others including both aging and non-aging-related trends. We employ three
different methods of modeling the participation rate trend and find that they provide similar
estimates, with approximately half of the decline in participation since 2007 attributable to aging
and a negligible fraction of the decline attributable to trends within age groups.
14Projecting Forward the 2007 Participation Rate Profile With Changing Age Structure
A straightforward way to estimate the effect of the aging of the population on labor force
participation is to hold constant the participation rates by age in a given year, and observe how
the participation rate evolves if only the age distribution of the population is allowed to vary. For
example, this allows computing the effect of an increasing share of 65 year olds, under the
assumption that 65 year olds retire in the future at the same rate that they did in 2007. This
approach is implemented using the age-based participation profile as of 2007. The advantage of
fixing participation rates in 2007 is that it predated the recession, and thus avoids confounding
the analysis by introducing the further effect of a sharp cyclical movement. However, the results
are essentially the same if we instead hold the current (2014) participation rates by age group
constant, as discussed later.
To estimate the effect of aging, we constructed data on participation rates for single-year age
categories by gender, combining unpublished participation rates for those over 55 with
participation for single-year age categories below age 55 obtained by interpolating from the
published rates for ten-year age categories. For individuals above age 55, data on annual
participation by single-year age category were provided to us by the Bureau of Labor Statistics
(BLS), using unperturbed data from the Current Population Survey (CPS). These data are less noisy
than estimates from the CPS microdata but are not very different on average (Appendix Figures
1 and 2).
Figure 8 shows the counterfactual participation rate between 2007 and 2014, under the
assumption that only the age distribution of the population changed over this time. Over this
period, the counterfactual participation rate fell by 1.6 percentage points, accounting for slightly
more than half of the actual observed decline. 1 Thus, the aging of the population alone can
explain about half the decline in the participation rate since late 2007.
1
Fixing the participation rate in 2013 and projecting it backwards using the actual demographic data yields a very
similar estimate that 1.4 percentage point of the decline in the participation rate was due to aging. This estimate is
slightly lower than the estimate using 2007 data because the Great Recession narrowed the gap in participation
between prime-age and older workers.
15Figure 8: Effect of Aging on Labor Force Participation
Percent
67
Actual
66
Aging Effects
65
64
63
62
2007 2008 2009 2010 2011 2012 2013 2014
The aging portion of the trend has been more rapidly declining since 2011. Between the end of
2007 and the end of 2010, the counterfactual participation rate fell only 0.6 percentage point,
but it subsequently fell 1.0 percentage points from the beginning of 2011 through the first
quarter of 2014—explaining the majority of the reduction in participation over that period. In
2011, the first baby boomers reached age 65, which is the point of steepest decline in
participation over the lifecycle. Baby boomers will continue to turn 65 until 2029 and the aging
portion of the trend in the participation rate will correspondingly continue to decline, possibly at
an even more rapid pace in the coming years.
Casselman (2014) conducts a similar calculation using the publicly available data on participation
published by BLS and concludes that aging is responsible for about a third of the decline.
However, the seasonally adjusted statistics published by BLS categorize all adults over 55 into the
same group, which obscures significant differences in participation at older ages. Participation
falls by about 40 percentage points between age 55 and 65, so compositional shifts within the
55+ age group can have a large effect on the overall participation rate; using the coarse age-
bracket data will not capture this effect. In contrast, the analysis here enables an estimate of a
more detailed, year-by-year aging effect.
Time Series Trend
Econometric analysis of time series data can also be used to estimate the long-run trend in the
participation rate. Unlike the previous approach that was designed to isolate the effect of
population aging, this approach identifies a single unified trend in the participation time series
and so does not separate aging and non-aging forces driving the trend. Although the theory of
time series trend estimation is well-developed, this application is challenging because the deep
recession and prolonged recovery serve to conflate the cyclical and trend behavior beginning in
late 2007. For this reason, the time series trend used here is estimated using a standard time
series smoother (biweighted kernel), modified to be cyclically adjusted using a partially linear
semiparametric model; more detail is given in Appendix A. The resulting estimate shows that the
16trend component of the participation rate peaked in the late 1990s, and has been falling since,
declining at a more rapid rate in recent years (Appendix Figure 3). According to the time series
estimate of the trend, the long-run trend in the participation time series fell by 1.6 percentage
points between the end of 2007 and the second quarter of 2014.
The 1.6 percentage point decline in the time series trend happens to equal the estimated decline
in the previous section that focused on the aging-based trend. Since the time series model
includes trends within age groups while the aging-based trend does not, by itself this estimate
would suggest that non-aging trends within age groups have had little net effect on participation.
However, in the presence of a break in the series—which we know occurred around 2008 with
the retirement boom—time series methods will tend to understate the trend. As a result, the
residual between the time series and aging methods will tend to understate the consequences
of pre-2008 trends unrelated to aging.
Structural Micro-Data Models of Participation
Another approach to estimating the trend in participation involves estimating a structural model
of participation decisions using individual-level data. This approach was originally developed by
Aaronson et al. (2006), who extend the model with age and cohort effects to include covariates
representing human capital, the ability to finance nonparticipation spells, and family structure.
By including a measure of life expectancy, for example, the authors control for longer lives
requiring greater retirement savings, which in turn would increase participation. In contrast to
the previous two methods, this approach attempts to ascertain the separate effect of various
factors driving differences in participation across individuals and across cohorts. Aaronson et al.’s
projections, which assumed full employment, were consistent with a decline in the participation
rate from 2007:Q4 through 2014:Q2 of 2.5 percentage points. If this is correct, then most of the
decline in participation since the end of 2007 would have been foreseeable—and in fact was
almost precisely foreseen—based on pre-existing trends in aging and other demographic factors.
Fallick and Pingle (2007) propose a more detailed structural model of participation. They use
several covariates to estimate the trend in participation, including educational attainment, life
expectancy, marriage and fertility variables for women, minimum wages and school enrollment
measures for teenagers, and Social Security rule changes. In a recent update of their model using
data collected in the years following publication, they estimate that the participation rate trend
decreased 2.0 percentage points between the end of 2007 and the second quarter of 2014. Fallick
and Pingle’s model includes some portion of what we estimate as cyclical rather than trend
components, however, because several of the covariates they include exhibit cyclical variation
(in particular the return to education and the level of private wealth). To the extent that their
estimated trend component is based on variables that fluctuate cyclically, their estimate arguably
overstates the portion of the decline attributable to long-term trends.
17Standard Business Cycle Effects
The decline in the labor force participation rate since 2007 is partially due to the standard effects
associated with an economy operating below its full potential. However, because the shock of
the Great Recession was so large, the standard cyclical effects on participation were also quite
large relative to previous cycles. When the economy is booming, the labor force participation
rate rises and often exceeds the predicted long-term trend, and during downturns the
participation rate falls below trend. Economic contractions historically result in both greater
unemployment and lower labor force participation, as nonparticipants become less likely to enter
the labor force and the unemployed (who always exhibit a higher tendency to exit the labor force)
become more numerous relative to the employed (Elsby, Hobijn, and Sahin 2013). While
movements in the participation rate over decades are driven largely by the long-term trends, in
the short-and medium-term the variation in the participation rate is driven by these cyclical
factors.
Figure 9: Detrended Participation Rate and
(Inverted) Unemployment Gap
Percentage Points Percentage Points
1.5 -6
1.0 -4
Participation Rate
(left axis)
0.5 -2
0.0 0
-0.5 2
Unemployment Gap
(right axis)
-1.0 4
-1.5 6
1960 1970 1980 1990 2000 2010
Figure 9 shows the cyclicality of the participation rate by comparing the detrended participation
rate and the detrended unemployment gap, defined as the difference between the actual
unemployment rate and the natural unemployment rate (to simplify comparison, the
unemployment gap is plotted inverted)2. For example, in the expansion of the 1990s, the
detrended participation rate rose, and during the Great Recession, the detrended participation
rate declined. Visual inspection suggests that movements in the participation rate lag, by perhaps
a year or so, movements in the unemployment rate, a phenomenon discussed in more detail
below. The cyclical pattern of the participation rate is also evident when looking at state-level
data, where the states with the largest increases in unemployment tended to have larger declines
in labor force participation (Figure 10). Roughly speaking, for every percentage point increase in
2
The trend component of the participation rate was constructed using a semiparametric procedure described in
Appendix A. Quarterly averages of monthly participation were used to reduce the noise in the series.
18the unemployment rate, the participation rate falls by about 0.2 percentage point, a pattern that
has roughly held over the last four recessions (Figure 11).
Figure 10: Labor Force Participation and
Unemployment by State
Percentage Point Change in LFPR (2007-2012)
0
TX
-1 NY
-2
IL NV
CA
-3
Trend Line
FL
-4
-5
-6
0 2 4 6 8 10
Percentage Point Change in Unemployment (2007-2010)
Figure 11: Cyclical Declines In Labor Force Participation
Percentage Points Percentage Points
5
Rise in Unemployment
4
Cyclical Effect on Participation
3
4.7 4.5
2
1 2.1 1.6
0 0.0
-0.4 -0.2
-0.6 -0.6
-0.4
-1.0
-0.6
-0.8
-1.0
1979-1983 1990-1993 2001-2003 2007-2010
While it is possible to estimate a cyclical effect on participation using microdata, the studies in
the literature that have tried this approach have produced cyclical estimates that do not comport
with the dynamics evident in the total participation time series (Bengali, Daly, and Valletta 2013;
Erceg and Levin 2013). The cyclicality of participation varies significantly across the population,
with participation among younger workers being highly cyclical and participation among prime-
age workers hardly responding to the business cycle. Alternatively, one can estimate the cyclical
component indirectly by subtracting the trend component from the observed participation rate
and treating this entire residual as the cyclical component (Van Zandweghe 2012). However, this
19approach does not distinguish between the typical cyclical response from a severe recession and
the decline in participation coming from challenges unique to the Great Recession and its
aftermath.
In this report, we estimate the cyclical component using econometric analysis of time series data,
where the cycle is defined by the unemployment gap. We consider two alternative distributed
lag specifications, one in which the detrended overall participation rate is regressed on the level
of the detrended unemployment gap and its lags, and a second in which the quarterly first
difference of the detrended overall participation rate is regressed on the four-quarter difference
of the detrended unemployment gap and its lags. The regression results for the two methods are
summarized in Tables 2 and 3, respectively.
Table 2: Levels on Levels Regressions using the
Unemployment Gap
Detrended Participation Rate, 16+
VARIABLES (1) (2) (3) (4)
Unemp. Gap -0.0142 -0.120** 0.165 0.140
(0.0615) (0.0530) (0.121) (0.126)
Unemp. Gap (t-1) -0.216** -0.191*
(0.0957) (0.102)
Unemp. Gap (t-2) 0.0184 0.0298
(0.0607) (0.0649)
Unemp. Gap (t-3) -3.71e-05 -0.110
(0.0889) (0.0798)
Unemp. Gap (t-4) -0.140*** -0.138 0.0451
(0.0428) (0.0853) (0.0686)
Unemp. Gap (t-5) -0.0773
(0.0729)
Unemp. Gap (t-6) 0.0652
(0.0622)
Unemp. Gap (t-7) -0.0858
(0.0884)
Unemp. Gap (t-8) -0.0462 -0.00831
(0.0378) (0.0854)
Constant 0.0840 0.0619 0.0761 0.0821
(0.0870) (0.0902) (0.0863) (0.0878)
Observations 210 218 214 210
F-test of Included Coefficients 8.530 5.143 6.075 4.006
Prob > F 2.29e-05 0.0243 2.84e-05 9.99e-05
F-test of Restricted Coefficients 1.919 3.551 2.248
Prob > F 0.0793 0.000719 0.0652
Predicted Cyclical Decline (2007:Q4 -
-0.477 -0.113 -0.465 -0.486
2014:Q2)
Note: Regres s i ons a re es ti ma ted us i ng da ta from 1960:Q1 to 2014:Q2. Newey-Wes t
s ta nda rd errors us i ng a ma xi mum l a g of 12 a re reported i n pa renthes es .
Pa rti ci pa ti on ra te a nd unempl oyment ga p a re detrended us i ng the procedure
des cri bed i n Appendi x A. F-tes ts of res tri cted coeffi ci ents a re the joi nt s i gni fi ca nce
tes t of the omi tted coeffi ci ents a l l equa l i ng zero i n a regres s i on wi th a l l ei ght l a gs
(i .e. i n regres s i on (3),i t tes ts the hypothes i s tha t the coeffi ci ents on the
unempl oyment ga p i n t-5 through t-8 a re a l l equa l to zero).
*** pTable 3: Differences on Differences Regressions using the
Unemployment Gap
Quarter-to-Quarter Difference of Detrended
Participation Rate, 16+
VARIABLES (5) (6) (7) (8)
Year-over-Year Difference of Unemp. Gap -0.0340*** -0.0355*** 0.0105 0.0259
(0.00891) (0.00783) (0.0239) (0.0292)
Year-over-Year Difference of Unemp. Gap (t-1) -0.0689 -0.107*
(0.0500) (0.0551)
Year-over-Year Difference of Unemp. Gap (t-2) -0.00142 0.0459
(0.0578) (0.0573)
Year-over-Year Difference of Unemp. Gap (t-3) 0.0545 -0.00622
(0.0468) (0.0536)
Year-over-Year Difference of Unemp. Gap (t-4) -0.0187** -0.0473** 0.0630
(0.00740) (0.0204) (0.0514)
Year-over-Year Difference of Unemp. Gap (t-5) -0.131**
(0.0637)
Year-over-Year Difference of Unemp. Gap (t-6) 0.0899*
(0.0531)
Year-over-Year Difference of Unemp. Gap (t-7) -0.0491
(0.0508)
Year-over-Year Difference of Unemp. Gap (t-8) -0.00563 0.0179
(0.00751) (0.0393)
Constant -0.00141 -0.00289 -0.00371 -0.00162
(0.00731) (0.00836) (0.00807) (0.00754)
Observations 210 218 214 210
F-test of Included Coefficients 11.74 20.52 9.623 6.686
Prob > F 3.90e-07 9.74e-06 2.81e-08 2.34e-08
F-test of Restricted Coefficients 1.872 2.590 2.422
Prob > F 0.0873 0.0103 0.0496
Predicted Cyclical Decline (2007:Q4 - 2014:Q2) -0.507 -0.303 -0.544 -0.474
Note: Regres s i ons a re es ti ma ted us i ng da ta from 1960:Q1 to 2014:Q2. Newey-Wes t s ta nda rd errors
us i ng a ma xi mum l a g of 12 a re reported i n pa renthes es . Pa rti ci pa ti on ra te a nd unempl oyment ga p
a re detrended us i ng the procedure des cri bed i n Appendi x A. F-tes ts of res tri cted coeffi ci ents a re the
joi nt s i gni fi ca nce tes t of the omi tted coeffi ci ents a l l equa l i ng zero i n a regres s i on wi th a l l ei ght l a gs
(i .e. i n regres s i on (3),i t tes ts the hypothes i s tha t the coeffi ci ents on the unempl oyment ga p i n t-5
through t-8 a re a l l equa l to zero).
*** pAn important distinction between the first-difference and levels specification is that the levels
specification imposes the restriction that the long-term forecast of the labor force participation
rate reverts to its long-term trend, whereas the differences specification permits a persistent gap
between the long-term trend line and the participation rate (so that in effect the trend shifts up
or down to match permanent shifts in the level of the participation rate). In the current situation,
this distinction corresponds to whether the gap between the labor force participation rate and
its cyclical component (the residual) will entirely disappear, or whether that gap might persist
because of the labor market disruptions of the Great Recession. We view this as an empirical
question, and to avoid imposing the additional mean-reverting structure on the cyclical
component, we adopt the first-difference specification. Further, to reduce estimation noise we
adopt the restricted-lag specification; this reasoning leads us to choose (5) as our preferred
specification. Note, however, that the decomposition results are not particularly sensitive to
these choices because varying them yields similar estimates of the cyclical components.
The predicted path for the participation rate, combining our estimate of the time series trend
with our preferred specification (regression (5) in Table 3), is shown below in Figure 12. We
estimate that between 2007 and 2014:Q2, business cycle effects alone explain 0.5 percentage
point (about one sixth) of the total fall in the participation rate.
Figure 12: Estimated Trend Plus Cyclical Component of
the Labor Force Participation Rate, 1980 - 2014
Percent
68
2014:Q2
Actual
67
66
Predicted Cyclical Path
(Including Trend)
65
64
63
62
1980 1990 2000 2010
With the improvement of the labor market, the usual cyclical drag on participation due to
elevated unemployment is declining. We estimate that, as of 2011, the participation rate was 0.9
percentage point lower because of cyclical factors. By 2014:Q2, however, the cyclical portion had
shrunk to 0.5 percentage point because the unemployment rate has fallen. The drop in the
cyclical contribution corresponds to nearly 1 million workers returning to the labor force because
of cyclical reasons since 2011.3
3
Due to other simultaneous flows of workers into and out of the labor force, this return of workers to the labor
force can be difficult to identify in the aggregated data.
22Other Effects on Participation: Non-Aging Trends and Factors Unique to the
Great Recession
Most of the decline in participation since the end of 2007 is accounted for by the aging of the
population and the standard cyclical effects associated with the elevated unemployment rate.
The remaining reduction in the participation rate—a 1.0 percentage point reduction in the
participation rate since the end of 2007—is not explained by either of these two previously
discussed factors.
This residual is a relatively recent phenomenon in this recovery. Up until the beginning of 2012
the participation rate was generally slightly higher than would have been predicted based on the
aging trend and the standard business cycle effects. But in the last two years, the participation
rate has continued to fall at about the same rate even though the unemployment rate has been
declining rapidly. This means that the standard cyclical effect has been giving way to a growing
unexplained residual (Figure 13).
The literature has put forward several possible explanations for this residual component which
fall mainly into two categories: long-term trends within age groups and factors unique to the
Great Recession. We cannot precisely break down these two factors. At least some of the residual
appears to be these pre-existing trends, many of which are discussed in the next section about
different demographic groups, although some of these pre-existing trends are partially offsetting
(e.g., prime-age male labor force participation was already falling while older workers were
seeing a rising participation rate).
The fact that the residual only emerged later in the recovery suggests that much of it might be
the result of factors specific to the Great Recession and its aftermath. We focus here on testing
three unique factors of the Great Recession that may be linked to the residual component, but
other forces may also explain the residual decline.
23Significantly Elevated Long-Term Unemployment
The Great Recession has led to an unprecedented increase in long-term unemployment, with the
number of individuals unemployed for 27 weeks or more rising from 1.3 million at the end of
2007 to more than 6 million at the end of 2010. Even though the rate of short-term
unemployment (26 weeks or less) has since returned to its 2001-07 average, the long-term
unemployment rate remains more than double what it averaged during the previous expansion.
The emergence of a large residual in our participation rate model coincides with a sustained
elevation of the long-term unemployment rate, suggesting that these two phenomena could be
different manifestations of the same underlying challenge, or that one is causing the other. To
test the plausibility of this hypothesis, we look at the historical relationship between the residual
(unexplained component) and the extent of long-term unemployment. Specifically, we ran
several regressions using the detrended mean duration of unemployment as a regressor in
addition to the detrended unemployment gap that was used in the standard cyclical estimates
above.4 As Tables 4 (levels on levels) and 5 (differences on differences) show, the mean duration
of unemployment was highly statistically significant in the differences specification but only
marginally significant in the levels specification. These tables also show the effects of disability
insurance and school enrollments, which will be discussed below.
4
The Current Population Survey was changed at the beginning of 2011 to permit respondents to report longer
durations of unemployment. This change may have led to a break in the level of the series, which might influence
our regressions in levels. The change is not likely to affect our regression in differences, which is where we find
that mean duration is significant. Using the median duration of unemployment (which was not affected by the
change), we find that unemployment duration is significant in the levels specifications, but not the differences
specifications, providing further evidence that long-term unemployment accounts for the residual component.
24Table 4: Levels on Levels Regressions using Disability Claims, Duration of Unemployment, and
Enrollment Rate
Detrended Participation Rate, 16+
VARIABLES (1) (2) (3) (4) (5) (6)
Unemployment Gap -0.0142 -0.0712 -0.0130 -0.0154 -0.00373 0.0153
(0.0723) (0.0805) (0.0574) (0.0597) (0.0619) (0.0640)
Unemp. Gap (t-4) -0.140*** -0.169** -0.142*** -0.137*** -0.137*** -0.135***
(0.0525) (0.0654) (0.0417) (0.0455) (0.0431) (0.0404)
Unemp. Gap (t-8) -0.0462 0.0249 -0.0512 -0.0499 -0.0332 -0.0453
(0.0609) (0.0569) (0.0425) (0.0453) (0.0402) (0.0468)
Mean Duration of Unemp. -8.35e-06 0.0400
(0.0224) (0.0279)
Mean Duration of Unemp. (t-4) -0.0356
(0.0296)
Mean Duration of Unemp. (t-8) -0.0119
(0.0242)
SSDI Claims 0.000933** 0.000615
(0.000468) (0.00115)
SSDI Claims (t-4) 0.000272
(0.00188)
SSDI Claims (t-8) 0.000121
(0.00124)
Enrollment Rate -22.92 -41.04
(19.18) (32.51)
Enrollment Rate (t-4) 5.962
(27.62)
Enrollment Rate (t-8) 26.26
(39.03)
Constant 0.0840 0.0842 0.0860 0.0859 0.0997 0.0892
(0.0892) (0.0900) (0.0881) (0.0881) (0.0799) (0.0792)
Observations 210 210 204 204 210 210
F-test 1.38e-07 2.624 3.974 0.157 1.429 0.379
Prob > F 1.000 0.0750 0.0476 0.855 0.233 0.685
Note: Regres s i ons a re es ti ma ted us i ng da ta from 1960:Q1 to 2014:Q2. Newey-Wes t s ta nda rd errors us i ng a ma xi mum l a g of 12 a re reported
i n pa renthes es . Pa rti ci pa ti on ra te a nd unempl oyment ga p a re detrended us i ng the procedure des cri bed i n Appendi x A. F-tes ts a re joi nt
s i gni fi ca nce tes ts of the di s a bi l i ty i ns ura nce, mea n dura ti on, a nd s chool i ng va ri a bl es .
*** pTable 5: Differences on Differences Regressions using Disability Claims, Duration of Unemployment, and
Enrollment Rate
Quarter-to-Quarter Difference of Detrended Participation Rate, 16+
VARIABLES (7) (8) (9) (10) (11) (12)
Year-over-Year Difference of Unemp. Gap -0.0297*** -0.0330*** -0.0322*** -0.0321*** -0.0330*** -0.0328***
(0.00890) (0.00914) (0.00989) (0.00992) (0.00884) (0.00877)
Year-over-Year Difference of Unemp. Gap (t-4) -0.0130 0.00429 -0.0228** -0.0149 -0.0181** -0.0190**
(0.0103) (0.0146) (0.00943) (0.0111) (0.00724) (0.00737)
Year-over-Year Difference of Unemp. Gap (t-8) -0.00350 0.0151 -0.0117 -0.0170* -0.00481 -0.00569
(0.00776) (0.0114) (0.00916) (0.00901) (0.00786) (0.00744)
Year-over-Year Difference of Mean Duration -0.00387 -0.00406
(0.00436) (0.00534)
Year-over-Year Difference of Mean Duration (t-4) -0.0142***
(0.00524)
Year-over-Year Difference of Mean Duration (t-8) 0.00222
(0.00527)
Year-over-Year Difference of SSDI Claims 0.000546 -0.000610
(0.000614) (0.000874)
Year-over-Year Difference of SSDI Claims (t-4) 0.00120
(0.00117)
Year-over-Year Difference of SSDI Claims (t-8) -0.000719
(0.000756)
Year-over-Year Difference of Enrollment Rate -2.510 -2.910
(4.275) (4.702)
Year-over-Year Difference of Enrollment Rate (t-4) 2.876
(4.415)
Year-over-Year Difference of Enrollment Rate (t-8) 0.444
(3.391)
Constant -0.000523 0.00247 0.00154 -0.00225 -0.00124 -0.00147
(0.00743) (0.00676) (0.00658) (0.00698) (0.00732) (0.00719)
Observations 210 210 145 137 210 210
F-test 0.789 3.529 0.788 0.373 0.345 0.161
Prob > F 0.376 0.0159 0.376 0.773 0.558 0.923
Note: Regres s i ons a re es ti ma ted us i ng da ta from 1960:Q1 to 2014:Q2. Newey-Wes t s ta nda rd errors us i ng a ma xi mum l a g of 12 a re reported i n pa renthes es .
Pa rti ci pa ti on ra te a nd unempl oyment ga p a re detrended us i ng the procedure des cri bed i n Appendi x A. F-tes ts a re joi nt s i gni fi ca nce tes ts of the di s a bi l i ty
i ns ura nce, mea n dura ti on, a nd s chool i ng va ri a bl es .
*** pFigure 14: Labor Force Participation Decomposition
Including Mean Duration of Unemployment
Percent
67.0
66.5
66.0
Actual
65.5
Other Effects
65.0
64.5
64.0
Mean Duration
63.5
63.0
Remaining Residual
62.5
2009 2010 2011 2012 2013 2014
One theory put forward to explain the rise in long-term unemployment during the most recent
recession is that the long-term unemployed are less productive workers on average and will take
longer to find new jobs (Cowen and Lemke 2011). However, the long-term unemployed appear
similar to the short-term unemployed in many dimensions, including gender, educational
attainment, and previous industry and occupation (Mitchell 2013; Krueger, Cramer, and Cho
2014). Lower productivity among the long-term unemployed could be related to unobservable
characteristics, but it is not clear whether the differences among unobservable traits are large
enough to explain the rise in long-term unemployment.
A more plausible explanation for the rise in long-term unemployment is that firms are screening
out applicants based on duration of unemployment. Long-term unemployed workers are about
half as likely to get a callback for an interview as equally-qualified short-term unemployed
workers (Kroft, Lange, and Notowidigdo 2013). Short-term unemployed applicants with no
relevant work experience for a particular job are more likely to be interviewed for the job than
long-term applicants with relevant work experience (Ghayad 2013). Workers who are not lucky
enough to find a job within the first few months of unemployment will face disadvantages in the
hiring process, further lengthening their unemployment spells on average and raising the rate of
long-term unemployment.
Recent research finds that the period of elevated long-term unemployment that we are
experiencing is consistent with historical patterns after adjusting for the deeper decline and
slower recovery from the latest recession (Kroft, Lange, Notowidigdo, and Katz 2014). Consistent
with the fact that the long-term unemployed are observably similar to the short-term
unemployed, Kroft et al. find that demographics, occupations, industries, regions or reasons for
unemployment do little to explain the variation in unemployment spell length. Instead, they
attribute a large share of the rise in long-term unemployment to negative duration dependence,
meaning that as a spell of unemployment persists, it becomes more likely to persist even longer.
They further find that changes the flows between unemployment and non-participation in the
27You can also read