Machine Learning to Predict Mortality and Critical Events in a Cohort of Patients With COVID-19 in New York City: Model Development and Validation
←
→
Page content transcription
If your browser does not render page correctly, please read the page content below
JOURNAL OF MEDICAL INTERNET RESEARCH                                                                                                               Vaid et al

     Original Paper

     Machine Learning to Predict Mortality and Critical Events in a
     Cohort of Patients With COVID-19 in New York City: Model
     Development and Validation

     Akhil Vaid1, MD; Sulaiman Somani1*, BSc; Adam J Russak1,2*, MD; Jessica K De Freitas1,3, BSc; Fayzan F Chaudhry1,3,
     BSc; Ishan Paranjpe1, BSc; Kipp W Johnson3, PhD; Samuel J Lee1, BSc; Riccardo Miotto1,3, PhD; Felix Richter1,3,
     PhD; Shan Zhao1,4, MD, PhD; Noam D Beckmann3, PhD; Nidhi Naik1, MSc; Arash Kia5,6, MD; Prem Timsina5,6,
     PhD; Anuradha Lala5,7, MD; Manish Paranjpe8, BSc; Eddye Golden1, MPH; Matteo Danieletto1, PhD; Manbir Singh1,
     BBA; Dara Meyer3, MSc; Paul F O'Reilly3,9,10, PhD; Laura Huckins3,9,10, PhD; Patricia Kovatch11, BSc; Joseph
     Finkelstein5, MD, PhD; Robert M. Freeman5,6, MBA, RN; Edgar Argulian12,13, MD, MPH; Andrew Kasarskis3,5,14,15,
     PhD; Bethany Percha2, PhD; Judith A Aberg2,16, MD; Emilia Bagiella6,7, PhD; Carol R Horowitz2,5, MD, MPH; Barbara
     Murphy2, MD; Eric J Nestler17,18, MD, PhD; Eric E Schadt3,14, PhD; Judy H Cho19, MD; Carlos Cordon-Cardo20, MD,
     PhD; Valentin Fuster7,12,13, MD, PhD; Dennis S Charney21, MD; David L Reich4, MD; Erwin P Bottinger1,22, MD;
     Matthew A Levin3,4, MD; Jagat Narula12,13, MD, PhD; Zahi A Fayad23,24, PhD; Allan C Just25, PhD; Alexander W
     Charney3,9,10, MD, PhD; Girish N Nadkarni1,2,19, MD, MPH; Benjamin S Glicksberg1,3, PhD
     1
      The Hasso Plattner Institute for Digital Health at Mount Sinai, Icahn School of Medicine at Mount Sinai, New York, NY, United States
     2
      Department of Medicine, Icahn School of Medicine at Mount Sinai, New York, NY, United States
     3
      Department of Genetics and Genomic Sciences, Icahn School of Medicine at Mount Sinai, New York, NY, United States
     4
      Department of Anesthesiology, Perioperative and Pain Medicine, Icahn School of Medicine at Mount Sinai, New York, NY, United States
     5
      Department of Population Health Science and Policy, Icahn School of Medicine at Mount Sinai, New York, NY, United States
     6
      Institute for Healthcare Delivery Science, Icahn School of Medicine at Mount Sinai, New York, NY, United States
     7
      The Zena and Michael A. Wiener Cardiovascular Institute, Icahn School of Medicine at Mount Sinai, New York, NY, United States
     8
      Harvard Medical School, Boston, MA, United States
     9
      The Pamela Sklar Division of Psychiatric Genomics, Icahn School of Medicine at Mount Sinai, New York, NY, United States
     10
          The Department of Psychiatry, Icahn School of Medicine at Mount Sinai, New York, NY, United States
     11
          Mount Sinai Data Warehouse, Icahn School of Medicine at Mount Sinai, New York, NY, United States
     12
          Mount Sinai Heart, Icahn School of Medicine at Mount Sinai, New York, NY, United States
     13
          Department of Cardiology, Icahn School of Medicine at Mount Sinai, New York, NY, United States
     14
          Icahn Institute for Data Science and Genomic Technology, Icahn School of Medicine at Mount Sinai, New York, NY, United States
     15
          Mount Sinai Data Office, Icahn School of Medicine at Mount Sinai, New York, NY, United States
     16
          Division of Infectious Diseases, Icahn School of Medicine at Mount Sinai, New York, NY, United States
     17
          Nash Family Department of Neuroscience, Icahn School of Medicine at Mount Sinai, New York, NY, United States
     18
          Friedman Brain Institute, Icahn School of Medicine at Mount Sinai, New York, NY, United States
     19
          The Charles Bronfman Institute for Personalized Medicine, Icahn School of Medicine at Mount Sinai, New York, NY, United States
     20
          Department of Pathology, Icahn School of Medicine at Mount Sinai, New York, NY, United States
     21
          Office of the Dean, Icahn School of Medicine at Mount Sinai, New York, NY, United States
     22
          Digital Health Center, Hasso Plattner Institute, University of Potsdam, Potsdam, Germany
     23
          BioMedical Engineering and Imaging Institute, Icahn School of Medicine at Mount Sinai, New York, NY, United States
     24
          Department of Radiology, Icahn School of Medicine at Mount Sinai, New York, NY, United States
     25
          Department of Environmental Medicine and Public Health, Icahn School of Medicine at Mount Sinai, New York, NY, United States
     *
      these authors contributed equally

     Corresponding Author:
     Benjamin S Glicksberg, PhD
     The Hasso Plattner Institute for Digital Health at Mount Sinai
     Icahn School of Medicine at Mount Sinai
     770 Lexington St.

     https://www.jmir.org/2020/11/e24018                                                                    J Med Internet Res 2020 | vol. 22 | iss. 11 | e24018 | p. 1
                                                                                                                           (page number not for citation purposes)
XSL• FO
RenderX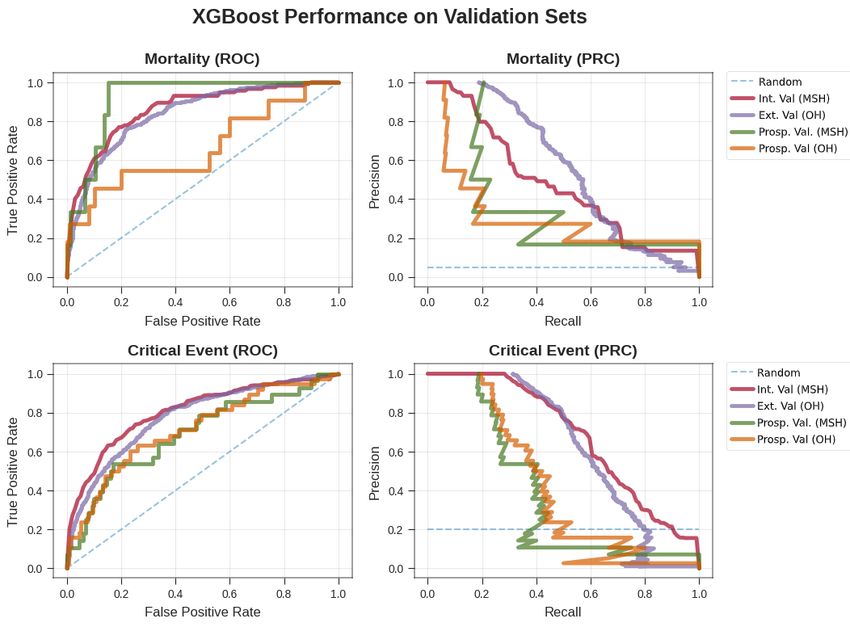
JOURNAL OF MEDICAL INTERNET RESEARCH                                                                                                       Vaid et al

     New York, NY
     United States
     Phone: 1 212 731 7078
     Email: benjamin.glicksberg@mssm.edu

     Abstract
     Background: COVID-19 has infected millions of people worldwide and is responsible for several hundred thousand fatalities.
     The COVID-19 pandemic has necessitated thoughtful resource allocation and early identification of high-risk patients. However,
     effective methods to meet these needs are lacking.
     Objective: The aims of this study were to analyze the electronic health records (EHRs) of patients who tested positive for
     COVID-19 and were admitted to hospitals in the Mount Sinai Health System in New York City; to develop machine learning
     models for making predictions about the hospital course of the patients over clinically meaningful time horizons based on patient
     characteristics at admission; and to assess the performance of these models at multiple hospitals and time points.
     Methods: We used Extreme Gradient Boosting (XGBoost) and baseline comparator models to predict in-hospital mortality and
     critical events at time windows of 3, 5, 7, and 10 days from admission. Our study population included harmonized EHR data
     from five hospitals in New York City for 4098 COVID-19–positive patients admitted from March 15 to May 22, 2020. The
     models were first trained on patients from a single hospital (n=1514) before or on May 1, externally validated on patients from
     four other hospitals (n=2201) before or on May 1, and prospectively validated on all patients after May 1 (n=383). Finally, we
     established model interpretability to identify and rank variables that drive model predictions.
     Results: Upon cross-validation, the XGBoost classifier outperformed baseline models, with an area under the receiver operating
     characteristic curve (AUC-ROC) for mortality of 0.89 at 3 days, 0.85 at 5 and 7 days, and 0.84 at 10 days. XGBoost also performed
     well for critical event prediction, with an AUC-ROC of 0.80 at 3 days, 0.79 at 5 days, 0.80 at 7 days, and 0.81 at 10 days. In
     external validation, XGBoost achieved an AUC-ROC of 0.88 at 3 days, 0.86 at 5 days, 0.86 at 7 days, and 0.84 at 10 days for
     mortality prediction. Similarly, the unimputed XGBoost model achieved an AUC-ROC of 0.78 at 3 days, 0.79 at 5 days, 0.80 at
     7 days, and 0.81 at 10 days. Trends in performance on prospective validation sets were similar. At 7 days, acute kidney injury
     on admission, elevated LDH, tachypnea, and hyperglycemia were the strongest drivers of critical event prediction, while higher
     age, anion gap, and C-reactive protein were the strongest drivers of mortality prediction.
     Conclusions: We externally and prospectively trained and validated machine learning models for mortality and critical events
     for patients with COVID-19 at different time horizons. These models identified at-risk patients and uncovered underlying
     relationships that predicted outcomes.

     (J Med Internet Res 2020;22(11):e24018) doi: 10.2196/24018

     KEYWORDS
     machine learning; COVID-19; electronic health record; TRIPOD; clinical informatics; prediction; mortality; EHR; cohort; hospital;
     performance

                                                                            Prognostication with machine learning is poised to accomplish
     Introduction                                                           this [8]; however, efforts have been limited by small sample
     Despite substantial, organized efforts to prevent disease spread,      sizes, lack of generalization to diverse populations, disparities
     over 23 million people have tested positive for SARS-CoV-2             in feature missingness, and potential for bias [9]. Many
     worldwide, and the World Health Organization has reported              predictive models have met with success; however, these models
     more than 800,000 deaths from the virus to date [1-4]. As a            only consider demographics, clinical symptoms, or laboratory
     result of this pandemic, hospitals are being filled beyond             values rather than considering all these factors conjointly
     capacity and face extreme challenges with regard to personnel          [10-17]. More recent studies have accounted for fundamental
     staffing, personal protective equipment availability, and              aspects of machine learning but are limited in scope [13,18-22].
     intensive care unit (ICU) bed allocation. Additionally, patients       These studies lack either temporal benchmarks, interhospital
     with COVID-19 demonstrate varying symptomatology, making               or prospective validation, systematic evaluation of multiple
     safe and successful patient triaging difficult. While some             models, consideration of covariate correlations, or assessment
     infected patients are asymptomatic, others suffer from severe          of the impact of the imputed data. With these needs in mind,
     acute respiratory distress syndrome, experience multiorgan             we report the development of a boosted decision tree–based
     failure, or die [5-7]. Identification of key patient characteristics   machine learning model trained on electronic health records
     that govern the course of disease across large patient cohorts is      from patients confirmed to have COVID-19 at a single center
     important, particularly given its potential to aid physicians and      in the Mount Sinai Health System (MSHS) in New York City
     hospitals in predicting disease trajectory, allocating essential       to predict critical events and mortality. To assess both
     resources effectively, and improving patient outcomes.                 interhospital and temporal generalizability, we first externally
                                                                            validated this algorithm to four other hospital centers. We then
     https://www.jmir.org/2020/11/e24018                                                            J Med Internet Res 2020 | vol. 22 | iss. 11 | e24018 | p. 2
                                                                                                                   (page number not for citation purposes)
XSL• FO
RenderX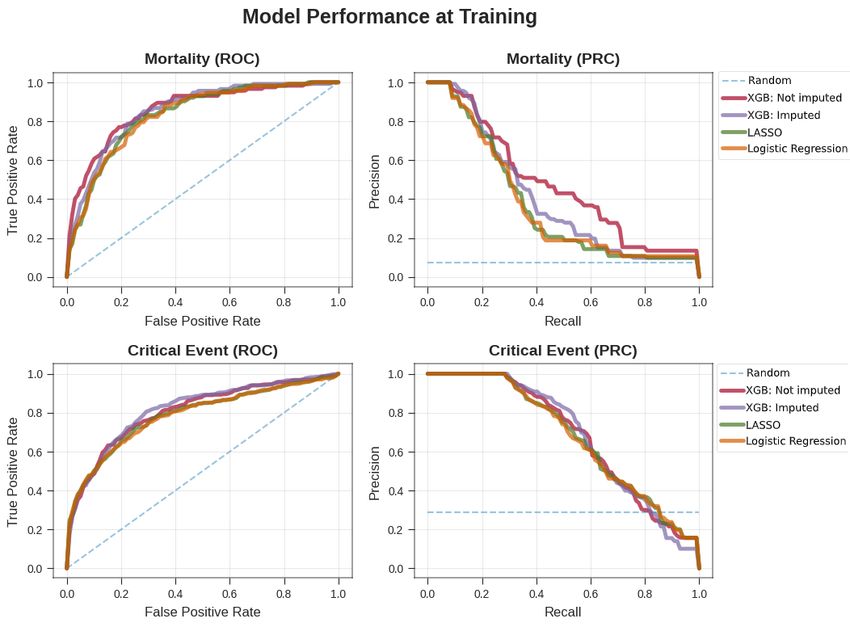
JOURNAL OF MEDICAL INTERNET RESEARCH                                                                                                                Vaid et al

     prospectively validated it on a new set of patients from all five            Study Population
     hospitals. Finally, we performed a saliency analysis using SHAP              We retrospectively included all patients who were over 18 years
     (SHapley Additive exPlanation) values to identify the most                   of age, had laboratory-confirmed COVID-19 infection, and
     important features used by this model for outcome prediction.                were admitted to any of the abovementioned MSHS hospitals
                                                                                  between March 15 and May 22, 2020. A confirmed case of
     Methods                                                                      COVID-19 was defined by a positive reverse
                                                                                  transcriptase–polymerase chain reaction (RT-PCR) assay of a
     Clinical Data Sources
                                                                                  nasopharyngeal swab. To restrict our data to only primary
     Patient data were obtained from five hospitals within the MSHS               COVID-19–related encounters, we excluded patients who had
     in New York City: the Mount Sinai Hospital (MSH) located in                  a first positive COVID-19 RT-PCR result more than two days
     East Harlem, Manhattan; Mount Sinai Morningside (MSM)                        after admission. We included all patients who had been
     located in Morningside Heights, Manhattan; Mount Sinai West                  discharged, had died, or were still admitted and had stayed in
     (MSW) located in Midtown West, Manhattan; Mount Sinai                        the hospital for at least the amount of time corresponding to the
     Brooklyn (MSB) located in Midwood, Brooklyn; and Mount                       outcome in question. This approach provided additional training
     Sinai Queens (MSQ) located in Astoria, Queens. The data set                  data for the initial timeframes described in the paper. All
     was obtained from different sources using the Epic EHR                       exclusion criteria are presented in Figure 1A.
     software (Epic Systems) and aggregated by the Mount Sinai
     COVID Informatics Center.
     Figure 1. Study design and workflow. (A) Procedure for patient inclusion in our study. (B) Outcomes of interest. We trained the model on data taken
     at time of admission to predict the likelihood of either mortality or critical event occurrence at 3, 5, 7, and 10 days. (C) Strategy and design of the
     experiments. Patient clinical data from Mount Sinai Hospital (MSH) before the temporal split (May 1) were used to train and internally validate our
     XGBoost model in comparison with other baseline models. We then tested the series of XGBoost models on unimputed patient data on patients from
     four other external hospitals within the MSHS for external validation. h: hours; ICU: intensive care unit; lab: laboratory; MSB: Mount Sinai Brooklyn;
     MSHS: Mount Sinai Health System; MSM: Mount Sinai Morningside; MSQ: Mount Sinai Queens; MSW: Mount Sinai West (MSW); RT-PCR: reverse
     transcriptase–polymerase chain reaction; vitals: vital signs.

                                                                                  censoring on the results, we recorded the ultimate outcome of
     Study Design                                                                 each patient who was admitted in this time frame, even if the
     We built predictive models based on data from MSH patients                   outcome occurred after the data enrollment cutoff. For patients
     who were admitted from March 15 to May 1, 2020, which was                    within the internal validation cohort, the models were trained
     the cutoff time for prospective evaluation. These patients were              and their performance was evaluated through stratified k-fold
     considered to be part of the internal validation cohort. All                 cross-validation to mitigate the variability of a single train-test
     patients admitted to other hospitals (OH) were grouped together.             split. A final model was then trained for each outcome and time
     To allay concerns about effects of immortal time bias and                    window using all the patients in this data set, and this model

     https://www.jmir.org/2020/11/e24018                                                                     J Med Internet Res 2020 | vol. 22 | iss. 11 | e24018 | p. 3
                                                                                                                            (page number not for citation purposes)
XSL• FO
RenderX
JOURNAL OF MEDICAL INTERNET RESEARCH Vaid et al
was then assessed through a series of validation experiments. percentile were removed to avoid inclusion of any obvious
First, we externally validated OH patients from March 15 to outliers that could represent incorrect documentation or
May 1, 2020, which was the same time frame used to train the measurement error.
model; this afforded benefits by assessing the generalizability
of the model to a new setting (Figure 1B). Then, to assess
Data Sharing
temporal generalizability, we performed prospective validations The raw data used in this work cannot be shared due to patient
of the model independently on both MSH and OH patients privacy and security concerns. However, we are open to using
admitted from May 1 to May 22, 2020 (Figure 1C). this data set for validation of other models through a
collaboration under an appropriate data use agreement with the
Study Data authors at the Icahn School of Medicine at Mount Sinai.
Demographics collected included age, sex, reported race, and
ethnicity. Race was collapsed into seven categories based on
Definition of Outcomes
the most recent US census race categories: American Indian or The two primary outcomes were (1) death versus survival or
Alaskan Native, Asian, Black or African American, other, discharge and (2) critical illness versus survival or discharge
Native Hawaiian or other Pacific Islander, unknown, and White through time horizons of 3, 5, 7, and 10 days. Critical illness
[23]. Ethnicity was collapsed into three categories: was defined as discharge to hospice, intubation ≤48 hours prior
Hispanic/Latino, non-Hispanic/Latino, and Unknown. to intensive care unit (ICU) admission, ICU admission, or death.
A composite outcome (ie, mortality as opposed to discharge or
Additionally, diagnosis codes based on International survival) was chosen to bypass issues of competing risks.
Classification of Diseases-9/10-Clinical Modification
(ICD-9/10-CM) codes and procedures were obtained to identify Model Development, Selection, and Experimentation
associated pre-existing conditions. We chose to include Our primary model was the Extreme Gradient Boosting
conditions with previously reported increased incidence in (XGBoost) implementation of boosted decision trees on
hospitalized patients with COVID-19: coronary artery disease, continuous and one-hot encoded categorical features [28]. The
heart failure, hypertension, atrial fibrillation, obstructive sleep XGBoost algorithm provides robust prediction results through
apnea, asthma, chronic obstructive pulmonary disease, cancer, an iterative process of prediction summation in decision trees
chronic kidney disease, diabetes, viral hepatitis, liver disease, fit to the residual error of the prior ensemble. While each tree
intracerebral hemorrhage, and stroke [9,24-27]. Inclusion of is too simple to accurately capture complex phenomena, the
these chronic conditions and acute kidney injury (AKI) was combination of many trees in the XGBoost model
based on ICD-9/ICD-10 codes related to active problems accommodates nonlinearity and interactions between predictors.
documented during COVID-19 hospitalization, defined by the The model directs missing values through split points to
presence of at least one ICD code signifying the condition. minimize loss. Hyperparameter tuning was performed by
Laboratory measurements and vital signs near the time of randomized grid searching directed toward maximizing the F1
admission were also retrieved for each patient during their score metric over 5000 discrete grid options. Ten-fold stratified
hospital encounter. Given the resource constraints due to cross-validation was performed inside each grid option, and the
COVID-19, which delayed acquisition of laboratory results, the optimal hyperparameter set was chosen based on the model in
first laboratory value in a 36-hour window period was used as the grid search with the highest F1 score. Final model
the representative laboratory value on admission. The hyperparameters for the XGBoost model are listed in
implications of this strategy for the model performance are Multimedia Appendix 1. To generate confidence intervals for
illustrated in the Multimedia Appendices. the internal validation set, training and testing was performed
All laboratory orders from the five hospitals were queried for for 500 bootstrap iterations with a unique randomly generated
patients included in this study within the timeframe of interest. seed for the train-test data splits.
Due to discrepancies in how laboratory orders were named in We opted to implement our analyses within a classification
different hospitals, a comprehensive and statistical review of framework because we aimed to implement our models with
all laboratory orders by field name was conducted by a regard to clinically relevant time boundaries for resource
multidisciplinary team of clinicians to ensure direct mapping allocation and clinical decision-making, such as resource
between all sites. Additionally, many laboratory values allocation, triage, and decisions for ICU transfer. A major goal
represented a single component (eg, sodium) but were acquired of our analysis was the construction of a resilient and highly
from either an arterial blood gas (ABG) test, venous blood gas performant predictive model; therefore, the selection of the
(VBG) test, or basic metabolic panel (BMP). Based on the utility XGBoost algorithm is reasonable given its well-understood
of these laboratory values in clinical practice and the similarity properties as the best-performing machine learning algorithm
between their statistical distributions, laboratory values derived for classification tasks on tabular data. The XGBoost algorithm
from a VBG or BMP were collapsed into a single category (ie, also addresses real-life problems such as missing data and highly
“SODIUM”) and those derived from an ABG were moved to a multidimensional independent variables, while alternate
separate category (ie, “SODIUM_A”). In the set of all laboratory strategies and extensions must be employed to enable Cox
order names that were combined into a single laboratory proportional hazard analyses in these settings.
category, the earliest laboratory result by time was chosen as
the representative laboratory value for that category. Finally, To compare the performance of our XGBoost model for the
laboratory data below the 0.5th percentile and above the 99.5th training and internal validation data, we generated two predictive
https://www.jmir.org/2020/11/e24018 J Med Internet Res 2020 | vol. 22 | iss. 11 | e24018 | p. 4
(page number not for citation purposes)
XSL• FO
RenderXJOURNAL OF MEDICAL INTERNET RESEARCH Vaid et al
models as a baseline, namely logistic regression (LR) and LR skewed data sets that have greater class imbalance and was
with L1 regularization, given their ubiquity as preferred models therefore primarily used in the model evaluation and selection.
in current COVID-19 research. L1 regularization, also known
as least absolute shrinkage and selection operator (LASSO),
Model Interpretation
was used to train the LR and impose parsimony in feature We evaluated feature contributions toward model prediction
selection, given the number of features present in the data set using SHAP scores. SHAP scores are a game-theoretic approach
(73). LASSO and LR were optimized by an exhaustive grid to model interpretability; they provide explanations of global
search for the inverse regularization parameter (Multimedia model structures based upon combinations of several local
Appendix 1). For these baseline models, the issue of missingness explanations for each prediction [29]. To interpret and rank the
was addressed by imputation. Features with >30% missingness significance of input features toward the final prediction of the
were dropped, and k-nearest neighbors (kNN, k=5) was used model, mean absolute SHAP values were calculated for each
to impute missing data in the remaining feature space. To further feature across all observations in the internal validation set. We
assess the impact of imputation on performance, an XGBoost also plotted a heatmap showing SHAP interaction values, which
model was also created and trained on the imputed data set. are an extension of SHAP summary values to capture how
Imputation for the training set (ie, MSH only) and external pairwise interactions between different features contribute to
validation set (ie, OH) were performed using only the first model prediction. For a given pair of features, their pairwise
collected value from the respective sites to prevent information interaction effect is calculated after removing the individual
leakage that could compromise assessment of generalizability. effects of those features. Values on the diagonal represent the
We assessed the calibration of the results of each model to main effects (ie, the SHAP summary values), and values off the
ensure that the model predictions could be interpreted as diagonal represent the interaction effects. Higher values on the
real-world risk scores. Calibration was performed using both heatmap (ie, brighter squares) represent a greater impact on
the sigmoid and isotonic methods of the CalibratedClassifierCV model predictions. In addition, we calculated the feature
class in scikit-learn and evaluated using the Brier score metric. importance from the coefficients of the LASSO model (Figure
S9 in Multimedia Appendix 2).
Experimental Evaluation
All models were trained and evaluated using 10-fold stratified
Promoting Interoperability and Replicability
cross-validation, and confidence intervals were generated using This article is written following the TRIPOD (Transparent
500 iterations of bootstrapping. Stratified k-fold cross-validation Reporting of a Multivariable Prediction Model for Individual
maintains an outcome distribution across each fold in Prognosis or Diagnosis) guidelines [30], which are further
concordance with the outcome distribution in the study elaborated in Multimedia Appendix 4. Furthermore, we release
population. We present calibration plots for all these all code used to build the classifier under the GPLv3 license in
experiments, including isotonic and sigmoid calibrations, that a public GitHub repository [31].
show the proportion of positive cases to the mean predicted
value for the raw models in Figures S1-S8 in Multimedia Results
Appendix 2. In these plots and in Multimedia Appendix 3, we
also report the Brier score, which measures the quality of Clinical Data Source and Study Population
calibration (a lower score indicates greater accuracy). Electronic health records for 4098 COVID-19–positive inpatient
Ultimately, we selected the best-calibrated model based on the admissions at five hospitals within the MSHS between March
lowest Brier score, and performed all subsequent experiments 15 and May 22, 2020, were retrieved for data analysis based on
with this model. Probability scores output by the model were the inclusion criteria. These data included patient demographics,
used to calculate the areas under the receiver operator past medical history, and admission vital signs and laboratory
characteristic curve (AUC-ROCs) and areas under the test results (Table 1 and Table 2; Multimedia Appendix 5). Vital
precision-recall curve (AU-PRCs). The receiver operating sign and laboratory test data were included as baseline features
characteristic curve shows how the balance between true and in order to work within the bounds of the processing and
false positive rates is affected at different decision thresholds. operations involved in obtaining the results of these tests. No
The precision-recall curve visualizes how the balance of false data leakage occurred, and we did not find disproportionate
positives and negatives is affected at different decision rates of feature missingness for patients who died within this
thresholds. The decision threshold was calculated separately time window for feature inclusion (see the Multimedia
for each fold to maximize the F1 score for prediction of the Appendices). We show the number of patients involved and the
primary outcome. The threshold for the final model was taken proportion of events in each experiment by time window in
as the median of the calculated thresholds across the 10 Multimedia Appendix 6. Relevant patient events (intubation,
cross-validation folds. Accuracy, F1 score, sensitivity, and discharge to hospice care, or death) were recorded, and subsets
specificity were calculated on the basis of these thresholds. were constructed at 3-, 5-, 7-, and 10-day intervals after
Model performance was assessed during internal admission (Figure 1). Before May 1, 21.3% to 35.3% of patients
cross-validation, external validation, and prospective validation. had experienced a critical event (intubation, ICU admission,
The models were compared on the basis of their AUC-ROC discharge to hospice care, or death) across all time intervals.
and AU-PRC values across the time intervals in each population On or after May 1, this proportion changed to 14.3% to 21.9%.
of patients. The AU-PRC is known to be a better metric in Similarly, before May 1, 2.6% to 22.4% patients died across all
time intervals, with the proportion changing to 1.1% to 8.0%
https://www.jmir.org/2020/11/e24018 J Med Internet Res 2020 | vol. 22 | iss. 11 | e24018 | p. 5
(page number not for citation purposes)
XSL• FO
RenderXJOURNAL OF MEDICAL INTERNET RESEARCH Vaid et al
on or after May 1. The survival curve for mortality is shown in (Multimedia Appendix 6). In contrast, the set of noncases
Figure S10 in Multimedia Appendix 2. This curve was generated consisted of patients with all other discharge dispositions and
by fitting a Kaplan-Meier estimator to the survival time for those who were still hospitalized at the respective intervals after
patients with observed (in-hospital) death instead of discharge admission.
https://www.jmir.org/2020/11/e24018 J Med Internet Res 2020 | vol. 22 | iss. 11 | e24018 | p. 6
(page number not for citation purposes)
XSL• FO
RenderXJOURNAL OF MEDICAL INTERNET RESEARCH Vaid et al
Table 1. Demographic characteristics, clinical history, and vital signs of hospitalized patients with COVID-19 at baseline (N=4098).
Characteristic on admission Retrospective Prospective
MSHa (n=1514) OHb (n=2201) MSH OH
Demographics
Sex, n (%)
Male 869 (57.4) 1257 (57.1) 104 (59.4) 104 (50)
Female 645 (42.6) 944 (42.9) 71 (40.6) 104 (50)
Race, n (%)
Other 639 (42.2) 804 (36.5) 80 (45.7) 53 (25.5)
Caucasian 354 (23.4) 533 (24.2) 43 (24.6) 56 (26.9)
African American 357 (23.6) 688 (31.3) 37 (21.1) 79 (38)
Unknown 80 (5.3) 45 (2) —c —
Asian 77 (5.1) 102 (4.6) 10 (5.7) 11 (5.3)
Pacific Islander — — — —
Ethnicity, n (%)
Non-Hispanic/Latino 820 (54.2) 1377 (62.6) 98 (56) 139 (66.8)
Hispanic/Latino 421 (27.8) 556 (25.3) 50 (28.6) 43 (20.7)
Unknown 271 (17.9) 236 (10.7) 24 (13.7) 26 (12.5)
Age, median (IQR) 62.9 (50.7-73) 69.6 (53.3-80) 63.7 (51.2-73.8) 69.8 (55.5-79.9)
Age (years), n (%)
18-30 64 (4.2) 46 (2.1) 16 (9.1) —
31-40 155 (10.2) 113 (5.1) 13 (7.4) 12 (5.8)
41-50 165 (10.9) 160 (7.3) 14 (8) 17 (8.2)
51-60 291 (19.2) 341 (15.5) 33 (18.9) 35 (16.8)
61-70 394 (30) 517 (20) 40 (20) 39 (20)
71-80 258 (17) 522 (23.7) 41 (23.4) 52 (25)
81-90 142 (9.4) 396 (18) 13 (7.4) 38 (18.3)
≥90 45 (3) 106 (5) — —
Previous medical history, n (%)
Hypertension 64 (4.2) 46 (2.1) 63 (40) 83 (40)
Atrial fibrillation 155 (10.2) 113 (5.1) 13 (7) 21 (10)
Coronary artery disease 165 (10.9) 160 (7.3) 32 (20) 41 (20)
Heart failure 291 (19.2) 341 (15.5) 26 (10) 30 (10)
Stroke 394 (30) 517 (20) 16 (9) 10 (5)
Chronic kidney disease 258 (17) 522 (23.7) 32 (20) 43 (20)
Diabetes 142 (9.4) 396 (18) 40 (20) 54 (30)
Asthma 45 (3) 106 (5) 11 (6) —
Chronic obstructive pulmonary disease 64 (4.2) 46 (2.1) 13 (7) 11 (5)
Cancer 158 (10) 124 (6) 43 (20) 14 (7)
Vital signs at hospital admission, median (IQR)
Heart rate (beats per minute) 87 (77-97) 86 (76-98) 85 (74-97.5) 82 (72.8-96)
Pulse oximetry (%) 96 (94-97) 96 (94-98) 97 (95-98) 97 (96-98)
Respiration Rate (breaths per minute) 20 (18-21) 18 (18-20) 18 (18-20) 18 (18-20)
https://www.jmir.org/2020/11/e24018 J Med Internet Res 2020 | vol. 22 | iss. 11 | e24018 | p. 7
(page number not for citation purposes)
XSL• FO
RenderXJOURNAL OF MEDICAL INTERNET RESEARCH Vaid et al
Characteristic on admission Retrospective Prospective
MSHa (n=1514) OHb (n=2201) MSH OH
Temperature (ºF) 98.7 (98-99.9) 98.5 (97.7- 99.3) 98.1 (97.5-98.6) 97.9 (97.3-98.6)
Systolic blood pressure (mm Hg) 125 (112-140) 125 (111-140) 122 (111.5-138) 127 (112.8-141.2)
Diastolic blood pressure (mm Hg) 69 (61-78) 72 (64-80) 70 (60.5-78.5) 72 (64-82)
BMI (kg/m2) 28.1 (24.4-32.8) 27.5 (24.2-32.5) 25.92 (21.9-30.4) 27.7 (23.4-32.1)
a
MSH: Mount Sinai Hospital.
b
OH: other hospitals.
c
—: Values with fewer than 10 patients per field are censored to protect patient privacy.
https://www.jmir.org/2020/11/e24018 J Med Internet Res 2020 | vol. 22 | iss. 11 | e24018 | p. 8
(page number not for citation purposes)
XSL• FO
RenderXJOURNAL OF MEDICAL INTERNET RESEARCH Vaid et al
Table 2. Admission laboratory parameters of hospitalized patients with COVID-19 at baseline (N=4098), median (IQR).
Laboratory parameters Retrospective Prospective
MSHa (n=1514) OHb (n=2201) MSH OH
Metabolic markers
Sodium (mEq/L) 138 (135-140) 139 (136-142) 139 (136-141) 139 (136-141)
Potassium (mEq/L) 4 (3.6-4.5) 4.3 (3.9-4.7) 4 (3.7-4.4) 4.3 (3.8-4.6)
Creatinine (mg/dL) 0.91 (0.7-1.5) 1.01 (0.8-1.7) 0.89 (0.7-1.6) 1.12 (0.7-2.1)
Lactate (mg/dL) 1.8 (1.4-2.3) 1.4 (1.1-2) 1.8 (1.4-2.3) 1.49 (1-1.9)
Hematological markers
White blood cells (103/µL) 7 (5-10.2) 7.6 (5.5-10.9) 7.3 (5.1-10.7) 8.3 (6.3-11.9)
Lymphocyte percentage NA (NA-NA) 14.2 (8.6-21.3) NA (NA-NA) 14.7 (9.9-21.6)
Hemoglobin (mEq/L) 12.2 (10.7-13.5) 12.7 (11.1-13.9) 10.5 (9.1-12.8) 11.1 (9.2-12.8)
Red blood cell distribution width (%) 4.2 (3.7-4.6) 4.28 (3.8-4.7) 3.69 (3.1-4.3) 3.79 (3.2-4.5)
Platelets (n) 220 (165-291) 208 (158-281) 224 (166.2-304) 211 (149.2-285.2)
Liver function
Alanine aminotransferase (units/L) 30 (18-53) 31 (19-54) 26 (13.8-51) 23 (14-36)
Aspartate aminotransferase (units/L) 42 (28-66) 45 (30-74) 30 (20-50.5) 30 (19-49)
Albumin (g/dL) 2.9 (2.5-3.2) 2.9 (2.5-3.2) 2.9 (2.5-3.4) 2.9 (2.3-3.3)
Total bilirubin (mg/dL) 0.6 (0.4-0.8) 0.6 (0.4-0.8) 0.7 (0.4-1) 0.5 (0.4-0.7)
Coagulation markers
Prothrombin time (s) 14.5 (13.6-16) 14.9 (13.9-16.5) 14.8 (13.6-16.2) 15.05 (13.7-17.6)
Partial Thromboplastin time (s) 32.9 (29.2-38.5) 34.8 (30.3-41.5) 32.6 (28.8-37.8) 36.1 (31-45.9)
Gases
PCO2c (mmHg) 42 (37-47) 42 (37-53) 44 (39-49) 42 (37-48.5)
pH 7.4 (7.3-7.4) 7.36 (7.3-7.4) 7.39 (7.4-7.4) 7.36 (7.3-7.4)
Inflammatory markers
C-reactive protein (mg/L) 116.4 (57.1-199.5) 132.4 (65.8-218.9) 62.2 (17-148.9) 73.7 (33.5-181.8)
Ferritin (ng/mL) 800 (365-1916) 906 (438-2056) 485 (200.2-1031.5) 690 (303.5-1470.2)
D-dimer (ng/mL) 1.44 (0.8-3) 2.42 (1.2-4.4) 1.66 (0.9-3.1) 1.97 (1.1-3.8)
Creatinine phosphokinase (units/L) 146 (70-488) 220 (76.8-501.8) 194.5 (93.2-290.8) 271.5 (48.8-611.5)
Lactate dehydrogenase (units/L) 423 (315-571) 466.5 (356.2-652.2) 334 (251.5-472) 364 (266.8-487)
Cardiac markers
Troponin I (ng/mL) 0.05 (0-0.2) 0.064 (0-0.2) 0.05 (0-0.1) 0.0525 (0-0.1)
a
MSH: Mount Sinai Hospital.
b
OH: other hospitals.
c
PCO2: partial pressure of carbon dioxide.
missing data elements, performed marginally worse on every
Classifier Training and Performance outcome, with AUC-ROC values ranging from 0.80 to 0.82 and
We developed models based on cross-validation experiments AU-PRC values ranging from 0.10 to 0.40 (Figure 2, Multimedia
for all model types and conditions within the MSH at the earlier Appendix 6). Additionally, when trained with imputed data, the
time period of the study (ie, up to the enrollment date cutoff). XGBoost classifier performed worse, achieving AUC-ROC
On internal cross-validation for mortality prediction, the values from 0.80 to 0.84 and AU-PRC values from 0.18 to 0.40
unimputed XGBoost model demonstrated strong performance, across all time periods. In the case of internal validation for
with AUC-ROC values ranging from 0.84 to 0.90 and AU-PRC critical event prediction, the AUC-ROC values of the unimputed
values ranging from 0.33 to 0.48 (Multimedia Appendix 6). In XGBoost model ranged from 0.79 to 0.81, and the AU-PRC
comparison, LR and LASSO, after kNN imputation on the
https://www.jmir.org/2020/11/e24018 J Med Internet Res 2020 | vol. 22 | iss. 11 | e24018 | p. 9
(page number not for citation purposes)
XSL• FO
RenderXJOURNAL OF MEDICAL INTERNET RESEARCH Vaid et al
values ranged from 0.60 to 0.70. The performance for the values were between 0.36 and 0.50. In contrast, the performance
LASSO and LR models with imputation was poorer, with of the LR and LASSO models over the same conditions was
AUC-ROC values of 0.75 to 0.77 and AU-PRC values of 0.54 poorer overall, with ranges of 0.65 to 0.74 for the AUC-ROC
to 0.65. and 0.31 to 0.46 for the AU-PRC. The imputed XGBoost model
again performed slightly worse than the unimputed XGBoost
We then assessed the performance of these models in three
model, with AUC-ROC values from 0.71 to 0.77 and AU-PRC
validation experiments: in OH within the same time period,
values between 0.31 and 0.48. Prospective validation at MSH
within the same hospital (MSH) at a future time period, and in
presented a new set of challenges for all the models because of
OH at a future time period. The unimputed XGBoost AUC-ROC
the generally lower number of outcomes and larger class
generally showed the best performance for mortality prediction
imbalance for mortality prediction for the shorter time intervals.
across intervals ranging from 0.84 to 0.88, with AU-PRC values
For mortality prediction overall, the AUC-ROC values of the
ranging from 0.44 to 0.64. For LR and LASSO, the AUC-ROC
unimputed XGBoost model ranged from 0.85 to 0.96, and the
values ranged from 0.82 to 0.83, while the AU-PRC values
AU-PRC values ranged from 0.32 to 0.55. The LR and LASSO
ranged from 0.22 to 0.58. The imputed XGBoost continued to
models showed much poorer performance, with AUC-ROC
perform slightly worse, with AUC-ROC values ranging from
values ranging from 0.44 to 0.85 and AU-PRC values ranging
0.72 to 0.83 and AU-PRC values ranging from 0.17 to 0.60.
from 0.01 to 0.41. The imputed XGBoost model also performed
For critical event prediction across all time intervals, the
worse than the unimputed XGBoost model, with AUC-ROC
AUC-ROC values of the unimputed XGBoost model ranged
values of 0.82 to 0.88 and AU-PRC values of 0.04 to 0.50. For
from 0.78 to 0.81, while the AU-PRC values ranged from 0.51
prediction of critical events, the AUC-ROC values of the
to 0.69. Performance of LR and LASSO was marginally worse,
unimputed XGBoost model were between 0.72 and 0.78, and
with ranges of 0.74 to 0.81 for the AUC-ROC and 0.44 to 0.70
its AU-PRC values were between 0.40 and 0.54. The
for the AU-PRC. The performance of imputed XGBoost was
performance of the LR and LASSO models in the same set of
similar to that of unimputed XGBoost, with AUC-ROCs ranging
experiments was slightly poorer, with ranges of 0.66 to 0.75 for
from 0.76 to 0.82 and AU-PRCs ranging from 0.49 to 0.71.
the AUC-ROC and 0.32 to 0.48 for the AU-PRC. The imputed
Similarly, in prospective validation at OH for mortality XGBoost model performed marginally worse than the unimputed
prediction across all time intervals, the AUC-ROC values of XGBoost model, with values of 0.71 to 0.77 for the AUC-ROC
the unimputed XGBoost model ranged from 0.68 to 0.88, while and 0.42 to 0.50 for the AU-PRC.
the AU-PRC values ranged from 0.13 to 0.31. The performance
Model calibration as measured by Brier scores improved after
of the LR and LASSO models in the same experiments was
either sigmoid or isotonic calibration across all time windows.
much poorer in terms of AUC-ROC, with values ranging from
For the unimputed XGBoost model, isotonic calibration
0.51 to 0.74, and at par with the unimputed XGBoost model in
performed better than sigmoid calibration, with Brier scores
terms of AU-PRC, with values ranging from 0.13 to 0.34.
ranging from 0.124 to 0.161 for critical event prediction and
Imputed XGBoost performed worse overall, with AUC-ROC
from 0.019 to 0.085 for mortality prediction. Sigmoid calibration
values ranging from 0.66 to 0.81 and AU-PRC values between
only slightly outperformed isotonic calibration for critical event
0.06 and 0.21. In the case of prospective validation for critical
prediction at 10 days (Brier scores of 0.160 vs 0.161,
event prediction at OH, the AUC-ROC values of the unimputed
respectively).
XGBoost model ranged from 0.74 to 0.77, and the AU-PRC
https://www.jmir.org/2020/11/e24018 J Med Internet Res 2020 | vol. 22 | iss. 11 | e24018 | p. 10
(page number not for citation purposes)
XSL• FO
RenderXJOURNAL OF MEDICAL INTERNET RESEARCH Vaid et al
Figure 2. Comparison of the performance of the XGBoost and baseline models. Performance of the XGBoost classifier by ROC curves (left) and PR
curves (right) on the unimputed data set (red) for mortality (top) and critical event (bottom) prediction versus the three baseline models: XGBoost
classifier on the imputed data set (purple), LASSO (green), and LR (orange). LASSO: least absolute shrinkage and selection operator; PRC: precision-recall
curve; ROC: receiver operating characteristic; XGB: Extreme Gradient Boosting.
where levels of LDH, glucose, and C-reactive protein were
Model Feature Importance strong covariates. As a comparison, we also assessed the feature
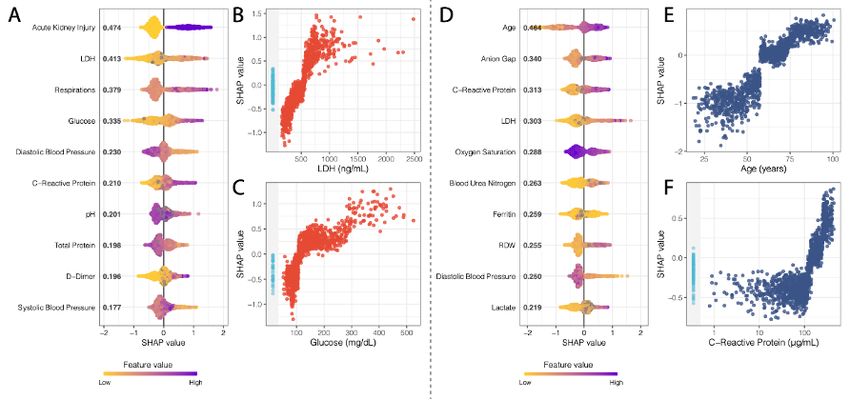
Mean absolute SHAP values [32] were calculated for each importance for the LASSO model for these experiments (Figure
XGBoost model in the internal validation data set (Figure 3). S9 in Multimedia Appendix 2). We saw an overlap of key
For critical event prediction, the presence of acute kidney injury features that both models considered important in their
and both high and low levels of lactate dehydrogenase (LDH), predictions for both critical event and mortality prediction at 7
respiratory rate, and glucose were strong drivers for predicting days. For critical events, we found that AKI was the most
a critical event within one week. Other notable drivers of important feature in both models. Higher respirations and
predictability included both systolic and diastolic blood pressure, D-dimer levels were also associated with higher mortality, and
pH, total protein levels, C-reactive protein, and D-dimer. For lower diastolic blood pressure was negatively associated. For
mortality, both high and low values for age, anion gap, mortality, we also saw strong concordance in key features
C-reactive protein, and LDH were the strongest effectors in between both models. Specifically, older age and higher anion
guiding mortality prediction within one week of admission. gap were strong contributors to mortality prediction in both
Other important variables for increasing the prediction of death models, and lower diastolic blood pressure and oxygen
included oxygen saturation on intake admission, blood urea saturation were negatively associated with mortality. It is
nitrogen, ferritin, red cell distribution width (RDW), diastolic encouraging that many of the features with high importance in
blood pressure, and lactate. Finally, using SHAP interaction the primary XGBoost model were also prioritized in the LASSO
scores, we discovered that covariate interactions between classifier, suggesting the robustness of the predictive ability of
features contributed less to the predictions of the models than these features. The top 10 features for the Critical Event and
the independent importance of each feature (Figures S11 and Mortality models at seven days are enumerated in Multimedia
S12 in Multimedia Appendix 2), except for the case of AKI, Appendix 7.
https://www.jmir.org/2020/11/e24018 J Med Internet Res 2020 | vol. 22 | iss. 11 | e24018 | p. 11
(page number not for citation purposes)
XSL• FO
RenderXJOURNAL OF MEDICAL INTERNET RESEARCH Vaid et al
Figure 3. Performance of the XGBoost classifier by ROC curves (left) and precision-recall curves (right) for mortality (top) and critical events (bottom)
in validation experiments of generalizability and time. For generalizability, we show our XGBoost model from cross-validation on MSH and applied
to all other hospitals. We also show the performance of the model on prospective patients who were unseen at the time of the original experiment at
MSH and all other hospitals in the same time frame. Ext. Val.: external validation; Int. Val.: internal validation; MSH: Mount Sinai Hospital; OH: other
hospitals; PRC: precision-recall curve; Prosp. Val: prospective validation; ROC: receiver operating characteristic.
deriving this claim, as the AU-PRC includes both precision (ie,
Discussion positive predictive value) and recall (ie, sensitivity) and thus
Principal Findings accounts for the class imbalance, which the AUC-ROC metric
generally ignores. Overall, we found that the unimputed
In this work, we performed a series of experiments with the XGBoost model performed better not only in internal validation
goal of using machine learning to predict in-hospital mortality but in the vast majority of the other validation experiments. As
or critical events from admission for patients with COVID-19. such, we believe it can be generalized more readily than the
We highlight several important findings with implications for other models to new cohorts and time points. Along these lines,
clinical medicine. First, we offer a robust prediction algorithm we found that our imputation strategy generally hindered the
pertaining to the most clinically severe outcomes based solely performance of the XGBoost model. There were instances where
on admission metrics, which maintains its training performance the XGBoost model performed approximately the same (within
in both external and prospective validation experiments. Most the bounds of the confidence intervals) or worse than the other
notably, the high specificity in predicting mortality within 3, 5, comparators for different metrics. For instance, in the
and 7 days of admission (AU-PRCs of 0.91 to 0.97) suggests a prospective OH experiment for predicting critical events within
role of the algorithm in augmenting clinicians’ decision-making 7 and 10 days, the LASSO method outperformed the unimputed
when identifying patients at immediate risk of impending XGBoost model in terms of AUC-ROC and AU-PRC. In the
clinical decompensation and potential in guiding allocation of 7-day condition, however, the imputed XGBoost model actually
more intensive care upon admission. Finally, the impact of the performed the best overall, which suggests that the imputation
large class imbalance and missingness on model training and strategy worked better in this particular scenario. Additionally,
performance can be appreciated when comparing mortality in the prospective OH experiment, the unimputed XGBoost
predictions at 3 days. On the non-imputed data set, the XGBoost model underperformed compared to the other models for
classifier achieves a remarkably higher AU-PRC (0.44) mortality prediction; however, we believe this was due to the
compared to the models using imputed data (0.14 for LR and extremely low positive prevalence. Thus, while XGBoost makes
LASSO, 0.12 for XGBoost imputed). It is important to note the assumptions on how it handles missing data, we found that
consideration of the AU-PRC instead of the AUC-ROC for
https://www.jmir.org/2020/11/e24018 J Med Internet Res 2020 | vol. 22 | iss. 11 | e24018 | p. 12
(page number not for citation purposes)
XSL• FO
RenderXJOURNAL OF MEDICAL INTERNET RESEARCH Vaid et al
XGBoost without imputation was the more robust method in COVID-19–induced hypercoagulable states in these patients
these experiments. Furthermore, this strategy is conducive to [41,45,46], it is promising that our model recognized the feature
implementation into clinical operations, as it removes the need importance of coagulability markers such as D-dimer (Figure
for an intermediary imputation step. 4). Thus, this corroboration of the features learned by XGBoost
and highlighted by the SHAP analysis with the findings from
Additionally, our framework permits a clinically relevant
pathophysiological principles and more recent correlative studies
understanding of the most salient features of the unimputed
exploring patients with COVID-19 [2,3,9,25,26,47,48] gives
XGBoost model, defining its decision boundaries using patients
additional credibility to these findings. Additionally, when we
from the holdout set during internal validation (Figure 4). At 7
compared these features to those that were ranked highly for
days, age was the most important feature for mortality prediction
the LASSO model, we found many concordant features with
in COVID-19–positive patients, with a notably rapid and
the same direction of effect; this further strengthens the evidence
nonlinear increase of feature contribution with increasing age
of the utility of these features in predictive models (Figure S9
(Figure 4) [33,34]. Hyperglycemia, particularly in the ranges
in Multimedia Appendix 2).
that catered to positive predictions (Figure 4C), may serve as
proxies for either metabolic syndrome, diabetic ketoacidosis, Just as interesting as the most important features identified for
or hyperosmolar hyperglycemic state predisposition from classification by XGBoost are the features that were not
underlying diabetes, which have previously also been reported prioritized (ie, much lower mean absolute SHAP values). For
and associated with poorer outcomes in COVID-19–positive example, race is a social construct that at best serves as a proxy
patients [35-37]. The higher information content in continuous for the social disparities leading to infection risk at the
values such as glucose levels and their larger role in the level population level, and it is also related to the distribution of
of control of diabetes is a likely explanation for why diabetes, comorbid conditions that potentiate disease severity.
as a comorbidity, failed to be a strong driver of prediction. The Furthermore, race is both poorly represented (including a
demonstration of the anion gap, in conjunction with high levels category for “Unknown”) and inadequately characterized in the
of lactate, as another strong model influencer for mortality EHR. While race, in and of itself, potentially carries a large
prediction is likely linked with potential ongoing elevated amount of information because it inadvertently represents the
anion-gap metabolic acidosis from a brewing severe very societal inequities that lead to poorer outcomes (ie,
inflammatory response syndrome or sepsis picture [38]. structural racism as a contributor to COVID-19 health
Elevation in serum LDH is a nonspecific marker of disparities), the model instead chose to prioritize more objective
inflammation; however, it is implicated in pulmonary endothelial markers of health status (laboratory values, vital signs,
cell injury and in COVID-19–positive patients [39-41]. AKI comorbidities) that more directly represent the deeper biology
has been reported in patients with severe COVID-19 and, if of the risk factors and state of disease severity leading to these
present early, may be a strong indicator of future critical events adverse outcomes. Contrary to our expectation, age was not
[42,43]. The covariate relationship between LDH, CRP, and identified as a significant feature for critical event prediction
glucose may reflect underlying severe inflammation and within 7 days in the primary analyses. This suggests that the
deranged metabolism, which may be contributing to the AKI. model decided to capture acute critical events by relying on
Elevated RDW, which may be an index of enhanced patient more objective measures that are not confounded by other
frailty and risk of adverse outcomes [35], was also a strong factors that are cached into age, which may better represent
driver of mortality. Additionally, vital sign instability (low illness severity and more irreversible outcomes (ie, death). Age
oxygen saturation, tachypnea, hypotension), elevated ferritin may then be a better marker for mortality by offering a more
[41,44], high lactate, and acidosis were contributors to driving stable container of clinical information, given its invariance to
model predictions toward mortality. With growing evidence of change relative to other features.
https://www.jmir.org/2020/11/e24018 J Med Internet Res 2020 | vol. 22 | iss. 11 | e24018 | p. 13
(page number not for citation purposes)
XSL• FO
RenderXJOURNAL OF MEDICAL INTERNET RESEARCH Vaid et al
Figure 4. SHAP summary plots for critical event (A) and mortality (D) at 7 days showing the SHAP values for the 10 most important features for the
respective XGBoost models. Features in the summary plots (y-axis) are organized by their mean absolute SHAP values (x-axis), which represent the
importance of the features in driving the prediction of the classifiers for patients. (B) and (C) Dependency plots demonstrating how different values can
affect the SHAP score and ultimately impact classifier decisions for LDH and glucose, respectively, for critical event prediction. (E) and (F) Dependency
plots for age and C-reactive protein levels. Patients with missing values for a feature in the dependency plot are clustered in the shaded area to the left.
LDH: lactate dehydrogenase; RDW: red cell distribution width; SHAP: SHapley Additive exPlanation.
justifications for including a future time point. Despite a certain
Limitations dip in overall performance for the unimputed XGBoost model,
The results of our models should be considered in light of which we attribute to heavy imbalance of outcomes and
several limitations. First, we based our predictions solely on extremely low prevalence rates, we were overall encouraged
data extracted around patient admission (ie, within 36 hours). by its performance. Furthermore, inherent limitations exist when
This step was added purposefully to remove potential bias from using EHRs, especially those integrated from multiple hospitals.
effects of hospital workflow, and we found that it did not cause To facilitate timely dissemination of our results, we chose not
another source bias relating to informed missingness (see to manually chart review patient notes that may have otherwise
Multimedia Appendices). No information from the future was provided additional potential features, such as symptoms and
leaked into this prediction. Although the restriction of using clinical course, to incorporate in our model. Because all five
data at admission encourages the use of this model in patient hospitals operate in a single health system, system-wide
triage, events during a patient’s hospital stay after admission protocols in laboratory order sets and management protocols
may drive their clinical course away from the prior probability, were an additional source of bias that may lower external
which cannot be captured by baseline admission features. We validity. Other interhospital effects, such as shuttling COVID-19
believe a “live” or continuously updating modelling approach cases to certain hospitals to balance system-wide patient burden,
would be better suited for this as a future direction. Furthermore, may also imbalance case severity across hospitals and care
not all patient laboratory values are drawn at admission, which management between hospitals. This was ultimately a major
introduces an element of missingness in our data set. For reason to restrict the model training to a single center and
example, unlike the general patient population, patients on perform testing in other hospital centers. Additionally, in this
anticoagulation therapy, who likely have comorbidities paper, we present outcome classification derived from a learned
increasing their baseline risk, will have coagulation laboratory optimization threshold cutoff. Further work is needed to identify
tests (prothrombin time, partial thromboplastin time) performed clinically relevant thresholds for classifying predicted
on admission. We attempted to mediate this issue by including probabilities. Finally, although XGBoost is superior to other
a missingness threshold cutoff, assessing model performance models in handling missing data, a notable drawback is its bias
with imputation, and not including any laboratory test that was toward continuous features instead of categorical ones [49].
specific to an intervention (ie, arterial laboratory tests performed However, collinearities between some categorical features in
in the ICU). Additionally, patients admitted to the hospital later this data set may be present with other continuous features, as
in the crisis benefited from improved patient care protocols exhibited by the covariance strength between hypertension and
from experiential learning but were also negatively affected by systolic blood pressure and creatinine in Figure S1 in
resource constraints from overburdened hospitals. These effects Multimedia Appendix 2, which can then serve as vehicles for
may also induce temporal variation between patient outcomes, capturing these categorical pieces of information.
which is demonstrated by the lower critical event and mortality
rate in the prospective validation data set. However, determining
the models’ performance in this scenario was one of the
https://www.jmir.org/2020/11/e24018 J Med Internet Res 2020 | vol. 22 | iss. 11 | e24018 | p. 14
(page number not for citation purposes)
XSL• FO
RenderXJOURNAL OF MEDICAL INTERNET RESEARCH Vaid et al
Conclusions outcomes. Our externally and prospectively validated models
The COVID-19 pandemic unequivocally represents an successfully predict critical illness and mortality up to 10 days
unprecedented public health crisis. Health care institutions are in advance in a diverse patient population from admission
facing extreme difficulties in managing resources and personnel. information alone. We believe that this model also identified
Physicians are treating record numbers of patients and are important markers for acute care prognosis that can be used by
continuously exposing themselves to a highly contagious and health care institutions to improve care decisions at both the
virulent disease with varying symptomatology. Only a few physician and hospital level for management of
therapeutic options have demonstrated improvement in patient COVID-19–positive patients.
Acknowledgments
This work was supported by U54 TR001433-05, National Center for Advancing Translational Sciences, National Institutes of
Health. This work was supported in part through the computational and data resources and staff expertise provided by Scientific
Computing at the Icahn School of Medicine at Mount Sinai, notably Sharon Nirenberg. We thank Marcus Badgeley for his
assistance with final editing. We would like to dedicate this effort to Mount Sinai Health System care providers for their hard
work and sacrifice.
Authors' Contributions
BSG, GNN, AWC, and ACJ conceived and designed the study. AV, SS, JKDF, FFC, IP, KWJ, SJL, RM, MD, SZ, FR, NDB,
NN, AK, and PT collected the data. PG, EG, MS, DM, PK, JF, RMF, EA, AK, JAA, EB, CRH, BM, EJN, EES, JHC, CCC, VF,
DSC, RLR, EPB, MAL, JN, and ZAF facilitated data infrastructure and access. AV, SS, AJK, JKDF, FFC, IP, KWJ, SJL, RM,
SZ, FR, NDB, NN, and FR were involved in data analysis. AV, SS, AJK, JKDF, FFC, IP, KWJ, SJL, RM, SZ, FR, NDB, NN,
FR, KA, AK, PM, AL, MP, PFO, LHH, BP, and MAL were involved in interpreting the results. AV, SS, AJR, JKDF, FR, NN,
ACJ, GNN, and BSG drafted the initial manuscript. ACJ, AWC, GNN and BSG served as co-corresponding authors. All authors
provided critical comments and edited, revised, and approved the manuscript in its final form for submission.
Conflicts of Interest
SS is a cofounder and equity owner of Monogram Orthopedics. KWJ received fees from and holds equity in Tempus Labs. JAA
received research grants and personal fees from Gilead, Merck, Janssen, and Viiv; personal fees from Medicure and
Theratechnologies; and research grants from Atea, Pfizer and Regeneron, all outside of the submitted work. ES is the founding
CEO and equity owner of Sema4.
Multimedia Appendix 1
Supplementary Table 1: Final XGBoost, LASSO and logistic regression model hyperparameters.
[DOCX File , 15 KB-Multimedia Appendix 1]
Multimedia Appendix 2
Supplementary figures.
[DOCX File , 1913 KB-Multimedia Appendix 2]
Multimedia Appendix 3
Supplementary Table 2: Brier scores for each model and calibration type.
[DOCX File , 20 KB-Multimedia Appendix 3]
Multimedia Appendix 4
Supplementary Table 3: TRIPOD guidelines.
[DOCX File , 22 KB-Multimedia Appendix 4]
Multimedia Appendix 5
Supplementary Table 4: Baseline feature variability across all patients.
[DOCX File , 35 KB-Multimedia Appendix 5]
Multimedia Appendix 6
Supplementary Table 5: Model performance by experiment.
[DOCX File , 26 KB-Multimedia Appendix 6]
https://www.jmir.org/2020/11/e24018 J Med Internet Res 2020 | vol. 22 | iss. 11 | e24018 | p. 15
(page number not for citation purposes)
XSL• FO
RenderXYou can also read