From Cradle to Cane: The Cost of Being a Female Consumer - A Study of Gender Pricing in New York City - NYC.gov
←
→
Page content transcription
If your browser does not render page correctly, please read the page content below
From Cradle to Cane:
The C st of Being a
Female C nsumer
A Study of Gender Pricing in New York City

                 Consumer
                 Affairs

Bill de Blasio   Julie Menin
Mayor            Commissioner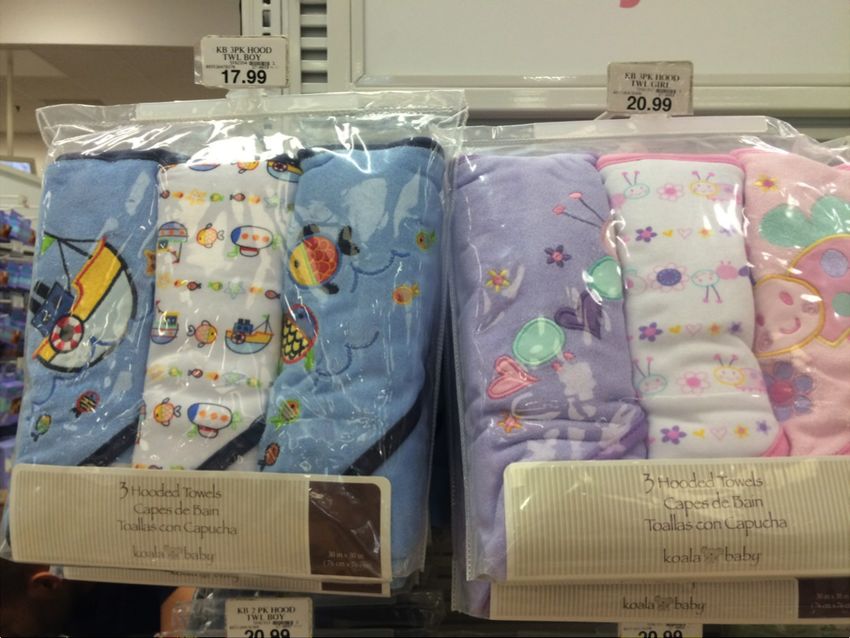
From Cradle to Cane:
The Cost of Being a Female Consumer
A Study of Gender Pricing in New York City
Bill de Blasio
Mayor

Julie Menin
Commissioner

© December 2015. New York City Department of Consumer Affairs.
All rights reserved.

                                        2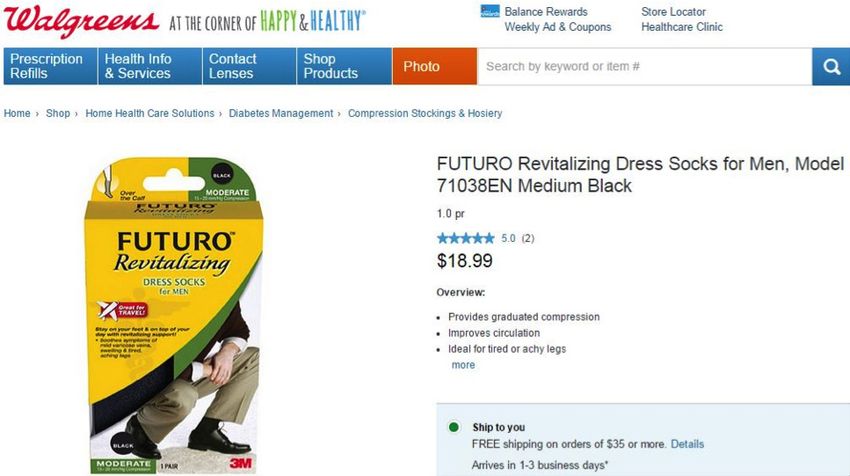
Acknowledgments
The Department of Consumer Affairs (DCA) acknowledges the author of this report, Anna Bessendorf,
Policy Analyst, and its editor, Shira Gans, Senior Policy Director.

DCA would also like to acknowledge the following staff for their contributions: Sandra Abeles, Deputy
Chief of Staff; Silvia Alvarez, Acting Associate Commissioner for Communications and Marketing;
Amit Bagga, Deputy Commissioner for External Affairs; Yi Seul Chun, Creative Specialist; Debra Halpin,
Assistant Commissioner for Creative Services; Eli Jacobs, Senior Analyst, Quality and Data Management;
Abigail Lootens, Director of Communications & Marketing; Matthew Petric, Executive Director of
Analysis and Strategic Planning; Alba Pico, First Deputy Commissioner; and Carla Van de Walle, Deputy
Commissioner for Finance and Administration.

DCA also thanks the experts who lent their knowledge to this study: Michael Cone, Managing Partner of
FisherBroyles, LLP; Ingrid Johnson, Acting Associate Chairperson for the Home Products Development
Department, Fashion Institute of Technology; Dr. Gary Kelm, Professor and Director, James L. Winkle
College of Pharmacy, University of Cincinnati; Robin Litwinsky, Chairperson of the Fashion Business
Management Department, Fashion Institute of Technology; and Nancy Youman, Co-Director of the
Program on Independent Journalism, Open Society Foundations.

                                                    3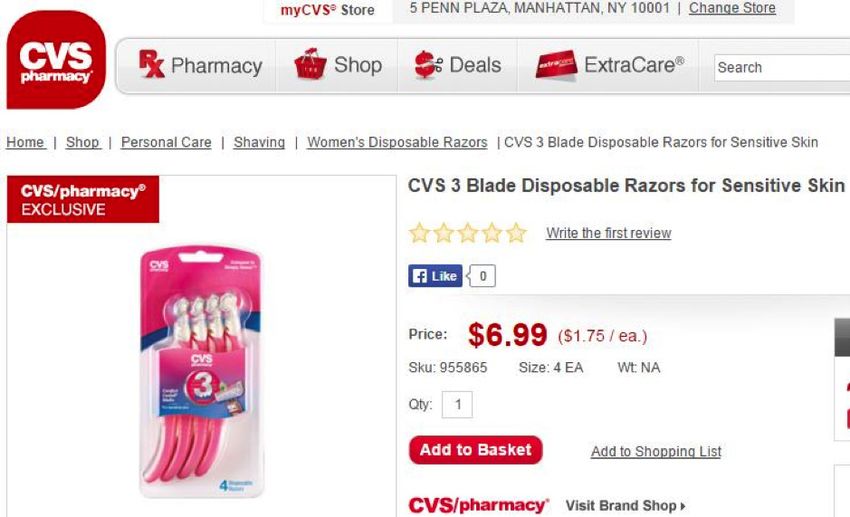
Table of Contents
Executive Summary 5
       Methodology 5
       Findings 5
       Impact 6
       Detailed Industry Findings 7
I.     Introduction 15
          Report Objectives 15
          Historical Context 15
II.    Study Methodology 17
          Cradle-to-Cane Focus 17
          Retailer Selection 17
          Product Selection 17
          Price Comparisons 19
          Price Analyses 20
          Limitations 20
III.   Main Findings 21
         Toys and Accessories 21
         Children’s Clothing 24
         Adult Clothing 28
         Personal Care Products 33
         Senior/Home Health Care Products 36
IV.    Conclusion 40
V.     Appendix 41

                                               4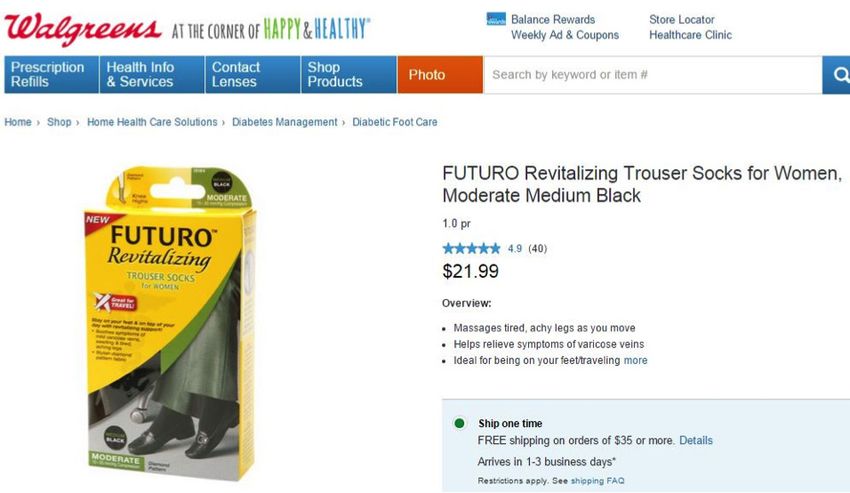
Executive Summary
The New York City Department of Consumer Affairs (DCA) is responsible for maintaining a fair and vibrant
marketplace. To this end, DCA conducted a first-ever study of the gender pricing of goods in New York
City across multiple industries. The industries studied for this report include: toys and accessories, children’s
clothing, adult clothing, personal care products, and home health care products for seniors. This study reflects
an average consumer lifecycle, from baby to senior products, providing a glimpse into the experiences of
consumers of all ages.

The Agency compared nearly 800 products with clear male and female versions from more than 90 brands
sold at two dozen New York City retailers, both online and in stores.

Methodology
The goal of the study was to estimate the price differences male and female shoppers face when buying the
same types of items. DCA derived an average price for 35 different product types based on an analysis of 794
individual items and then compared the prices of the analogous men’s and women’s products. To minimize
differences between men’s and women’s items, the Agency selected products that had similar male and female
versions and were closest in branding, ingredients, appearance, textile, construction, and/or marketing.

For this study, DCA analyzed:
         •       Industries: 5
         •       Stores: 24
         •       Brands: 91
         •       Product Categories: 35
         •       Products: 794

Findings
On average, across all five industries, DCA found that women’s products cost 7 percent more than similar
products for men. Specifically:
        •       7 percent more for toys and accessories
        •       4 percent more for children’s clothing
        •       8 percent more for adult clothing
        •       13 percent more for personal care products
        •       8 percent more for senior/home health care products

In all but five of the 35 product categories analyzed, products for female consumers were priced higher than
those for male consumers. Across the sample, DCA found that women’s products cost more 42 percent of
the time while men’s products cost more 18 percent of the time.

                                                        5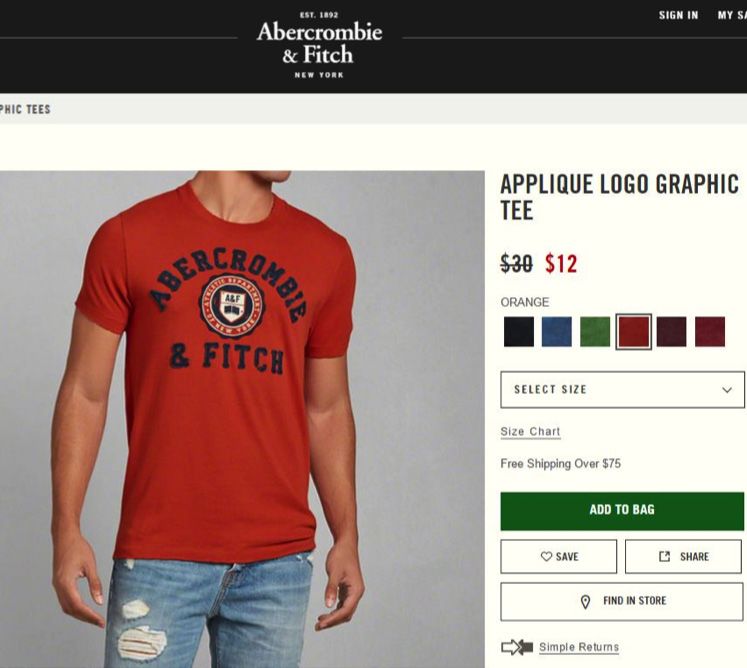
Table 1: Pricing Disparity Frequency Chart, All Industries

                     Total                              Number of Times             Incidence

                     Women pay more                                   168                   42%

                     Equal                                            157                   40%

                     Men pay more                                     72                    18%

                     Total                                            397                   100%

   In every industry, products for female consumers were more likely to cost more. Specifically:
           •        Girls’ toys cost more 55 percent of the time, while boys’ toys cost more 8 percent of
   		the time.
           •        Girls’ clothing cost more 26 percent of the time, while boys’ clothing cost more 7 percent
   		               of the time.
           •        Women’s clothing cost more 40 percent of the time, while men’s clothing cost more
   		               32 percent of the time.
           •        Women’s personal care products cost more 56 percent of the time, while men’s products
   		               cost more 13 percent of the time.
           •        Senior home health care products cost more for women 45 percent of the time and cost
   		               more for men 13 percent of the time.

   Impact
   Over the course of a woman’s life, the financial impact of these gender-based pricing disparities is significant.
   In 1994, the State of California studied the issue of gender-based pricing of services and estimated that
   women effectively paid an annual “gender tax” of approximately $1,351 for the same services as men.1
   While DCA’s study does not estimate an annual financial impact of gender pricing for goods, the findings
   of this study suggest women are paying thousands of dollars more over the course of their lives to purchase
   similar products as men.

   Though there may be legitimate drivers behind some portion of the price discrepancies unearthed in this
   study, these higher prices are mostly unavoidable for women. Individual consumers do not have control over
   the textiles or ingredients used in the products marketed to them and must make purchasing choices based
   only on what is available in the marketplace. As such, choices made by manufacturers and retailers result in a
   greater financial burden for female consumers than for male consumers.

   DCA encourages consumers to join DCA’s social media campaign to address this issue by tweeting examples
   of gender pricing and fair pricing with #genderpricing.

   1
       CA State Senate 1995, Gender Tax Repeal Act of 1995, AB 1100. Aug 31, 1995

                                                                            6
Detailed Industry Findings
Toys and Accessories
Across the six product categories of toys and accessories, products for girls were consistently priced higher
than those for boys. On average, the largest price discrepancy was in helmets and knee/elbow pads, with girls’
versions priced 13 percent higher. The smallest discrepancy was between girls’ and boys’ backpacks; girls’
items were priced at less than a 1 percent premium. See Table 2 for a detailed breakdown.

Table 2: Price Breakdown, Toys and Accessories

    Product                           Number of            Girls’              Boys’               Price                Percent
                                      Products*            Average             Average             Difference           Difference
    Bikes and Scooters                        22               $86.72              $81.90                $4.82                   6%

    General Toys                              20               $29.49              $26.49                $3.00                   11%

    Backpacks                                20                $25.99              $25.79                $0.20                   0.8%

    Preschool Toys                           14                $21.65              $19.85                $1.80                   9%

    Helmets and Pads                         20                $25.79              $22.89                $2.90                   13%

    Arts and Crafts                          10                $32.79              $30.59                $2.20                   7%

    Total                                    106               $222.43            $207.51               $14.92                   7%

*Each gender has an equal split of the total number of products in this column.

Figure 1: Example, Bikes and Scooters2

2
    Retrieved from http://www.target.com/p/radio-flyer-girls-my-1st-scooter-sparkle-pink/-/A-14168217#prodSlot=medium_1_28 and
    http://www.target.com/p/radio-flyer-my-1st-scooter-sport-red/-/A-14168218#prodSlot=medium_1_59 on 10/05/2015.

                                                                       7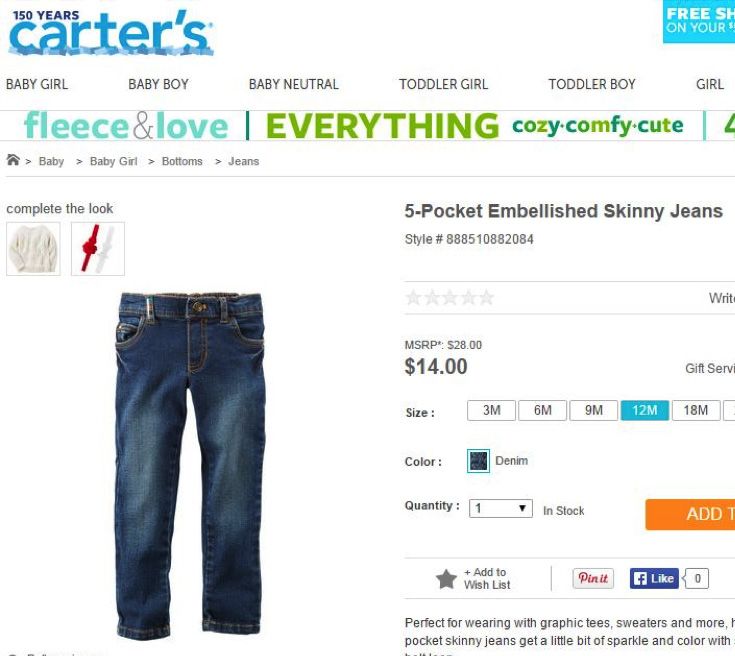
Figure 2: Example, Helmets and Pads3

Children’s Clothing
Of the five industries studied, children’s clothing was priced the most similarly. On average, girls’ clothing
cost 4 percent more, the lowest percent difference of any category. Girls’ items cost more in seven of nine
product categories. Though girls’ shirts cost 13 percent more on average, products like onesies, baby shirts,
and baby shoes were priced less than 5 percent higher than analogous products for boys. See Table 3 for a
complete breakdown.

Table 3: Price Breakdown, Children’s Clothing

    Products                          Number of           Girls’              Boys’               Price                Percent
                                      Products*           Average             Average             Difference           Difference
    Children’s Shirts                        20                $15.82             $13.95                $1.87                  13%

    Children’s Jeans                         20                $24.63             $22.83                $1.80                  8%

    Baby Pants                               20                $18.33             $16.77                $1.56                  9%

    Onesies                                  20                $20.91             $20.07                $0.84                  4%

    Baby Sweaters                            20                $24.87             $23.39               $1.48                   6%

    Baby Shirts                              20                $12.58             $12.38               $0.20                   2%

    Baby Shoes                               20                $20.69             $20.07               $0.62                   3%

    Children’s Underwear                     20                $17.67             $18.17               ($0.50)                 3%

    Toddler Shoes                             8                $28.85             $29.60               ($0.75)                 3%

    Total                                   168               $184.35             $177.23              $7.12                   4%

*Each gender has an equal split of the total number of products in this column.

3
    Retrieved from http://www.target.com/p/raskullz-unicorn-ride-alongz-toddler-helmet/-/A-16713916#prodSlot=medium_1_18 and
    http://www.target.com/p/raskullz-shark-attax-ride-alongz-toddler-helmet/-/A-16713915#prodSlot=medium_1_1 on 10/16/2015.

                                                                      8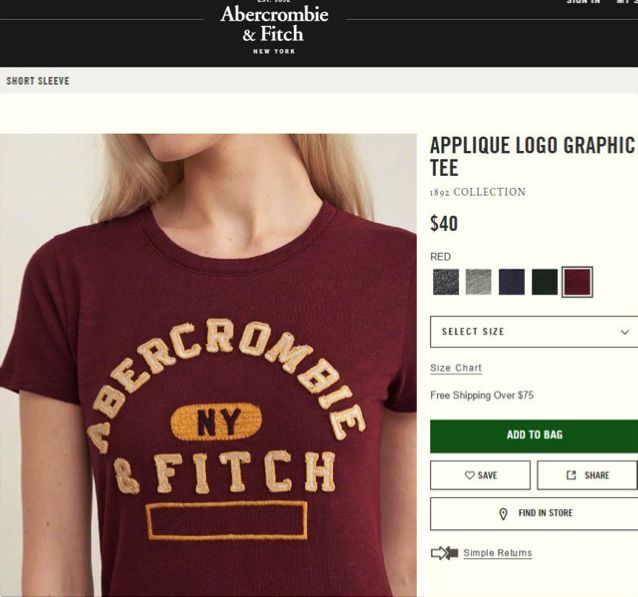
Figure 3: Example, Children’s Shirts4

Adult Clothing
Women’s clothing cost more than men’s in six of seven categories, with the exception of underwear, which
cost an average of 29 percent more for men. The clothing product category that had the largest price
difference by percent was women’s shirts, which cost 15 percent more on average than men’s shirts. See
Table 4 for a detailed breakdown.

Table 4: Price Breakdown, Adult Clothing

    Products                            Number of             Women’s               Men’s                Price                 Percent
                                        Products*             Average               Average              Difference            Difference
    Dress Pants                                 40                 $75.66               $71.71                 $3.95                   6%

    Dress Shirts                                40                 $58.11               $51.46                 $6.65                  13%

    Sweaters                                    42                 $63.19               $59.45                 $3.74                   6%

    Jeans                                       50                 $62.75               $57.09                 $5.66                  10%

    Shirts                                      40                 $29.23               $25.51                 $3.72                  15%

    Socks                                       40                  $9.98                $9.73                 $0.25                   3%

    Underwear                                   40                  $8.46               $10.90                ($2.44)                 29%

    Total                                      292                $307.38               $285.85               $21.53                   8%

*Each gender has an equal split of the total number of products in this column.

4
    Retrieved from http://www.childrensplace.com/shop/us/p/girls-clothing/girls-tops-girls-shirts/girls-tops-shirts-short-sleeve-tops/Uniform-Short-
    Sleeve-Classic-Polo-2043376-6B and http://www.childrensplace.com/shop/us/p/boys-clothing/boys-tops-and-boys-shirts/boys-tops-and-boys-
    shirts-short-sleeve-tops/Short-Sleeved-Uniform-Polo-2043171-1027 on 11/19/2015.

                                                                           9
Figure 4: Example, Jeans5

                                                    Men’s Jeans, $68

                                                                                                Women’s Jeans, $88

Figure 5: Example, Shirts6

5
  Retrieved from http://www.levi.com/US/en_US/womens-jeans/p/178040027?abTest=true and http://www.levi.com/US/en_US/mens-jeans/
  p/181730014?abTest=true on 10/15/2015.
6
  Retrieved from http://www.abercrombie.com/shop/us/womens-short-sleeve-graphic-tees/applique-logo-graphic-tee-5250574?ofp=true and
  http://www.abercrombie.com/shop/us/mens-heritage-graphic-tees/distressed-applique-logo-graphic-tee-5043573?ofp=true on 10/15/2015.

                                                                  10
Personal Care Products
Of all the industries analyzed, personal care had the highest premium for women, with products costing, on
average, 13 percent more than personal care products for men. Because personal care products are purchased
at a higher frequency than the other consumer goods included in this study, this 13 percent difference trans-
lates into a significant financial burden for women over the course of a lifetime.7 8 The largest price discrep-
ancy was in hair care; products cost women 48 percent more. Razor cartridges were the second largest price
discrepancy, at 11 percent more for women on average. See Table 5 for a complete breakdown.
Table 5: Price Breakdown, Personal Care Products
Products Number of Women’s Men’s Price Percent
Products* Average Average Difference Difference
Shampoo and 16 $8.39 $5.68 $2.71 48%
Conditioner (Hair Care)
Razor Cartridges 18 $17.30 $15.61 $1.69 11%
Razors 20 $8.90 $7.99 $0.91 11%
Lotion 10 $8.25 $7.43 $0.82 11%
Deodorant 20 $4.91 $4.75 $0.16 3%
Body Wash 18 $5.70 $5.40 $0.30 6%
Shaving Cream 20 $3.73 $3.89 ($0.16) 4%
Total 122 $57.18 $50.75 $6.43 13%
*Each gender has an equal split of the total number of products in this column.
7
http://www.statista.com/markets/415/consumer-goods-fmcg/
8
http://www.statista.com/statistics/260963/leading-fmcg-companies-worldwide-based-on-sales/
11Figure 6: Example, Razor Cartridges9
Figure 7: Example, Shampoo and Conditioner10
9
Retrieved from http://www.walgreens.com/store/c/schick-hydro-silk-for-women-cartridges/ID=prod6104933-product and http://www.walgreens.
com/store/c/schick-hydro-5-cartridge-razor-refills/ID=prod6016280-product on 11/18/2015.
10
Retrieved from http://www.walgreens.com/store/c/alberto-vo5-2-in-1-moisturizing-shampoo-%2b-conditioner/ID=prod6239649-product and
http://www.walgreens.com/store/c/alberto-vo5-mens-3-in-1-shampoo-conditioner--body-wash-ocean-surge/ID=prod6241892-product on 10/02/2015.
12Senior/Home Health Care Products
On average, women’s home health care products cost 8 percent more than men’s. For example, women’s
braces cost, on average, 15 percent more than men’s. Men’s digestive health products, which were 5
percent more on average, were the only category that cost men more than women. See Table 6 for a
complete breakdown.
Table 6: Price Breakdown, Senior/Home Health Care Products
Products Number of Women’s Men’s Price Percent
Products* Average Average Difference Difference
Supports and Braces 22 $37.17 $32.43 $4.74 15%
Canes 6 $21.99 $19.66 $2.33 12%
Compression Socks 24 $27.86 $26.77 $1.09 4%
Adult Diapers 22 $32.71 $32.06 $0.65 2%
Personal Urinals 12 $11.32 $9.32 $2.00 21%
Digestive Health 20 $9.41 $9.84 ($0.43) 5%
Total 106 $140.46 $130.08 $10.38 8%
*Each gender has an equal split of the total number of products in this column.
Figure 8: Example, Supports and Braces11
11
Retrieved from http://www.walgreens.com/store/c/ita-med-rib-support-for-women-white/ID=prod6127922-product and http://www.walgreens.
com/store/c/ita-med-rib-support-for-men-white/ID=prod6127914-product on 10/05/2015.
13Figure 9: Example, Adult Diapers12
12
Retrieved from https://shop.riteaid.com/rite-aid-bladder-control-pads-for-women-maximum-extra-coverage-39-ct-8016097and https://shop.riteaid.
com/rite-aid-pharmacy-guards-for-men-maximum-absorbency-one-size-fits-most-52-guards-0324384 on 11/18/2015.
14I. Introduction
Report Objectives
This study establishes the first-ever look at gender pricing of goods in the New York City marketplace across
multiple industries. DCA investigated gender-based pricing disparities in toys and accessories, children’s
clothing, adult clothing, personal care products, and senior/home health care products.
The goal of the study was to determine the frequency and extent to which female consumers face higher
prices than male consumers when buying similar products. Using the study’s findings, DCA aims to inform
consumers, as well as raise awareness about the issue of gender pricing.
Inherent in the study design is an understanding that male and female versions of products often differ from
one another in branding, construction, and ingredients. However, individual consumers do not have control
over the textiles or ingredients used in the products marketed to them and must make purchasing choices
based only on what is available in the marketplace. As such, DCA selected products that had similar male and
female versions and were closest in branding, ingredients, appearance, textile, construction, and/or marketing.
In this way, the findings of the study represent a female consumer’s experience in the marketplace, which
includes unavoidable higher prices for women’s products.
Historical Context
In 1992, DCA conducted an investigation of “price bias against women in the marketplace,” and issued a
report with the findings titled Gypped by Gender. The study concluded that women paid more than men at
used car dealers, dry cleaners, launderers, and hair salons. A major obstacle in helping consumers avoid
pricing bias, the study reported, was a lack of information about the prices paid by other consumers.
Twenty-three years later, and with more information readily available than ever before, it may be that this is
still the case—price conscious female shoppers may not know that, for discounts, they need look no further
than the men’s department.
The 1992 study found that when women bought used cars, they were twice as likely to have been quoted a
higher price than men. Based on a survey of 80 hair salons across the five boroughs, the study found that,
on average, women paid 25 percent more for the same haircuts. Similarly, on average, women paid 27 percent
more for the identical service of laundering a basic white cotton shirt.13
DCA’s research on gender pricing started a national conversation, and soon states were following New York
City’s example by conducting their own research. A California study in 1994 estimated that women effectively
paid an annual “gender tax” of $1,351 each.14 Other states, such as Florida, Connecticut, and South Dakota,
began to research the topic and began publishing official reports of their own.15 16 In 1995, California became
the first state to enact a bill to protect consumers from price discrimination for services; soon Massachusetts,
Washington D.C., and some Virginia counties followed.17 In 1998, relying on DCA’s research, the New
13
New York City Department of Consumer Affairs. Gypped by Gender: A Study of Price Bias against Women in the Marketplace, 1992. Print.
14
http://articles.latimes.com/1995-10-14/news/mn-56735_1_gender-based-pricing
15
http://leginfo.ca.gov/pub/95-96/bill/asm/ab_1051-1100/ab_1100_cfa_950831_152302_sen_floor.html
16
http://legis.sd.gov/docs/referencematerials/IssueMemos/im96-22.pdf
17
http://www.csmonitor.com/1998/0109/010998.us.us.5.html
15York City Council passed a law prohibiting gender-based pricing of services.18 19 There are no similar laws
regarding gender pricing of goods.
The law added a rule to the Consumer Affairs section of the New York City Administrative Code, enabling
the Agency to issue violations to dry cleaners, hair salons, and any “retail service establishment” that illegally
price services differently based on gender.20 21 Posted prices must reflect actual differences in required labor.
For example, instead of using the terms shirts and blouses, which are inherently gender-based, price lists must
describe the differences between the garments: shirts with ruffles, shirts with pleats, etc., as items that require
additional labor to clean.
Unfortunately, even with the dialogue and legislation, it is an issue that still persists today. In 2014 and 2015,
DCA issued 118 and 129 violations, respectively, to businesses for violation of New York City’s gender
pricing law. A 2011 study from the University of Central Florida found the same results as DCA’s 1992
report. The study examined the price of personal care products, in addition to services, and found that
women paid more than men for certain goods and services, such as deodorant, haircuts, and dry cleaning.
The authors additionally concluded that while the individual price differences may seem small, the cumulative
cost is not.22
18
http://www.nyc.gov/html/om/html/98a/pr019-98.html
19
http://www.nytimes.com/1998/01/10/nyregion/for-the-sexes-equality-under-the-law-and-under-the-hair-clippers.html
20
http://www1.nyc.gov/assets/dca/downloads/pdf/about/PricingLaws.pdf
21
Any consumer can report an instance of gender-based pricing of services by calling 311.
22
Duesterhaus, Megan et al. “The Cost Of Doing Femininity: Gendered Disparities In Pricing Of Personal Care Products And Services”. Gender Issues
28.4 (2011): 175-191. Web.
16II. Study Methodology
Cradle-to-Cane Focus
This study mirrors an average consumer lifecycle, from baby products to products for seniors, providing a
glimpse into the experiences of consumers of all ages. Each product category was selected to reflect a stage
of the consumer lifecycle. The product categories are based on staple consumer goods, from apparel to
personal care products.
Retailer Selection
Overall, DCA analyzed more than 90 brands encompassing nearly 800 individual products.
DCA selected children’s clothing stores that are national chains with multiple New York City locations.
Children’s toy stores included in the study are top national chain retailers with New York City locations.23
There are five children’s clothing stores in this study, and three stores from which toys and accessories
were analyzed.
Similarly, DCA used industry analytics to identify top-grossing, national chain retailers in the high-end,
low-end, and median price ranges with New York City store locations.24 25 Clothing stores were limited to
those that carry their own name brands. Two exceptions to this were the inclusion of Kmart and Target,
though only their stores’ own brands of clothing were analyzed. In total, 15 clothing stores were evaluated.
DCA selected personal care product retailers based on the market and geographic dominance of the three
major chain drugstores in New York City: Walgreens/Duane Reade, CVS, and Rite Aid.
Senior/home health care product retailers included the same three major New York City drugstores as in
the personal care products category, as well as the two major big-box stores included throughout this report,
Kmart and Target. DCA evaluated products from five stores.
Product Selection
Analogous men’s and women’s products were selected. DCA chose items that were closest in branding,
ingredients, appearance, textile, construction, and/or marketing to minimize differences stemming from
gendered marketing and design.
Toys and Accessories
Toys and accessories were found to have inherent differences based on their gender marketing. A recent study
determined that toys and children’s products have become more differentiated based on gender than they
were 50 years ago “when gender discrimination and sexism were the norm.”26 27
23
http://www.forbes.com/sites/prospernow/2011/12/20/battle-grounds-among-toy-retailers-breaking-down-the-consumer-demographics/
24
http://www.businessinsider.com/the-10-biggest-apparel-companies-in-the-us-2015-7
25
https://www.chainstoreguide.com/static_content/pdf/Apparel_Top_100.pdf
26
http://www.theatlantic.com/business/archive/2014/12/toys and accessories-are-more-divided-by-gender-now-than-they-were-50-years-ago/383556/
27
http://www.nytimes.com/2015/10/31/upshot/boys-and-girls-constrained-by-toys and accessories-and-costumes.html?rref=upshot&_r=0
17In order to minimize these differences, DCA selected gender-neutral toy categories, which had equivalent
numbers of products offered to boys and girls: bikes and scooters, general toys, backpacks, helmets and
pads, preschool toys, and arts and crafts. Within the category “general toys,” DCA compared products from
the “girls” and “boys” sections of the same brand. The products DCA chose for comparison had the most
similar number of individual parts, packaging, or description within the same brand.
Adult and Children’s Clothing
DCA selected categories of clothing that are staples in an average consumer’s wardrobe: a mixture of
casual clothing, work clothing, and necessary garments, such as socks and underwear. DCA analyzed seven
categories of clothing: dress pants, dress shirts, jeans, casual shirts, sweaters, socks, and underwear. Individual
articles of clothing were limited to those for which there were clear male and female versions of the same
item on retailers’ websites. In order to minimize differences in construction and fabric used, which could
impact cost, DCA made every effort to find nearly identical articles of clothing. Otherwise, DCA compared
similarly named products offered in analogous women’s and men’s sections (e.g., a women’s “1969 Perfect
Boot Jeans” and a men’s “1969 Boot Fit Jeans,” both found in the “jeans” section).
The Agency selected children’s clothing items in a similar fashion to adult clothing items, and drew from what
was available and comparable on retailers’ websites. Included in this report are baby pants, baby shirts, baby
shoes, baby sweaters, children’s jeans, children’s shirts, children’s underwear, baby onesies, and toddler shoes.
Personal Care Products
DCA chose personal care items that are staple hygiene products used by both genders: body wash, deodorant,
shampoo and conditioner (summarized as “hair care”), lotion, razors, razor cartridges, and shaving cream.
Personal care brands were chosen based on an industry analysis of the top-grossing brands that were also
available in the three major New York City drugstores.28 DCA also included private-label or “generic” brands
from these drugstores. All efforts were made to find equivalent products, by looking at factors such as the
number of blades in a men’s or a women’s razor, or the description or name of a body wash. In some cases,
men’s products were clearly marked as intended for men, while products included in this study as women’s
products could be considered “unisex,” because the label did not specifically indicate a gender.
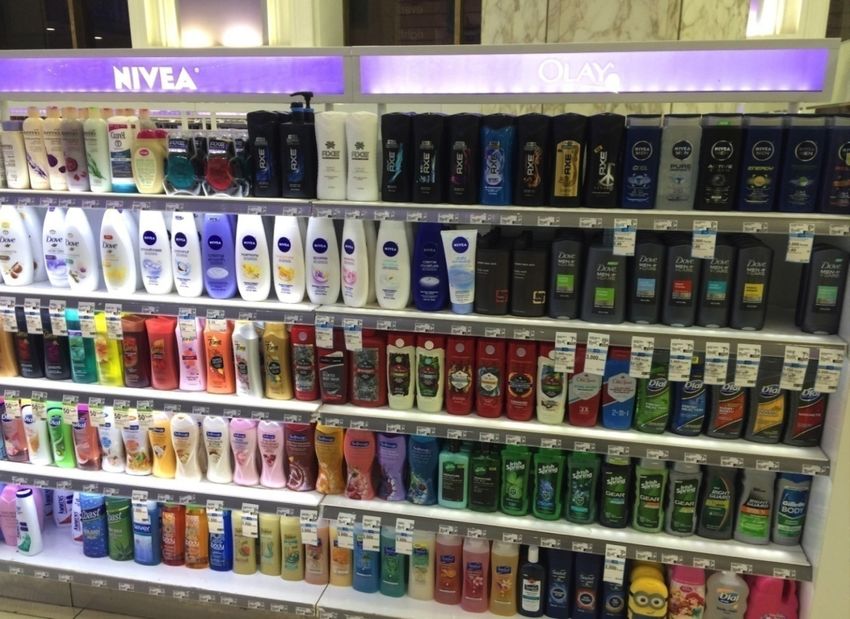
Products’ gender marketing is notable in the context of how products are displayed and separated in the
drugstore aisle. See Figure 10. The products targeted to men are in dark-colored, boxy bottles that are
explicitly marked “for men.” The products targeted to women, while they may not explicitly include the
word “women” on the packaging, have marketing that seems geared to female consumers: they are packaged
in light-colored, curvy bottles. The text on these bottles often includes the word “beauty” or claims of
improving appearances, while the text on bottles marketed toward men often emphasize efficiency and the
strength of the product. Regardless of whether certain products are officially targeted to women, the price of
men’s personal care products is clearly gender-based.
28
http://www.statista.com/statistics/273236/brand-value-of-the-leading-personal-care-brands-worldwide/
18Figure 10: Example, Product Display29
Senior/Home Health Care Products
To select senior/home health care products, DCA identified the categories on drugstores’ websites with clear
male/female versions: adult incontinence products; canes; compression socks; digestive health products,
consisting of laxatives and probiotic supplements; personal urinals; and supports and braces.
There were a limited number of these products, as many have unisex labeling. However, when there were
male and female versions of products, it was very clearly marked, and these products were often as identical
as two products could be in terms of ingredients, function, or construction.
Price Comparisons
In order to analyze the pricing of products, the Agency examined individual products side by side, and then
incorporated the prices into an average price for the larger category. For example, DCA selected comparable
pairs of women’s and men’s jeans and recorded their prices. DCA then found the individual sums of all men’s
and all women’s jeans and divided the sums by the number of individual items to derive the average cost for a
pair of jeans.
• Sum of cost of 25 pairs of women’s jeans ÷ 25 = average cost for a pair of women’s jeans
For some products sold in packages of multiple items, such as socks and underwear, DCA recorded the unit
price in order to more accurately compare products’ prices and value. For personal care products, the amount
of product in items was often unequal, while the price may have been identical. DCA recorded the per-unit
price, and made every effort to find similarly sized products, so as not to compare unit pricing of large-size
products and small-size products. As such, price comparisons were made on a unit basis.
29
Photograph taken in Walgreens/Duane Reade on 10/22/2015.
19The prices recorded for the study data were always the full price, regardless of any sale or discount the
retailer offered.30
Price Analyses
DCA analyzed price differentials using several different methods. In all categories, DCA derived the average
price for an item, then found the percent difference between the average total men’s cost and women’s cost.
In order to control for the possibility of an outlier skewing the data in any direction, the Agency also found
the median prices for each product type in all categories. DCA found that the prices mirrored the findings of
the average price analyses, but DCA relied on the average prices, as they most accurately captured the pricing
patterns in the data.
In the adult clothing, children’s clothing, and toys and accessories industries, DCA further analyzed costs by
finding an average price of the high-end and low-end price ranges. To obtain the high-end price range, DCA
averaged the prices for all products above the median price. The low-end price range was the average of
prices for all products below the median price. This revealed trends of price discrepancy by gender based on
how much a product cost.
In order to determine the frequency at which women’s products cost more than men’s products, DCA found
the price difference for each individual product comparison. DCA then analyzed the incidence of a higher
price for women’s products, a higher price for men’s products, and equal prices.
Limitations
Men’s and women’s products are rarely identical, making exact comparisons difficult. To minimize
differences between men’s and women’s items, the Agency chose products based on those that were closest
in construction, ingredients, textile, appearance, description, and/or marketing. The products in this study
are those that are currently available in the marketplace and, as such, accurately reflect what is available for
consumers of both genders.
30
Prices may have changed online since the initial recording, but DCA recorded the date of the price capture. Similarly, the product offerings have
changed since the beginning of the study, which DCA began in July 2015 and concluded in October 2015. Retailers added warmer clothing articles
to their websites, and other seasonal adjustments may have been made.
20III. Main Findings
Toys and Accessories
Overview
DCA included six product categories—bikes and scooters, general toys, backpacks, preschool toys, helmets
and pads, and arts and crafts. In total, 106 individual products were included in the analysis.
Price Analysis
On average, children’s toys and accessories cost girls 7 percent more than boys. In total, one of each
average item cost girls $222.43, and cost boys $207.51, a difference of $14.92. On average, the largest price
discrepancy was in helmets and pads, costing girls nearly 13 percent more, with an average difference of $2.90
per product. The most equally priced category was backpacks, costing girls 0.8 percent more on average, or
$0.20. As described in the study methodology section, it was difficult to compare some types of products
within categories such as general toys and accessories, because girls’ and boys’ toys are inherently created
differently, with different types of functions intended. However, when it was possible, DCA compared from
the same brand in equivalent product lines, or toys and accessories with equivalent numbers of parts and
similar functions.
Table 7: Average Price, Toys and Accessories
Product Number of Girls’ Boys’ Price Percent
Products* Average Average Difference Difference
Bikes and Scooters 22 $86.72 $81.90 $4.82 6%
General Toys 20 $29.49 $26.49 $3.00 11%
Backpacks 20 $25.99 $25.79 $0.20 0.8%
Preschool Toys 14 $21.65 $19.85 $1.80 9%
Helmets and Pads 20 $25.79 $22.89 $2.90 13%
Arts and Crafts 10 $32.79 $30.59 $2.20 7%
Total 106 $222.43 $207.51 $14.92 7%
*Each gender has an equal split of the total number of products in this column.
21DCA analyzed the high and low price ranges for toys in addition to the average. Unlike adult clothing and
children’s clothing, however, these ranges are not necessarily representative of the same products at multiple
price points, such as a shirt from multiple stores. Rather, these price ranges are reflective of different kinds
of products within some categories. The general toys category ranges in product type from dolls to remote
control cars, and so different price points are reflective of the variety of toys, rather than a single type of toy.
Toys in the higher price range in this study cost girls nearly 7 percent more on average. The total cost of
one of each average higher-priced item from all toy categories was $342.51 for girls and $320.97 for boys,
a difference of $21.54. In the lower price range, one of each lower-priced item cost girls more—a total of
$121.04 for girls, and a total of $107.34 for boys, a difference of $13.70, or nearly 13 percent.
Table 8: High Price Range, Toys and Accessories
Products Number of Girls’ Boys’ Price Percent
Products High Range High Range Difference Difference
Bikes and 22 $141.99 $137.99 $4.00 3%
Scooters
General Toys 20 $42.59 $38.99 $3.60 9%
Backpacks 20 $33.79 $34.19 ($0.40) 1%
Preschool Toys 14 $29.99 $25.32 $4.67 18%
Helmets and Pads 20 $32.66 $26.99 $5.67 21%
Arts and Crafts 10 $61.49 $57.49 $4.00 7%
Total 106 $342.51 $320.97 $21.54 7%
Table 9: Low Price Range, Toys and Accessories
Products Number of Girls’ Boys’ Price Percent
Products Low Range Low Range Difference Difference
Bikes and 22 $38.79 $33.19 $5.60 17%
Scooters
General Toys 20 $16.39 $13.99 $2.40 17%
Backpacks 20 $18.19 $17.39 $0.80 5%
Preschool Toys 14 $17.19 $14.99 $2.20 15%
Helmets and Pads 20 $19.99 $18.79 $1.20 6%
Arts and Crafts 10 $10.49 $8.99 $1.50 17%
Total 106 $121.04 $107.34 $13.70 13%
22Girls’ toys cost more 55 percent of the time, the second-highest disparity rate of the five industries studied.
Boys’ toys cost more 8 percent of the time, and the price was equal 38 percent of the time.
Table 10: Frequency Chart, Toys and Accessories
Toys and Accessories Number of Times Incidence
Women pay more 29 55%
Equal 20 38%
Men pay more 4 8%
Total 53 100%
Note: Numbers reflect rounding.
Figure 11: Example, Bikes and Scooters
23Figure 12: Example, Helmets and Pads
Figure 13: Example, Product Display31
Children’s Clothing
Overview
The Agency analyzed nine types of children’s clothing: children’s shirts, children’s jeans, baby pants, onesies,
baby sweaters, baby shirts, baby shoes, children’s underwear, and toddler shoes. In total, 168 individual articles
of apparel were included in the analysis, with 20 items for each type, except toddler shoes, for which DCA
analyzed eight pairs.
31
Photograph taken in Babies “R” Us on 07/02/2015.
24Price Analysis
Of all five industries included in this study, the children’s clothing industry had the least discrepancies in
pricing between genders. On average, girls’ clothing cost 4 percent more than boys’. In total, girls were
charged $184.35 for one of each average item, and boys $177.23, an average difference of $7.12. On average,
children’s shirts had the largest price discrepancy, with girls being charged 13 percent more, and an average
difference of $1.87 per shirt. The remaining categories had average differences in the single-digit percentages,
with the average price difference under two dollars.
Table 11: Average Price, Children’s Clothing
Products Number of Girls’ Boys’ Price Percent
Products* Average Average Difference Difference
Children’s Shirts 20 $15.82 $13.95 $1.87 13%
Children’s Jeans 20 $24.63 $22.83 $1.80 8%
Baby Pants 20 $18.33 $16.77 $1.56 9%
Onesies 20 $20.91 $20.07 $0.84 4%
Baby Sweaters 20 $24.87 $23.39 $1.48 6%
Baby Shirts 20 $12.58 $12.38 $0.20 2%
Baby Shoes 20 $20.69 $20.07 $0.62 3%
Children’s Underwear 20 $17.67 $18.17 ($0.50) 3%
Toddler Shoes 8 $28.85 $29.60 ($0.75) 3%
Total 168 $184.35 $177.23 $7.12 4%
*Each gender has an equal split of the total number of products in this column.
Pricing of girls’ and boys’ clothing was relatively equal throughout, with entire categories, such as all sweaters,
sold at the same price within a retailer. Pricing patterns for the high-end and low-end price ranges mirrored
patterns in adult clothing with gendered pricing differences greater for more expensive clothing. The overall
discrepancy was larger for girls’ higher-priced children’s clothing, and smaller, but still existent, for lower-
priced children’s clothing. On average, girls’ clothing cost 5 percent more for higher-priced clothes. In total,
children’s clothing cost girls $240.61 for one of each average higher-priced item, and cost boys $229.55, a
difference of $11.06. In the lower-priced range, children’s clothing cost girls 2 percent more than boys. In
total, children’s clothing cost girls $127.52 for one of each average lower-priced item, and cost boys $124.91,
a difference of $2.61.
25Table 12: High Price Range, Children’s Clothing
Products Number of Girls’ Boys’ Price Percent
Products High Range High Range Difference Difference
Children’s Shirts 20 $19.71 $17.16 $2.55 15%
Children’s Jeans 20 $32.96 $29.46 $3.50 12%
Baby Pants 20 $25.56 $22.55 $3.01 13%
Onesies 20 $29.35 $28.35 $1.00 4%
Baby Sweaters 20 $30.56 $30.36 $0.20 1%
Baby Shirts 20 $17.56 $17.16 $0.40 2%
Baby Shoes 20 $26.56 $25.56 $1.00 4%
Children’s Underwear 20 $23.37 $23.97 ($0.60) 3%
Toddler Shoes 8 $34.98 $34.98 -- 0%
Total 168 $240.61 $229.55 $11.06 5%
Table 13: Low Price Range, Children’s Clothing
Products Number of Girls’ Boys’ Price Percent
Products Low Range Low Range Difference Difference
Children’s Shirts 20 $11.36 $10.74 $0.62 6%
Children’s Jeans 20 $16.30 $16.20 $0.10 1%
Baby Pants 20 $11.09 $10.98 $0.11 1%
Onesies 20 $12.47 $11.79 $0.68 6%
Baby Sweaters 20 $19.18 $16.42 $2.76 17%
Baby Shirts 20 $7.60 $7.60 -- 0%
Baby Shoes 20 $14.82 $14.58 $0.24 2%
Children’s Underwear 20 $11.97 $12.37 ($0.40) 3%
Toddler Shoes 8 $22.73 $24.23 ($1.50) 7%
Total 168 $127.52 $124.91 $2.61 2%
26Similar to the finding that the disparities were smallest across children’s clothing, DCA also found that
children’s clothing had the lowest rate of disparities. The prices for girls’ and boys’ clothing were equal 67
percent of the time, the highest incidence of equal prices throughout the study. Girls’ clothing cost more 26
percent of the time, and boys’ clothing cost more 7 percent of the time.
Table 14: Frequency Chart, Children’s Clothing
Children’s Clothing Number of Times Incidence
Women pay more 22 26%
Equal 56 67%
Men pay more 6 7%
Total 84 100%
Boys’ and girls’ clothing was relatively similar in appearance and construction. However, DCA found one
notable difference in children’s shirts. Nearly every shirt available for girls, from almost every retailer, had
additional trimmings, such as bows, glitter, shirring, or 3-D elements. By comparison, available boys’ shirts
were generally plain shirts with printed designs and rarely had additional trimmings. Additional trimmings
require additional manufacturing costs and could contribute to a higher retail price. Given the fact that nearly
all girls’ shirts had these extra design elements, it would be challenging for female consumers to buy equally
priced shirts for boys and girls, simply due to what is available for each gender.
Figure 14: Example, Children’s Jeans32
32
Retrieved from http://www.carters.com/carters-kid-girl-bottoms-jeans/V_278G059.html?dwvar_V__278G059_size=4&dwvar_V__278G059_col
or=Color and http://www.carters.com/carters-kid-boy-bottoms/VC_268G044.html?dwvar_VC__268G044_size=4&dwvar_VC__268G044_col
or=Blue on 11/18/2015.
27Figure 15: Example, Children’s Shirts
Adult Clothing
Overview
DCA analyzed seven types of clothing: dress pants, dress shirts, sweaters, jeans, shirts, socks, and underwear.
In total, 292 individual articles of clothing were included in the analysis, with at least 40 items for each type
of clothing.
Price Analysis
On average, women’s clothing cost nearly 8 percent more than men’s. In total, one of each average item cost
women $307.38 and cost men $285.85, a difference of $21.53. On average, the largest price discrepancy was in
shirts, costing women nearly 15 percent more, with an average difference of $3.72 per shirt. Dress shirts came
a close second, costing women nearly 13 percent more, with an average difference of $6.65 per shirt. Men’s
clothing cost more in only one category, underwear, at an average difference of nearly 29 percent or $2.44.
Table 15: Average Price, Adult Clothing
Products Number of Women’s Men’s Price Percent
Products* Average Average Difference Difference
Dress Pants 40 $75.66 $71.71 $3.95 6%
Dress Shirts 40 $58.11 $51.46 $6.65 13%
Sweaters 42 $63.19 $59.45 $3.74 6%
Jeans 50 $62.75 $57.09 $5.66 10%
Shirts 40 $29.23 $25.51 $3.72 15%
Socks 40 $9.98 $9.73 $0.25 3%
Underwear 40 $8.46 $10.90 ($2.44) 29%
Total 292 $307.38 $285.85 $21.53 8%
*Each gender has an equal split of the total number of products in this column.
28The Agency’s examination of the high and low price ranges showed a trend of clothing costing women
more than men for higher-priced clothing, and costing men slightly more on lower-priced clothing. In the
high price range, clothing cost women an average of 13 percent more than men. The total cost of one of
each high price range item was $442.51 for women and $391.21 for men, a difference of $51.30. The largest
discrepancy was in dress shirts, costing women 26 percent or $17.55 more on average. Shirts came a close
second, costing women 25 percent or $8.36 more on average. Underwear cost more for men, at 22 percent or
$2.41 more on average. In the low price range, men’s clothing cost 3 percent more than women’s. The total
cost of one of each low price range item was $175.67 for women and $180.83 for men, a difference of $5.16.
The discrepancies were all in the low single-digit percent range, and equally split in terms of which gender’s
clothing cost more. The only exception was underwear, costing men 39 percent or $2.37 more.
Table 16: High Price Range, Adult Clothing
Products Number of Womens’ Mens’ Price Percent
Products High Range High Range Difference Difference
Dress Pants 40 $113.94 $103.69 $10.25 10%
Dress Shirts 40 $85.94 $68.39 $17.55 26%
Sweaters 42 $93.94 $85.64 $8.30 10%
Jeans 50 $83.20 $74.12 $9.08 12%
Shirts 40 $42.30 $33.94 $8.36 25%
Socks 40 $12.31 $12.14 $0.17 1%
Underwear 40 $10.88 $13.29 $2.41 22%
Total 292 $442.51 $391.21 $51.30 13%
Table 17: Low Price Range, Adult Clothing
Products Number of Womens’ Mens’ Price Percent
Products Low Range Low Range Difference Difference
Dress Pants 40 $37.38 $39.72 ($2.34) 6%
Dress Shirts 40 $32.08 $34.52 ($2.44) 8%
Sweaters 42 $32.86 $34.41 ($1.55) 5%
Jeans 50 $41.55 $39.28 $2.27 6%
Shirts 40 $18.03 $17.08 $0.95 6%
Socks 40 $7.64 $7.32 $0.32 4%
Underwear 40 $6.13 $8.50 ($2.37) 39%
Total 292 $175.67 $180.83 $5.16 3%
29DCA found that women’s clothing cost more 40 percent of the time. Men’s clothing prices were higher 32
percent of the time, and the prices were equal for both genders 27 percent of the time.
Table 18: Frequency Chart, Adult Clothing
Adult Clothing Number of Times Incidence
Women pay more 59 40%
Equal 40 27%
Men pay more 47 32%
Total 146 100%
Note: Numbers reflect rounding.
Pricing Considerations33
Women’s and men’s clothing are constructed differently, resulting in different manufacturing costs. Textiles
are a main driver of differences in production costs, with women’s clothing tending to be made with a more
costly blend of fabrics and men’s clothing, more often, being made with one type of fabric. Other pricing
factors are the number of styles available: an offering of regular, tall, and petite styles for a single product will
result in a higher manufacturing cost. Similarly, how an item is cut—men tend to have straight-cut clothing,
whereas women’s cuts are curvier—may result in more fabric waste.34 35 However, according to experts at the
Fashion Institute of Technology (FIT), these costs are not necessarily commensurate with the retail-price
differences identified in this study, as the manufacturing cost of an article of clothing is a small fraction of
the ultimate retail price.
Retail prices are set by the retailer, not the manufacturer, and every company has its own predetermined
markup formula for its clothing. Experts suggest that an average difference of $5.66 between a pair of
women’s and men’s jeans, for example, has nearly no relationship to the production costs. Rather, price
differences are due to business considerations, and because women are generally willing to pay higher prices
for their clothing than men, they often are charged more.36
33
DCA spoke with experts in the fields of clothing textiles, fashion merchandising, and customs duties to gain insight into retailers’ pricing considerations.
See footnotes below.
34
Telephone interview with Professor Ingrid Johnson, Acting Associate Chairperson for the Home Products Development Department, Fashion Institute
of Technology (FIT). October 8, 2015.
35
Regarding the trend of men’s underwear costing more across all price ranges, the expert agreed that men were still likely paying less for their underwear
than would be expected, given the extensive construction involved, as well as the use of expensive fabrics such as spandex. Even when men pay more, the
expert agreed, they are still paying less.
36
Telephone interview with Professor Robin Litwinsky, Chairperson of the Fashion Business Management Department, Fashion Institute of Technology
(FIT). October 15, 2015.
30A majority of clothing sold in the United States is imported from manufacturers abroad, which means
another price consideration in the supply chain is import taxes. Import taxes (or tariffs) on clothing, leather
goods, and shoes are set by Congress, and are explicitly based on gender. These tariffs are reflective of the
market for imported goods; the more a good is imported, the higher the tariff. For example, women’s silk
shirts have higher taxes than men’s silk shirts, whereas men’s wool suits have higher taxes than women’s wool
suits because of the relative demand for each. Overall, women’s goods generate more in import taxes than
men’s goods.37
These import tax costs are passed on from the manufacturer to the retailer, and eventually to the consumer.
However, the tariff structure does not always translate into the expected gender pricing disparity at the
retailer. For example, denim jeans are taxed at the same rate for men and women, but DCA found that
women’s jeans cost 10 percent more on average than men’s jeans. Similarly, men’s imported cotton shirts are
taxed 4 percent higher than women’s cotton shirts, yet the Agency’s investigation revealed that dress shirts,
which were usually made from cotton, cost women nearly 13 percent more than men.38
Figure 16: Example, Dress Shirts39
Men’s Shirt, $48
Women’s Shirt, $78
37
In total, customs duties generate roughly $40 billion for the U.S. government annually. In the aggregate, women’s goods generate more in customs
duties than men’s goods, and if the import tax rates were assessed equally for both genders for all products, the government would collect $300
million less in import taxes annually.
38
Telephone interview with Michael Cone, a New York City trade lawyer, July 1, 2015.
39
Retrieved from http://www.levi.com/US/en_US/womens-clothing-tops/p/193920000?abTest=true and http://www.levi.com/US/en_US/mens-
clothing-shirts/p/195860001?abTest=true on 10/02/2015.
31Figure 17: Example, Jeans
Men’s Jeans, $68
Women’s Jeans, $88
Figure 18: Example, Shirts
32Personal Care Products
Overview
DCA analyzed seven types of personal care products: shampoo and conditioner (summarized as “hair care”),
razor cartridges, razors, lotion, deodorant, body wash, and shaving cream. In total, 122 individual products
were included in the analysis, with about 20 items found for almost every category.
Price Analysis
On average, personal care products cost women 13 percent more than men. In total, one of each average
item cost women $57.18, and cost men $50.75, a difference of $6.43. On average, the largest price
discrepancy was in hair care; products cost women nearly 48 percent more, with an average difference of
$2.71 per set of shampoo and conditioner. Usually, men’s shampoos and conditioners are sold as a 2-in-1
bottle, and so to achieve the same effect without buying a bottle marked explicitly as “for men,” women
would be required to purchase both a bottle of shampoo and a bottle of conditioner. Razor cartridges also
cost significantly more for women than men, at nearly 11 percent, or $1.69. One category, shaving cream, cost
more for men, at an average difference of 4 percent, or $0.16.40
Table 18: Average Price, Personal Care Products
Products Number of Women’s Men’s Price Percent
Products* Average Average Difference Difference
Shampoo and 16 $8.39 $5.68 $2.71 48%
Conditioner (Hair Care)
Razor Cartridges 18 $17.30 $15.61 $1.69 11%
Razors 20 $8.90 $7.99 $0.91 11%
Lotion 10 $8.25 $7.43 $0.82 11%
Deodorant 20 $4.91 $4.75 $0.16 3%
Body Wash 18 $5.70 $5.40 $0.30 6%
Shaving Cream 20 $3.73 $3.89 ($0.16) 4%
Total 122 $57.18 $50.75 $6.43 13%
*Each gender has an equal split of the total number of products in this column.
The price differences between products were often due to differing quantities sold to men and women. For
example, deodorant was often sold to men in quantities of 2.7-ounce sticks, and women were often sold
quantities of 2.6-ounce sticks at the same price. Similarly, men save at the register by requiring fewer products
for the same advertised claims. For example, body washes are often sold “for men” with claims of doing
double (or triple) duty as a shampoo and/or conditioner.
40
Because only drugstore brands of personal care products were included in this study, rather than higher-end salon products or cheaper, bulk-size
products, all products came within the same price range. There was not enough variety in cost to analyze high-range or low-range prices.
33Often, men’s and women’s products will have the same features, but the women’s version will cost more. For
example, women’s razors and razor cartridges cost more, and usually have prominent claims of moisturizing
strips or features for sensitive skin. However, it is also often the case that men’s razors and cartridges have
aloe moisturizing strips or are marketed as intended for sensitive skin.
In addition to having the largest average disparities, personal care products had the highest rate of disparities
of all five industries. Women’s personal care products cost more 56 percent of the time. The price was equal
31 percent of the time, and men’s products cost more 13 percent of the time.
Table 19: Frequency Chart, Personal Care Products
Personal Care Number of Times Incidence
Women pay more 34 56%
Equal 19 31%
Men pay more 8 13%
Total 61 100%
Pricing Considerations
Personal care products are complex mixtures of many synthetic ingredients. While men’s and women’s
products often do not have identical ingredients, according to experts, these differences are not a major
driver of the cost discrepancies. Ingredients and manufacturing costs are factors that affect the ultimate retail
price of a personal care product, but the major cost consideration that consumers pay for is the research and
development that go into product creation.41 42 It appears that female consumers absorb more of these costs
than male consumers, rather than the costs being distributed equally.
41
Telephone interview of Dr. Gary Kelm, Ph.D., an expert in personal care product formulation at Procter & Gamble for over 35 years.
October 19, 2015.
42
According to Dr. Kelm, women may also pay a premium for “conceptual” or “label” ingredients, which are ingredients generally added at levels
lower than 1 percent. These ingredients yield no significant benefit to the consumer, but legally enable a brand to advertise the use of that
ingredient and the potential benefits it could confer. Examples include natural extracts and botanical ingredients, which are frequently used in
women’s products.
34Figure 19: Example, Razors43
Figure 20: Example, Razor Cartridges
43
Retrieved from http://www.cvs.com/shop/personal-care/shaving/women-s-disposable-razors/cvs-3-blade-disposable-razors-for-sensitive-skin-
skuid-955865 and http://www.cvs.com/shop/personal-care/shaving/men-s-disposable-razors/cvs-3-blade-disposable-razors-for-sensitive-skin-
skuid-919507 on 10/16/2015.
35Figure 21: Example, Deodorant44
Senior/Home Health Care Products
Overview
The Agency analyzed six types of home health care products: supports and braces; canes; compression
socks; adult incontinence products; personal urinals; and digestive health products, consisting of laxatives and
probiotic supplements. In total, 106 individual products were analyzed.
Price Analysis
On average, women’s home health care products cost 8 percent more than men’s. In total, one of each
average item cost women $140.46, and cost men $130.08, a difference of $10.38.45
44
Retrieved from http://www.cvs.com/shop/personal-care/deodorant/sticks-solids/degree-women-anti-perspirant-deodorant-invisible-solid-shower-
clean-skuid-538454 and http://www.cvs.com/shop/personal-care/deodorant/sticks-solids/degree-men-ultra-dry-anti-perspirant-deodorant-invisible-
stick-sport-skuid-282712 on 10/16/2015.
45
Similar to personal care products, there was neither a wide enough range of prices nor products for analysis of high-end or low-end prices. An
analysis of price ranges is useful to accurately reflect variety in products and pricing when the catch-all category, such as “sweaters” or “shirts,” has
a wider range than “shampoo” or “compression socks.”
36On average, the largest price discrepancy was found in personal urinals; women were charged 21 percent
more, with an average difference of $2.00 more per urinal. The average price difference for supports and
braces was nearly 15 percent more for women than for men, and the average difference in dollars and cents
for these often-identical products was $4.74. Often, the packaging for a men’s and women’s version of a
brace was completely identical, with the only difference being the word “men’s” or “women’s.” Additionally,
it appeared that some braces actually used less fabric for the women’s version, but cost more. Men’s
products cost more in one category, digestive health supplements, at an average difference of 5 percent, or
$0.43. However, in this category, women often received a gender discount, similar to the gender discount
men receive on hair care products. The two options for laxative products DCA found for this study were
“women’s,” generally in pink packaging, or unisex, with no explicit gender designation.
Table 20: Average Price, Senior/Home Health Care Products
Products Number of Women’s Men’s Price Percent
Products* Average Average Difference Difference
Supports and Braces 22 $37.17 $32.43 $4.74 15%
Canes 6 $21.99 $19.66 $2.33 12%
Compression Socks 24 $27.86 $26.77 $1.09 4%
Adult Diapers 22 $32.71 $32.06 $0.65 2%
Personal Urinals 12 $11.32 $9.32 $2.00 21%
Digestive Health 20 $9.41 $9.84 ($0.43) 5%
Total 106 $140.46 $130.08 $10.38 8%
*Each gender has an equal split of the total number of products in this column.
DCA found that women’s senior/home health care products cost more 45 percent of the time. The rate at
which the prices were equal was the second-highest in this study, at 42 percent of the time. Men’s products
cost more 13 percent of the time.
Table 21: Frequency Chart, Senior/Home Health Care Products
Senior Products Number of Times Incidence
Women pay more 24 45%
Equal 22 42%
Men pay more 7 13%
Total 53 100%
37You can also read