RATING AGENCY PRESENTATION - APRIL 2020 - JEA
←
→
Page content transcription
If your browser does not render page correctly, please read the page content below

RATING AGENCY
PRESENTATION

      APRIL 2020
ENERGY BUSINESS Strong Financial Performance and
Progress since our
last annual update Well-Positioned to Take on Future Challenges
Maintained excellent financial and operational metrics
Best ever distribution reliability as measured by CEMI-5
Capital program includes $980 million of projects over the next five years
without the need to issue new debt
Repaid $233 million of debt in FY2019 for a total reduction of $2.1 billion since
2009 with a continued commitment to accelerate deleveraging
Accelerated $100 million of debt reduction with February 2019 defeasance and an
additional $48 million of debt reduction in October 2019 with debt at a 35-year low
Accelerating nearly all principal due before 2026, resulting in debt service
coverage of 5x and fixed charge coverage of 2x when Vogtle comes online
Plan to use remaining SJRPP funds in FY2021 to defease approximately $100
million of the remaining $252 million of Issue Three bonds
Rates are currently at the median in the state, but affordability metrics remain
healthy as rates are increased to accommodate Vogtle
2
WATER &
WASTEWATER Strong Financial Performance and
BUSINESS
Well-Positioned to Take on Future Challenges
Progress since our
last annual update
Consistently superior system operating performance
Commitment to investing in infrastructure ensures reliable operation now and into
the future
Lowest amount of nitrogen discharged in history at 397 tons versus a permit limit of
683 tons
Robust $1.5 billion capital program over the next five years, primarily cash
funded with no rate changes and a moderate amount of new debt
Strong financial metrics collectively help provide a fortress going forward:
Strong balance sheet
Ample liquidity
Superior debt service coverage expected to be 2.6x to 5.0x over the next five years
Paid down $145 million of debt in FY2019 for a total reduction of $676 million
since 2011 projected to total $875 million over the next five years
Accelerated $95 million of debt reduction with February 2019 defeasance and an
additional $45 million with October 2019 defeasance
Forward-thinking plan to address long-term water supply to region
3
01   Introduction
     Overview of JEA and Jacksonville

02   Energy System
     Operational overview

03
     Plant Vogtle
     Progress update

     Water System
04   Operational overview

     FY19 Results
                                                     TABLE OF
05
                                                     CONTENTS
     Financial metrics for FY2019

06
     Enterprise Risk Management
     Overview of risk management efforts

07   Enterprise Asset Management
     Overview of progress made to asset management

08   COVID-19 Impacts
     Business Impacts and JEA’s Response

09
     Conclusion
     Summary

10   Bond Refunding Opportunities
     Market Opportunities

11   JEA Board Member Profiles
     Board Biographies

12   Supplemental Financial Information
     Financial Projections
01
INTRODUCTION

               5
                   5
CITY OF JACKSONVILLE INDEPENDENT AUTHORITIES AND AGENCIES
City Council
City of Jacksonville
Council President
Mayor Lenny Curry
Scott Wilson
Jacksonville Office of
Downtown Jacksonville Jacksonville Jacksonville Office of
Housing Ethics,
Investment Aviation Transportation Port Authority Inspector
Finance Compliance
Authority Authority Authority General
Authority & Oversight
Seven Member Board
Appointed by Mayor
Confirmed by City Council
6
JEA BOARD OF DIRECTORS
John D. Baker TERM
Executive Chairman & CEO, through
FRP Holdings, Inc. 2/28/24
We have been a municipal electric system
since 1895 and independent agency of the
Joseph DiSalvo TERM
City of Jacksonville, Florida since 1968 Lieutenant General, through
US Army, Retired 2/28/22
Dr. Zachary Faison, Jr. TERM
Our governing body is a Board of Directors President & CEO, through
2/28/22
Edwards Waters College
appointed by the Mayor and confirmed by
City Council
Leon L. Haley Jr., MD TERM
The Board’s primary responsibilities are policy, Chief Executive Officer, Through
UF Health Jacksonville 2/28/24
strategy, and rate making
The Board is comprised of community leaders,
professionals, and business people Marty Lanahan TERM
Executive Vice President & Regional through
President, Iberia Bank 2/28/23
Our Finance and Audit Committee oversees Robert Stein TERM
financial policy, financial reporting, auditing, President,
The Regency Group
through
2/28/21
budgeting, and enterprise risk management
Tom VanOsdol TERM
President & CEO, through
Ascension Florida 2/28/23
7
JEA SENIOR LEADERSHIP TEAM

                                                            Melissa Dykes
                                                    Interim CEO and Managing Director

 Caren Anders         Jody Brooks             Deryle Calhoun             Shawn Eads            Jon Kendrick         John McCarthy
 VP & GM Energy     Chief Legal Counsel       VP & GM Water &          Chief Information     VP & Chief Human       VP & Chief Supply
     System                                  Wastewater System              Officer          Resources Officer        Chain Officer

 Steve McInall          Joe Orfano           Paul Steinbrecher           Kerri Stewart       Herschel Vinyard        Kurtis Wilson
VP Energy & Water   Interim Chief Financial VP & Chief Environmental   VP & Chief Customer   Chief Administrative   Interim VP & Chief
    Planning          Officer & Treasurer       Services Officer             Officer                Officer         Government Affairs
                                                                                                                          Officer

                                                                                                                               8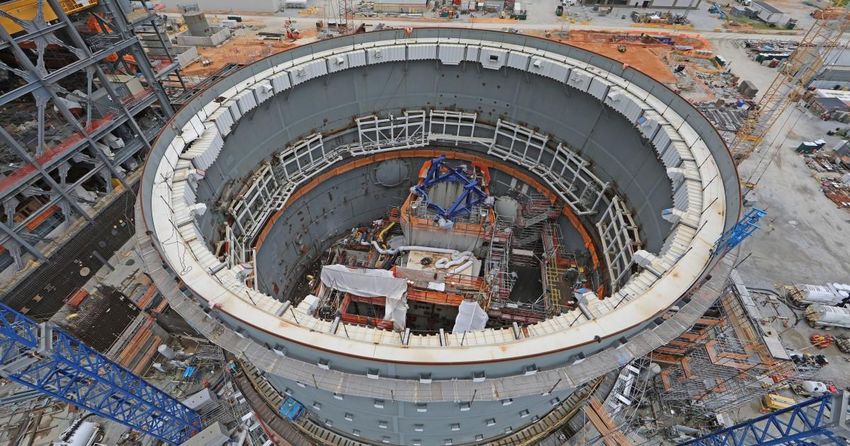
ECONOMIC SNAPSHOT

             Employment & Unemployment

    800,000                                                                                                             12.0%                The local economy is made up of
    750,000                                                                                                             10.0%
                                                                                                                                               a diverse mix of industries:
    700,000                                                                                                             8.0%

    650,000                                                                                                             6.0%
                                                                                                                                                    Other Services
    600,000                                                                                                             4.0%                                            Manufacturing
                                                                                                                                                          5%
                                                                                                                                             Construction                   5%
    550,000                                                                                                             2.0%                     7%
                                                                                                                                                                                        Trade,
    500,000                                                                                                             0.0%           Financial                                  Transportation &
                     08      09      10      11       12      13      14      15      16       17      18 19*                          Activities                                      Utilities
                                                                                                                                          9%                                             20%
                                                                                                                                                                                                 Professional &
                 Employment                        Unemployment                           Unemployment Rate (%)                                                                                     Business
     Source: Bureau of Labor and Statistics Unemployment Rates for Metropolitan Areas, Not Seasonally Adjusted - *Preliminary
                                                                                                                                                                                                    Services
                                                                                                                                   Total                                                              15%
                                                                                                                                Government                                        Education &
                       Median Household Income                                                                                     11%                      Leisure &
                                                                                                                                                            Hospitality
                                                                                                                                                                                 Health Services
                                                                                                                                                                                      15%
                                                                                                                                                              13%
  Florida’s median household income has increased 5.5% year over year.

                                       2018                                                                $55,462
                  Florida
                                       2017                                         $52,594

Duval County median household income has increased 7.2% year over year.
                                                                                                                                                            Source: Bureau of Labor Statistics “Florida
                                       2018                                                                   $55,832                                 Nonagricultural Employment – Most Recent 12-Months”
                                                                                                                                                             January 2019 through December 2019
    Duval County                       2017                                    $52,062                                                                             December data is preliminary

                              Source: U.S. Census Bureau, “2014-2018 American Community Survey 5-Year Estimates”
                                Median household income in the past 12 months (in 2018 inflation-adjusted dollars)

                                                                                                                                                                                                                  9
JEA SERVICE TERRITORY

Located in Jacksonville, Florida, our
service territory includes the entire
Jacksonville Metropolitan Statistical
Area (MSA) which has an estimated
population of 1.6 million 1

The Jacksonville MSA saw a 13.7%
increase in population from April 1,
2010 to July 1, 2018 1

Our service territory also includes
140,651 meters in neighboring St.
Johns, Nassau and Clay Counties

       1   U.S. Census Bureau, Population Division
           Annual Estimates of the Resident Population as of July 1, 2018

                                                                                        10
ENERGY SYSTEM CUSTOMER BREAKDOWN
Top Ten Customer Accounts
Account Annual Billed % of Revenue
U S NAVY PUBLIC WORKS CTR $ 24,139,244 1.9%
Average Number of Customer Accounts CITY OF JACKSONVILLE 22,627,898 1.8%
CMC STEEL US LLC 18,644,348 1.5%
DUVAL CO SCHOOL DISTRICT 14,725,557 1.2%
FY19 475,786
WESTROCK CP LLC 13,367,030 1.1%
SOUTHERN BAPTIST HOSPITAL OF FLORIDA INC 8,518,750 0.7%
FY18 466,409
PUBLIX SUPER MARKETS INC 7,967,480 0.6%
458,951 JOHNSON AND JOHNSON VISION CARE INC 7,762,522 0.6%
FY17
MAYO CLINIC JACKSONVILLE 7,561,055 0.6%
ANHEUSER BUSCH CO INC 7,253,348 0.6%
TOTAL $ 132,567,233 10.6%
0% 0.46% 1% 0.32%
1%
1%
11%
44%
48% 51%
55%
88%
Average Number of Accounts System Sales (MWh) Revenues ($ in millions)
475,786 12,465,958 $1,233
Residential Commercial & Industrial Public Street Lighting Sales for resale - Off system
11WATER SYSTEM CUSTOMER BREAKDOWN
Top Ten Customer Accounts
Account Annual Billed % of Revenue
CITY OF JACKSONVILLE $ 2,259,070 1.1%
Average Number of Customer Accounts DUVAL CO SCHOOL DISTRICT 1,183,717 0.6%
ST JOHNS COUNTY UTILITY 868,258 0.4%
AMERICAN HOMES 4 RENT LP 659,306 0.3%
FY19 355,635
SOUTHERN BAPTIST HOSPITAL OF FLORIDA INC 636,579 0.3%
DR HORTON INC JACKSONVILLE 506,283 0.3%
FY18 348,159
JOHNSON AND JOHNSON VISION CARE INC 473,175 0.2%
341,016 ST VINCENTS HEALTH SYSTEM INC 395,469 0.2%
FY17
THE AMERICAN BOTTLING COMPANY 388,436 0.2%
MAYO CLINIC JACKSONVILLE 337,468 0.2%
Total $ 7,707,761 3.9%
11% 15%
7% 19%
48%
54%
37% 27%
82%
Average Number of Accounts System Sales (kgal) Revenues ($ in millions)
355,635 37,696,072 $179
Residential Commercial & Industrial Irrigation
12WASTEWATER SYSTEM CUSTOMER BREAKDOWN
Top Ten Customer Accounts
Account Annual Billed % of Revenue
CITY OF JACKSONVILLE $ 2,606,769 1.0%
Average Number of Customer Accounts DUVAL CO SCHOOL DISTRICT 2,249,240 0.9%
ST JOHNS COUNTY UTILITY 1,509,191 0.6%
SOUTHERN BAPTIST HOSPITAL OF FLORIDA INC 1,048,756 0.4%
FY19 277,815
SYMRISE INC 1,045,916 0.4%
THE AMERICAN BOTTLING COMPANY 1,042,775 0.4%
FY18 270,871
JOHNSON AND JOHNSON VISION CARE INC 984,972 0.4%
264,336 ST VINCENTS HEALTH SYSTEM INC 934,011 0.4%
FY17
WWF OPERATING COMPANY 928,978 0.4%
MAYO CLINIC JACKSONVILLE 857,977 0.3%
Total $ 13,208,585 5.2%
7%
43% 43%
57% 57%
93%
Average Number of Accounts System Sales (kgal) Revenues ($ in millions)
277,815 27,726,796 $257
Residential Commercial & Industrial
1302
ENERGY SYSTEM
14
14ENERGY SYSTEM HIGHLIGHTS
Significant investment in reliability
projects positively impacting customer
outage experience
Generation cost management controls
tightened
Brandy Branch upgrade added 105 MW to
our generation portfolio
Agreements signed with EDF Renewables
to provide 250 MW of Solar PV
New ten-year extension to Shell Natural
Gas Supply agreement solidifies our
baseload natural gas supply and transport
15ENERGY SYSTEM INFRASTRUCTURE
Power Production Assets
5 Plants, 16 Units
Net Capacity: 2,869 MW (3,160 MW winter)
Fuel Sources: Natural Gas, Oil, Coal, Petroleum Coke
Small amount of Landfill Gas
Transmission System
Voltage Levels (kV): 500, 230, 138 & 69
744 Miles of Transmission
91 Substations (T&D)
Distribution System
Voltage Levels (kV): 26.4, 13.2 & 4.16
339 feeders (228 – 26.4kV; 82 – 13kV; 29 – 4kV)
7,112 circuit miles (43% Overhead, 57% Underground)
106,937 transformers, 206,961 poles
16ENERGY SYSTEM OVERVIEW
Dispatch Stack1
Existing Generation Capacity = 2,868 1 MW 3,500
Generating
Primary Year in
Facility Capacity 3,000
Fuel Type Service
(in MW)
Gas Fuel: 1,884 MW (70%)
NS3
Brandy Branch Natural Gas 745 2001 – 20192 2,500 $31.71/MWh
NS CFB
$33.80/MWh
Northside Gen Unit 3 Natural Gas/Oil 524 1977
Capacity (MW)
Kennedy Natural Gas 300 2000 – 20092
2,000 NS CFB $31.37/MWh
NS3
Greenland Energy Center Natural Gas 300 2011 $33.51/MWh
Landfill Energy Systems Landfill Gas 15 1997 – 20152
1,500
Solid Fuel: 784 MW (30%) Simple Cycle CT
Simple Cycle CT $31.26/MWh
$33.04/MWh
Northside Gen Units 1 & 2 Pet Coke 586 2003
Scherer 4 Coal 198 1989 1,000
Scherer 4
Scherer 4 $25.16/MWh
Total: 2,668 MW $24.43/MWh
Wansley PPA
$20.86/MWh
Peaking Reserve: 200 MW
500 Combined Cycle
Northside CTs Diesel Fuel Oil 200 1975 $21.86/MWh
Combined Cycle
$20.73/MWh
Grand Total: 2,868 MW3 Wansley PPA
$21.56/MWh
1 Based on summer net ratings and entitled capacity. Winter net ratings and entitled capacity is 3,160 MW as of 3/1/2020
0
2 Multiple units, multiple in service dates
FY18 FY19
Weighted Average
Weighted Average
Actual Peak Dispatch Cost Dispatch Cost
$29.82 $28.05
17ENERGY FUEL MIX
2019 Actuals 2020 Forecast 2023 Forecast
1% 2%
1%
16% 17% 13% 16%
24%
6%
10%
13%
16%
64%
49%
52%
Nuclear Coal Pet Coke Purchased Power Renewables Gas
18ENERGY PERFORMANCE MONITORING: T&D
Electric Service Reliability Customer Outage Frequency Electric Outage Duration
4.0 160.0
Outage frequency and duration 3.5 140.0
3.0 120.0
have been reduced over the last 10 2.5 100.0
years. FY19 continued this 2.0 80.0
favorable trend. 1.5 60.0
1.0 40.0
The typical JEA customer sees 1.28 0.5 20.0
outages per year and a total outage 0.0
FY09 FY10 FY11 FY12 FY13 FY14 FY15 FY16 FY17 FY18 FY19
0.0
FY09 FY10 FY11 FY12 FY13 FY14 FY15 FY16 FY17 FY18 FY19
duration of about 60 minutes.
Significant improvement trend over Customers Experiencing > 5 Outages Transmission Line Fault Frequency
past five years for CEMI5. FY19 had 3.0%
5.0
only .08% of our customers 2.5% 4.5
experiencing more than 5 outages. 2.0%
4.0
3.5
For FY20 we will track CEMI4 1.5% 3.0
2.5
(customers experiencing greater 1.0%
2.0
than 4 outages) as the corporate 0.5% 1.5
1.0
measure and have project work 0.0%
0.5
planned to continue to reduce 0.0
FY09 FY10 FY11 FY12 FY13 FY14 FY15 FY16 FY17 FY18 FY19
repeat outages.
T&D Grid Performance Metric FY2019 FY2018 FY2017
Transmission Line Reliability Customer Outage Frequency
Electric Outage Duration
# of Outages per Year
# of Minutes out per Year
1.28
60
1.39
67
1.55
100
Transmission Line Faults # of Faults per 100 miles 1.2 2.2 1.9
Overall improving trend over the CEMI5 % Customers > 5 outages per yr 0.08% 0.4% 1.1%
last ten years
Downward trends in these metrics indicate improvements in system reliability
19ENERGY PERFORMANCE MONITORING: GENERATION
Forced Outage Rate
6
5 Generating Fleet Reliability
4
The JEA Fleet Forced Outage
3 exceeded target in FY19 due to
2 extended unit recovery on
Northside Unit 2, as a result of
1
excess ash build up.
0
FY09 FY10 FY11 FY12 FY13 FY14 FY15 FY16 FY17 FY18 FY19 Numerous improvements and
projects were implemented in
Permit Exceedances generation to make the units more
10 reliable, have greater capacity and
9 lower costs.
8
7
6
Environmental Compliance
5
4
3
2 No permit exceedances during the
1 last three fiscal years.
0
FY09 FY10 FY11 FY12 FY13 FY14 FY15 FY16 FY17 FY18 FY19
JEA remains actively engaged in
preparing for all new and
Generating Plant
Performance
Metric FY2019 FY2018 FY2017 emerging environmental
Generation Fleet Reliability Forced Outages Rate 5.0 2.1 2.2
regulations
Environmental Compliance Permit Exceedances 0 0 0
Downward trends in these metrics indicate improvements in system reliability
20CAPITAL NEEDS AND FUNDING SOURCES
JEA has streamlined its capital plan, maintaining a healthy utility system in a low-growth environment
Actual 2020-2024
Electric System ($000s) 2020 2021 2022 2023 2024
2019 Average
Internally Generated Funds Available for
$178,959 $238,788 $244,301 $185,023 $181,478 $172,512
Capital1
Capital Fund Balance Deposits (Withdrawals) (106,912) 1,515 18,236 (1,848) 18,014 2,705
Debt Financing 0 0 0 0 0 0
Capital Plan Spend $285,871 $237,273 $226,066 $186,871 $163,464 $169,807 $196,696
Capital Fund Balance2 $83,017 $84,533 $102,768 $100,920 $118,934 $121,639
Actual 2020-2024
Scherer ($000s) 2020 2021 2022 2023 2024
2019 Average
Internally Generated Funds Available for
$11,053 $7,333 $9,450 $13,033 $6,502 $7,850
Capital
Capital Fund Balance Withdrawals (Deposits) 0 0 0 0 0 0
Debt Financing 0 0 0 0 0 0
Capital Plan Spend $11,053 $7,333 $9,450 $13,033 $6,502 $7,850 $8,834
1 Net of amounts used for planned accelerated debt repayments
2 Excludes FEMA reimbursement
Note : Items may not foot due to rounding
21FLEET OPTIMIZATION AND ASSET UTILIZATION
Generation fleet provides sufficient capacity to meet current and future demand
4,000
3,500
3,000
2,500
MW
2,000
1,500
1,000
500
-
2008 2009 2010 2011 2012 2013 2014 2015 2016 2017 2018 2019 2020 2021
Firm Purchases SJRPP Scherer
NS CFB BBCC NS 3
7FA CTs NS CTs Actual Peak
Firm Peak Forecast Firm Peak Demand + 15% Reserve
Reserves are to cover forecast error. Once peak occurs 15% reserve line does not apply.
22CURRENT AND FUTURE PV SOLAR SITES
JEA Is Pursuing a Substantial
Increase in Solar Generation
We have contracted to add up
to 250 MW of universal solar
by 2022, in addition to 39 MW
installed, making Jacksonville
one of the largest solar cities
in the U.S.
What this Looks Like:
New sites, land owned by JEA
Reduces exposure to fossil
fuel volatility
PPA prices below current fuel
rate with no escalator
providing a 20+ year fuel
hedge
Green – Active Orange - Planned
23ENERGY SYSTEM SUMMARY
Strong operational
and reliability metrics
Capital plan funded
without debt
Lowest system debt
in 34 years
2403
PLANT VOGTLE
25VOGTLE 3 & 4 OVERVIEW
No changes to in-service dates
Total project is 84% complete
Unit 3 direct construction is
85% complete
Unit 4 direct construction is
63% complete
No change in projected overall
capital cost forecast
All 4 Chinese AP1000 units
(Sanmen 1 and 2 and
Haiyang 1 and 2) completed
and connected to grid
Expected completion: November 2021 (Unit 3) and November 2022 (Unit 4)
Sources: Southern Company 1st Quarter, 2nd Quarter, 3rd Quarter and 4th Quarter 2019 Earnings Presentations
26VOGTLE 3 & 4 MILESTONES: WORK COMPLETED DURING 2019
Q1 Q2 Q3 Q4
Set Unit 3 containment Unit 3 Integrated Started open vessel
vessel top head Unit 3 initial energization
flush started testing
Unit 4 middle
Set first of two core Main control room
containment vessel
make-up tanks for Unit 4 ready for testing
ring set
Unit 3 generator rotor set
Indicates major milestone Sources: Southern Company 1st Quarter, 2nd Quarter, 3rd Quarter and 4th Quarter 2019 Earnings Presentations
2704
WATER AND
WASTEWATER
SYSTEM
28
28WATER AND WASTEWATER SYSTEM HIGHLIGHTS
$212M capital delivered, the most in 15 years
Lowest amount of nitrogen discharged in history
at 397 tons versus a permit limit of 683 tons
Best permit compliance performance in 15 years
Leveraging technology to improve reliability and
decrease costs through virtual pump station
inspections
Doubled potable water grid pressure monitoring
locations to facilitate optimization of water use
and delivery
Comprehensive Integrated Water Resource
Planning continues, planning for Northeast
Florida water supply and environmental needs
long into the future
29WATER AND WASTEWATER SYSTEM INFRASTRUCTURE
Water System Wastewater System
20 major and 18 small water treatment plants Approximately 4,113 miles of gravity sewers and
and two re-pump facilities force mains
137 permitted water supply wells, 4,806 miles of 1,482 pumping stations, 754 low pressure
water distribution mains and total finished water sewer units, and 11 treatment plants currently
storage capacity of over 83 million gallons ranging in rated average daily treatment capacity
from approximately 0.2 to 52.5 MGD
Two major and four small distribution grids
30WATER AND WASTEWATER SYSTEM METRICS
Number of Customers Affected by
Unplanned Water Main Outages
FY19 9,268
Consumptive Use Permit (CUP)
FY18 16,731
145 142
FY17 4,893
140 138
FY16 12,735
135
FY15 5,629
Million Gallons per Day (MGD)
130
FY14 4,645 122
125
FY13 3,671 118
120
115
110
Average Minutes Water Pressure 105
50 Less Than 30 PSI
Average Minutes per Month
45 100
40
35 95
30
90
25 2011 2012 2013 2014 2015 2016 2017 2018 2019 2020 2021 2022
20
15 Annual Production CUP Allocation
10
5 CUP ends in May 2031
0
Sep-14
Sep-15
Sep-16
Sep-17
Sep-18
Sep-19
Dec-14
Jun-15
Mar-15
Dec-15
Jun-16
Mar-16
Dec-16
Jun-17
Mar-17
Dec-17
Jun-18
Mar-18
Dec-18
Jun-19
Mar-19
31FRAMEWORK TO RESILIENCY
Resiliency program developed to improve system reliability and operational continuity of
JEA’s Water and Wastewater systems from lessons learned from hurricanes Matthew and Irma
CH2M/Jacobs provided Resiliency Assessment, Program Management
and Engineering Services
Identified system vulnerabilities and provided recommendations to address
issues
New Standards are currently under development based on findings from
assessments as well as projected future climate conditions
Evaluating the power quality of the electric circuits serving JEA’s
critical Class III and IV pump stations
Dual electric feed opportunities at specific pump stations
Improvements on JEA’s electric grid
Initiated system hardening projects such as converting electric lines
serving critical pump stations from overhead to underground
61 secondary electric lines and 21 primary electric lines were converted from
overhead to underground
Having backup generation is essential to maintaining operational
continuity especially during extreme weather conditions
JEA has purchased multiple types of assets for backup power
JEA has a lease agreement to rent backup power during the Hurricane Season
93% of Wastewater peak hourly flow is covered by backup power
32CAPITAL NEEDS AND FUNDING SOURCES
The Water and Wastewater capital plan increases are driven by: growth in both systems, and
programs to rehabilitate and harden infrastructure critical to system operation and reliability
Current rates (1.5% customer growth) plus new debt will fund recurring and reinvestment type projects over the planning horizon
Over 1/3rd of projected capital spend is directly growth – capacity expansion related
Accelerated debt repayment in 2019 allows for additional internally generated funds to be available for capital over the next 5 years
Actual 2020-2024
Water and Wastewater System ($000s) 2020 2021 2022 2023 2024
2019 Average
Internally Generated Funds Available for Capital1 $214,894 $207,561 $249,611 $253,495 $182,218 $174,033 $213,383
Capital Fund Balance Deposits (Withdrawals)2 2,343 (28,803) 0 0 0 0 $ 5,759
Debt Financing $0 $0 $132,080 $123,014 $112,145 $31,944 $79,837
Capital Plan Spend $212,551 $236,364 $381,691 $376,509 $294,363 $205,977 $298,981
Capital Fund Balance $48,803 $20,000 $20,000 $20,000 $20,000 $20,000
1 Internally generated funds available for capital are sourced from R&R and operating capital outlay along with surplus funds from prior budget appropriation
restrictions
2 Net of amounts taken from capital fund balance for accelerated debt repayments
33CONTINUED REDUCTION OF NITROGEN TO THE ST. JOHNS RIVER
Primary
Treatment
2,500 Secondary Treatment Advanced Nutrient Removal 1,200,000
1,000,000
2,000
Population served by wastewater system
Tons of Total Nitrogen to the River/yr
BMAP Adopted:
800,000
TMDL Limit 1,536 tons/year
1,500
600,000
1,000 683 tons/year
400,000
JEA Acquires Public
Utilities, 1997
500
397 in FY19 200,000
Clean Water Act Passed
by Congress, 1972 JEA Begins Voluntary Nitrogen
Reduction Initiative, 2000
0 0
Estimated Tons of Total Nitrogen to the River Actual Tons of Total Nitrogen to the River Duval County Population (BEBR)
34WATER SUPPLY SUSTAINABILITY PLAN
Traditional groundwater sources are becoming limited in Florida. JEA focused
on multiple solutions for sustainable supply
iWater IWRP Study Implementation Plan
JEA Water Supply Testing Integrated Water JEA Water Supply and
and Rehabilitation Program Resource Plan Demand Management Program
FY15 to FY20 FY19 to FY21 FY20 …
Production & Transmission Planning IWRP Implementation
Maximize reclaimed water
Well rehab and performance for 84 of Alternative water supplies
JEA’s 137 raw water wells TWMP* (FY 2000 to Present)
Conservation messaging
Hydraulic and water quality modeling Water purification demonstration plant
Demand-side management program
Identify transmission piping projects 3rd river crossing evaluation
Comprehensive communication plan
Aquifer storage and recovery
* JEA’s Total Water Management Plan (TWMP)
JEA obtained a 20-year consolidated Consumptive Use Permit (CUP) in May 2011
JEA continues to implement the wellfield rehabilitation and reclaimed system expansion program
Sustainable water supply will integrate outcomes of the IWRP
35PURIFIED WATER PROJECT: LEADING THE WAY IN FLORIDA
Purified Water is the most
promising alternative water
supply option in terms of
cost and complexity
PHASE 1 PHASE 2 PHASE 3
Research & Development Demonstration Commercial Implementation
Included testing of over 3,000 Design underway Capacity expandable as
water quality samples to needed for future water supply
evaluate the performance of Capable of producing up to 1.0
two water purification MGD
technologies
Learning Center area for public
“Reverse Osmosis/Advanced tours and operator training
Oxidation Process” was
Demonstrating safe and
selected due to its operational
reliable alternative water
advantages and the ability to
supply through a partnership
consistently produce higher
with the state
quality at a similar cost
36WATER AND WASTEWATER SYSTEM SUMMARY
Superior operational
performance
Capital plan financed
predominately with
internal funds
Rates stable for the five
year planning horizon
Focused on sustainable
supply
3705
FY19 RESULTS
38
38HISTORICAL FINANCIAL METRICS
FY2019 RESULTS
DEMONSTRATE STRONG
PERFORMANCE ACROSS Debt to Asset % 1 Debt Service Coverage
80.0% 3.5
ALL KEY FINANCIAL 70.0% 2 3.0
60.0% 2.5
METRICS 50.0%
2.0
40.0%
1.5
30.0%
1.0
FY2019 Debt Service Coverage 20.0%
0.5
10.0%
remains strong and provides 0.0% -
financial flexibility to respond Energy System 3 Water Wastewater
System
Energy System Water Wastewater
System
to industry challenges 1 Net Funded Debt; metrics re-cast to reflect change in methodology as of 2018
2 Impact of SJRPP shutdown
3 Includes Electric System, Scherer and SJRPP
Debt to Asset % continues to
improve and approach/drop
below long-term internal Days Liquidity Days Cash
700 700
targets 600
600
500 500
Days Liquidity and Days Cash 400
400
metrics continue to be strong 300 300
and provide the ability to invest 200 200
in infrastructure in both 100 100
systems without new debt 0
Water Wastewater
0
Energy System Water Wastewater
Energy System
System System
FY2019 saw further
commitment to early debt re-
2015 2016 2017 2018 2019 Long Term targets per JEA pricing policy
payment in both systems
39ENERGY SYSTEM KEY FINANCIAL METRICS
What We Committed to in What We Achieved During FY2019
February 2019
2.8x combined debt service coverage
2.8x combined debt service coverage
Days of cash on hand: 146 days
Days of cash on hand: 131 days
Days of liquidity: 308 days
Days of liquidity: 303 days
Total debt reduction(1)(2): $281 million
Total debt reduction(1): $281 million
Debt to asset ratio(1): 65.0%
Debt to asset ratio(1): 63.9%
Debt to capitalization(1): 60.9%
Debt to capitalization(1): 60.0%
Electric System capital expenditures: Electric System capital expenditures:
$275 million $285 million
System MWh sales decrease: (1.3%) System MWh sales increase: 0.3%
Base revenue reduction: (1.3%) Base revenue increase: 0.3%
1 Includes Electric System, Scherer, and SJRPP
2 STAR Plan Phase 2 completed in October 2019
40ENERGY SYSTEM DEBT MANAGEMENT
5.0 100%
Total Debt 1
95%
Debt Composition
Peak: $4.3B Debt to Asset Ratio as of September 30, 2019
2
Peer ratio (46%) 90%
4.0 85%
80% Synthetic Fixed
$406,410,000
19%
75%
Variable
3.0 * 70%
$184,540,000
8%
65%
Fixed
$1,607,195,000
$2.2B 60% 73%
2.0 55%
50%
45%
1.0 40%
02 03 04 05 06 07 08 09 10 11 12 13 14 15 16 17 18 19 $2.1 billion reduction in debt
Fiscal Year Ended since peak
1 Includes Electric System, Scherer, and SJRPP
2 Per
Variable rate exposure reduced
Moody’s Sector In-Depth Report “Public Power Utilities – US Medians: Stability
amid low new debt issuance and carbon transition,” Sep 2019 from 20% in 2008 to 8% in
*Increase in Debt to Asset Ratio in FY18 due to SJRPP retirement
2019
41ENERGY SYSTEM UNIT SALES1
14
System
Planning
Forecast
Financial
Planning
MWh Unit Sales (Millions)
12
Forecast
Compound Annual Growth Rates (CAGR)
Actual 1990’s: ……………………... 3.4%
10
Actual 2000’s: ……….................. 1.4%
Actual 2010’s: …………………….(0.8%) 2
8
FY1990
FY1991
FY1992
FY1993
FY1994
FY1995
FY1996
FY1997
FY1998
FY1999
FY2000
FY2001
FY2002
FY2003
FY2004
FY2005
FY2006
FY2007
FY2008
FY2009
FY2010
FY2011
FY2012
FY2013
FY2014
FY2015
FY2016
FY2017
FY2018
FY2019
FY2020
FY2021
FY2022
FY2023
FY2024
1 JEA territorial sales; history includes sales for resale – territorial through CY 2017
2 Includes impact of expiration of sales for resale – territorial contract with FPU; CAGR with sale for resale - territorial removed: (0.4%)
42ENERGY SYSTEM AVERAGE RESIDENTIAL BILL
Current Residential Bill
(consumption @ 1,000 kWh)
$140 Current
Bill
$120
$100
$80 Total Charges
$/Month
$123.34
$60
$40
$20
$0 Customer Charge Energy Charge Fuel Rate
FY2003
FY2004
FY2005
FY2006
FY2007
FY2008
FY2009
FY2010
FY2011
FY2012
FY2013
FY2014
FY2015
FY2016
FY2017
FY2018
FY2019
FY2020
FY2021
FY2022
FY2023
FY2024
Env Charge Taxes & Fees
Utility Charges Taxes and Fees
Historical Look at Rate Increases
There have been no increases to the customer charge only to the energy charge portion of the bill.
FY2008 – FY2009: A separate environmental charge was added. Taxes and fees increased with the 3% franchise fee by COJ for Duval customers.
FY2008 – FY2012: Fuel markets came down considerably since their highs at the end of the 2000’s and the corresponding decrease in fuel rates over that
time offset increases made to the energy charges. Further, one-time fuel credits were refunded in certain billing periods throughout FY 2013-2016.
Since FY2012: JEA residential customers have experienced stable, or decreasing bills while the CPI for urban consumers rose over 10% during same
timeframe1. In FY2017, the increase to energy charge was offset by lower fuel rate.
*Projected increases are mainly driven by the costs of the MEAG PPA and operating expenses.
43ENERGY SYSTEM RESIDENTIAL BILL PROJECTION
2024 Projected Residential Bill
(consumption @ 1,000 kWh)
$134.79
$140
$123.34
$120
$100
$/Month
$80
Total Charges
$60
$134.79
$40
$20
$0
FY2020 FY2021 FY2022 FY2023 FY2024
Customer Charge Energy Charge Fuel Rate Env Charge Taxes and Fees
Customer Charge Energy Charge Fuel Rate
Env Charge Taxes & Fees
Projected Rate Trajectory – Next 5 Years
Over the next five years, rates will need to be increased primarily due to the incorporating of costs associated with the Plant Vogtle MEAG PPA contract.
JEA estimates the average residential bill impact from incorporating the Vogtle PPA charges to be limited to inflationary levels of up to 3% per year from
FY2022-FY2024 (assuming the fuel rate is decreased from current level of $32.50/MWh to $30.00/MWh).
JEA’s free cash flow from existing and future rates will position the business to meet MEAG obligations, continue to focus on managing all key financial metrics,
and balance customer affordability for its service.
44ENERGY SYSTEM FINANCIAL PROJECTIONS
Strong Debt Service Debt to Asset % 1
Debt Service Coverage
Coverage metrics result of 6.0
80%
prior accelerated debt 5.0
70%
60%
repayments. Near-term 4.0
4.2
50%
52%
opportunity to refinance 3.0
40%
debt for additional savings 2.0
30%
20%
1.0 10%
Debt to Asset % under -
0%
internal policy targets
Will use remaining funds at Days Liquidity Days Cash
SJRPP, after 400 200
decommissioning, to repay 350
150 144
300 284
all outstanding Issue three 250
debt beyond 2030 – 200 100
projected NPV interest 150
100 50
savings ~ $44 million 50
0 0
Significant liquidity to
continue world class
operations
2020 2021 2022 2023 2024 Long Term targets per JEA pricing policy
45WATER AND WASTEWATER SYSTEM KEY FINANCIAL METRICS
What We Committed to in What We Achieved During FY2019
February 2019
2.9x combined debt service coverage 3.0x combined debt service coverage
Days of cash on hand: 100 days Days of cash on hand: 186 days
Days of liquidity: 241 days Days of liquidity: 334 days
Total debt reduction: $190 million Total debt reduction (1): $190 million
Debt to asset ratio: 44.1% Debt to asset ratio: 44.8%
Debt to capitalization: 40.7% Debt to capitalization: 41.5%
Capital expenditures: $200 million
Capital expenditures: $213 million
1.5% increase in Water kgal sales
4.2% increase in Water kgal sales
Total system revenue increase: 7.4%
Total system revenue increase: 6.7%
1 STAR Plan Phase 2 completed in October 2019
46WATER AND WASTEWATER SYSTEM DEBT MANAGEMENT
2.5 100%
Total Debt
Debt Composition
Debt to Asset Ratio
Peak: $2.1B as of September 30, 2019
1
Peer ratio (49%)
2.0
80% Synthetic Fixed
$110,140,000
8%
1.5
$1.4B Variable
$162,155,000
12%
60%
1.0
Fixed
$1,115,370,000
80%
40%
0.5
Over $676 million reduction in
0.0 20%
02 03 04 05 06 07 08 09 10 11 12 13 14 15 16 17 18 19 debt since peak
Fiscal Year Ended Variable rate exposure reduced
1 Calculated from Moody’s Municipal Financial Ratio Analysis database of
from 18% in 2009 to 12% in
209 Aa rated public water-sewer utilities, Jan. 10, 2017
2019
47WATER AND WASTEWATER SYSTEM UNIT SALES1
90
System
Planning
Forecast
Kgal Unit Sales (Millions)
Financial
Planning
70 Forecast
50
Compound Annual Growth Rates (CAGR)
Actual 1990’s: …………………………....4.3%
Actual 2000’s: ……….........................3.1%
Actual 2010’s: ………………………..….1.1%
30
FY1990
FY1993
FY1996
FY1999
FY2002
FY2005
FY2008
FY2011
FY2014
FY2017
FY2020
FY2023
1 Chart represents the sum of water, wastewater, and reclaim actual/forecast sales.
48WATER AND WASTEWATER SYSTEM AVERAGE RESIDENTIAL BILL
Residential Bill Over Time Current Residential Bill
(consumption @ 6 kgal – 5/8” meter)
$80
$60
Total Charges
$/Month
$40
$70.45
$20
$0
Customer Charge kgal Charge Taxes & Fees
Utility Charges Taxes and Fees
Historical Look at Rate Increases
JEA’s water and wastewater rates increased beginning in FY05 through FY11 to support capital improvements in water, wastewater, and reclaim systems. JEA
invested heavily to rehabilitate the aging water/wastewater infrastructure that was assumed with the merger with the City of Jacksonville’s water/wastewater
system in 1997, United Water in 2001 and other regional water system acquisitions. JEA also continued investment in the reclaim water system, including
expanding the system.
FY04 – FY09: Both the water customer charge and consumption charge increased in FY06 and each year thereafter. In FY09 the third tier minimum for water
was changed from 22kgal to 20kgal. The wastewater customer charge and consumption charge increase in FY05 and each year thereafter. The second tier for
wastewater was adjusted for wastewater in FY09. The 2nd tier was adjusted from >22kgal to (7kgal to 20kgal), with no charge > 20kgal. An environmental
charge was also added in FY09 for water and wastewater.
FY10 – Present: Both water and wastewater customer charge and consumption charge increased in FY10 and FY11. The water and wastewater consumption
charge also increased in FY12. There have been no rate adjustments in the water/wastewater system since FY12.
49WATER AND WASTEWATER SYSTEM FINANCIAL PROJECTIONS
Debt to Asset ratio at 43% by 2024 • $1.5 billion capital plan FY20 – FY24 • AAA financial health
Debt Service Coverage Debt to Asset %
6.00 60.0%
5.00
50.0%
4.00
43%
3.00 2.6
40.0%
2.00
30.0%
1.00
- 20.0%
Days Liquidity Days Cash
300 200
250
205 150
200
150 100
100 62
50
50
0 0
2020 2021 2022 2023 2024 Long Term targets per JEA pricing policy
5006
ENTERPRISE RISK
MANAGEMENT
51ENTERPRISE RISK MANAGEMENT
Electric Risk
Committee JEA’s Enterprise Risk
Water and
Wastewater
FERC/NERC/
CIP Electric
Management (ERM)
Regulatory
Compliance
Compliance
Committee program identifies,
Committee
assesses, measures,
and actively manages
Compliance Fuel and
Purchased
risk, including mitigation
Oversight
Committee Enterprise Power Risk
strategies and actions.
Compliance Committee
and Risk
Committee
Our methodology includes
Technology Debt and
prioritizing risks, relative to
Risk
Committee
Investment
Committee
each other, assesses
reputation impact of a risk
Technology
Revenue and
Expense
events and assures
Projects
Committee
Management
Committee
effectiveness of mitigation
strategies.
52ERM CORPORATE RISKS HEAT MAP SCORING
The risk score is a factor of the risk
impact x likelihood which helps us
Almost evaluate the criticality of the risks
Certain 5 5 10 15 20 25
>90% and the need for mitigation. The
impact and likelihood criteria include
Likely additional variables, each of which
4 4 8 12 16 20
65-90%
LIKELIHOOD
enhances our ability in determining
risk criticality as follows:
Possible
3 3 6 9 12 15
35-65%
Unlikely 1. Financial impact identifies the out-of-
2 2 4 6 8 10
5-35% pocket /deductible financial impact
after insurance coverage payment
Rare
1 1 2 3 4 5 2. Reputational impact of a risk eventCURRENT TOP RISKS FOR JEA
Black Swan (High Impact/Low Probability Event Physical Security/Terrorism
Major negative impact if certain major catastrophic events JEA may be a primary target for an act of terrorism, based
occur which would result in the inability to maintain Electric upon its designation as critical infrastructure for the City of
and/or Water/Sewer service for an extended period of time. Jacksonville.
Carbon Emission Mitigation/Renewable Energy Stds. Staffing/Work Environment
A Carbon Tax implemented within next 5 years may accelerate Adequate staff may not be in place to enable JEA to meet
the need to replace existing higher carbon emitting generation future basic utility objectives.
units with renewables; resulting in increased financial impact.
Cooling Water Intake Structures 316(b) Supply Chain Management
An EPA rule may require a costly modified water intake structure Long-term disruption in goods and services from critical vendors,
and/or cooling tower upgrades. The upgrades necessary will be and/or reliance on sole-source vendors may result in the inability
determined by a peer review panel and federal agencies. to provide critical services or obtain equipment/parts.
Cyber Security Business Disruption Surface Water Discharge Risk
Unauthorized intrusion into JEA's critical systems and network May be negatively impacted by proposed State law changes
may occur, resulting in possible Denial of Service (DOS), grid requiring significant discharge reduction to surface waters,
intrusions, and ransomware threats. requiring higher reuse, resulting in increased costs.
Disruptive Technologies/Long-term Planning Water Supply Management/Long Term Planning
Customers have increased options for reducing energy and Long-term water supply planning is becoming more complex due
water usage; Investment in new technologies and existing to the difficulty in predicting the impact of changing variables and
infrastructure may have significant negative financial impact. meeting certain provisions of the Consumptive Use Permit (CUP).
Nuclear Power Portfolio Weather & Climate Change Impact Resiliency Efforts
Decision to expand into nuclear power generation ownership Weather patterns and/or short-term or seasonal extreme weather
and/or PPAs poses significant financial, reputational and may negatively impact long-term planning, financial and reliability
regulatory risks. performance, reputation and decreased customer satisfaction.
These represent the current Top Corporate Risks (listed in alphabetical order) based on their Financial and
reputational impact; as well as their potential to negatively impact reliability and operational effectiveness.
5407
ENTERPRISE ASSET
MANAGEMENT
55STRATEGIC AND HOLISTIC MANAGEMENT OF JEA ASSETS
Integration of data, Provide a way to Unify processes for
processes, projects analyze the effects of wide-ranging asset
and programs future possibilities management functions
across multiple areas
Integration of real-time and Data driven decisions to
historical data alongside improve operations through
environmental conditions better asset availability,
reliability and utilization
5608
COVID-19 IMPACTS
57COVID-19 EMPLOYEE PROTECTIONS
JEA’s goal throughout this pandemic emergency is to provide reliable service
to our customers while keeping our employees and community safe.
Top Priority is the Safety of our Employees
Implemented health and temperature screening at all electric generating
stations and the water lab; expanding to other critical facilities
Staggered shifts and alternating scheduling for field crews, ensuring
critical work is performed, and assigned diverse deployment sites to limit
the size of employee gatherings
Increased thorough sterilization of common areas and equipment
Distributed signage for field workers to use to help keep community
members and customers at least six feet away and promoted social
distancing through various communications channels
Established fully redundant electric and water control centers; both are
used on a day-to-day basis but either can control system in an emergency
Established shelter-in-place plans for our most critical non-redundant
facilities, such as our generating stations
All non-field employees, including call center staff, are working remotely
under Jacksonville Mayor Curry’s “Safer-at-Home” order
One confirmed COVID-19 positive test to date
58COVID-19 CUSTOMER ASSISTANCE PROGRAMS
JEA’s goal throughout this pandemic emergency is to provide reliable service
to our customers while keeping our employees and community safe.
Providing our Customers with Relief
Fuel charge rebate to electric customers of approximately $27
million will be implemented during the month of May
Developed a campaign for when customers receive electric fuel
rebates offering options for people to donate to JEA/local
relief programs
Continued suspension of disconnects, waived late fees, waived
credit card charges
Approximately 23,000 (5%) electric and 14,000 (4%) water
services accounts were eligible for disconnection as of April 17th
The percentage of disconnection eligible services appears to
be flattening
59COVID-19 FINANCIAL UPDATE
JEA’s goal throughout this pandemic emergency is to provide reliable service
to our customers while keeping our employees and community safe.
COVID-19 Impacts on Financials
Analysis of a 10% reduction in sales for the Energy and Water and
Wastewater Systems during the March through September time
frame due to the COVID-19 pandemic do not result in material
degradation of either System’s credit metrics
This sales reduction is a conservative estimate of the impact
of the pandemic
More sophisticated analysis of impact on sales is
forthcoming
Liquidity remains strong, with approximately $100 million of
operating cash and $145 million in renewal and replacement
funds in addition to a $500 million revolving credit facility
Current remarketings of various series of variable rate demand
obligations have rates significantly through pre-COVID-19 levels
No issues foreseen in upcoming credit agreement renewals
6009
CONCLUSION
61JEA CONTINUES TO DEMONSTRATE CONSISTENTLY SUPERIOR
FINANCIAL AND OPERATIONAL PERFORMANCE
Energy Water & Wastewater
JEA merits a AA credit rating JEA merits a AAA credit rating
Maintained excellent financial and operation Superior operational and financial metrics
metrics
Robust growth in sales and customers
Repaid $233 million in debt for a total of $2.1
billion since 2009 with continued commitment to Capital program funded with a proportionate
actively and aggressively deleverage and de-risk amounts of new debt and internal capital with
the business no rate increases
Continued to strategically plan to absorb the cost Repaid $145 million in debt for a total of $676
of Plant Vogtle million since 2011 projected to be a total of
$875 million over the next 5 years
Capital program will continue to be funded with no
new debt and modest base rate increases Continued commitment to investing in
infrastructure to ensure reliability in operations
Strengthened our fuel diversity and purchased now and into the future
power agreements
Continuing system hardening projects
Re-evaluated our risks and continued actively
seeking ways to mitigate them Researched and developed potential
alternative water supply optional
6210 Current Refunding Opportunities
CURRENT BOND REFUNDING OPPORTUNITIES

Subject to prevailing
market conditions, we
expect to launch current
refunding bond offerings
for the Electric and Water
and Sewer Systems
                                                       ENERGY   WATER
Based upon analyses
                              Refunding
provided by PFM, the
refunding transactions       Par Amount                $262     $158    $420
would generate in excess      Net PV
of $3 million in annual       Savings                   $31       $23   $54
debt service savings
                              In millions of dollars

Bond refunding
delegation resolutions
are in place to allow a
launch as soon as market
conditions improve

                                                                           64
11
JEA BOARD
MEMBER PROFILES
65John
Baker Mr. Baker is currently Executive Chairman and Chief
Executive Officer of FRP Holdings, Inc. (successor to Patriot
Executive Chairman & CEO of Transportation Holding, Inc.), a real estate company located
in Jacksonville, Florida. From February 2008 until October
FRP Holdings, Inc. 2010, he served as the President and Chief Executive
Officer of Patriot. Before joining Patriot, Mr. Baker was
President and Chief Executive Officer of Florida Rock
Industries, Inc.
Mr. Baker received a B.A. from Princeton University, and
graduated with honors from the University of Florida School
of Law. Mr. Baker is a director of Blue Water Industries
Holdings, LLC and a senior advisor for Brinkmere Capital
Partners, LLC, a private equity firm.
Mr. Baker is a former member of the of the Board of
Directors of Wells Fargo & Company, Jacksonville Port
Authority, Progress Energy, Vulcan Materials, and Hughes
Supply. Mr. Baker maintains leadership roles in several
community educational organizations including Tiger
Academy, KIPP School Jacksonville, Edward Waters College
and the YMCA of Florida’s First Coast
TERM
04/16/2020 – 02/28/2024
66Joe DiSalvo recently transitioned from the U.S. Army as a Lieutenant General
Joe
(3 Star General Officer). He has over 30 years as a strategic leader who built
trust, initiative, innovation, integrity, core values, and accountability in
organizations ranging from 850 to 65,000 personnel. Exceptionally
DiSalvo
experienced interacting with U.S. federal government agencies, Congress, and
international governments (14 years working abroad). Successfully managed
$1B budgets and led 4 strategic planning projects at the national level. His
passion is leading and inspiring individuals and organizations to excel and
impact positively on society. Joe currently provides consulting services focused
on leader development, strategic planning, team building, business
Lieutenant General U.S. Army, Retired development and crisis management.
Joe graduated from the United States Military Academy in 1981 with a
Bachelor of Science degree and was commissioned in the Armor Corps. He
has a Masters in Operations Research from the Air Force Institute of
Technology and a Masters of Strategic Studies from the U.S. Army War College.
Joe’s military career culminated as the U.S. Southern Command’s Deputy
Commanding General, as a Lieutenant General, from 2015-2018, where he
was responsible for security cooperation and capacity building with militaries
from Central America, the Caribbean, and South America. From 2013 to 2015
as a Major General, he commanded the U.S. 6th Army where he was
responsible for partnering, advising, and mentoring senior army leaders from
Central America, the Caribbean, and South America. From 2012 to 2013, Joe
was Chief of Staff, U.S. Southern Command, where he led 9 directorates and
oversaw a $1,062M budget.
Joe was Deputy Commanding General of III U.S. Army Corps from 2010 to
2012 where he oversaw the tactical training, operations, and quality of life for
35,000 Soldiers and their families in Fort Hood, Texas. Additionally, as a
Brigadier General, he was also the Corps Chief of Staff from 2009 to 2010,
where he supervised 8 directorates and managed a $500M budget.
While assigned to the Pentagon, from 2008-2009, he was the senior advisor
to the Chairman of the Joint Chiefs of Staff for Western Hemisphere security
and Homeland Defense. As a Colonel, in 2006-2007, Joe was the lead Iraq
TERM campaign policy analyst for the Joint Staff. From 2003-2006, he commanded
2nd Brigade Combat Team, 3rd Infantry Division, which included two combat
04/16/2020 – 02/28/2022 tours.
Joe is married with three grown children. He is a military history enthusiast and
enjoys all sports, especially road racing (running).
67Dr. A. Zachary Faison, Jr. assumed responsibility as the 30th President and CEO
Dr. A. Zachary
of Edward Waters College (EWC) in July 2018 post a unanimous vote by the
College’s Board of Trustees. Faison’s selection made him the youngest serving
President & CEO of a Historically Black College or University (HBCU) in America.
Faison, Jr. A native of Atlanta, Georgia, Faison’s career includes distinguished professional
experiences as a higher education executive administrator, educator, and
attorney. Before his Presidential appointment at EWC, Faison served as General
Counsel & Vice President of External Affairs at Tuskegee University (TU) in
30th President & CEO of Tuskegee, AL. Prior to his appointment at TU, he served as Vice President for
Enrollment Management & Student Affairs at Virginia Union University (VUU) in
Edward Waters College Richmond, VA, where he founded the VUU College for African-American Men
(VCAAM). Dr. Faison also previously served as Special Assistant to the President
for Legal & Legislative Affairs, Community Affairs, and Economic Development at
Mississippi Valley State University in Itta Bena, MS, where he later became
University Chief of Staff before being named Vice President of Institutional
Advancement & Executive Director of the MVSU Foundation. As a scholar-
educator, Faison has held professorial appointments at both the undergraduate
and graduate levels in Political Science, Criminal Justice, and Business
Administration. Faison is also a former state prosecutor having prosecuted
criminal felony drug cases in Georgia.
Faison graduated Magna Cum Laude from Albany State University (ASU) with a
Bachelor of Arts (B.A.) in English where he was an ASU Presidential & Foundation
Scholar, Dwight D. Eisenhower National Fellow (US-DOT), and an ASU Velma
Fudge Grant University Honors Program & ASU Merit Scholar Graduate. He
earned his Juris Doctorate (J.D.) from the University of Georgia School of Law
(UGA) where he was a member of the Executive Moot Court Board & Moot Court
team. Faison completed post-doctoral study at the Harvard University Graduate
School of Education’s Institute for Educational Management (IEM) and was a
Millennium Leadership Initiative Institute (MLI) Fellow of the American
Association of State Colleges & Universities (AASCU). He also holds the
Certification in Fundraising Management (CFRM) from The Philanthropy School
at Indiana University (IU).
TERM
He is the son of Alderman Faison, Sr. and Dr. Jewel J. Faison, and brother to Dr.
04/16/2020 – 02/28/2022 Morgan Zacheya-Jewel Faison. Faison has been blissfully married for twelve
years to Mrs. Tyciee L. Faison, who is also a seasoned higher education
administrator, educator, and ordained minister.
68Leon L.
Leon L. Haley Jr., MD, MHSA, CPE. FACEP, FACHE currently serves as the
CEO of UF Health Jacksonville, Vice-President for Health Affairs, and Dean of
the University of Florida College of Medicine –Jacksonville; and Professor of
Haley Jr., MD Emergency Medicine. He previously served in Atlanta, GA as the Emory
Executive Associate Dean for Clinical Services at Grady and Chief Medical
Officer of the Emory Medical Care Foundation. A former Professor in the
Department of Emergency Medicine at Emory, Dr. Haley additionally served
as Deputy Senior Vice-President of Medical Affairs, Chief of Emergency
CEO of UF Health Jacksonville Medicine for the Grady Health System and Vice-Chairman of the
Department of Emergency Medicine at Emory University.
A native of Pittsburgh, PA, Dr. Haley received his undergraduate degree from
Brown University, his medical degree from the University of Pittsburgh, and
his master’s degree in health services administration from the University of
Michigan. Dr. Haley completed his residency, including a year as Chief
Resident, in Emergency Medicine at the Henry Ford Health System in
Detroit, MI. Prior to his position at Grady and Emory, Dr. Haley was a Senior
Staff Physician at the Henry Ford Health System and a member of the Henry
Ford Medical Group. Dr. Haley is Board-Certified in Emergency Medicine, a
Certified Physician Executive, Fellow of the American College of Emergency
Physicians, and a Fellow of the American College of Healthcare Executives.
Dr. Haley is an active board member of the Jacksonville Chamber of
Commerce, the Jacksonville Civic Council, the American Hospital
Association Metro Governance Council, the Florida Hospital Association
Policy Committee, the Florida Safety Net Alliance, the American Board of
Emergency Medicine and the Griffith Leadership Center at the University of
Michigan.
Dr. Haley has interests and publications in health administration, operations
and strategic management, and diversity as it relates to healthcare and
TERM emergency medicine .Dr. Haley has previously served on or chaired various
04/16/2020 – 02/28/2024 hospital, university, and national committees including the Board of
Directors for the Essential Hospitals Institute, the Society for Academic
Emergency Medicine and the Institute of Medicine’s Committee on Health
Insurance Status.
69Marty Marty Lanahan currently serves as the Tampa Bay Market President
for IBERIABANK. She has been recently promoted to lead North
Lanahan Central & West Florida Region (Jacksonville to Naples). Her extensive
career in the banking industry spans 34 years. She spent 19 years at
Regions Bank, most recently serving as the Area President over the
West Coast of Florida. Prior to that, she was the Area President over
Tampa Bay Market President for North Florida and the City President for Jacksonville.
IBERIABANK Before joining Regions, Lanahan’s banking career began with The
Atlantic Bank/First Union Bank after graduating from The University
of South Carolina with a Finance Degree. She has a diverse
background within the financial services sector spanning
Commercial/Corporate Banking, Small Business, Retail, Treasury,
and Wealth Management.
As an active member of the Tampa community, Ms. Lanahan is
currently on the board of The Moffitt Cancer Center’s Medical
Practice Group and The Tampa Museum of Art. Ms. Lanahan is also a
trustee of the Jessie Ball duPont Fund since 2013. While residing in
Jacksonville, Lanahan served on many boards including JEA (Chair),
United Way of North Florida, The Cultural Council of Jacksonville
(Chair), and The Super Bowl Host Committee where she was
responsible for 10,000 volunteers. She also served the citizens of
the State of Florida as a Commissioner on The Florida Transportation
Commission (Chair).
She has been recognized with numerous awards including One Jax
Humanitarian of the Year, City of Jacksonville Spirit of Rosie Award
TERM and an Eve Award Winner for employment. She has also been
04/16/2020 – 02/28/2023 inducted into the First Coast Business Hall of Fame.
70You can also read