Tariffs and politics: evidence from Trump's trade wars 7553 2019 - ifo.de
←
→
Page content transcription
If your browser does not render page correctly, please read the page content below
7553
                               2019
                                 March 2019

Tariffs and politics: evidence
from Trump’s trade wars
Thiemo Fetzer, Carlo Schwarz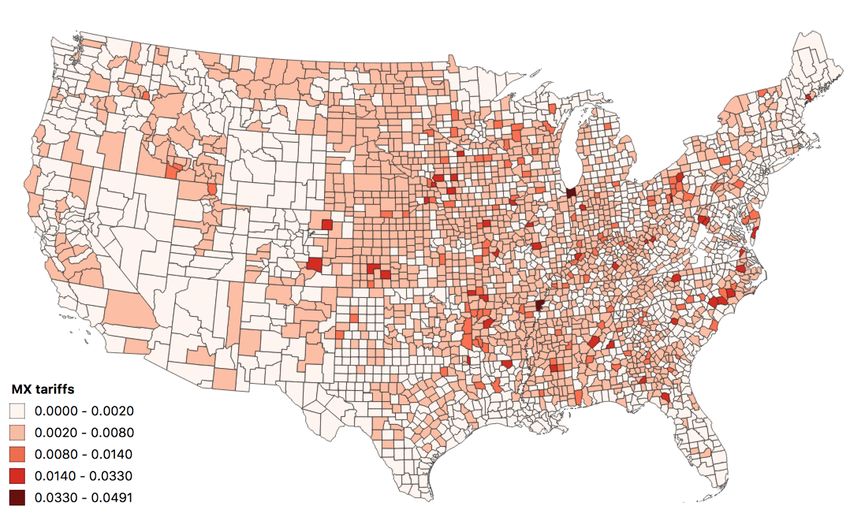
Impressum:

CESifo Working Papers
ISSN 2364-1428 (electronic version)
Publisher and distributor: Munich Society for the Promotion of Economic Research - CESifo
GmbH
The international platform of Ludwigs-Maximilians University’s Center for Economic Studies
and the ifo Institute
Poschingerstr. 5, 81679 Munich, Germany
Telephone +49 (0)89 2180-2740, Telefax +49 (0)89 2180-17845, email office@cesifo.de
Editor: Clemens Fuest
www.cesifo-group.org/wp

An electronic version of the paper may be downloaded
· from the SSRN website:       www.SSRN.com
· from the RePEc website:      www.RePEc.org
· from the CESifo website:     www.CESifo-group.org/wp
CESifo Working Paper No. 7553
                                                                         Category 8: Trade Policy

                        Tariffs and politics:
                 evidence from Trump’s trade wars

                                            Abstract
Are retaliatiory tariffs politically targeted and, if so, are they effective? Do countries designing a
retaliation response face a trade-off between maximizing political targeting and mitigating
domestic economic harm? We use the recent trade escalation between the US, China, the
European Union (EU) and the North American Free Trade Agreement (NAFTA) countries to
answer these questions. We find substantial evidence that retaliation was directly targeted to
areas that swung to Donald Trump in 2016 (but not to other Republican candidates running for
office in the same year). We further assess whether retaliation was optimally chosen using a
novel simulation approach constructing counterfactual retaliation responses. For China and
particularly, for Mexico and Canada, the chosen retaliation appears suboptimal: there exist
alternative retaliation bundles that would have produced a higher degree of political targeting,
while posing a lower risk to damage the own economy. We further present evidence that
retaliation produces economic shocks: US exports on goods subject to retaliation declined by up
to USD 15.28 billion in 2018 and export prices have dropped significantly. Lastly, we find some
evidence suggesting that retaliation is effective: in areas exposed to retaliation Republican
candidates fared worse in the 2018 Midterm elections, and similarly Presidential approval
ratings, especially among Democrats, have declined.
JEL-Codes: F130, F140, F160, F550, D720.
Keywords: trade war, tariff, targeting, political economy, elections, populism.

                Thiemo Fetzer                                      Carlo Schwarz
       University of Warwick & CAGE                       University of Warwick & CAGE
          Department of Economics                            Department of Economics
     United Kingdom – Coventry CV4 7AL                  United Kingdom – Coventry CV4 7AL
           thiemo.fetzer@gmail.com                          c.r.schwarz@warwick.ac.uk

March 8, 2019
We would like to thank an anonymous source in the EU Commission for comments as well as
Italo Colantone, Mirko Draca, Massimo Morelli, Dennis Novy and Debraj Ray for helpful
comments.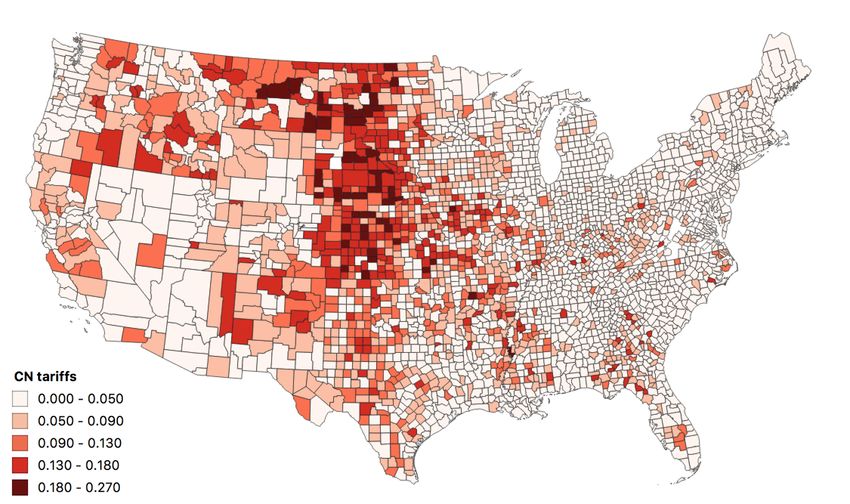
1     Introduction
    Economist have long studied the political economy underlying trade disputes.
Given the large literature on the welfare enhancing effects of trade (e.g. Ricardo,
1891; Hecksher and Ohlin, 1933; Frankel and Romer, 1999; Baldwin, 2004, too name
just a few), it is widely accepted that tariffs, while able to help certain individual
industries, are not only harmful for trading partners but also constitute an act
of self-harm (Bown, 2004; Breuss, 2004). To offer an explanation why politicians
nonetheless often favour tariffs, the work by Grossman and Helpman (1994, 1995)
highlighted the influence of domestic politics and special interest groups on trade
policy. In the same spirit, Maggi and Rodriguez-Clare (1998) argue that trade
agreements could work as a commitment device for politicians against domestic
interests. Later work by Gould and Woodbridge (1998) and Ossa (2014) model
trade disputes as competition between nations.
    Trade disputes are very common place – in fact, WTO (2018) lists 316 GATT
disputes from 1948 to 1995 – yet, few disputes reach a stage of escalation in which
threatened tariffs are actually imposed or retaliation measures are triggered. As
a result, we know little about how escalating trade disputes are actually fought.
A markable exception is the recent trade-escalation provoked by the US adminis-
tration under President Donald Trump starting in March 2018. It thus provides a
unique and recent case allowing the study of an ongoing trade dispute in a data
rich environment. The 2016 presidential campaign already hinted at potential
changes to US trade policy under a Trump administration.1 Nonetheless, the an-
nouncement on March 1, 2018 that the US would impose a 25% tariff on steel and
a 10% tariff on aluminium imports came as a surprise. Initially exempt, Canada,
Mexico, and the EU became subject to the steel and aluminium tariffs from May
31, 2018. Additionally, the Trump administration set a tariff of 25% on 818 cate-
gories of goods imported from China worth $50 billion on July 6. Following the
announcement of steel and aluminium tariffs, President Donald Trump asserted in
    1 See
       for example “Trump accuses China of ’raping’ US with unfair trade policy”, 2. May 2016,
https://www.bbc.co.uk/news/election-us-2016-36185012, accessed, 05.02.2019.

                                              2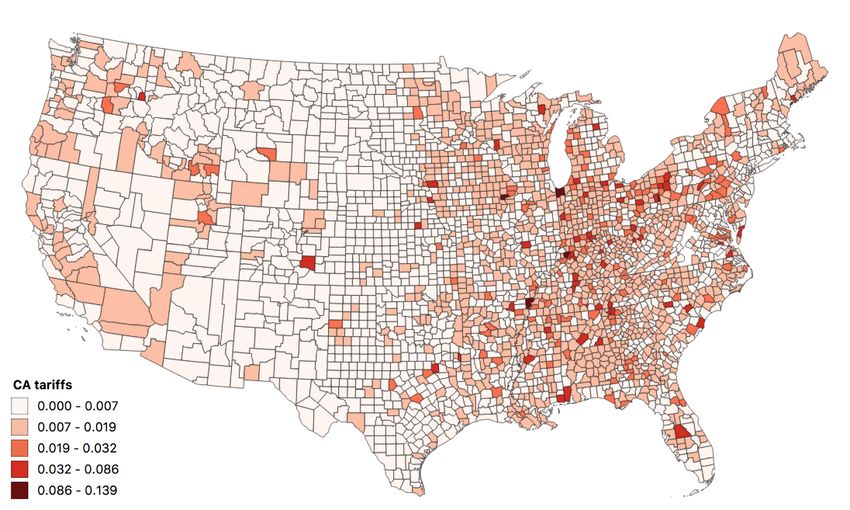
a tweet that “Trade wars are good, and easy to win.” Following negotiations with
the US, some countries gained permanent exemptions from the steel tariffs (such
as South Korea, Argentina, Australia and Brazil). Yet, the dispute involving China,
the European Union (EU), Canada, Mexico, as well as Turkey and India escalated.
As a result these countries reciprocated with tariffs of their own targeting imports
from the US many of which started to take effect from July 2018 onwards.
   This paper tackles three main questions. First, we assess the extent and di-
mensions of (political) targeting of retaliatory measures taken by countries or
trading blocks affected by US measures. Given the limited evidence on actual
trade-escalations, the recent example allows to study the potential trade-offs that
countries or trade blocks may consider when designing a retaliation response. Sec-
ond, we study whether retaliation measures affect patterns of trade and, impor-
tantly, whether they produce real economic shocks. Third, we analyze whether the
retaliation measures have political consequences. Specifically, we study whether
areas and voters more exposed to retaliation measures change their political pref-
erences as expressed through actual votes cast in elections or by studying President
Trump’s approval ratings.
   In the first part of the paper, we document that retaliatory tariffs are indeed
strongly and distinctly targeted towards areas that supported Trump in the 2016
election. To assess the degree of political targeting, we combine highly granular
data on overall US exports with county level data. This essentially allows us to
construct county-specific shocks similar to Autor et al. (2013). Using this measure,
we show that retaliatory tariffs, through the choice of products, distinctly targeted
areas that swung to Donald Trump in the 2016 presidential election (and not areas
that swung behind other Republican candidate in the House or Senate elections).
Our estimates suggest that areas in the top decile of exposure to retaliatory mea-
sures from China exhibited an up to 5 percentage point stronger swing to Trump
relative to the performance of the 2012 Republican candidate. For the retaliatory
measures from the EU, Canada and Mexico the corresponding estimates are 3.6,
2.9 and 2.8 percentage points respectively. It appears that the targeting is sharp

                                         3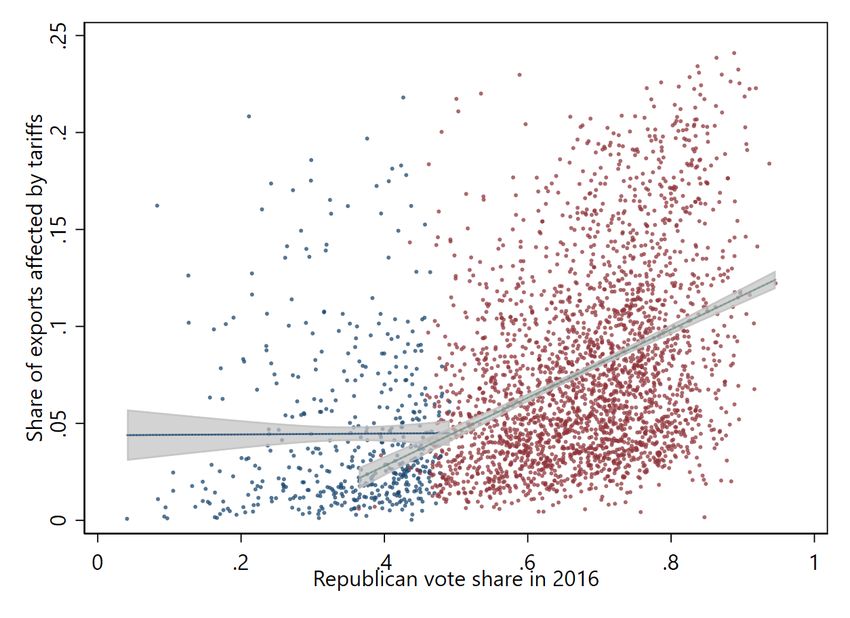
and distinctly designed to hit areas that saw disproportionate changes in support
for Donald Trump as Republican candidate in the Presidential elections 2016, but
not to areas that swung to Republican candidates in the House or Senate elections
that also took place in 2016. This suggests a high degree of calibration of the retali-
ation response, which, in the case of the European Union is designed using a secret
algorithm, which has been described as “the weapon of war” in this dispute.2
   The choice of retaliation bundles is ultimately limited to sets of goods for which
positive trade is recorded. To rule out that the degree of political targeting we
measure is accidental and to assess the overall degree or strength of targeting we
develop a novel simulation approach. For each country, we construct conceiv-
able alternative sets of goods baskets against which retaliation could have been
mounted. For each simulated basket, we construct the implied county level re-
taliation exposure measures and are thus able to evaluate the strength of political
targeting implied by these counterfactual baskets relative to the actual chosen bas-
ket. Hence, this allows us to assess to what extent “better” or “more targeted”
baskets could have been chosen.We observe that the degree of political targeting
of the retaliation measures for Canada and Mexico in particular, and to a lesser
degree for the EU, could have been much stronger. There is little room for im-
provement for Chinese retaliation, which is constrained by the structure of trade
flows between the US and China.
   We further study to what extent retaliating countries face a trade-off between
higher degrees of political targeting and a larger impact on their own domestic
economy. We construct a measure for the share of imports that are sourced from
the US for respective goods and construct this measure for the same set of sim-
ulated bundles. This allows us to visualize the trade-offs involved between the
degree of political targeting and the extent to which retaliation may harm ones’
own economy. We observe that the EU’s retaliation stands out in picking products
for which the US is not a dominant supplier to the European market, thereby likely
minimizing economic harm in the EU. For the other countries, the remarkable ob-
   2 This
        quote is from a conversation that the authors had with an anonymous source in the EU
Commission.

                                             4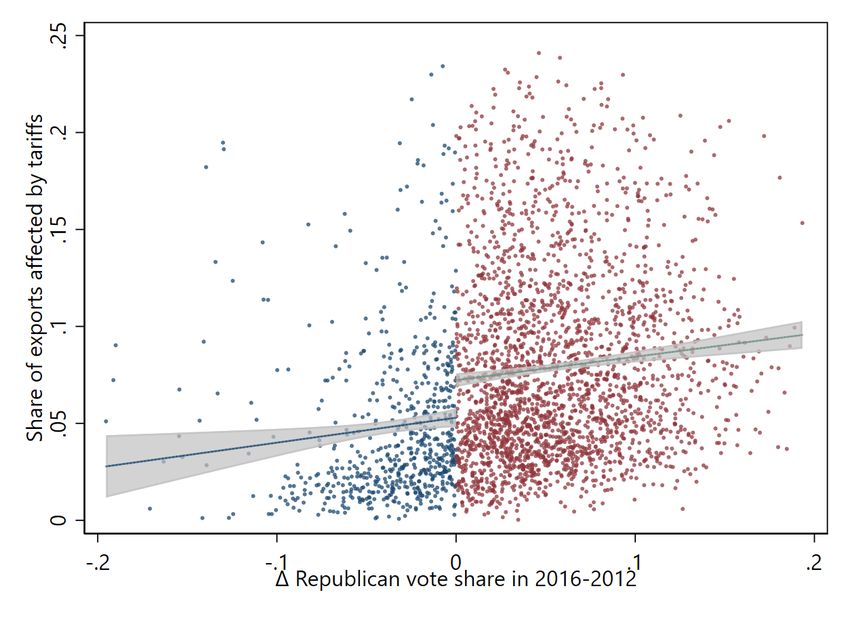
servation is that retaliation seems to put little emphasis on minimizing disruption
to the own economies. While not conclusive, the observations suggest that some
trading blocks and countries seem better at navigating the trade-off between max-
imizing effectiveness and minimizing domestic economic harm.
   Lastly, we also shed some light on whether retaliation is effective. We first doc-
ument that there are tangible economic implications of retaliation on trade flows.
We document that US exports of goods to trade partners that imposed retaliation
sharply decline. Our estimates suggest that between July and December 2018 at
least 15 billion dollars of US exports were affected by the retaliation measures.
We document that this is unlikely to capture just trade rerouting, as overall ex-
ports to the rest of the world do not increase and export price indices for sectors
most affected by retaliation decrease substantially. This indicates that exposure
to retaliation is likely to have produced a non-negligible income shock. Turning
to whether retaliation was politically effective, we study the recent 2018 Midterm
elections. Specifically, we analyze changes in the Republican party vote share for
House and Senate seats between 2016 and 2018. A naive first-difference estimate
suggests that there is no systematic reduction in support for Republican candidates
in areas more exposed to retaliation. Yet, this observation is partly capturing the
fact that retaliation is endogenous to how strongly an area swung in support for
Trump in 2016. Once we control for this endogenous regressor, we observe moder-
ate negative effects suggesting that Republican candidates fared worse by between
1.4 - 2.7 percentage points in counties that are in the top decile of the exposure
distribution implied by the Chinese, Canadian and Mexican retaliation. Studying
high frequency data on Presidential approval ratings, we further find some evi-
dence that in areas exposed to retaliation, the approval ratings for Donald Trump
deteriorate, in particular among self-identifying Democrats.
   Our research speaks to the political effects of trade integration. Building on
the seminal work by Autor et al. (2013), which documents that import competi-
tion due to trade-integration with lower income countries, in particular China, has
accelerated secular decline in certain tradable-goods producing industries. This

                                         5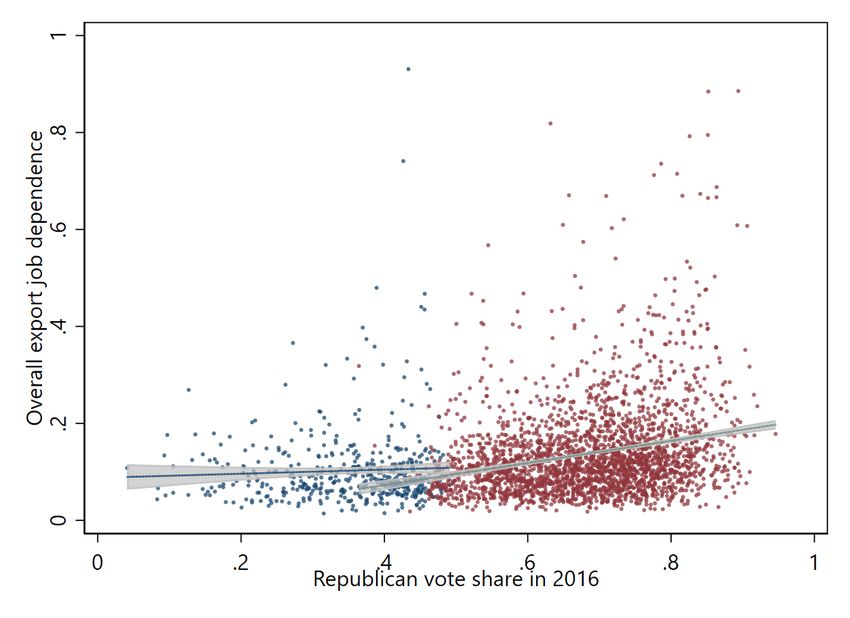
work has motivated a significant literature which investigates the political impli-
cations of these economic shocks. Autor et al. (2016); Che et al. (2017); Colantone
and Stanig (2018); Dippel et al. (2015) each document, in the context of the US,
the UK and Germany, that areas most exposed to import competition are signifi-
cantly more likely to become politically more extreme or polarized in elections. In
fact, both Autor et al. (2016); Che et al. (2017) suggest that the election of Donald
Trump, on a nativist America First platform, was significantly shaped by votes
coming from areas that suffered most strongly from import competition with low
income countries. Similarly, Colantone and Stanig (2018) suggests that areas most
exposed to import competition saw distinctly higher levels of support for “Leave”
in the 2016 EU Referendum.3 Our results indicate that nativist policies themselves,
by triggering retaliation of trading partners, may itself have non-negligible adverse
economic effects and may trigger a political backlash, by virtue of the retaliation
being highly targeted.
    Our findings also contributes to the literature on the political economy of trade
disputes. While models of trade policies have incorporated the role of domestic
special interest groups (e.g. Grossman and Helpman, 1994, 1995), the potential
impact of retaliatory measures have so far been neglected. Our results indicate that
retaliatory measures can harm the electoral outcomes of politicians. Therefore,
policy makers would need to consider the impact of likely retaliatory measures
before making a decision on trade policy.
    In other related research, economists have analyzed the economic and political
targeting of sanctions (e.g. Elliott and Hufbauer, 1999; Eaton and Engers, 1992; Ahn
and Ludema, 2017). While tariffs have been studied explicitly as an economic tool,
sanctions have been understood as a purely politically motivated foreign policy
tool to induce compliance. In this literature, Marinov (2005) and Allen (2008)
   3 The  distributional effect of trade integration may be mitigated by an active welfare state
(Stolper and Samuelson, 1941; Rodrik, 1998; Stiglitz, 2002). In the context of Brexit, Fetzer (2018)
suggest that the welfare state was responsive to mitigate the negative economic shocks due to trade
integration, resulting in a significant rise in benefit recipients. The political backlash only emerged
once the welfare state was significantly curtailed due to a broad austerity program, causing the
backlash that Brexit poses.

                                                  6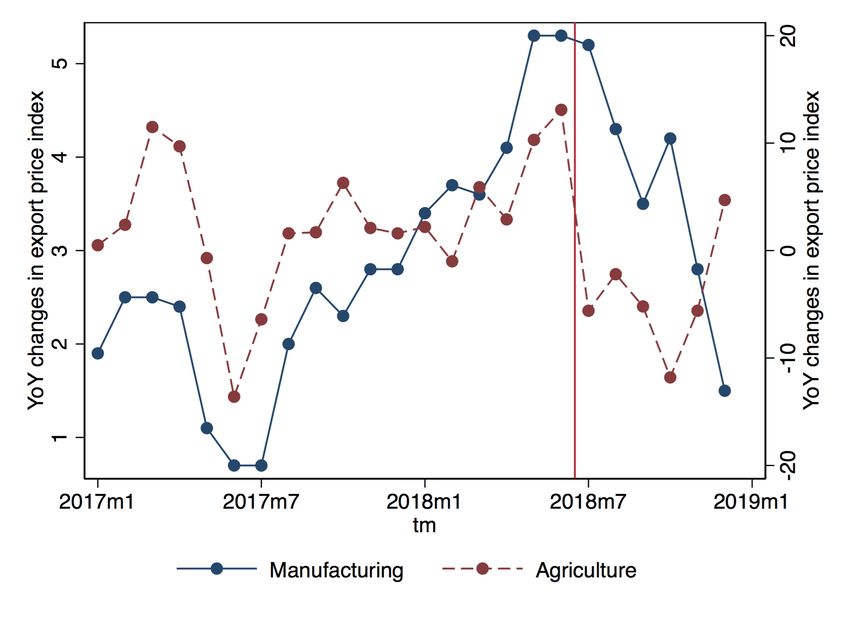
provide evidence that sanctions increase the probability of leadership change. In
other work, Draca et al. (2018) show that US sanction against Iran are effective in
targeting politically connected firms and actors. Compared to sanction, retaliatory
tariffs are a far more limited in scope and intensity. This could explain why the
targeting of tariffs has played a smaller role in economic research. Nonetheless,
our findings suggest that, similar to sanctions, retaliatory tariffs can be used to
affect political outcomes.
    The rest of the papers proceeds as follows. Section 2 describes the political con-
text and the data used in the empirical analysis. Sections 3 presents the results on
the extend of political targeting of tariffs. Afterwards, Section 4 provides evidence
for the effectiveness of the political targeting. Section 5 analyzes different channels
through which tariffs effect electoral outcomes. Section 6 concludes.

2    Context and Data
    The international trading system after the second World War was first institu-
tionalized through the General Agreement on Tariffs and Trade (GATT) in 1948.
It was a direct result of the failings of the international trade system during the
Great Depression. In 1930, the Smoot-Hawley Act increased tariffs on more than
20,000 products imported by the US. This set off a tit-for-tat retaliation dynamic.
Canada – already at this time one of the US closest trading partners – imposed tar-
iffs on 16 goods, which accounted for around 30% of US exports to Canada. Irwin
(1998) estimates that nearly a quarter of the observed 40% decline in imports can
be attributed to the rise in the US tariff and thereby contributed to the lengthening
of the Great Depression.
    Through multiple GATT rounds from 1948 onwards, average tariff rates were
reduced significantly. One of the most important features of the international
trading system which is now regulated by the WTO – the successor organisation to
the GATT established in 1995 – is a formal Dispute Resolution System. In principle,
governments are still able to restrict trade e.g. to foster non-economic social policy
objectives, to ensure “fair competition”, or to support preferential treatment of

                                          7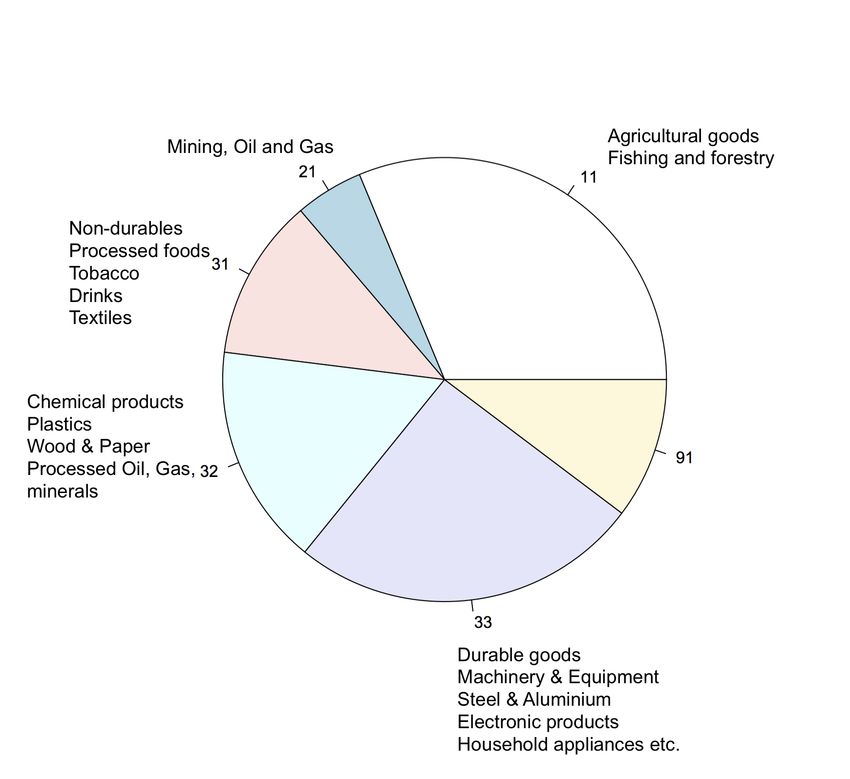
developing countries, regional free trade areas and customs unions. But measures
of this kind are subject to scrutiny, should adhere to the broad principles of the
WTO and can be contested by WTO member countries by invoking the WTO’s
Dispute Resolution mechanism.
   There are several historic examples which seem to indicate that trade policy,
and in particular, tariffs may be a tool to alter the economic policy of countries.
In 1971, President Nixon imposed a 10 percent tariff across the board in the hope
of forcing Japan, Germany and some other countries to revalue their currencies.
The tactic worked within months. In another instance, tariffs on Italian wine and
French cheese in the 1980s helped to persuade the EU to put its Common Agri-
cultural Policy on the negotiating table in the talks that created the World Trade
Organization (WTO).
   The most recent precedent in which the international trading system came close
to a similar large scale escalations were due to steel tariffs, imposed by President
George W Bush, which took effect March 20, 2003. The US justified the tariffs as
an anti-dumping response and in contrast to the current spate, NAFTA partners
were exempted from the tariff rise. The EU and other trading bodies and countries
immediately filed a dispute with the WTO. On November 11, 2003 this resulted
in a verdict against the US and tariffs were abolished on December 4, 2003. The
WTO ruling implied that the anti-dumping justification for the tariffs was void,
as the US had in fact been importing less steel compared to previous years in
2001 and 2002. The ruling authorized more than $2 billion in sanctions against
the US. President George W Bush initially wanted to preserve the tariffs. Though,
following threats of retaliation by the European Union, the US backed down and
withdrew the tariffs.
   While this does not proof that the threat of retaliation was the reason why tariffs
were abandoned, it does suggest that it may have played a role. The European
Commission openly and transparently states the objectives it aims to achieve in
the context of trade disputes. Specifically, EU Regulation 654, published in 2014,
outlines three objectives for commercial policy measures in the context of a trade

                                          8
dispute:
”Commercial policy measures [...] shall be determined on the basis
of the following criteria, in light of available information and of the
Union’s general interest:
(a) effectiveness of the measures in inducing compliance of third coun-
tries with international trade rules;
(b) potential of the measures to provide relief to economic operators
within the Union affected by third country measures;
(c) availability of alternative sources of supply for the goods or services
concerned, in order to avoid or minimise any negative impact on down-
stream industries, contracting authorities or entities, or final consumers
within the Union;
In other words, trade policy should aim to change the trade policy of the oppos-
ing country, while minimizing harm to the own economy. To design the retaliation
response, the European Commission is known to use an algorithm to select prod-
ucts against which retaliation tariffs are targeted. This algorithm is naturally a
safely guarded secret.4
The Chinese government does not publish their policy objectives in the trade
dsipute, but there is evidence that they also try to target their tariffs against the
electoral base of Donald Trump and the Republican party. For example, Chinese
retaliation, similar to the EU’s retaliation basket, targeted goods, such as bourbon
whiskey produced in the home state Kentucky, Mitch McConnell, the Senate ma-
jority leader. Similarly, the Wisconsin congressional district of the then Speaker of
the House Paul D. Ryan was targeted with retaliatory tariffs on cranberries and
cranberry products. Similarly, China (as well as Mexico) targeted pork and soy-
beans, with the latter being one of the most important US agricultural export to
China, which disproportionately affected Iowa, the home state of influential Re-
publican Senate Agriculture Committee member Senator Charles E. Grassley. In
4 One of the authors of this paper had a conversation with an anonymous senior EU commission
source, who referred to the algorithm as the EU’s “weapon of war” in the context of the trade
dispute, indicating why it is a closely guarded secret.
9our analysis, we therefore investigate to what degree the retaliating countries were
indeed able to politically target their retaliation. To do so, we create a measure for
the exposure to retaliatory tariffs for each of US county, which we discuss next.
2.1 Descriptives of the retaliation measures
The retaliation measures against the US tariffs take the form of a list of products
with descriptions and (typically) the Harmonized System (HS) code along with an
(additional) tariff rate to be imposed on imports of these goods stemming from the
US. These lists are prepared through a consultative process in the case of the EU
and Canada. They are lodged and registered with the WTO and, there is typically
a delay prior to the tariffs being implemented.5 For our analysis, we have obtained
retaliation tariff lists from the EU, China, Mexico, Canada, Turkey and India. The
detailed empirical analysis will focus on the EU, China and the NAFTA countries,
due to the overall quite small trade volumes that were affected for Turkey and
India. Appendix A.1 provides more details and the exact links to the lists that we
leverage in this paper.
We visualize the goods that were targeted by different trading blocks in Fig-
ure A1. The figure plots word clouds containing words from the HS-10 titles of
goods that were targeted with retaliatory tariffs. It is apparent that the different
trading blocks targeted different product. For example, while the EU and Canada
heavily targeted the US steel industry the Chinese retaliation focuses mainly on
agricultural products (both frozen and fresh). Additionally, Appendix Figure A2
visualizes the distribution of the retaliation measures across coarse economic sec-
tors.6 The figure suggests similarly, that manufacturing sector outputs, as well as
agricultural commodities were significant features in the retaliation lists. We next
describe how we use the retaliation list to construct a county’s exposure to tariffs.
5 Appendix Figure A3 is a screenshot from the EU’s submission to the WTO.
6 We merge the HS codes in the retaliation lists to NAICS sectors. The match of HS10 codes to
six digit NAICS codes is based on the concordances constructed by Schott (2008).
102.2 Measuring county level exposure to retaliation
There are two key data sources that we use to construct a county level measure
of exposure to a specific list of products Lr subject to retaliation measures. First,
we use data from the Brookings (2017) Export Monitor. This data constructs a
measure of county-level exports across a set of 131 NAICS industries.7 We denote
Xc,i capturing, for each county c a measure of exports in industry i. In addition,
the data also provides an estimate of the total exports at the county level and the
number of export dependent jobs. The latter will be used to weight the regressions.
Secondly, we use the individual retaliation lists Lr for r ∈ { EU, MX, CA, I N, TR}.
These are matched at the 8-digit HS level to the US trade data using export vol-
ume.8 We validate our mapping by studying whether the resulting value of trade
flows affected by tariffs is similar to those quoted in the official WTO submissions.
For this exercise, we make use of HS-level U.S. import and export data from the
U.S. Census Bureau.9 In the case of the EU, the retaliation measures officially tar-
get trade worth USD 7.2 billion. Matching the EU list to the US trade data for
2017, we find that US exports worth USD 7.6 billion are affected by retaliation,
suggesting that the overall magnitude is similar.
Next, we use the concordances between HS codes and NAICS/SIC codes con-
structed and made available by Schott (2008), to link the targeted exports to the
different six digit NAICS sectors that produce the goods (HS10 codes). These
concordances provide up to 10 digit commodity codes, which map into the Har-
monized System codes used, together with SIC and NAICS codes, allowing us to
merge these with the employment data. In case multiple sectors are linked to an
7 The data combines various data sources, including the USA Trade Online (Census) for goods
exports, the Bureau of Economic Analysis (BEA) for services exports, the Internal Revenue Service
(IRS) for royalties data along with Moody’s Analytics production estimates at the county level, and
university level foreign students’ expenditures from NAFSA. More detailed description of this data
is provided in Appendix A.2.
8 While technically the codes of products are provided at the 10 digit level, the matching results
are best at the 8-digit HS level due to slight discrepancies in the coding standard across countries.
For example, the EU uses the Combined Nomenclature (CN), which uses the HS for the first 8
digits, further subdividing the coding to the 10 digit level that is specific to the EU. This introduces
only a small amount of inconsequential noise.
9 These data can be found here https://usatrade.census.gov/.
11HS10 code, we retain the NAICS sector listed first in the concordance, produc-
ing a consistent one to one mapping. As an illustration, consider the example of
the EU’s rebalancing measures, which includes the item “10059000 Maize (exclud-
ing seeds for growing)”. This HS code is mapped to the NAICS industry 111150,
which stands for ”Corn Farming”. This procedure results in a list of tariff exposed
industries.
Afterwards, we collapse the total volume of affected trade to the four digit
industry level. This gives us a measure of total export Ti,r affected by retaliatory
tariffs of country r for each four digit industry i. We can break this measure down
to the county level using Xc,i , the amount of production of industry i in county c
as measured by the Brookings (2017) data. In other words, the total export volume
affected by tariffs is broken down to the county-level using a county’s share of
exports from industry i. This approach is thus similar to the more conventional
Autor et al. (2013) type labor market shocks, with the exception that, rather than
constructing this measure based on sector level employment figures, we are able
to measure this based on sector level output figures, which should come closer to
capturing the economic impact more broadly.
The final exposure measures τc,r for county c and list of retaliatory tariffs r is
given as:
Xc,i
∑c Xc,i
× Ti,r
τc,r = ∑ ∑i Xc,i
i
This measures approximates the impact of the retaliatory counties for each US
county and therefore allows us to study the impact of these tariffs. The measure
is bounded between 0 and 1. If all industries in a county are unaffected by tariffs
the measure will be 0. If the entire production of a targeted good is taking place
in a single county and the county produces only this good, the exposure measure
would be 1.
As a real example of the exposure measure, consider the case of tariffs on
whiskey, which was included in the retaliation measures from China, the EU and
12Mexico. The US exported USD 713.1 million worth of whiskey to the EU, USD
7.2 million to Mexico and USD 2.2 million to China in 2017. Each of these three
countries levied a 25% additional tariff on whiskey, resulting in a tariff cost of
around USD 180.6 million on the sector. Whiskey is produced by the four digit
sector “3121 - Beverage manufacturing”, meaning that areas producing output in
this sector should be most affected. In total, this sector is estimated to export goods
worth USD 7060.96 million.10 Our measure allocates the tariff shock based on a
county’s export volumes in 2017 and then normalizes this by the overall volume
of exports from these counties. The top five counties that would appear as being
affected by this retaliation are Nelson, Wythe and Madison in Virginia, Napa in
California and another Nelson county in Kentucky. Four of these five counties
have a significantly sized distillery sector and are significantly exposed to trade
with, in particular, the EU. Yet, the example also highlights some limitations as
Napa Valley in California is a “false positive” in the sense that it is a wine and
not whisky producing area. It gets picked up, since wine is included in the “3121
- Beverage manufacturing” sector. Nevertheless, the approach seems to broadly
produce accurate exposure measures.
2.3 Main outcome measures
For the second part of the paper we draw from multiple data sources to study
political and economic implications of the retaliation measures more broadly.
2.3.1 Economic Impact Measures
To quantify the economic impact of the trade retaliation measures on trade
flows, we construct a dataset capturing monthly US trade flows, particularly ex-
ports at the 10 digit HS code level mapping the level at which retaliation was
issued.11 Similarly, we collected additional data capturing Export Price Indices
developed by the Bureau of Labor Statistics, which are released on a monthly ba-
sis. This data is available for around 90 different four digit NAICS sectors and
10 The EU targeted two whiskey types: Whisky, in containers holding ≤ 2 l (other than Bourbon
whiskey and Scotch whisky) and Bourbon whiskey, in containers holding ≤ 2 l
11 These data can be found here https://usatrade.census.gov/.
13will help complement the analysis on trade flows. Specifically, since trade flows
may simply be re-routed, it could be that the income implications of the tariff may
be limited. Hence, studying export price indices may help shed light on whether
tariffs actually did produce a negative income shock. Figure 1 presents the year on
year changes in the export price indices of the US for agriculture and manufactur-
ing sector outputs. Note that, these figures do not account for the different size of
the relevant sectors, but the observed deterioration in export prices following July
2018 is evident, indicating that export prices did indeed collapse. We also test this
in a more robust econometric framework later on.
2.3.2 Election and political outcome measures
To investigate if retaliatory tariffs did affect political outcomes, we use Dave
Leip’s election data. This data capture US county-level election outcomes, specifi-
cally for the recent 2008, 2012, 2016 presidential elections as well as for the House
and Senate elections, in particular, the 2018 midterm elections. We also incorpo-
rate data from Gallup through its Daily Tracker dataset, which will serve as an
additional high frequency measure of popular support or approval for President
Donald Trump, who is broadly seen as responsible for the escalation of the trade
dispute.
We next investigate whether the chosen retaliation appears to have been sys-
tematically politically targeted.
3 Was the retaliation politically targeted?
3.1 Descriptive evidence
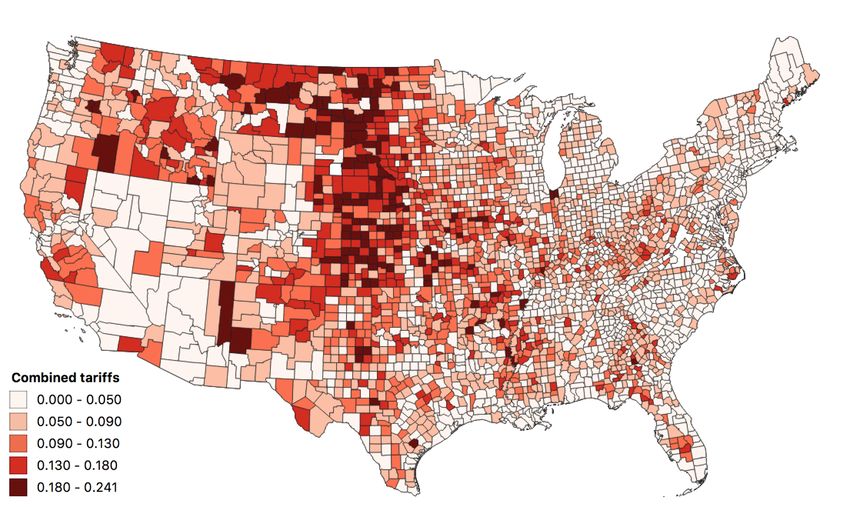
We first show simple descriptive evidence that counties with a stronger support
for the Republican party were more heavily targeted by tariffs. In Figure 2 we
plot the distribution of the exposure measure across US counties combining the
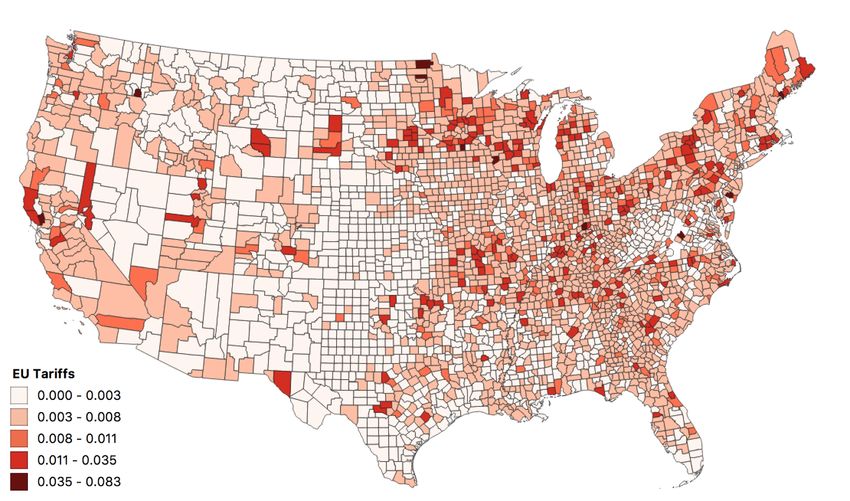
retaliation measures across the different retaliation lists. Figure 3 provides the
visualization across different countries or trading partners. This figure highlights
that there is some variation e.g. when comparing China, the EU, or Canada and
14Mexico. Similarly, in Panel A and Panel B of Figure 4 suggests a clear pattern
whereby counties that are leaning towards the Republican party exhibit larger
τc,r , similarly, counties that saw bigger swings to Trump in 2016 (relative to the
presidential candidate in 2012), have distinctly higher levels of the τc,r measure.
We will next explore this in a more robust regression framework.
3.2 Regression evidence
To understand to what extend retaliatory measures disproportionally targeted
Republican counties within the US, we estimate the following regression equation:
yc,s = αs + β r × τc,r + ec (1)
In this specification, yc,s measures the vote share of the Republican party in county
c in state s in 2016. As an alternative outcome we use changes in the republication
party vote share between the 2012 Presidential election and the 2016 Presidential
election at the county level. τc,r is the county level exposure measure for retaliatory
tariffs list r (for more details see Section 2.2). The regression includes state fixed
effects, hence we exploit within-state variation. Standard errors are clustered at
the county level.
We further assess whether the targeting is specific to areas in which Donald
Trump’s markedly gained votes in the 2016 Presidential election. To do so, we take
advantage of the three different election types in the data (Presidential elections,
House elections, Senate elections) and estimate a heterogenous effect version of
the above specification:
yc,e,s = αs,e + ∑ β r,k × 1( ElectionTypee = k ) × τc,r + ec (2)
k∈ H,S,P
Here, αs,e absorbs state by election type fixed effects. The specification allows
us to distinguish whether areas that swung to Trump between 2016 and 2012 were
differentially targeted, relative to areas, say, that increased support for Republican
House candidates between 2016 and 2012. As it turns out, the observed patterns
15suggest a quite distinct and sharp targeting of the retaliation measures against ar-
eas that markedly swung to support Trump, but did not swing to other Republican
candidates for the House or the Senate in the same year on the same election day.
This is indicative that the retaliation was carefully calibrated.
3.3 Results
The results from estimating model 1 are presented in Table 1. The strong and
stable correlation suggests that counties which are more exposed to retaliatory tar-
iff are more likely to have voted Republican in 2016 election. Further, the targeted
counties are more likely to have significantly swung to the Republican party in
the 2016 relative to earlier elections. In Appendix Table A1 we document that the
association between tariffs is strongest for counties that voted for republican presi-
dential candidates or swung to the republican presidential candidate between 2016
and 2012. This does suggest that political motivation play an important role when
designing a retaliation bundle. Panel A allows for a direct comparison across the
retaliation baskets for different countries, since the continuous retaliation measure
τc,r for each country is bounded between zero and one. This suggests that the de-
gree of political targeting, both regarding the level of the Republican vote share in
the 2016 Presidential election as well the change in the Republican candidate’s vote
share between 2012 and 2016 is strongest for the retaliation measures designed by
the EU and Mexico.
In Panel B, we focus on a discretized measure of τc,r , taking a value of 1 if a
county is in the top decile of the retaliation list specific county level exposure dis-
tribution. Studying the top decile of counties exposed to retaliation suggests that
Chinese retaliation is strongest, with the Republican party presidential candidate
vote share in the top decile of counties affected by Chinese retaliation being nearly
17 percentage points higher compared to counties not exposed to the top decile of
retaliation (column 2 of Panel B). For the EU, Mexican and Canadian retaliation
the measures are comparable.
To highlight that the retaliation was designed to specifically target Donald
Trump’s voter base, we can sharpen the analysis further by studying election types.
16If targeting is specific to Donald Trump (and not broadly the Republican party
strongholds), we would expect that the targeting measure is distinct for areas that
swung to Trump between 2012 and 2016, but not to areas that swung to Republican
candidates for the Senate or the House more broadly between these two years. The
results from this exercise are presented in Table 2. In columns (1) - (5) we study
the continuous exposure measure, while columns (6) - (10) focus on the dummified
measure. Panel A explores how targeting is correlated with different levels of sup-
port for Republican candidates across the House, Senate and Presidential elections
in 2016. Throughout, there is a strong an positive correlation. Panel B focuses on
studying to what extent is differentially targeted to areas that swung to support
the Republican presidential candidate in 2016 (vis-a-vis 2012) and compared to the
changes in support for Republican candidates in the House and Senate between
these two years. The remarkable observation is that, throughout, the targeting is
most strongly and distinctly correlated with areas that swung President Trump in
2016, but not for Republican candidates across other election types, despite the fact
that voters could vote on the same election day in 2016. This strongly suggests that
retaliation was indeed designed to hit areas that were swayed to support Trump
in 2016 and may, conceivably swing back (for the literature studying the dynamics
of US presidential and Midterm elections, see for example, Alesina and Rosenthal,
1995, 2006 or Scheve and Tomz, 1999).
We next propose an alternative way of evaluating the degree of targeting in the
design of the retaliation basket by simulating alternative retaliation baskets that
conceivably could have been chosen.
4 Assessing the degree of targeting relative to simu-
lated alternative retaliation baskets
Is the observed targeting of Republican counties a mere artefact due to the
mix of US export with specific trading partners? We investigate this hypothesis by
constructing alternative retaliation baskets. Ideally, we would want to know the set
of all possible retaliation baskets each country could have chosen. Unfortunately,
17the choice of goods to retaliate against is a complex combinatorical problem, since
goods can be chosen at the finely grained HS10 level. The choice of retaliation
baskets is only constrained in the sense that it should match the value of the
original tariffs by the US. For example, the tariffs imposed by the US on steel
and aluminium affected around USD 7.2 billion of European Union exports to the
United States (see Figure A3). As such, the EU’s measures should target a similar
trade volume. Further, the tariff rate of the retaliation response is typically chosen
to be of similar height than the initial tariff (in the case of the US it was 25%
on steel and 10% on aluminium) or at least in our setting the initial retaliation
response was chosen to be similar to the US rate.
Ideally, we would want to know all potential subsets S of HS10 digit products
codes such that a similar volume of US exports is targeted by retaliatory tariffs. In
Appendix Figure A4, we visualize the number of different HS8 goods which the
US is exporting to these markets. Hence, this is the number of goods from which
the different countries could have chosen their retaliation responses.
4.1 Simulation approach
In computer science this kind of combinatorical problem is known as the sub-
set sum problem. The challenge with subset sum problems is that they are NP-
complete, meaning the most efficient algorithms to find a solution have a running-
N
time of order O(2 2 ), where N is the number of elements in the set. In our case,
the exponential growth of the running time combined with the large number of
potential HS10 codes to choose from makes it computationally infeasible to de-
rive the complete set of retaliatory baskets. Nevertheless, we can probabilistically
simulate a set of alternative baskets, for each country’s retaliation list L using the
following sampling procedure:
1. Randomly draw an integer number Ni providing the number of goods to be
selected to be targeted — we allow for a 20% deviation from actual number
of products that were chosen in the actual list
2. Draw a sample of size Ni different HS10 codes on which there is some exports
18from the US in 2017
3. Compute the volume of trade that would be affected if this sample of goods
was actually chosen for retaliation (allow 10% range around the actual value)
4. Repeat steps 1 − 3 until we found 1000 alternative baskets
As noted, this simulation procedure provides us with alternative bundles of
goods that (conceivably) could have been chosen in the retaliation. While this is
far from the full set, it is an approximation that allows us to study the targeting
properties of the actual bundle relative to these counterfactual baskets. One po-
tential drawback is that the simulation approach explicitly rules out the possibility
that countries retaliating against the US may have coordinated their retaliation
response. From the communication that the authors had with the European Com-
mission, there are limited concerns that this has happened. The source in the EU
only suggested that the Canadian government may have “copied” parts of the EU’s
retaliation response.
4.2 Evaluating degree of political targeting
We next evaluate the degree of targeting relative to a set of counterfactual bas-
kets. Specifically, we estimate regression model 1, except that we now instead use
the county-level exposure measure τc,r obtained from each of the 1000 alternative
simulated goods baskets for each country specific list Lr . The result of this exer-
cise is a vector of estimates β̂r = ( β̂1r , ...., β̂1000
r ) measuring the correlations between
the simulated tariff exposure measure and, either the republican party Presidential
election vote share in 2016 or its change between 2012 and 2016. We evaluate this
against the β̂∗r for the actual list Lr , by plotting the kernel density estimates of the
different vectors β̂r indicating the estimate for the actual retaliation list as a vertical
line β̂∗r . We additionally compute the amount of probability mass to the left of that
estimate. We produce plots for both the Republican party presidential vote share
in 2016 as well as the change in the Republican party vote share between 2016 and
2012. The results from this analysis are presented in Figure 5 for the dummified
19retaliation exposure measure.12
The top panel of Figure 5 suggests that China achieved a very high degree of
political targeting relative to the simulated baskets. However, China is also more
constrained in its choice, as it is importing smaller variety of goods. If we for ex-
ample exclude soy-beans, the bundle would appear much less politically targeted.
The figure also suggests, that the European, Mexican and Canadian baskets, could
have achieved a far higher degree of political targeting as is indicated by the rel-
atively long tail to the right of the vertical line. On the other hand, the European
basket appears to target areas that swung to the Republican party between 2012
and 2016. For this measure of targeting, 87% of simulated alternative basket ex-
hibit a weaker degree of targeting then the actual basket.
4.3 Is there a tradeoff between political targeting and minimizing
domestic economic harm?
As discussed in Section 2, the respective retaliation lists are likely the product
of an optimization process that involves trade-off between various economic and
political objectives. In particular the objectives of the European Union state, that
retaliation should be effective while minimizing damage to the EU’s own economy.
Own country economic harm due to retaliation To measure whether countries
chose retaliation baskets in order to minimize the economic harm, we construct
the share of US imports for a specific set of goods among all imports of this goods
into a trading block. This measure proxies for the potential harm that retaliation
poses for ones own economy. The intuition for this measure is that the cost to the
own economy should be higher if the US is a major supplier, as the US appears
to have a comparative advantage in providing these goods. Therefore, it may be
difficult to find alternative sources of supply. We construct this measure using
data from UN Comtrade, which provides trade data for almost all countries at
the coarser HS6 level. This allows us to construct a HS6 goods specific US import
share (relative to all imports) into a country or trading block.
12 Appendix Figure A9 presents the results for the non-dummified continuous measure, which
are very similar, albeit having a much longer tail.
20As before, we compute this share for all simulated retaliation bundles as well as
the actual bundle. Afterwards, we again plot the kernel densities of these shares
to visualize the distribution of US import share across products and retaliation
baskets in Figure 6. The figure suggests that the EU appears to select the retaliation
baskets that do not include goods in which the US has significant market share in
the European market. The Chinese retaliation, on the other hand, does not seem
to avoid goods for which the US has a significant market share. Also for Mexico
and Canada, the exposure measure indicates that the chosen retaliation basket
includes goods for which the US is a major supplier. This increases the probability
that the retaliation response may have distinct negative economic repercussions on
the Canadian and Mexican economies, that could potentially have been avoided.
We next study whether such a trade-off exists, by studying the joint distribution
of these measures together.13
Tradeoff between political targeting and own country exposure As we have
constructed measures for the impact at home as well as the degree of political
targeting in the US, we can study whether there is any trade-off between these
two objectives. The optimal choice of a retaliation bundles should, conceivably
maximize the effectiveness (as proxied by the degree of political targeting), while,
at the same time limiting damage to the own economy. Though, the extent to
which the two objectives play a role in designing the retaliation also, most likely
depends on the national institutions and again, the extent to which countries can
optimize this in designing their retaliation response, which is constrained by their
respective degrees and depth of trade integration with the US.
We visualize this tradeoff, we plot the joint distribution of our two measures
across the different retaliation bundles in Figure 7 studying the degree of targeting
using level of Republican Presidential election vote shares in 2016, while Figure 8
13 The overall higher level of exposure for Mexico and Canada highlights that these countries are
economically highly integrated, indicating that any retaliation will have significant implications
for both their own markets. As the trade data is only available at the HS6 goods level, part of this
overall higher level of exposure could be an artefact of the coarseness of the HS6 data. Yet, we
would expect this to affect only the overall level of exposure, not the relative standing of the actual
retaliation bundle.
21studies the degree of targeting of changes in the Republican Presidential candidate
vote shares between 2012 and 2016.14 The horizontal axis measures the degree of
political targeting that was plotted out in Figure 5. The average market share of
the US across imports to a country across products, which was plotted in Figure
6, is shown on the vertical axis. The ideal location for a retaliation bundle should
be in the lower right corner. Bundles in this corner both minimize domestic eco-
nomic harm while maximizing the extent of political targeting. Contour lines of an
bivariate kernel density of the joint distribution of these measures across the sim-
ulated retaliation bundles are indicated. This visualizes the set of potential choices
available to countries. The figure further highlights mass points, which indicate
how “difficult” it may be to arrive at an optimal bundle thereby illustrating the
likely trade-offs.
The vertical- and horizontal lines in the figure indicate the measures associated
with the actual bundle chosen. This allows us to assess how “optimal” the chosen
retaliation bundles appear. Chinese retaliation is on the upper side with regard to
the degree of political targeting; yet, China is performing quite poorly in avoiding
damage to its own economy, since it retaliates against goods for which the US
is a dominant supplier. Similarly for Canada and Mexico, the degree of political
targeting is quite strong. In contrast, the EU appears particularly successful in
identifying a retaliation basket that has a fair degree of political targeting, while at
the same time, limiting the harm to its own economy.
One possible interpretation of this observation could be that the EU has a much
more sophisticated approach in designing retaliation compared to the other coun-
tries. On the other hand, China, Mexico and Canada may be operating under less
restrictive domestic political constraints relative to the clear objective and guide-
lines that constrain the EU (as we discussed in Section 2). Given that there appear
to be a simulated baskets yielding the same degree of political targeting with lower
14 The measures plotted here are the distributions when studying the strength of retaliation
focusing on the top decile counties for each of the country specific retaliation bundles. Appendix
Figure A10 and Figure A11 highlight that the figure looks very similar when studying the degree
of targeting focusing on the continuous county level retaliation exposure measure. Yet, for that
measure the distribution is quite skewed.
22implied potential harm for ones own economy, the analysis does suggest that the
countries could have identified alternative retaliation baskets that achieve a simi-
lar degree of political targeting without the potential ramifications for their own
economy.
Since the chosen baskets for each country appear in areas with weak support
relative to the empirical distribution of the simulated counterfactual baskets, this
suggests careful deliberation and calibration of the retaliation response. Yet, it also
suggests that the degree of calibration may not optimize across the multiple poten-
tial trade-offs. A central question is whether retaliation is effective in producing
economic pressures and, relatedly, whether it is effective in producing political
pressures.
5 What are the economic effects of retaliation?
As a first measure of economic impact, we study the effects of retaliation on
trade flows and export price indices. While reduced trade-flows could purely
capture both trade-disruptions as well as trade-diversion, any impact of retaliatory
tariffs on export price indices is likely to indicate tangible economic shocks.
5.1 Empirical specification
Impact on exports We first investigate the impact of retaliation on US trade flows.
We use monthly US export data at the HS8 level to measure US exports to China,
the EU, Canada and Mexico as well as the rest of the world. We then estimate the
following difference-in-difference regression:
yr,h,t = αr,h + νi,t + β r × Post July 2018 × Th,r + eh4 (3)
In this specification y measures US exports and the index r indicates the country
which retaliated against the US. Th,r is indicator variable which is 1 if good h was
chosen to be included in the retaliation basket of country r. The regressions control
for a range of shifters and fixed effects. Most importantly we include HS8 by
trading country specific shifters αc,h capturing country r specific tastes for imports
23from the US of goods h. We also control for destination country r specific time
fixed effects as well as additional time fixed effects, indicated here by νi,t . These
additional time effects can be specific to a destination country r or, could account
for good-specific seasonality. The latter is particularly relevant as US agricultural
exports are highly seasonal.
Impact on export prices Secondly, we estimate the impact of retaliation on ex-
port price indices. This analysis is based on export price indices constructed for
46 NAICS4 sectors by the Bureau of Labor Statistics. We study to what extent sec-
tors more exposed to retaliation measures saw a differential change in their export
prices. To do so, we construct the exposure of a NAICS4 sector n to retaliation
from country r, indicated as En,r as follows. Having merged the HS8 export data
to NAICS codes, we compute the total volume of US exports in 2017 at the 4 digit
NAICS level that would become subject to retaliatory tariffs from July 2018 by
country r and divide this by the overall export volume. The tariff exposure mea-
sure across the 46 four digit industry groups for which it is constructed ranges
from 0 to 34.6%, indicating that at the top 34.6% of exports produced by an indus-
try was affected by tariffs. The average exposure measure is 5%. We then estimate
the following regression:
yn,t = αn j + νi,t + β r × Post July 2018 × En,r + en,t (4)
The dependent variable measures the export price index at the four digit NAICS
sector n. The sector fixed effects, αn j , are at the level of the three digit sector or the
four digit sector. Hence, we explore both within and between NAICS sector varia-
tion. We include time fixed effects throughout. Further, in some more demanding
specifications we allow for time by first digit NAICS sector fixed effects. These first
digit sectors broadly distinguish agriculture, mining and manufacturing. Standard
errors are clustered at the four digit NAICS sector level. The main coefficient of
interest is β r . We would expect that this coefficient to be negative, indicating that
after retaliatory measures came into effect, export price indices decrease for ex-
24ports from sectors with a higher retaliation exposure En,r .
5.2 Results
Impact on exports The regression results are presented in Table 3. The point
estimates in panel A suggest that exports that were exposed to retaliation shrank
by around 75%. Panel B-E explores to what extent this result is robust to the
exclusion of specific trading partner. It becomes obvious that, the Chinese retalia-
tion, accounts for around 50-60% of the estimated contraction of US exports. This
is expected since the Chinese retaliation was by far the most extensive given the
structure of US trade with China. Nonetheless, also goods targeted by the EU,
Canada and Mexico exhibit a significant reduction in exports to these markets.
Overall, the point estimate suggest that each month around USD 2.55 billion
worth of exports have either not taken place or were diverted as a result of the
tariff measures, amounting to around USD 15.28 billion in aggregate since the re-
taliation measures became effective in July 2018 until the end of 2018. Panel A
in Figure 9 provides an event study version of specification 3, estimating separate
coefficient for each pre-and post treatment month. The figure highlights the sharp
contraction in export volumes since July 2018, when most retaliation measures be-
came effective. In Appendix Figure A6, we estimate the event studies focusing on
pairs of countries, studying the US exports to a specific country that retaliated and
to the rest of the world with just these two series. The results highlight a strong
degree of seasonality in exports of goods that were subject to retaliation by China,
which captures the agricultural crop cycle across the US. Notably, the peak in ex-
ports that should occur around the summer failed to materialize as commodity
exports fell significantly due to retaliation. The figure suggests significant con-
tractions in bilateral exports relative to trade with the rest of the world across the
dyads that were affected by the retaliatory measures.
These results do not preclude the possibility that most of this trade was re-
routed and absorbed by other trading partners. Yet using the case of soybeans, a
look at aggregate numbers suggests, that there is a net contraction of exports (see
Appendix Figure A7). In other words, the exports to the rest of the world have not
25absorbed the tariff-induced reduction in demand.
To show that the retaliatory tariffs likely also had a significant effect on in-
comes in areas that produce the affected commodities (and not just capture trade-
rerouting), we next provide some evidence suggesting that US export price indices
also significantly declined.
Impact on export prices Table 4 presents the results from this analysis. Since
the data are aggregated into far coarser industry sectors, the point estimates are
unsurprisingly more noisy. Nevertheless, the results suggest that export prices de-
clined significantly in 4-digit NAICS sectors that were more exposed to retaliatory
tariffs. Panel A studies the overall sector level retaliation exposure measure, while
in Panels B - E, split the retaliation exposure measure by country. The findings
indicate that, at the coarse four digit level, only the retaliation by China, Mexico
and Canada had a significant effect on export price indices. To reiterate, this is not
surprising given the coarseness of the export price indices data. The results also
rely on variation between 4 digit NAICS sectors (in columns 1-3). When wen fully
focus on within sector variation over time (columns 4-6), the estimates are even
more noisy.
To illustrate the timing of the effects, in Panel B of Figure 9 shows that the con-
traction in export price indices occurs at the time of the introduction of retaliatory
measures, with export prices growing strongly in early 2018. This could partly
highlight increased demand due to stockpiling.
Taken together, the evidence from exports as well as exports prices, indicates
that the retaliatory tariffs did indeed, induce some economic harm on the effected
sectors. In that sense the tariffs were effective. As the last piece, of our analysis we
now investigate whether tariffs also had a political impact.
6 Did retaliation affect the 2018 Midterms?
Did retaliatory tariffs influence the 2018 Midterm election? While until today
not all relevant data for the 2018 Midterm election is available, we attempt to
provide a preliminary look at a some election related outcomes. In particular, we
26You can also read