Electoral accountability and state violence: The political legacy of the Marikana massacre - OSF
←
→
Page content transcription
If your browser does not render page correctly, please read the page content below
Electoral accountability and state violence:

                   The political legacy of the Marikana massacre∗

                 Daniel de Kadt†             Ada Johnson-Kanu‡                Melissa L. Sands§

                                                  June 15, 2020

                                                     Abstract

           Democratic states often wield coercive force against ordinary people, yet little is known about the
       electoral consequences thereof. We analyze how incumbent electoral support in South Africa was affected
       by the Marikana massacre, one of the most high-profile examples of state violence in contemporary
       democratic Africa, using panel data constructed from polling station returns. In communities proximate
       to the violence the incumbent party was punished at the polls. We investigate the sources of this change
       using survey data, and find that these effects are almost exclusively driven by voters switching to a
       new opposition party that formed in the wake of the massacre, rather than (de-)mobilization. These
       findings suggest two lessons about the promises and limits of electoral accountability in the context of
       state violence. First, immediate physical or social proximity to state violence may be a necessary, if
       not sufficient, condition for holding incumbents accountable. Second, electoral accountability appears
       to depend on the existence of or formation of credible opposition parties that can serve as a vector for
       disaffected voters.

   ∗
     We thank Courtenay Conrad, Daniel Kaliski, and Evan Lieberman for commentary and guidance. We
thank Ilan Godfrey for sharing his expertise on the Platinum Belt. Participants of the 2020 UC Africanist
Workshop and the 2020 California Regional Working Group on African Political Economy provided valuable
feedback. We thank the Independent Electoral Commission of South Africa for facilitating access to voting
station shapefiles, and for releasing all election data. We thank the Human Sciences Research Council for
expert guidance regarding the South African Social Attitudes Survey, providing access to the geo-referenced
versions of the surveys, and for making the data available. We thank Statistics South Africa for assistance
with census and spatial data. We thank the South African History Archive for access to the South African
Police Service data. Supporting Information (SI) is available here
   †
     Political Science, University of California Merced, ddekadt@ucmerced.edu. All authors contributed
equally to this project. Name ordering is alphabetical by surname at present and may change in the future.
   ‡
     Political Science, University of California Merced, ajohnson-kanu@ucmerced.edu.
   §
     Political Science, University of California Merced, msands2@ucmerced.edu.

                                                          1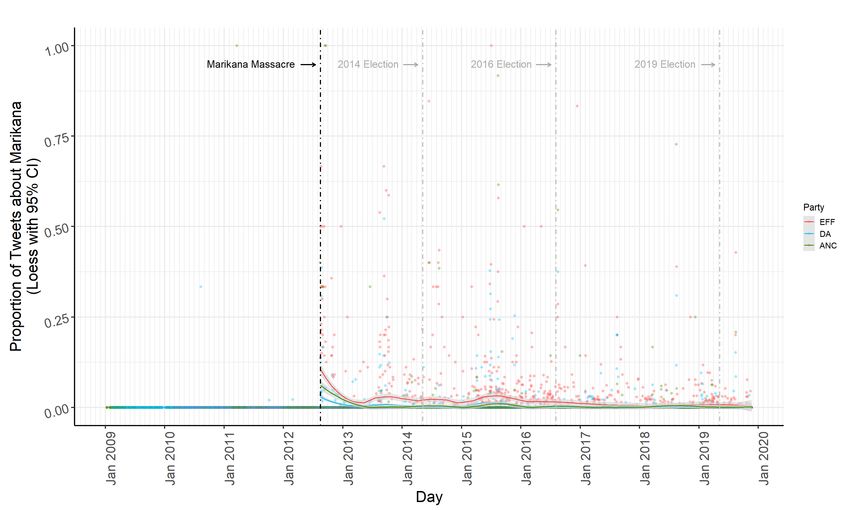
1. Introduction

Theories of democratic accountability propose that voters electorally punish or reward politicians based on

retrospective assessments of their behavior in office (Ferejohn, 1986). Does the logic of electoral accountabil-

ity extend to cases in which democratically elected incumbents wield transgressive violence against ordinary

people? Surprisingly little empirical evidence has been brought to bear on this question, despite the preva-

lence of state violence across many democracies (Davenport and Armstrong, 2004). Understanding voters’

behavior in the wake of state violence has direct implications for learning about the power and limits of

electoral accountability as a force for incentivizing good governance.

   To begin to answer this question empirically we document the political legacy of the Marikana massacre,

one of the most high-profile examples of transgressive state violence in contemporary democratic Africa.

In the late afternoon of the 16th of August 2012, members of South Africa’s police service used automatic

weapons to fire hundreds of live rounds into a group of striking miners, killing 17 in the space of just 12

seconds (Alexander, 2012). Fifteen minutes later, in a secluded area 500 meters away, a further 17 miners

were murdered by police (Marinovich, 2016; Bruce, 2018). Another 78 were left wounded, and hundreds

were arrested. The actions of the police were reminiscent of the brutal violence perpetrated by the apartheid

state: violent repression of black South Africans demanding a better life. The massacre left a profound

psychic mark on domestic politics, described as a “turning point in South African history” (Alexander et al.,

2013), and resulting in an independent televised investigation (Farlam et al., 2015). The events received

extensive media coverage worldwide, and drew condemnation from the leaders of numerous countries, both

on the African continent and beyond.

   We find that the incumbent African National Congress (ANC) was punished dramatically at the polls

in a geographically concentrated fashion, specifically in the communities most intimately connected to the

massacre. Our estimates suggest that, in those particular communities, the incumbent party lost on average

9 percentage points more in the direct aftermath of the massacre, relative to its performance in the rest

of the country. In some communities the party experienced as much as a 60 percentage point decline in

support. We also find, however, that while these effects were concentrated in the mining communities in

and around Marikana, they were not strictly limited thereto: incumbent losses are generally increasing in

proximity to the site of the massacre. Importantly many voters still remained loyal to the incumbent, even

in those communities most intimately connected to the massacre.

   To explain the individual-level voter dynamics that aggregate up to these broad electoral effects we

                                                       2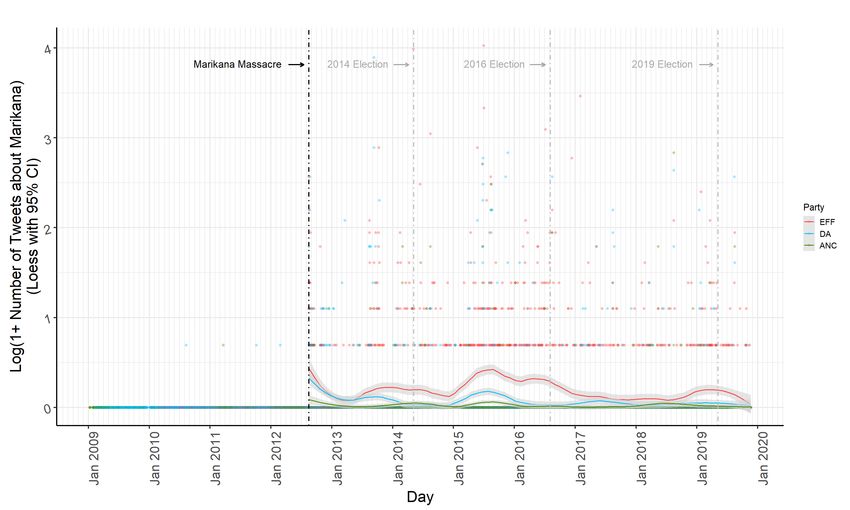
analyze almost a decade’s worth of geo-referenced survey data. We find no evidence that the incumbent’s

losses were driven by electoral demobilization among their supporters, or by mobilization among past non-

voters. Instead, losses were driven almost entirely by incumbent supporters switching allegiance to a new

political party that formed in the wake of the massacre. Using narrative evidence and a dataset of over

300,000 tweets by South African politicians and parties, we document how this new party, the Economic

Freedom Fighters (EFF), emerged directly as a result of the massacre, and successfully created ownership

of the massacre as a political issue. The founders – political entrepreneurs who had recently been ejected

from the incumbent party – accurately perceived the existence of a geographically localized political vacuum

created by the massacre. We find that this new opposition party captured the lion’s share of the incumbent’s

lost votes in the immediate aftermath of the massacre, and successfully expanded its political presence over

time.

   Together these findings suggest two important lessons about the promises and limits of electoral account-

ability in the context of state violence. First, many people with immediate physical or social proximity to

state violence appear likely to hold incumbents accountable for violent transgressions. This appears to be

an important constraint; accountability is mostly confined to those who experience violence, not those who

learn about violence in other ways. Second, electoral accountability appears to depend on the existence or

formation of credible opposition parties. Unsurprisingly perhaps, electoral and political context plays an

important role in shaping the limits of electoral accountability.

                       2. The Promise and Limits of Electoral Accountability

Electoral accountability is a core component of modern theories of democracy (Barro, 1973; Ferejohn, 1986;

Besley, 2006). Intuitively, electoral accountability rests on the assumption that citizens vote to punish or

reward politician at least in part on the basis of their performance in office (Svolik, 2013). There is a large

and growing body of evidence that suggests voters do indeed engage in retrospective voting (Key et al., 1966;

Fiorina, 1981), in which they evaluate the incumbent’s performance on a range of issues and apply rewards

or punishments as appropriate (Berry and Howell, 2007; Hellwig and Samuels, 2008; Woon, 2012; Weghorst

and Lindberg, 2013; Carlson, 2015; Harding, 2015; Healy et al., 2017; de Benedictis-Kessner and Warshaw,

2019).1

   It is easy to see why transgressive state violence might influence voters’ retrospective evaluations of

politicians. State violence likely signals to voters either a capricious government that uses excessive and
   1
       See Healy and Malhotra (2013) for a comprehensive review of this literature prior to 2013.

                                                       3
unwarranted force, or a government that has lost control of its armed forces (Bhasin and Gandhi, 2013).
Voters who directly experience state violence, or perceive a chance that their lives may be affected by such
violence, should have incentive to use their electoral influence to seek reforms from the incumbent, or displace
the incumbent entirely. This should result in decreased vote share for the incumbent, a credible electoral
signal that voters are paying attention and will electorally punish the incumbent if similar behaviors occur
again. Whether those incumbent losses result in a change in government of course depends on political
context and competitiveness. If state violence does influence voter behavior, two clear micro-channels may
be active: switching and (de)mobilization (Bechtel and Hainmueller, 2011; Stokes, 2016). Switching refers
to those who are already voters changing their choice at the ballot box – switching from the incumbent to
an opposition party (or vice versa). (De-)mobilization refers to two distinct behaviors. For those who are
already voters, demobilization refers to exiting the formal political process and withhold their vote entirely.
For those who are presently non-voters, mobilization refers to entering the formal electoral process by voting.
Yet there is also evidence that voters engage in both more biased and more sophisticated appraisals of
politicians’ past behavior (Huber et al., 2012; Healy and Lenz, 2014; Bursztyn, 2016; Adida et al., 2017;
de Kadt and Lieberman, 2017; de Benedictis-Kessner, 2018; Boas et al., 2019; Weaver, 2020). Given this,
it is not a priori certain that all voters would choose to punish the incumbent at the polls in the wake of
state violence. Myriad forces and factors shape voters’ views of politicians’ behavior, and exert influence on
individual electoral decisions. Under certain circumstances many previously incumbent-supporting voters
may remain loyal, and many non-voters may simply not turn up to vote. This might be particularly likely
if voters feel a strong partisan attachment due to socio-cultural or historical factors, if they are otherwise
happy with the incumbents’ performance, if they are particularly dependent on the incumbents’ largesse,
or if no coherent or viable opposition platform exists (Bartels, 2000; Bratton et al., 2012). If voters do not
switch or (de-)mobilize in the wake of violent transgressions by the state, then incumbents may perceive no
electoral risk to such behavior.
Violence may also serve the same function that it serves in electoral authoritarian and non-democratic
settings: to frighten off opposition or those who might consider supporting the opposition, or simply to
indicate state strength and discourage anti-regime activists (Fein, 1995; Gartner and Regan, 1996; Regan
and Henderson, 2002; Shadmehr and Bernhardt, 2011). In such cases voters who might consider a switch
to an opposition party may be prone to simply exit the electoral political process entirely. While this may
also result in voters rebelling against the incumbent through extra-legal means such as riot or rebellion, it
suggests only a minimal role for electoral accountability. While turnout and the composition of the electorate
4is certainly important, it may be that both incumbent and opposition supports choose to exit the electoral
process.
3. Study Context
There are now numerous excellent histories of the events that preceded and occurred on August 16 2012.
We encourage readers to engage those texts closely. They provide detailed analyses of the socio-economic
and political context leading up to the massacre (Twala, 2012; Chinguno, 2013) and careful examinations
of the event itself (Alexander et al., 2013; Marinovich, 2016; Bruce, 2018), while also giving voice to the
experiences and traumas of the miners and their families far better than we can in this paper (Alexander,
2012; Benya, 2015). We provide here only a brief broad-strokes outline of the importance of mining in South
Africa, the events leading up to and occurring on August 16th 2012, and the political backdrop thereto.
Mining has played a central role in the South Africa’s modern history. The country’s mining industry was
born in the mid-to-late 19th century with the discovery of gold and diamonds on the Witwatersrand, an area
that would become home to the cities of Johannesburg and Pretoria and their surrounds, one of the largest
metropolitan areas in the world. Throughout its history South Africa’s mining industry has leaned heavily
on black African migrant laborers who were poorly paid, worked in extremely dangerous and unforgiving
conditions, and lived in labor camps and communes that eventually became the physical basis for many of
the country’s largest residential townships, such as Soweto, areas typically reserved for non-whites during the
apartheid regime. Much of South Africa’s tremendous private wealth, as well as its extraordinary economic
inequality, is a direct result of this history.
The central organizing political force for South African labor is the Congress of South African Trade
Unions (COSATU), South Africa’s largest trade union federation that represents roughly 1.8 million laborers
across multiple industries and sectors, including the mining industry. Since the 1950s COSATU has been
closely aligned with the African National Congress (ANC). Together the ANC and COSATU represent two
members of what is colloquially called the “tripartite alliance,” a political alliance formed in concert with
the South African Communist Party. in which COSATU guarantees votes in exchange for pro-union policies
(Ferree, 2011).
Unsurprisingly, given the mining industry’s centrality in the South African economy, mineworkers have
historically represented an important political entity. Major labor strikes led by mineworkers in 1913 and
1946, both of which ended in bloodshed at the hands of the government, were crucial events that shaped
black African and white politics in the first half of the 20th century. Mineworkers have typically been
5an important constituent group of COSATU, and played important roles in the anti-apartheid movement
(Crush, 1989; Gurney, 2000).
Since the end of legal apartheid in 1991 and the onset of multi-party democracy in 1994, mineworkers
have remained an important political group in the country’s democratic arrangement. In the post-apartheid
period, mineworkers have typically been represented by the National Union of Mineworkers (NUM) and its
much smaller competitor, the Association of Mineworkers and Construction Union (AMCU). The NUM is
an affiliate of COSATU.2 This arrangement has been the site of much political upheaval both within the
unions and between political elites from different groups, often relating to divergent views on economic policy
and issues of labor protection (Nattrass, 1994; Buhlungu, 2005; Buhlungu and Bezuidenhout, 2008). Unions
have historically organized mine workers to strike for increased pay and better working conditions, and such
events are common in South Africa.
Central to South Africa’s mining industry is platinum. The country’s platinum industry is the largest
in the world, with multiple multi-national corporations operating multiple shafts in an area known as the
Bushveld Igneous Complex (BIC). The BIC is the largest known layered igneous intrusion on Earth, con-
taining the world’s largest known reserve of platinum-group materials which are mined intensively. This
geologically defined region thus defines the physical area of South Africa that can be plausibly mined for
platinum. The Marikana Platinum Mine is located centrally in a part of the BIC known as its “Western
Limb,” operated by British multi-national corporation Lonmin plc. In early August 2012, rock drillers
working there began a wildcat strike, unauthorized by the leadership of their union NUM, and seemingly
encouraged by the AMCU seeking to expand its membership base in the platinum sector. Such strikes, both
authorized and unauthorized, are extremely common in South Africa. The Marikana strikers’ specific goal
was a tripling of monthly salaries (from roughly R4,000 to R12,500 per month, or $270 to $850 per month).
On the 11th of August, two of the strikers were killed, allegedly by members of the local NUM leadership.
Between the 12th of August and the 15th, a further eight people died, four miners, two police officers, and
two private security guards employed by Lonmin.
On August 16th, the South African Police Service (SAPS) implemented a containment strategy that
the eventual government report would determine was both poorly planned and poorly implemented. In
attempting to coral protesting strikers who were moving as a group while singing songs and dancing, the
police began firing teargas, stun grenades, and rubber bullets. A single shot was fired from a handgun by a
2
We have repeatedly requested data from NUM and AMCU about their membership numbers and the
distribution thereof, but have had no success.
6striker. A panic began immediately thereafter, and 17 miners died under a barrage of automatic rifle fire –
at a minimum 328 bullets were fired in the space of 12 seconds (Farlam et al., 2015).
Some fifteen minutes later, nearby, the killing continued, seemingly in cold blood. Out of sight of the
media cameras that had captured the initial massacre, police from at least four different units murdered
a further 17 miners. Forensic reports show that many were shot in the back, that many were shot while
trapped between rocks with nowhere to run, and that the police planted weapons on some of the bodies
(Marinovich, 2016; Bruce, 2018). In roughly 30 minutes, 34 people were killed and 78 wounded, making the
Marikana massacre the single most deadly use of force by South African police since the Sharpeville massacre
of 1960, in which apartheid police killed 69 black African protesters in cold blood, and the most deadly use
of force since the beginning of South African democracy.
At time of writing, multiple SAPS officials face charges related to the massacre. But the intimate
connection between the ANC as a party, Cyril Ramaphosa (then deputy president of the ANC and the
country), Lonmin, and the actions of the SAPS (which is a national police service), have remained a point of
focus in the years following the massacre (Alexander et al., 2013). As such, many South Africans continue
to perceive the massacre not only as a failure by SAPS, but as evidence of the ANC’s departure from its
core mission to liberate and improve the lives of the black South African poor.
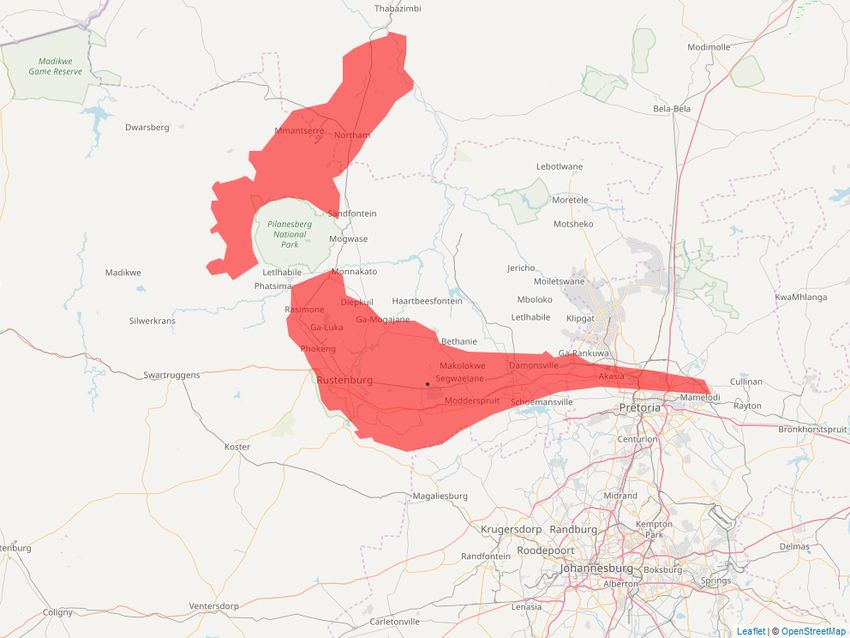
The top panel of Figure 1 shows the Western Limb of the BIC, bisected by a national game park.
We use the Western Limb to spatially define the communities most intimately connected to the massacre,
and the surrounding area. This area describes, albeit imperfectly, the communities connected to the the
platinum mines located in this area, the workers and their families and friends who live in largely informal
settlements in the vicinity of the mines (Venter et al., 2012; Manson, 2013; Bezuidenhout and Buhlungu,
2015; Moodie, 2015; Godfrey, 2018). The Western Limb of the BIC includes the Marikana-Lonmin mine
and the communities most intimately connected to the Massacre in 2012, such as the towns of Wonderkop
and Marikana itself. For context, the bottom panel of Figure 1 shows the Western Limb overlayed onto the
entirety of South Africa.
4. Research Design
Given this context, we implement a difference-in-differences design as described in Table 1. The core quantity
of interest is τ̂DID = [T reatedt −T reatedt+1 ]−[Controlt −Controlt+1 ]. Here τDID represents how incumbent
vote share in the affected Western Limb communities changed after the massacre, net of changes in the rest
of the country. As such, it captures the effect of the massacre on incumbent electoral performance in the
7Figure 1: The Western Limb and the Koppie, the Site of the Marikana Massacre
Note: The upper panel shows the site of the Marikana Massacre (the black dot) and the extent of the Western
Limb communities (red polygons) in the local geographic context. The lower panel shows the same but in
broader context. The Western Limb polygons were hand drawn by the authors in GIS, following (Godfrey,
2018) and (Kinnaird, 2005). The massacre occurred at two different scenes; the black dot shows the Koppie
(“small hill”) from which the strike was organized, which lies 250m between them.
8directly affected communities of interest. As highlighted above, this relies on the assumption that, had
the massacre not have occurred where and when it did, trends in electoral, party-political, and attitudinal
outcomes in communities close to the massacre would have continued to trend in parallel to those outcomes
in communities further from the massacre.
Table 1: Difference-in-Differences Design
Time
Pre-2012 (t) Post-2012 (t+1)
Western Limb
Yes T reatedt T reatedt+1
No Controlt Controlt+1
Note: This difference-in-differences design leverages variation over two dimensions: Whether communities
are part of the Western Limb (treatment), and whether those communities are observed in the pre- or
post-massacre period (time).
This design is similar in nature to that used by two major recent studies of the electoral effects of violence,
Getmansky and Zeitzoff (2014) in their study of the electoral effects of rockets fired from Gaza into Israel, and
Enos et al. (2019) in their study of the effects of the Los Angeles Riots on electoral support for local public
goods provision. In Sections 4.1 and 5 we provide contextual and empirical evidence that this assumption is
highly plausible, and in the SI we present further evidence in support.
Importantly we are not able to diagnose whether there were countrywide effects on electoral support for
the ANC. Indeed, the ANC lost 3.75 percentage points between 2009 and 2014, and some of that may, or
may not, be attributable to the massacre; we are not able to quantify that effect. Instead we are able to
study how changes in the ANC’s vote share between 2009 and 2014 differ by proximity to, or membership
of, the community intimately connected to violence, net of those broader changes in the country.
4.1. Validity of the Design
Three features of the timing and location of the Marikana massacre suggest that the assumptions under-
pinning our design are highly plausible. First, the massacre was not pre-meditated in any long-term sense.3
The Farlam report outlines the series of immediate decisions taken by police and government officials, as
well as union leaders, that, combined with chance, led to the fateful events. Given the details described
3
The massacre may have been pre-meditated in the very short run, right around the 16th of August 2012,
but it was not planned far ahead of time by the police or the ANC government.
9in the report, there is no ex ante reason that a similar event did not occur in 2007 when 240,000 miners
participated in a planned strike, in 2016 when a similar wave of strikes occurred on South African mines, or
in any number of other labour disputes, service delivery protests, or strikes that occur regularly throughout
the country.
Second, Marikana need not have been the location of the massacre. There are numerous other mining
communities throughout the country at which similar strike events occur with regularity. In the supporting
information we use South African Police Service data to show that, while there have been tens of thousands
of “crowd events” at which public order police were deployed throughout the country, there was not a
particularly pronounced uptick in the number of such events in the region – nor anywhere in South Africa
for that matter – in the run up to the massacre. One estimate suggests there were as many as 8,700 service
delivery protests in South Africa between 2005 and 2017 at which public order police were deployed, all
occurring at varying scales and levels of intensity (Alexander et al., 2018), and this number does not even
include labour related protests and strikes like the wildcat strikes that preceded the massacre.
Third, the massacre occurred between two National and Provincial Elections (NPEs) – 2009 and 2014 –
in which the ANC’s presidential candidate remained the same in Jacob Zuma, meaning that the principal
forces within the ANC, and the ethno-linguistic identity (isiZulu) of their presidential candidate, remained
constant. The massacre was also bounded by two Local Government Elections (LGEs) – 2011 and 2016 – in
which Zuma again remained a constant, as leader of the ANC. Together, these contextual features suggest
that plausible inferences about the effect of the massacre on the incumbent ANC’s election performance in
the communities most directly affected may be estimated using a difference-in-differences research design.
4.2. Data
Our primary dataset is a panel of election returns for all of South Africa’s elections from 1999 through
2019, combined with census data for 2011. The data are all retrofit to the 4,392 electoral wards that were
demarcated in 2016. The data includes National Election (NE) data from 1999, 2004, 2009, 2014, and
2019, and Local Government Election (LGE) data from 2000, 2006, 2011, and 2016.4 Once the panel was
compiled, the data were then manipulated in GIS to measure their intersection with the Western Limb of
the BIC shown in Figure 1. In our main empirical specifications, we treat communities that intersect with
4
To create a panel at the 2016 ward level, we spatially joined the respective polling stations (of which
there are 13,500-22,000, depending on election year) from the 1999 - 2014 elections with the 2016 wards.
The data from the 2016 and 2019 elections does not need to be retrofit, as the data already corresponds to
the 2016 wards. This is similar to the approach used in de Kadt and Lieberman (2017); de Kadt and Sands
(2019) and de Kadt (2019), though using a different unit of aggregation.
10the Western Limb as “treated” cases, those which were intimately connected to the state violence of August
16th 2012. While this remains our preferred way of approaching the issue, it is true that defining treatment
in this way is problematic in that it may incorrectly include or exclude communities, and we address it in
Section 5.1.
5. Incumbent Electoral Performance in the Wake of State Violence
We begin by visualizing the change in ANC vote share between 2009 and 2014, in two ways. The upper panel
of Figure 2 shows the distribution of ward-level changes in incumbent support over the entire space of South
Africa, with the Western Limb of the platinum belt overlayed in red. The spatial pattern is reasonably clear
from casual inspection: The ANC’s electoral losses were largely in the northern parts of the country, with a
heavy concentration of major losses in the Western Limb communities.
The lower panel of Figure 2 emphasizes this pattern through a scatter plot of proximity to the Koppie
(logged) against ward-level change in ANC vote share. Countrywide, the closer a ward is to the Koppie (as
the crow flies), the heavier the electoral losses. The overlayed loess curve suggests that, once distance is
logged, this association is effectively linear, though it strengthens in the immediate vicinity of the Western
Limb communities, shown in red. It also appears that a disproportionately large share of the ANC’s heaviest
losses (between 25% and 50%) occurred in the affected communities.
The electoral effect of the massacre in the Western Limb communities visualized in Figure 2 can be
numerically calculated simply by taking the average for each of the quantities in Table 1. This gives an
estimated τ̂DID = [67.5 − 66.3] − [69.1 − 56.2], an 11.7 percentage point decline in the ANC’s vote share
in communities that are part of the Western Limb. While this preliminary inspection provides prima facie
evidence that the incumbent ANC was punished at the polls in communities most affected by the Marikana
massacre, we next implement a statistical analysis of the difference-in-differences which allows us to account
for potential concerns relating to the comparability of our control and treated units and the plausibility of
parallel trends. Our core statistical specification takes the following form:
∆Yw = α + τDID W esternLimbw + δXw + γGw + m
For ward w, we regress the first difference of Y our outcome variable between the time pre- and post-
Marikana periods (2009 and 2014 for the National and Provincial Elections (NPE), 2011 and 2016 for the
Local Government Elections (LGE)), on an indicator of whether the ward intersects with the W esternLimb.
11Figure 2: Visualizing the Electoral Effect of the Massacre
Note: Each ward in the country is represented by a point on both the upper panel (map) and the lower panel
(graph). In the upper panel, each point is located at the ward’s centroid. The outline of Western Limb is
shown in red in the upper panel, and those same ‘treated’ wards are highlighted in red in the lower panel.
12X are optional time-invariant census covariates measured in 2011 (unemployment rate, formal, informal,
and traditional housing stock, racial population shares, and language group population shares). G are
optional spatial covariates (longitude + latitude + longitude×latitude). Note that the estimation strategy
is a deliberately simple statistical approach – we begin with minimal modeling assumptions for ease of
interpretibility and understanding, but in section 5.2 we present a range of alternative, and typically more
complex, analyses. Standard errors m are clustered by municipality, the geographic unit above the ward,
which helps to account for spatial auto-correlation in the treatment assignment. The results are virtually
unchanged in terms of statistical significance when using robust unit-level standard errors, or the Conley
(1999) adjustment for spatial and temporal auto-correlation (Hsiang, 2010; Fetzer, 2014).
Table 2: Difference-in-Differences Analysis of Electoral Effect of the Massacre
PANEL A: National Elections
Main Effect Pre-Trend Test
DV = ∆ ANC Vote Share 09-14 DV = ∆ ANC Vote Share 04-09
(1) (2) (3) (4) (5) (6)
Western Belt Community -0.117∗∗∗ -0.084∗∗∗ -0.090∗∗∗ -0.035∗∗ 0.002 -0.000
(Municipality clustered SEs) (0.023) (0.024) (0.023) (0.011) (0.011) (0.011)
(Conley HAC SEs) (0.013) (0.014) (0.012) (0.021) (0.009) (0.005)
Spatial Controls X X X X
Covariates X X
Observations 4377 4377 4377 4318 4318 4318
R2 0.054 0.227 0.363 0.002 0.349 0.656
PANEL B: Local Government Elections
Main Effect Pre-Trend Test
DV = ∆ ANC Vote Share 11-16 DV = ∆ ANC Vote Share 06-11
Western Belt Community -0.144∗∗∗ -0.094∗∗ -0.088∗∗∗ -0.021 -0.011 -0.019
(Municipality clustered SEs) (0.030) (0.029) (0.026) (0.016) (0.017) (0.015)
(Conley HAC SEs) (0.017) (0.015) (0.014) (0.012) (0.007) (0.005)
Spatial Controls X X X X
Covariates X X
Observations 4386 4386 4386 4363 4363 4363
R2 0.040 0.169 0.341 0.001 0.094 0.289
Note: Standard errors estimated two ways in parentheses.
+
p < 0.10, ∗ p < 0.05, ∗∗ p < 0.01, ∗∗∗ p < 0.001, corresponding to municipality clustered errors.
The results from these specifications are presented in Table 2, in columns (1) through (3) of Panel
A, for the National and Provincial Elections (NPE), and Panel B, for the Local Government Elections
(LGE). Column (1) is a regression estimate equivalent to the simple difference-in-differences calculated above.
13Column (2) adds spatial controls, and column (3), which represents our preferred and most conservative
specification, adds both covariates and spatial controls. Columns (4) through (6) replicate these specifications
but for a placebo outcome, the change in ANC vote share from 2004 to 2009 for the NPE and 2006 to 2011
for LGE, the electoral cycles prior to the massacre. From the coefficients reported in column (3) of Table 2,
we find that the Marikana massacre led to an approximately 9 percentage point decrease in support for the
incumbent ANC in proximate communities of interest, contrasted with the rest of South Africa. This result
is consistent across election types, and statistically significant at p < 0.001 with both municipality clustered
standard errors and Conley HAC standard errors. Comparing this to the pre-trends in columns (4) through
(6), in which the estimate is essentially zero for the NPEs, and close to zero for the LGEs, lends credibility
to the difference-in-differences identification strategy.
5.1. Spillover
As alluded to before, there is no perfect way to identify those who were most intimately connected to the
massacre from those who were not. While the Western Limb coding presented in Section 5 is our preferred
approach, it raises a number of concerns. Due to potential spillovers in treatment the results could be too
large, or too small. For example, it is likely that friends and relatives of mineworkers who were on strike live
in Johannesburg, just outside of the Western Limb. It seems implausible to assume these people were not
intimately connected to these events. As a consequence we may have misspecified the treatment and control
groups, and in doing so violated the parallel trends assumption. To assuage these concerns, we replicate our
analysis using a variety of alternative specifications outlined below. Detailed results are presented in the
SI, but in general all of the following analyses produce results that are extremely consistent with our core
specification, in terms of sign, magnitude, and statistical significance.
Spatial Donut. To account for the possibility that some units in the control group are actually partially
treated, we re-estimate the same specifications, but with a spatial ‘donut’ approach in which those areas that
fall within 100km of the Koppie, but do fall not within the Western Limb are excluded from the analysis.
This essentially drops from the analysis areas that are most likely to be subject to a spatial spillover, such
as Johannesburg in the hypothetical case mentioned above. The results, presented in the SI, show a slightly
larger estimated effect in both election types – a 10 percentage point decline in ANC vote share in the
affected communities, relative to the rest of the country (p < 0.001). We repeat this process with a 200km
donut, and the results are almost unchanged.
14Proximity as Treatment. That the spatial donut approach increases the point estimate is prima facie
evidence of some spatial spillover. To be more flexible in terms of treatment assignment and to parametrically
model this spillover, we implement an analysis with a continuous treatment variable: proximity (negative
log kilometers) to the Koppie. In our preferred specification, which controls for both covariates and latitude
and longitude and their interaction, we find β̂ = −.0533 (p < 0.001). This suggests that the decline in ANC
vote share when moving from pre-massacre to post-massacre is increasing with proximity to the Koppie; the
reported coefficients imply that a 10% increase in proximity to the Koppie (e.g. moving from 500km away
to 450km away from the Koppie) would lead to a 0.22 percentage point (-.0533 × log(1.1) × 100) larger
decline in ANC support, while a 100% increase in proximity (e.g. moving from 500km away to 0km away)
would result in a 1.6 percentage point (-.0533 × log(2) × 100) larger decline in ANC support. This provides
further evidence that the change in ANC support is being driven in part by the Marikana massacre.
5.2. Alternative Specifications
While spatial spillovers are a primary threat to our research design, we also implement other approaches to
demonstrate that the results are not simply an artifact of our empirical choices.
Alternative Control Groups. It is possible that the entirety of South Africa outside of the Western
Limb is a poor control group. This choice of control group may violate the parallel trends assumption,
notwithstanding our pre-trends tests, which can only ever be suggestive. We probe this possibility in three
ways. First, we implement the generalized synthetic control method (Xu, 2017) using all elections, both NPEs
and LGEs from 1999 through 2019, combined into a single panel. This approach estimates counterfactual
outcomes for each treated unit separately, and yields an estimate of the Average Treatment Effect on the
Treated (ATT), conditional on well-matching pre-trends, robust to both time-invariant and time-varying
cross-unit confounders. Using this approach we find an 8.9 percentage point effect for the national election
and a 10.4 percentage point effect for the local election using this approach (p < 0.001), full results available
in the SI. Second, we re-estimate the main specifications, but limit the analysis to only those areas within
150km, and 300km respectively, of the Koppie. We view this as an extremely conservative approach in that
it only uses as controls wards that are still reasonably close to the site of the massacre, and so the control
group may in fact be partially treated, as shown in Section 5.1. Indeed, we still find statistically significant
negative effects, though the point estimates are roughly half the magnitude of our core specification. Third,
we estimate an approach more akin to a “geographic regression discontinuity design,” using a cubic expansion
15of latitude and longitude (Dell, 2010; Dell and Olken, 2017), while focusing on the 300km space around the
site of the massacre. As before, the point estimate is roughly half that of the core specification, but remain
statistically distinguishable from zero at conventional levels for the NPEs, though not for the LGEs.
Combining Election Types. South Africa’s 5-year election cycles imply reasonably long gaps between
observations, which may raise concerns that trends in the treated and control units were diverging prior to
the massacre but after the previous election, but that this cannot be seen given the time scale. We replicate
the analysis by combining both the local and national election data to allow for a treatment effect test on
incumbent vote share changes between 2011 (LGE) and 2014 (NPE) vote share changes, while reserving the
incumbent vote share change from 2009 (NPE) to 2011 (LGE) for the pre-trends test. The results from
this test, available in the SI, are extremely similar to the core results above, with the preferred specification
yielding a result of 9.5 percentage point decline in ANC vote share statistically significant at conventional
levels, and a not-statistically-significant 0.4 percentage point deviation in the pre-trend.
6. Mechanisms: Vote Switching, but Not Demobilization
Following the Marikana massacre the incumbent ANC suffered geographically concentrated electoral losses
in both local and national elections. The results are robust, in substance and statistical significance, to
a range of specifications and definitions of treatment. But what individual-level dynamics account for the
aggregate electoral effects we observe? Disentangling individual-level mechanisms like (de)mobilization and
vote-switching in aggregate data is extremely difficult due to ecological inference problems. We thus analyze
data from the South African Social Attitudes Survey (SASAS) 2007-2016, collected by the Human Sciences
Research Council (HSRC), South Africa’s statutory research agency for the social sciences and humanities
(HSRC, 2016). SASAS, a member of the International Social Survey Programme (ISSP), is an annual
nationally representative cross-section of South Africans’ views on political, social, and economic topics.
Crucially, SASAS asks individuals for both their retrospective and prospective vote choices with regard
to National and Provincial Elections.5 The retrospective choice question asks respondents which party they
5
Results in the SI show that, across both prospective and retrospective ANC vote, support for the ANC
is lower the closer to the Koppie one lives in the post-massacre period compared to the pre-massacre period,
consistent with the aggregate results estimated using official electoral returns. In the SI we also assess the
validity of the individual-level design using placebo codings of the P ost variable, assigning the variable to
= 1 in 2010 and 2011, respectively, and re-estimating our regressions while excluding data from the post-
massacre period. These analyses reveal coefficients for prospective ANC vote that are 5-15 times smaller
than our effect estimates, and coefficients for retrospective ANC vote that are all essentially 0. None of
the placebo difference-in-difference coefficients are statistically distinguishable from zero at any conventional
16voted for in the most recent National and Provincial Election. As such, the data from 2007-2016 includes
retrospective voting measures for the 2004 and 2009 (pre-massacre) elections and the 2014 (post-massacre)
election. By contrast, the prospective choice question asks respondents which party they would vote for “if
an election were held tomorrow.” These retrospective and prospective SASAS questions allow us to create
four dynamic dependent variables that capture an individual’s self-reported change in behavior over time:
1. Exit the Electorate: Any voter who retrospectively recalls casting a ballot in the last election, but
prospectively says they will not vote in a coming election.
2. Exit from ANC: Any voter who retrospectively recalls casting a ballot for the ANC in the last election
but prospectively says they will not vote in a coming election.
3. Switch from ANC: Any voter who retrospectively recalls casting a ballot for the ANC in the last
election but prospectively says they will vote for a different party.
4. Switch to ANC: Any voter who retrospectively recalls casting a ballot for anyone other than the ANC
in the last election but prospectively says they will vote for the ANC.
By limiting our analyses to only those surveyed before 2014 (when the first post-massacre election took
place), these variables are able capture changes in self-reported behavior from the pre-massacre period to
the post-massacre period. One additional complication is that the spatial distribution of survey respondents
changes over time due to sampling, and as a consequence we are not able to use the Western Limb as our
treatment assignment variable for the individual-level data. Instead we use the proximity specifications that
served as an alternative specification for the aggregate data:
Yi,t = αt + β1 P roximityea + β2 P ostt + τ P roximityea × P ostt + δXi + γGea + ea
For individual i in survey year t ∈ {2007, . . . , 2016}, we regress our outcome variable Y on the P roximity
of their enumeration area ea to the Koppie, an indicator for whether the person was surveyed before August
16 2012 and thus in the P ost = 0 period, or after, in the P ost = 1 period, and the interaction of these two
variables. X are optional individual-level covariates (age, age squared, sex, a 15-item wealth index, and race
group). W are optional spatial covariates (longitude + latitude + longitude×latitude). We include αt time
fixed effects, and m are standard errors clustered by enumeration area, the sampling unit of the survey. The
levels. By way of an additional placebo test, we show that there is no effect on individuals’ satisfaction with
the economy, which helps rule out that the electoral effects we find are themselves a function of the massacre
causing localized economic effects. We are grateful to Leo Arriola for proposing this idea.
17Table 3: Diff-in-Diff Analysis of Behavioral Dynamics as a Function of Proximity to Marikana
PANEL A: Demobilization
DV = Exit the Electorate DV = Exit from ANC
(1) (2) (3) (4) (5) (6)
Proximity to Marikana (- log km) 0.007∗∗ 0.009∗ 0.009∗ 0.008∗∗∗ 0.011∗∗ 0.012∗∗∗
(0.002) (0.004) (0.004) (0.002) (0.003) (0.004)
Post Massacre 0.029 0.028 0.052 0.061 0.061 0.063
(0.049) (0.050) (0.049) (0.061) (0.061) (0.061)
Proximity × Post 0.004 0.004 0.006 0.005 0.005 0.005
(0.004) (0.004) (0.004) (0.005) (0.005) (0.005)
Pre-2014 Sample X X X X X X
Spatial Controls X X X X
Covariates X X
Observations 17108 17108 17083 12128 12128 12118
R2 0.004 0.004 0.010 0.003 0.004 0.006
PANEL B: Party Switching
DV = Switch from ANC DV = Switch to ANC
(1) (2) (3) (4) (5) (6)
Proximity to Marikana (- log km) -0.006 0.010+ 0.012∗ 0.018∗∗∗ -0.025∗∗ -0.013
(0.004) (0.006) (0.006) (0.004) (0.009) (0.008)
Post Massacre 0.361∗∗ 0.358∗∗ 0.374∗∗ -0.077 -0.064 -0.040
(0.125) (0.121) (0.120) (0.081) (0.080) (0.074)
Proximity × Post 0.027∗∗ 0.026∗∗ 0.028∗∗ -0.006 -0.005 -0.003
(0.010) (0.009) (0.009) (0.006) (0.006) (0.006)
Pre-2014 Sample X X X X X X
Spatial Controls X X X X
Covariates X X
Observations 12128 12128 12118 7395 7395 7374
R2 0.002 0.009 0.015 0.006 0.020 0.070
Standard errors clustered by EA in parentheses
+
p < 0.10, ∗ p < 0.05, ∗∗ p < 0.01, ∗∗∗ p < 0.001
18coefficient on the interaction term τ identifies the difference-in-differences: how the relationship between the
proximity to the Koppie and Y varies between the pre- and post-periods.
The results in Table 3 suggest that vote switching, rather than electoral exit (or entry), is the primary
individual-level mechanism driving the aggregate electoral losses suffered by the ANC. As shown in columns
1 through 6 of Panel A, we find no evidence of exit: voters, regardless of prior affiliation, did not choose
to stay home on election day as a result of the massacre. This result is echoed in the aggregate data – in
the SI we show no effects on turnout in the 2014 NPE, and, if anything, slight increases in turnout in the
2016 LGE as a result of the massacre. Rather, voters closer to the Koppie were more likely to switch their
votes away from the ANC post massacre, as shown in columns 1 through 3 of Panel B of Table 3. Columns
4 through 6 show no evidence that voters switched from an opposition party to the ANC. To understand
the magnitude of the findings, recall that this quantity identifies how much stronger the association between
proximity to Marikana and the outcome variable is in the post-massacre period, relative to the pre-massacre
period. Consider the coefficient in column 3 of Panel B of Table 3, which implies that, moving to the post-
massacre period relative to the pre-massacre period, a 10% increase in proximity to Marikana (e.g. moving
from 500km away to 450km away from Marikana) would lead to a 0.12 percentage point (0.028 × log(1.1)
× 100) greater increase in the probability of switching from the ANC to another party. A 100% increase in
proximity (e.g. moving from 500km away to 0km away) would result in a 0.84 percentage point (0.028 ×
log(2) × 100) increase in the probability of switching from the ANC.
Table 4 presents a reanalysis of the polling station data that takes as the dependent variable the change
in vote share for two major opposition parties. Panel A focuses on the far left Economic Freedom Fighters
(EFF), a party that formed in 2013 directly as a consequence of the massacre, while Panel B focuses on the
the center-right Democratic Alliance (DA) the largest opposition party in the country. The results suggests
that voters moved en masse to the EFF, by roughly 7 percentage points in the 2014 NPE, and by roughly 8
percentage points in the 2016 LGEs. We find no shift in vote share to the DA; if anything, the DA appears to
have lost a small amount of support in the 2016 LGEs, perhaps as a result of the emergence of an alternative
opposition option.6
6
The SASAS data is unfortunately not ideal for testing the EFF-emergence hypothesis at the individual
level, but the results from what analyses we can conduct are nonetheless broadly consistent with this account.
An explanation of the limits of the data in this regard, and the results from our analyses, are available in
the SI.
19Table 4: Opposition Party Formation
PANEL A: Performance of the Economic Freedom Fighters (EFF)
DV = ∆ EFF Vote Share 09-14 DV = ∆ EFF Vote Share 11-16
(1) (2) (3) (4) (5) (6)
Western Belt Community 0.107∗∗∗ 0.067∗∗ 0.067∗∗∗ 0.128∗∗∗ 0.077∗∗ 0.085∗∗
(0.021) (0.020) (0.018) (0.031) (0.029) (0.028)
Spatial Controls X X X X
Covariates X X
Observations 4388 4388 4388 4392 4392 4392
R2 0.105 0.422 0.679 0.070 0.348 0.615
PANEL B: Performance of the Democratic Alliance (DA)
DV = ∆ DA Vote Share 09-14 DV = ∆ DA Vote Share 11-16
(1) (2) (3) (4) (5) (6)
Western Belt Community -0.002 -0.006 -0.000 -0.026∗∗ -0.016+ -0.010
(0.005) (0.007) (0.005) (0.009) (0.009) (0.010)
Spatial Controls X X X X
Covariates X X
Observations 4377 4377 4377 4386 4386 4386
R2 0.000 0.118 0.360 0.005 0.041 0.099
Standard errors clustered by municipality in parentheses
+
p < 0.10, ∗ p < 0.05, ∗∗ p < 0.01, ∗∗∗ p < 0.001
7. Party Formation in Response to Violence
The primary electoral response to violence documented in this paper – a geographically concentrated backlash
against the incumbent, driven primarily by vote switching to a particular party – is likely contingent on
broader political context. Switching one’s vote requires the existence of a suitable opposition party or, when
such a party does not exist, the presence of political entrepreneurs and an institutional environment that
incentivizes party formation. None of these conditions are trivial; indeed, African democracies have highly
varied party systems, and the existence of a credible opposition cannot be taken for granted (Mozaffar et al.,
2003; Manning, 2005; Brambor et al., 2007; Riedl, 2014).
South Africa’s party system is extremely open with respect to party exit and entry, with national elections
regularly featuring between 20 and 50 parties on the ballot. This is largely attributable to two institutional
features. First, technical barriers to entry are extremely low: registering a new political party is a simple
process that requires only 500 signatures, minimal paperwork, and the payment of a small fee. Second, the
20country’s electoral system – proportional representation – means that there are electoral incentives to party
formation: A party requires just over 30,000 votes (out of an active electorate of roughly 18 million voters)
to gain a seat in parliament, and the geographic spread of those votes is essentially irrelevant.
Parties often form when either (violent or non-violent) conflict or emergent political polarization creates
an issue or identity vacuum (Lipset and Rokkan, 1967; Kitschelt, 1992; LeBas, 2006). In South Africa, the
historical record suggests that the Marikana massacre did exactly this, creating a geographically localized
issue cleavage over which a non-trivial number of voters had intense preferences (Holmes, 2012; Mbete, 2015,
2016). Two young politicians who had recently been frozen out of the ANC apparatus and were seeking
opportunities to re-enter the fray – Julius Malema and Floyd Shivambu – perceived the events in Marikana
as a political opportunity for organization and mobilization against the incumbent (Botiveau, 2014). Despite
by their own admission having no particular presence in the area during the first half of August 2012, when
the strike that preceded the massacre was ongoing, Shivambu and Malema were the first national politicians
to arrive after the massacre occurred (Alexander, 2013; Shivambu, 2014). On August 17th, the day after
the massacre occurred, Shivambu and other future-EFF activists were immediately on the ground, allying
themselves with the striking mineworkers and bereaved families. The next day Malema arrived to convene a
meeting with the still-protesting mineworkers, what would be the beginning of an extended presence in the
area, and a sustained relationship with the (De Wet, 2012; Shivambu, 2014; Nemakonde, 2017). In October
2013, just over a year after the massacre took place, Malema addressed a crowd gathered at Marikana to
announce the formal launch of the EFF as a political party that would directly contest the ANC’s political
grip on South Africa.
While it is always hard to pinpoint the origins of any particular party’s creation, it seems likely that
the emergence of the EFF was a direct consequence of the Marikana massacre. The EFF’s leaders make
this point themselves. In his retrospective on the party’s short history, Shivambu refers to Marikana as a
“turning point”, referring to it as the “culmination of [... our] involvement with the struggles of the people”
(Shivambu, 2014, p.44). Likewise, Malema, in a radio interview, has attested that the striking mineworkers
he met with in Marikana encouraged him to form a new party, saying that their voices would not be heard
if “you’re [Malema] not in this space [politics]“ (Nemakonde, 2017). In that same interview, Malema noted
that “when I was there [Marikana], those guys [the strikers] kept calling me, and they planted the seed [to
form a new party]” (Nemakonde, 2017). Yet self-reflection by elites can often be misleading. To buttress
these narrative accounts, we consider data on how Marikana was used in political communication by South
African political elites – real world political behavior. We demonstrate three things, consistent with the
21narratives presented by Malema and Shivambu and contemporaneous political analysis from social scientists
(Alexander, 2013). First, Marikana was a central thematic issue adopted by the EFF in its communications
to the public, especially around elections. This suggests that the event was indeed a core catalyst, a central
pillar, of party formation. Second, Marikana was almost exclusively captured by the EFF, and not by the
pre-existing opposition party the Democratic Alliance (DA) or the incumbent ANC. This suggests that the
massacre did indeed generate a political vacuum that either was not, or could not, be filled by existing
parties.
7.1. Communication Strategies
It is difficult to comprehensively observe political communication by parties and individual politicians in a
democratic setting like South Africa’s, where much communication occurs in unrecorded and non-transcribed
political gatherings. We thus rely on social media posts on twitter, building a database of over 300,000
tweets from official party accounts and leading politicians’ private accounts. In 2017 about 14 percent of the
South African public used twitter, and the platform has increasingly become a powerful and cheap way for
politicians and parties to communicate with voters (BusinessTech, 2017). The earliest tweets in our data
are from January 2009, and the most recent tweets come from November 2019, when we conducted data
collection. We collected all available tweets from 20 handles, focusing on the two major parties that existed
prior to the massacre, the ANC and the opposition party Democratic Alliance (DA), and the EFF and its
core founding members. Those handles include the three party handles, seven EFF politicians, five ANC
politicians, and five DA politicians.7 Details about the twitter accounts, party affiliations, and our strategy
for selecting handles can be found in the SI.
All told, our data includes 65,749 tweets by ANC affiliated handles, 90,258 by EFF affiliated handles, and
155,597 by DA affiliated handles. Data is scraped using a python package that crawls through the account
time-line and saves all available tweets posted (but not retweeted) by the handle (Baker Fish, Baker Fish).
For every handle selected, we retrieve the text content and the time the tweet was posted, along with other
meta-data. We clean the text data as standard, removing stop words and punctuation, converting to lower
case, and stemming words.
7
EFF handles: EFFSouthAfrica, Julius S Malema, LeighMathys, GardeeGodrich, HhMkhaliphi, Adv-
Dali Mpofu, MbuyiseniNdlozi, FloydShivambu.
ANC handles: MYANC, GwedeMantashe1, JacksonMthembu , CyrilRamaphosa, NathiMthethwaSA, and
MbalulaFikile are ANC related handles.
DA handles: Our DA, helenzille, MmusiMaimane, jsteenhuisen, LindiMazibuko, and AtholT are DA related
accounts.
22You can also read