Politicians' Luck of the Draw: Evidence from the Spanish Christmas Lottery by Manuel Bagues* Berta Esteve-Volart ** Documento de Trabajo 2011-01
←
→
Page content transcription
If your browser does not render page correctly, please read the page content below
Politicians' Luck of the Draw:
                          Evidence from the Spanish Christmas Lottery
                                               by
                                         Manuel Bagues*
                                     Berta Esteve-Volart **
                                Documento de Trabajo 2011-01

                                        Serie Capital Humano y Empleo
                                         CÁTEDRA Fedea – Santander

                               Serie Talento, Esfuerzo y Mobilidad Social
                                   CÁTEDRA Fedea-Banco Sabadell

                                                          January 2011

*
          Universidad Carlos III and FEDEA, Madrid, Spain; email: mfbagues@emp.uc3m.es
**
          York University, Toronto, Canada; email: berta@econ.yorku.ca

Los Documentos de Trabajo se distribuyen gratuitamente a las Universidades e Instituciones de Investigación que lo solicitan. No obstante
están disponibles en texto completo a través de Internet: http://www.fedea.es.
These Working Paper are distributed free of charge to University Department and other Research Centres. They are also available through
Internet: http://www.fedea.es.
ISSN:1696-750X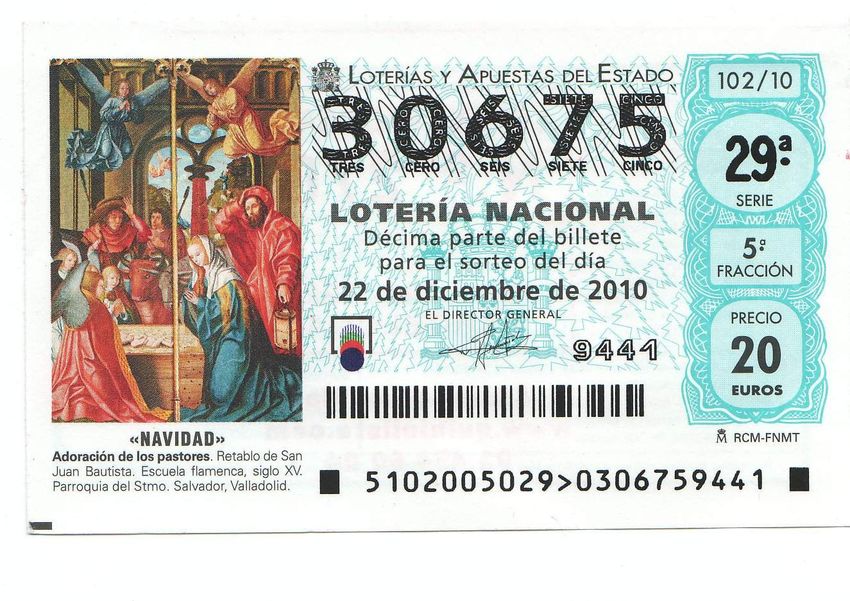
Politicians’ Luck of the Draw:
         Evidence from the Spanish Christmas Lottery∗
                                           †                                    ‡
                     Manuel Bagues                    Berta Esteve-Volart
                                       January 5, 2011

                                               Abstract
         It is well known that incumbent politicians tend to receive more votes when eco-
         nomic conditions are good. In this paper we explore the source of this correlation,
         exploiting the exceptional evidence provided by the Spanish Christmas Lottery.
         This is a unique lottery: 75% of Spaniards play, sharing tickets, and every year
         at Christmas 0.3% of the Spanish GDP is at stake. Because winning tickets are
         mostly sold by one lottery outlet, winners tend to be geographically clustered.
         These features allow us to study the impact of exogenous good economic con-
         ditions on voting behavior. We find that incumbents receive significantly more
         votes in winning provinces. Given that individuals are well aware of the random
         nature of the shock, it is unlikely that this effect is due to voters wrongly at-
         tributing economic conditions to the government. Moreover, information from
         surveys from the same period shows that Christmas Lottery prizes increase the
         propensity to vote for the incumbent, but they do not affect respondents’ assess-
         ment of the government. The evidence is consistent with a temporary increase in
         happiness making voters more lenient toward the incumbent, or with a stronger
         preference for the status quo.

       Keywords: voting behavior, randomized natural experiment, economic voting
       JEL Classification: C21, D72.

   ∗
     We are grateful for the useful comments and suggestions provided by Stéphane Bonhomme, An-
tonio Cabrales, Guillermo Caruana, Abel Fernández, Javier Gardeazábal, Roberto Garvı́a, Andrea
Ichino, Nic Morgan, Ernesto Villanueva, Natalia Zinovyeva and seminar participants at HECER
Helsinki, CEMFI, Universita’ di Bologna and Universidad Carlos III. We are also particularly grateful
to Alberto Lafuente and STL for granting us access to the lottery data. Celia Martı́n provided excel-
lent research assistance. Any remaining errors are our own. We acknowledge the financial support of
the Social Sciences and Humanities Research Council of Canada and the Spanish Ministry of Science
and Technology (research grants ECO2008-06395-C05-05 and ECO2008-01116).
   †
     Universidad Carlos III and FEDEA, Madrid, Spain; email: mfbagues@emp.uc3m.es
   ‡
     York University, Toronto, Canada; email: berta@econ.yorku.ca

                                                  1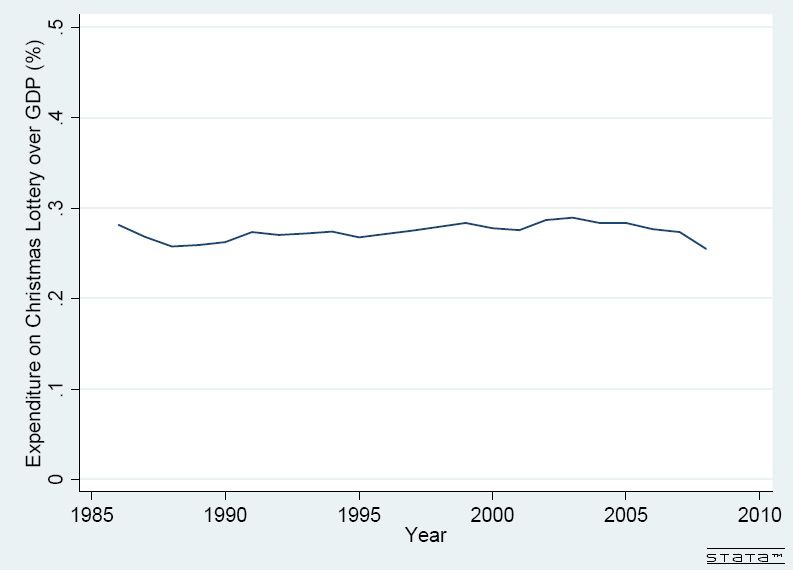
1       Introduction
In the 1980 U.S. presidential election campaign, where incumbent President Jimmy
Carter was running against Ronald Reagan, in one of the debates Reagan asked Amer-
ican voters the following question:

        “Next Tuesday all of you will go to the polls, will stand there in the polling
        place and make a decision. I think when you make that decision, it might
        be well if you would ask yourself, are you better off than you were four
        years ago?”1

   Years later, during his successful 1992 presidential campaign against incumbent
George H. W. Bush, Bill Clinton put it more bluntly:

        “It’s the economy, stupid!”

    These quotes reflect the main idea behind economic voting: when economic condi-
tions are good, voters tend to vote for the incumbent. There is substantial evidence
showing a robust correlation between economic outcomes and the re-election of in-
cumbent politicians in elections.2 According to Lewis-Beck and Stegmaier (2007),
approximately 400 books and articles on economic voting have been published.3
    It is unclear what the positive correlation between good economic outcomes and
re-election reflects. In a context of asymmetric information, voters may interpret eco-
nomic conditions as a signal of incumbent’s ability or effort, and thus apply a simple
retrospective voting rule (Nordhaus 1989). This correlation may be also partly due
to voters’ systematic attribution errors. There is experimental evidence in social psy-
chology finding that subjects aiming to assess competence systematically fail to take
sufficient account of background or environmental factors (Ross and Nisbett 1991).
    It is difficult to disentangle empirically why economic outcomes affect voting behav-
ior. A problem that is common to most empirical studies tackling this issue is how to
identify variations in economic conditions that are independent from incumbents’ ac-
tions. Even in the case of seemingly exogenous events such as natural disasters, where
incumbents may not have direct control over the event itself, the incumbents may be
plausibly held responsible by voters for either preparation or response. In this paper,
we manage to overcome these problems by exploiting the exceptional evidence provided
by a unique randomized natural experiment at the macroeconomic level: the Spanish
Christmas Lottery. This lottery, held every Christmas, offers several convenient fea-
tures. First, the Christmas Lottery is a syndicate lottery: around 75% of Spaniards
participate in the lottery, and they typically share tickets with family, friends, and co-
workers. In other words, the Spanish Christmas Lottery is more of a social event than
a gamblers’ lottery. Second, instead of awarding one big prize to a few individuals, as
is the case in most lottery systems, the top prize, known as the Fatty (“el Gordo”),
    1
     As quoted by Lewis-Beck and Stegmaier (2007).
    2
     A well-known example of a current politician who may have benefited from good economic con-
ditions is Hugo Chávez. Chávez’s popularity in Venezuela has likely been helped by the sharp rise in
the price of oil, the country’s only significant export: when Chávez took office in 1998, the price of oil
was $11 a barrel—the price peaked in July 2008 at $147, a time during which Chávez was enjoying
high popularity (“Socialism with cheap oil”, The Economist, December 30th, 2008; “An axis in need
of oiling”, The Economist, October 23, 2008).
   3
     See the literature review in the next Section for details.

                                                    2
awards many relatively small prizes to several thousand individuals sharing the same
ticket number. Third, its economic impact is very large: Spaniards spend approxi-
mately ¿3 billion on the Christmas Lottery, amounting to about 0.3% of the Spanish
GDP (in 2009, the average Spaniard spent ¿70 on the Christmas Lottery). Because
each number is mostly sold by one lottery outlet, winners tend to be geographically
clustered. In the period we consider, the main winning province receives a mean income
shock equivalent to 3% of its GDP.
Given these features, this paper uses provincial information on Christmas Lottery
top prizes and expenditure from 1986 through 2008 to identify random variations in
annual provincial income. We find a significantly positive effect on national electoral
outcomes. In a province receiving Christmas Lottery awards equivalent to 1% of per
capita GDP, the incumbent party enjoys a significant increase in the share of votes of
approximately 0.21 percentage points.
Because it is public knowledge that the incumbent cannot affect which province
receives the Fatty, our results rule out explanations according to which voters may be
rewarding the incumbent. The data also seem to reject the possibility that voters are
subject to some type of attribution error. Since winners are well aware of the random
nature of lottery, it is unlikely that they are wrongly attributing variation in their
economic conditions to the government. Moreover, information from surveys from the
same period shows that Christmas Lottery prizes increase the propensity to vote for
the incumbent, but they do not affect respondents’ assessment of the government.
Therefore, the positive correlation that we observe between good economic out-
comes and incumbent re-election must be explained by some other factor. There are at
least two possible explanations that are consistent with the observed evidence. First,
it might be due to psychological factors: perhaps when economic outcomes are good,
voters become more lenient toward the incumbent; perhaps because they feel happier.
This would be consistent with the evidence in Healy et al. (2010), who, using in-
formation from a completely different setting (local college football games), find that
the outcome of U.S. local college football games just before an election affects the
incumbent’s re-election. Based on this, they argue that personal well-being might in-
fluence voting decisions on a subconscious level. Second, perhaps when voters become
richer they become more conservative and, in turn, their preference for the status quo
increases.
The rest of the paper is organized as follows. Section 2 offers a literature review. In
Section 3 we describe the background information on Spanish elections and the Spanish
Christmas Lottery. Section 4 describes the data, and Section 5 turns to the empirical
analysis. Section 6 discusses the results and concludes.
2 Literature review
There is vast empirical evidence going back to at least the 1940s documenting the
existence of economic voting: incumbent politicians tend to obtain more votes when
the economic situation is relatively better. The earlier studies focused on the rela-
tionship between U.S. voting behavior and a number of measures that capture the
macroeconomic situation.
Pearson and Myers (1948) found support for the hypothesis that voters tend to
vote for the continuation of administrations that have been in power during prosperous
times, and to vote against the incumbent administration when times are bad. A number
3of studies from the 1940s and 1950s use either price indices or indices of economic
activity, in either longitudinal or cross-sectional studies (e.g., Gosnell and Coleman
(1940) use data from 65 Pennsylvania counties). In general, those simple early studies
tend to find a positive correlation between good outcomes and incumbent re-election,
even though the estimated effect is small and the relationship sometimes fails to be
systematic (Kramer 1971).
Kramer (1971) used data from U.S. congressional elections over 1896-1964 and
found a connection between the re-election of the incumbent party and real personal
income. The results are in line with of those in Fair (1978), who analyzes data from
U.S. presidential elections: he finds a correlation between both the growth rate of real
per capita GNP and the change in the unemployment rate and the U.S. president’s
chances of re-election. Lewis-Beck (1988) provides similar findings using data from
national elections in OECD countries. More recently, Brender and Drazen (2008)
examine a large panel of countries and find a correlation between economic growth and
incumbents’ re-election in less developed countries and new democracies, but not in
developed countries, with the exception of the U.S.
While the existence of economic voting seems to be a stylized fact, its causes are
not yet well understood. One problem is the endogeneity of economic conditions. A
number of studies try to disentangle the effect of competence from the effect of luck on
re-election using a number of identification strategies. Wolfers (2002) finds that, in the
US, voters in oil-producing states tend to re-elect incumbent governors during oil price
rises, and attributes it to voters’ attribution errors. This hypothesis is consistent with
Weber et al. (2001), who, in an economics lab experiment, find that subjects attribute
differences in outcomes to differences in the effectiveness of leaders.4 Leigh (2009)
finds that incumbents in national elections benefit from economic growth in the world
economy. There is also a body of research that exploits evidence from either natural
disasters (Healy and Malhotra 2010) or terrorist attacks (Gardeazabal 2010, Montalvo
2010). A problem common to these papers is that, even in the case of seemingly
exogenous events, where incumbents may not have direct control over the event itself,
the incumbents may be plausibly held responsible by voters for either preparation or
response. Using information from lottery winnings should mitigate this concern.
There is a growing literature that is turning to lottery data in order to examine
the importance of exogenous (unearned) income shocks on a number of decisions. For
instance, Imbens et al. (2001) study the effects on labor supply, earnings, savings and
consumption. Other authors have analyzed the effect of lottery earnings on health and
mortality (Lindahl 2005), on physical and mental health (Apouey and Clark 2009),
on marriage and divorce (Hankins and Hoekstra 2010), and on individual bankruptcy
(Hankins et al. 2010). Kuhn et al. (2010) analyze how lottery prizes affect winners
4
Subjects played an abstract coordination game similar to many organizational problems. Previous
research showed that when larger groups play the game, they rarely coordinate on the Pareto-optimal
(efficient) outcome, but small groups almost always coordinate on the efficient outcome. After two or
three periods of playing the game, one subject who was randomly selected from among the participants
to be the “leader” for the experiment was instructed to make a speech exhorting others to choose the
efficient action. Based on previous studies, the authors predicted that small groups would succeed
in achieving efficiency but that large groups would fail. Based on social psychological studies of the
fundamental attribution error, they also predicted that the subjects would underestimate the strength
of group size and attribute cause to personal traits of the leaders instead. Confirming this hypothesis,
the authors find that leaders were credited for the success of the small groups, and blamed for the
failure of the large groups.
4consumption, as well as their neighbors’. They find that effects on winners are largely
confined to cars and other durable goods, and that there are relatively substantial
effects on the purchases of cars by winners’ neighbors.5 Our paper shares a caveat with
the other lottery studies in that our results may not be typical responses to other forms
of unearned income.
Our paper differs from these studies in several respects. We study an unusual
lottery system of syndicate play, the Spanish Christmas Lottery. In contrast to most
lottery systems, which are gamblers’ lotteries, a vast majority of Spaniards participate
in the Christmas Lottery, more of a social event: about 75% of the Spanish population
aged 18 or more participate.
In general, lottery studies analyze the effect of exogenous increases in individual
income. However, our research question looks at how improvements in economic con-
ditions affecting a whole community are connected with the re-election of incumbents.
In that sense, the lottery system we analyze here provides a unique setting to study
economic voting: we estimate the effect of an unexpected income shock on several
thousands of winners residing in the same geographic area. This effect might be very
different from that of an unexpected income shock affecting an isolated individual.
3 Background
3.1 Spanish political system
Spain is a relatively young democracy. After Franco’s death in 1975, a Constitution was
passed establishing Spain as a democratic constitutional monarchy. In what follows, we
discuss the system of national elections from the end of Franco’s dictatorship onward.
After the first election in 1977, Spain was ruled until 1982 by the Union of the
Democratic Center (Unión de Centro Democrático), a centrist party which collapsed
in 1982 due to internal conflicts. The 1982 elections gave an absolute majority to
the Partido Socialista Obrero Español (the main left-wing party, henceforth Socialist
Party), which was led by Felipe González. González, leading the Socialist Party, later
won the 1986, 1989 and 1993 elections. In March 1996, José Marı́a Aznar’s Partido
Popular (the main right-wing party, henceforth People’s Party) received more votes
than any other party, winning almost half the seats in the Congress. Prime Minister
Aznar was re-elected in March 2000, obtaining absolute majorities in both chambers
of parliament. For the March 2004 elections, the People’s Party nominated Mariano
Rajoy to replace Aznar as candidate. However, in the aftermath of the March 11
5
Kuhn et al. (2010) analyze the effects of prizes in the Dutch Postcode Lottery, probably the closest
lottery to the Spanish Christmas Lottery. The Dutch Postcode Lottery (Nationale Postcode Loterij )
is also a lottery system awarding winners in the same geographical location: the participant’s 6-digit
postcode. Just as in the case of the Spanish Christmas Lottery, the popularity of the Dutch Postcode
Lottery may be due to its potential to induce regret among nonparticipants, as nonparticipants living
in a winning code know that, had they purchased a ticket, they would have won (Zeelenberg and
Pieters 2004).
There are at least three differences between the Spanish Christmas Lottery and the Dutch Postcode
Lottery. First, the participation in the Spanish Christmas Lottery is much higher (approximately
75% vs. 30%, respectively). Second, participants in the Dutch Postcode Lottery win relatively little
money: most winners get ¿12,500 per ticket, compared to ¿300,000 received by the average Spanish
Christmas Lottery winner. Third, Dutch Postcode Lottery winners form a much smaller group: on
average, 19 households live in a postcode, while approximately 2,000 winning tickets share in the Fatty
awards.
5terrorist bomb attacks in Madrid, the People’s Party lost the 2004 elections to the
Socialist Party and its leader José Luis Rodrı́guez Zapatero. Rodrı́guez Zapatero was
appointed Prime Minister after having secured the support of a few minor parties. In
the 2008 general elections, Prime Minister Zapatero was re-elected by a plurality, short
of a majority.
In sum, between 1986 and 2008, the period we consider in this paper, there have
been seven elections and Spain has been ruled by the two main parties: the Socialist
Party (for 14 years) and the People’s Party (for eight years).
3.2 The Spanish Christmas Lottery
3.2.1 Origin and tickets
The Spanish Christmas Lottery (Loterı́a de Navidad de Navidad or Loterı́a del Gordo)
is a national lottery game which is held every year the 22nd of December, and is con-
sidered the biggest lottery event worldwide. It has been organized since 1812 by the
National Lottery Organization (Organización Nacional de Loterı́as y Apuestas del Es-
tado), a branch of the Spanish Public Administration. The Spanish Christmas Lottery
In 2008, the value of all tickets sold was approximately ¿3 billion, representing roughly
0.3% of Spanish GDP. As shown in Figure 1, this figure has remained stable over the
last two decades.
Christmas Lottery tickets have five-digit numbers. Until 2004, there were 66,000
numbers played; since 2005, there are 85,000 numbers played, between 00000 and
84999. For historic reasons, due to the cost and the enormous popularity of the game,
each number is split into several smaller units, called “series”. As shown in Table 1,
the number of series printed has increased over time, to accommodate growth in sales.
Each number is currently divided into 195 series. Each series consists of ten fractions
(called décimos). In turn, each fraction can be further divided into smaller units,
called participaciones. People usually buy either a fraction, at a cost of ¿20 each, or
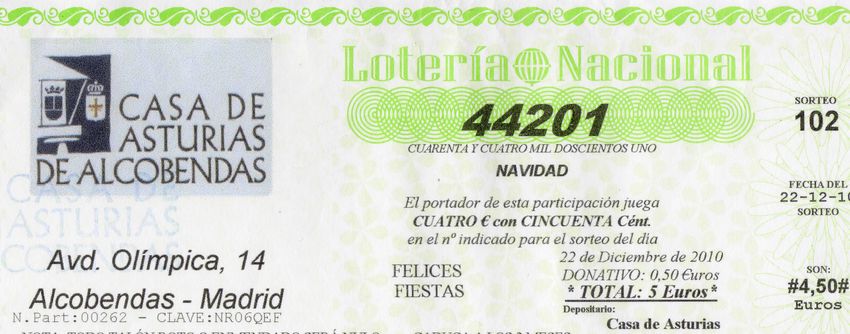
a participacion, at a cost of between ¿2 and ¿5. Figure 2 shows a sample fraction for
the 2010 Christmas Lottery, and Figure 3 shows a sample participación.
In his excellent account of syndicate lottery play, Garvı́a (2007) explains how syn-
dicate play arose in Spain in 1862, when the Spanish lottery system was reformed.
Because lotteries at the time were widely blamed for poverty and crime—as “many
people, and particularly the uneducated, were unable to control their gambling in-
stincts once they had fallen under their spell”6 —the government decided to protect
society by making lotteries unaffordable to the working poor. The rising cost of tickets
did not, however, reduce the lottery’s appeal among the working classes. On the con-
trary, revenues steadily increased due to the way that players responded to the reform:
since many of them could not afford to participate individually, they turned to their
social networks and began syndicate playing (Garvı́a 2007).7
Spain’s National Lottery Organization manages the distribution of lottery tickets
6
Garvı́a (2007), p. 622.
7
The winning ticket of the Christmas Lottery of 1862 was shared in the following way: “Five or six
fractions were distributed among more than 40 people, who syndicated... Four or five fractions were
shared by cousins and uncles of the same working poor family, and the last fraction was purchased by
a cooking oil supplier, who shared it with 32 other people, some of whom split their own shares with
people who only paid two or three reales to participate. As a result, more than 60 people, all of them
very poor, have a share in this last fraction” (Garvı́a 2007, citing the magazine El Enano).
6throughout lottery outlets across the country. Each number is mostly sold by one
lottery outlet.8 This is for a number of reasons: first, given syndicate play, people
like to share the same number; second, this makes distribution easier; and third, this
makes winners more visible. Which particular number is allocated to each outlet is
determined randomly using a computer.9
Due to the nature of syndicate play, and for convenience, most people buy lottery in
their province of residence. An exception is the lottery outlet of Sort, a small village in
the province of Lleida, that receives buyers from all over the country for superstitious
reasons (“Sort” is the Catalan word for “Luck”). In recent years Sort has sold ticket
fractions with a total value over 100 million, about 3% of total sales.10 Another phe-
nomenon that might have increased over time is the availability of Christmas Lottery
tickets for sale on the internet. However, internet sales of Christmas Lottery tickets
remain relatively small: only around 2% of all tickets are purchased online.11
3.2.2 Functioning
Next we describe the functioning of the Christmas Lottery. There are many rules
regulating the process and these are strictly observed and adhered to. Two drums are
used for the draw, the larger is used for the numbers, thus containing 85,000 balls, with
each ball corresponding to one number; the smaller drum is used for the prizes. Small
balls are introduced for each number and prize in each drum respectively. The day
before the draw, the balls with numbers and prizes are publicly examined and counted.
Once this procedure is over, the hall where the balls are kept is sealed and locked, with
keys held by only three people. The next morning, the hall is opened at 8:00 AM and
the committee that will be in charge of the draw is formed. Before the draw is held, the
general public is allowed to inspect the balls. Once this is done, the balls are introduced
in the respective drums through a mechanical transportation device. Both drums are
closed and start turning once the committee’s president provides authorization for it.
The draw is held in front of the public and the committee. The balls are extracted
by primary schoolers: as one child extracts one of the numbered balls, another child
extracts one of the prize balls. This process continues for several hours until the point
where no balls are left in the prize drum.12
The draw attracts wide TV audiences, and when the top prize, the Fatty, is drawn,
TV cameras travel to the winning location to show images of some of the happy winners.
All in all, the process constitutes a popular Spanish Christmas tradition.
8
For instance, according to our calculations using data from the last 25 years, on average, 80% of
tickets of the winning numbers were sold by one outlet each year.
9
Dossier de Prensa, Sorteo de Navidad 2009, National Lottery Organization.
10
“Hacienda ingresará unos 660 millones de euros con el sorteo de la Loterı́a de Navidad”, El Mundo,
December 21, 2006.
11
This information comes from a personal conversation with a representative of Ventura 24, one of
Spain’s top sellers of lottery online.
12
For two centuries, children from San Ildefonso Primary School in Madrid have extracted and sung
the winning numbers of the National Lottery in December.
73.2.3 Prizes
In 2008, the total payout of prizes was approximately ¿2 billion.13 About half of this
was awarded in the top three prizes. For the top prize, the Fatty, all holders of fractions
of the winning number won ¿15,000 for every euro played. In practice, this means that
a winning player with a fraction was awarded ¿300,000, and a winning player with a
participación worth ¿5 received ¿75,000. The second and third prizes awarded winners
¿5,000 and ¿2,500 per euro played, respectively.14 In aggregate terms, this meant that
the top prize was worth ¿585 million; the second prize was ¿195 million; the third
prize was awarded ¿97.5 million. There typically are also 13334 smaller prizes (8499
of them are equivalent to reimbursements).
Due to this lottery design, and given that most fractions in each number are sold
by only one lottery outlet, the Fatty ends up awarding many relatively small prizes to
several thousand individuals living in the same area.
3.2.4 Players’ characteristics
Table 2 shows descriptive statistics for survey information on Christmas Lottery ex-
penditure.15 On average, 75% of the Spanish population aged 18 or more participate in
the Christmas Lottery. The amount of lottery bought by each player is fairly similar.
As shown in Figure 4, the median lottery player in 2009 was planning to spend between
¿30 and ¿60, while relatively few people were planning to spend over ¿150.16 This
survey information fits the picture that we get from the aggregate data on Christmas
Lottery expenditure, according to which in 2009 the average Spaniard spent approx-
imately ¿70 on the Christmas Lottery. Most Christmas Lottery players (62%) only
buy lottery in the particular case of Christmas Lottery; only 10% of Christmas Lottery
players are frequent lottery players.
The popularity of the Spanish Christmas Lottery may be due to its potential to
induce regret among nonparticipants, as nonparticipants in a winning (personal or
professional) network know that, had they purchased a ticket, they would also have
won.17 Furthermore, individuals tend to share tickets. According to the survey data,
87% of the individuals who participate syndicate play. They share their tickets with
relatives (64%), friends (33%), or co-workers (28%). 54% of players purchase shares
(participaciones) at places they frequent.
In Table 3 we explore whether lottery expenditure is connected to political ideology.
13
70% of revenues are distributed as prizes and the remaining 30% are retained for commissions
paid to outlets, revenue for Internal Revenue, and administration costs. Lottery outlets keep 3% of
the ticket value as revenue, e.g., 60 cents for every fraction sold. Christmas lottery prizes are tax
exempt (Dossier de Prensa, Sorteo de Navidad 2009, National Lottery Organization).
14
Between 1986 and 2004, the prizes per euro played were ¿10,000, ¿4,800 and ¿2,400 respectively.
15
The Centro de Investigaciones Sociológicas (CIS, Spain’s Centre for Sociological Research) has
surveyed the Spanish population regarding their Christmas Lottery expenditure on six occasions over
the period of study. These surveys where conducted in December 1988, January 1998, January 1999,
January 2001, December 2004 and December 2009 (surveys number 1779, 2274, 2316, 2406, 2587 and
2824 respectively.)
16
The distribution of Christmas Lottery expenditure in Spain is consistent with a popular saying,
usually attributed to King Charles III, according to which “playing a lot is crazy, but not playing at
all is foolish” (“El que juega mucho es un loco, pero el que no juega nada es un tonto” ).
17
Sharing tickets at Christmas has become a way to reinforce social ties. “I don’t want to be the
only idiot who has to turn up to work if the office number wins.” “Gamblers united”, The Economist,
December 17, 2009.
8We do not observe lottery expenditure for 266 of 7,660 individuals (3.5% of the sample),
therefore we use Tobit regressions. In column (1) we regress the amount spent on
Christmas Lottery on political party dummies. Socialist Party voters spend on average
¿64; on average, People’s Party voters spend slightly more: approximately ¿70. In
column (2) we control for an array of individual characteristics, such as gender, age,
education and employment status. Spanish men spend significantly more on Christmas
Lottery: the difference amounts to ¿14. Expenditure increases with age. Looking at
educational levels, high school graduates are those with the highest Christmas Lottery
expenditure. Finally, the unemployed, the retired, and students all spend significantly
less than the employed.
4 Data
In this section we describe the sources of data used in this paper to analyze the relation-
ship between economic conditions and voting. We draw information at the provincial
level from four sources. First, we use electoral outcome information. Second, we have
collected information on the main macroeconomic variables at the provincial level.
Third, we use information on Christmas Lottery top prizes and expenditure. Fourth,
we use survey data with information on the intention to vote and the subjective as-
sessments of the surveyed individuals.
4.1 Electoral data
We use electoral outcome information from national elections from 1986 through 2008.18
Table 4 shows descriptive statistics at the province level for the variables used in the
paper. In panel 1 we display electoral figures. In the average province, the electoral
roll is composed of around six hundred thousand people, with voter turnout at 74%.
Incumbent parties received 41% of votes on average. Slightly more votes went to the
Socialist Party (40%) than to the People’s Party (38%); consistent with the Socialist
Party winning five out of the seven national elections in our sample.
4.2 Macroeconomic data
In panel 2 in Table 4 we display statistics for the macroeconomic variables we use.19
The average province has a population of 827,000 and its GDP equals ¿12,174 million
(in what follows, all the macroeconomic variables are measured in year 2000 constant
euros). On average, the unemployment rate over the period has been 16%, and the
consumer price index has been slightly above 4%. Housing prices are around 1,000
euros per square meter, and approximately 32,000 new automobiles are registered each
year. We have also collected information on a measure included in National Accounts
18
The data come from the Ministerio del Interior. Available at
http://www.elecciones.mir.es/MIR/jsp/resultados/index.htm (retrieved December 2009).
19
Data on the GDP of Spanish provinces come from “Contabilidad Regional de España” (Fun-
dación BBVA and Instituto Valenciano de Investigaciones Económicas). Data on housing prices were
provided by a property valuation company (Sociedad de Tasación, S.A., available at http://www.st-
tasacion.com). Data on automobile registrations was obtained from official sources (Dirección General
de Tráfico, available at http://www.dgt.es). All of the other macroeconomic variables used in the anal-
ysis (population, unemployment rate, consumer price index, other transfers) come from the National
Bureau of Statistics (Instituto Nacional de Estadı́stica, available at http://www.ine.es).
9called “Other (current) transfers” (Otras transferencias corrientes). This item provides
information on residents’ income from “scholarships, fines, lottery winnings and games
of chance”(note that GDP does not include lottery winnings). This information is
available at the provincial level since 1995.
4.3 Christmas Lottery data
We use data on awards and on expenditure on Christmas Lottery by province.20 In
particular, we observe the province where tickets receiving the top three prizes were
sold, as well as the total number of tickets sold in each province. Descriptive statistics
for the lottery data are provided in panel 3 in Table 4.
The average yearly expenditure in Christmas Lottery per province over the period
is equal to 0.28% of GDP. Christmas Lottery prizes amount to 70% of sales, approxi-
mately 0.19% of GDP. We observe the geographical distribution of the top three prizes.
The top three prizes make up around half of the total quantity assigned to prizes, 0.10%
of GDP; of this, 0.06% represents the top prize, 0.03% represents the second prize, and
0.02% represents the third prize. Most tickets for the same number are usually sold
within a single province. Due to this geographical clustering, provinces where the win-
ning tickets are sold tend to experience relatively large income shocks. Figure 5 shows
the awards received by the main winning province each year in the Christmas lotter-
ies held between 1986 and 2008. The province obtaining the largest award receives a
mean (median) income shock of about 3.3% (1.5%) of provincial GDP. Note that in
two cases the awards were larger than 10% of provincial GDP, corresponding to two
small provinces, Segovia (2000) and Soria (2006).
We cannot observe the geographical distribution of the remaining 13,331 small
prizes that are awarded in the Christmas Lottery, but given the random nature of the
prizes, it can be safely assumed that their distribution is proportional to provincial
expenditure in Christmas Lottery.21 In what follows, by lottery prizes we mean the
top three prizes.
4.4 Survey data
The Centro de Investigaciones Sociológicas (CIS, Spain’s Centre for Sociological Re-
search) performs regular surveys with questions relating to current issues and intention
to vote. We have gathered information on all surveys including political information
conducted over our period of study. These are the surveys held in January, April, July
and October between July 1986 and April 2010.22 In total, we have information for 96
surveys covering information on approximately 300,000 individuals.
In the first panel of Table 5 we show descriptive statistics for survey respondents’
individual characteristics. The average age of respondents is 46 years, and about half
of them are male. A majority of respondents have primary school as their highest
level of education; 24% of them are high school graduates, and around 14% have
20
Lottery data were kindly provided by the National Lottery Organization.
21
For instance, in 2010, in addition to the fourth prize (20,000 per euro played), and the fifth prize
(5,000 per euro played), there are 1,774 pedreas (100 per euro played), 8,499 refunds as well as several
other minor prizes.
22
The January survey is usually conducted in late January or early February, and the April survey
is usually conducted in late April or early May. The July survey is almost always carried on in mid
July. The October survey is usually conducted in the last two weeks of October.
10higher education. Around 45% of respondents are employed, 20% are retired, 19% are
homemakers and 10% are unemployed.
In the second panel of Table 5 we show descriptive statistics for our variables of
interest. Surveys typically ask respondents about the political party they would vote
for were there a national election the following day (first row). Respondents are then
asked about the political party which they sympathize with (second row). In most
surveys, respondents are also asked to evaluate the incumbent party using a five-point
scale (very good, good, average, poor or very poor ; third row). In some surveys, the
same five-point scale is used to inquire about respondents’ evaluation of the opposition
party (fourth row). Finally, in some surveys respondents are asked to provide their
own assessment of the country’s economic situation (fifth row) and/or the political
situation (sixth row).23 Unfortunately, there is no systematic collection of respondents’
subjective well-being.
5 Empirical analysis
In this section, first we analyze the potential existence of economic voting in Spain.
Next we exploit the random income shocks generated by the Christmas Lottery in
order to deal with the potential endogeneity of variations in economic conditions.
5.1 Economic conditions and electoral outcomes
We investigate the relationship between economic outcomes and voting behavior in
national elections across Spanish provinces. Following the standard literature in the
topic, in our first specification we regress the change in votes received by the incumbent
on a number of measures of economic conditions: the growth rate in income per capita,
the change in the unemployment rate, the change in the consumer price index and in
housing prices. That is, we run the regression:
∆V otesst = αt + β∆Economic variablesst + εst (1)
where ∆V otesst denotes the variation in the percentage of votes received in province
s by the incumbent party in the national elections between the election in year t and
the previous election.24 The inclusion of election fixed-effects, αt , allows to control
23
The questions can be respectively translated into English as follows. 1. If the national elections
were to be held tomorrow, which party would you vote for? 2. In any case, which of the following
parties do you sympathize with more, or which of the following parties do you consider closer to your
own ideas? 3. Overall, how would you describe the management task led by the government party:
very good, good, average, poor, very poor? 4. In general, how would you describe the political action
taken by the opposition party: very good, good, average, poor, very poor? 5. Regarding Spain’s overall
economic situation, how would you describe it: very good, good, average, poor, very poor? 6. Regarding
Spain’s overall political situation, how would you describe it: very good, good, average, poor, very poor?
24
In Spain there are no term limits, and for national elections from 1986 through 2008, it is almost
always the case that the incumbent party coincides with the incumbent politician. The only national
election in which the incumbent party had a candidate that was not the incumbent politician was
2004. That year, Mariano Rajoy was appointed by José Marı́a Aznar, then the Prime Minister, to be
the candidate running for election for the People’s Party.
The national election candidates and outcomes in Spain in our period of study are as follows
(Socialist Party and People’s Party candidates, respectively): in the 1982 and 1986 elections, Felipe
González vs. Manuel Fraga (the former won both elections); in the 1989, 1993 and 1996 elections,
11for the effect of factors that may have affected simultaneously voting behavior in all
provinces. The economic changes that we are thus identifying are variations relative
to other provinces in the same term. It is not possible to use these estimates to answer
questions such as how would voting change if the whole country experienced good
economic conditions or, as it is currently the case, an economic recession. In all of our
regressions, we cluster standard errors at the province level to account for the fact that
events at the provincial level might be affecting individuals in the same province.
In Table 6 we report the OLS results from estimating regression (1). We find a
positive relationship between the growth rate of income per capita during the election
cycle and the percentage of votes received by the incumbent. According to the estimates
in column (1), an increase in one percent in the growth rate of per capita GDP of a
province relative to the national average is associated with a significant increase in
the incumbent’s votes of 0.33 percentage points. The positive association we estimate
for Spain, a relatively young democracy, is consistent with the results of Brender and
Drazen (2008) for new democracies. We do not find a significant relationship between
the incumbent’s votes and other economic variables.
5.2 Christmas Lottery
In the previous subsection we have found a positive relationship between economic
conditions and the percentage of votes received by the incumbent. Nevertheless, it is
not clear what this correlation reflects: it could be that good politicians both create
policy conducive to economic growth and attract votes, but it could also be that, for
some reason, economic growth leads voters to favor the incumbent.
In order to deal with the endogeneity of economic conditions we exploit the evidence
provided by the Spanish Christmas Lottery. First, we analyze whether the Christmas
Lottery is really random, and whether it is safe to assume that individuals buy Christ-
mas Lottery in the province where they vote. Then we explore how the income shocks
generated by the Spanish Christmas Lottery affect macroeconomic variables and, fi-
nally, voting behavior. For this we use information on electoral results at the provincial
level and survey data. The latter may allow us to investigate the mechanism behind
the Christmas Lottery effect on the votes received by the incumbent.
5.2.1 Identification strategy
Our analysis relies on the assumption that the Spanish Christmas Lottery is random.
In other words, our identification strategy exploits the fact that, because of the ran-
dom assignment of prizes, E[P rizesst |Expenditurest ] = E[P rizesst |Expenditurest , ·],
where P rizesst and Expenditurest denote the Christmas Lottery income awarded and
the Christmas Lottery expenditure in province s in year t as percentage of GDP re-
spectively.
As explained in the Background Section, the functioning of the Lottery aims to
ensure randomness; here we test formally the hypothesis of randomness. For this we
regress the Christmas Lottery top prizes received on Christmas Lottery expenditure
Felipe González vs. José Marı́a Aznar (the former won the first two elections, while the latter won
the 1996 election); in the 2000 election, Joaquı́n Almunia vs. José Marı́a Aznar (the latter won); in
the 2004 and 2008 elections, José Luis Rodrı́guez Zapatero vs. Mariano Rajoy (the former won both
elections).
12and a number of predetermined macroeconomic and political variables:
P rizesst = α+βExpenditurest +γ∆Economic variablesst−1 +λP olitical variablesst−1 +εst
(2)
where ∆Economic variablesst−1 includes the variation between year t−2 and year t−1
in the following variables: per capita GDP, unemployment rate, the consumer price
index, and housing prices; and P olitical variablesst−1 include the percentage of votes
received in province s by the incumbent party in the previous national election, and
the level of electoral participation.
OLS results from running regression (2) are in Table 7. We observe that provinces
where residents spend more on Christmas Lottery tend to receive more money in prizes
(column (1)). This is not surprising, as buying more tickets increases the chances of
success. However, if the lottery is truly random, we would not expect the prizes to
be determined by other variables. As expected, conditional on lottery expenditure,
economic conditions do not affect lottery prizes (column (2)). Moreover, provinces in
which incumbents obtained more votes do not receive more lottery prizes (column (3)).
This evidence is consistent with the randomness of the Christmas Lottery.
5.2.2 Do people purchase lottery tickets in their province of residence?
In this paper, in order to identify the province where awards were received we use
information on the province where the tickets were sold. Some players, however, may
exchange tickets with people in their networks who live in other areas, or they may
purchase tickets while on vacation outside their area of residence. Here we use data from
the National Accounts to verify that this assumption is correct and run the following
regression:
∆ystk = α + βP rizesst+1 + γExpenditurest+1 + εstk (3)
where ∆ystk denotes the variation in the amount of “Other (current) transfers” (Otras
transferencias corrientes), a measure that provides information on residents’ income
from “scholarships, fines, lottery winnings and games of chance”, received by province s
between year t and year t + k, for k = {1, 2, 3, 4}, and P rizesst+1 and Expenditurest+1
are defined as before.
OLS results from running regression (3) are in the first column of Table 8. The
Christmas Lottery prizes show up in the National Accounts the very same year the
Christmas Lottery was held, as well as on the National Accounts for the following
year. For a prize equivalent to 1% of the province’s GDP, there is an increase in Other
transfers the same year equivalent to 0.67% of the GDP (first row), and an increase
of 0.28% of the GDP the following year (second row). The latter might reflect that
individuals have up to three months to cash in their winning tickets. The effect does
not persist in later years (rows three to four), as would be expected. In sum, the
evidence suggests that approximately 95% of prizes are collected in the province where
the tickets were sold.25
25
Unfortunately, this information is only available since 1995. Otherwise, we would have analyzed
voting behavior using an instrumental variable strategy; specifically, instrumenting the income data
with the Christmas Lottery prizes.
135.2.3 The macroeconomic effects of the Christmas Lottery
Before turning to voting data, we examine how the Christmas Lottery prizes relate to
a number of macroeconomic variables. For this we run a regression of the same form
as specification (1) to study whether the increase in individuals’ disposable income due
to the Christmas Lottery winnings has an effect on the economy (columns (2)-(7) in
Table 8).
In our context it is not possible to disentangle how an unexpected income shock
might affect winners and how it might affect individuals who did not win, but live in
the same community as winners. That is, the results in this paper reflect the sum of
the effect from lottery prizes on winners, and the effect on the rest of the community.26
We do not see any significant change in GDP, population, or in the consumer price
index in years following a lottery shock. We also explore the effect of lottery prizes
on unemployment. There are two theoretical effects. On the one hand, individuals
holding winning tickets may decide to reduce their labor supply. According to the
evidence in Imbens et al. (2001), lottery prizes equivalent in size to the Fatty do not
substantially affect labor supply. On the other hand, individuals living in a winning
province who did not win, may benefit from increases in consumption in the province,
which would possibly affect their labor supply. We observe a temporary reduction in
unemployment of about 0.14 percentage points one year after a prize equivalent to 1%
of the GDP has been awarded, suggesting that, of the two effects mentioned above, the
latter dominates.27
Kuhn et al. (2010) find that lottery winners use durable spending to smooth con-
sumption. We examine whether Christmas Lottery awards affect housing prices and
automobile sales. We observe an increase of about 0.8 percentage points in housing
prizes a few years after the prize has been awarded, but this is not statistically sig-
nificant.28 Automobile sales increase by 1.5% during the two years following a lottery
prize equivalent to 1% of the provincial GDP; this effect fades out afterward.
5.2.4 Christmas Lottery and electoral outcomes
We first examine the descriptive evidence. We classify observations in two groups.
In the first group, we have the 17 observations corresponding to every province that
was awarded most of the top prize in any of the Christmas Lotteries held during the
term.29 The second group includes every other observation. Panel 1 in Table 9 provides
descriptive information about these two groups. As expected, the group of winners
receives much larger prizes, both in relative terms (3.39% vs. 0.19% of the GDP), and
in absolute terms (¿317.06 vs. ¿18.15 million). As shown in rows three and four, this
partly reflects differences in lottery expenditure: while winning provinces had spent on
average 1.36% of their GDP in Christmas Lottery during the term, losing provinces
had spent only 1.00%. The difference is larger in absolute terms (¿311.81 vs. ¿109.24
million), reflecting the fact that larger provinces have better (unconditional) chances
of winning. In the second panel, we explore the potential existence of differences
26
In contrast, Kuhn et al. (2010) study the social effects of an unexpected income shocks.
27
The unemployment rate is typically measured on January 1st every year.
28
The lack of significance and the lag in the effect may be related to the fact that the price measure
we use is an estimation performed by a property valuation company.
29
During the 21 years in our sample, in two occasions, no province had sold a majority of the tickets,
and in two other occasions the same province obtained twice in the same term the top prize.
14in electoral behavior between winning and losing provinces. While in the latter the
incumbent tends to lose votes (around 0.91 percentage points), in winning provinces
the incumbent tends to gain 2.33 percentage points. This difference is significantly
different from zero. Participation rates seem to decrease in winning provinces, but the
difference is not statistically significant. We do not observe significant differences in
the share of votes received by the Socialist Party, the share of votes received by the
People’s Party.
Based on this descriptive information only, it is not possible to tell whether the
increase in support for the incumbent is due to lottery prizes, or whether it reflects
some other underlying cause that affected lottery sales. In order to isolate the effect
of prizes, we now regress the incumbent’s votes on the prizes awarded to residents in a
given province, controlling for the Christmas Lottery expenditure in the province:
∆V otesst = αt + βP rizesst + γExpenditurest + εst (4)
where P rizesst denotes the total income in Spanish Christmas Lottery prizes as per-
centage of GDP received by province s in the years prior to the election in year t, and
Expenditurest is the per capita expenditure on the Christmas Lottery during the same
period.
We present OLS results from running regression (4) in column (2) of Table 6.
Incumbents receive relatively more votes in provinces awarded with Christmas Lottery
prizes. Receiving 1% of GDP in the form of lottery winnings increases the votes
received by the incumbent in approximately 0.21 percentage points, relative to the
votes obtained by the incumbent in losing provinces. This might reflect either an
increase of votes for the incumbent in winning provinces, or a reduction in votes for
the incumbent in losing provinces. In winning provinces, the variation in votes could
be due to either changes in the votes of winners, or to spillovers to voters who did not
win. Interestingly, both GDP increases and Christmas Lottery winnings seem to have
an effect of similar magnitude on the votes received by the incumbent.
As shown above, lottery prizes may affect some macroeconomic variables slightly.
In order to isolate the direct effect of lottery prizes on voting in column (3) we include
economic variables together with lottery information. As robustness check, in column
(4) we run the same regression, now including as controls province fixed-effects. In both
cases, results remain unchanged. Thus far we have weighted equally the information
provided by provinces that, in some cases, differ greatly in their size. In column
(5), we re-estimate the specification in column (3), now weighting each observation
by the potential number of voters in the province. The impact of lottery prizes in
the weighted regression is three times larger (0.66 percentage points), but it is not
statistically significant from our previous estimates. In column (6) we exclude the
province of Lleida from the sample. As explained before, this province includes the
town of Sort (which means “Luck”in Catalan), a town that attracts buyers from all
around the country. Excluding this province improves the accuracy of the estimation,
but the point estimate is basically unchanged.
Next we would like to explore whether the effect is different according on the ide-
ology of the incumbent. In particular, incumbent parties favoring less redistributive
policies might benefit more from increases in income (Brunner et al. 2010, Doherty et
al. 2006). In columns (7) and (8) we split the sample in two: elections in which the
left-wing was the incumbent, and elections in which the right-wing was the incumbent.
Right-wing governments seem to benefit electorally more from economic growth. An
15increase in 1% of the GDP is associated with an increase of votes for the incumbent of
0.51 percentages points when the People’s Party is in power; the figure is 0.26 percent-
age points when the incumbent is the Socialist Party. Similarly, the estimated effect
of lottery prizes is slightly larger for elections in which the right-wing was the incum-
bent, but the difference between the coefficients for the two parties is not statistically
significant.
We have documented the existence of a positive (causal) relationship between lot-
tery prizes and the share of votes received by the incumbent. As shown above, lottery
awards do not affect population size, thus we can discard the presence of a composi-
tion effect. However, lottery prizes may have an effect in the number of people that
turn out to vote. For instance, Brunner et al. (2010) find that positive economic
shocks decrease voter turnout. There is also some additional evidence that subjective
well-being might affect turnout (Dolan et al. 2008).30 In Table 10 we investigate this
possibility by regressing participation on elections on Christmas Lottery prizes and
controls. The main determinant of participation is unemployment rate. An increase in
the unemployment rate of one point is associated with an increase in participation of
0.20 percentage points. The estimated coefficient of lottery prizes is negative, but it is
not statistically significant at standard levels, and the magnitude is small compared to
the effect of lottery awards on the votes received by the incumbent. This suggests that
the greater chances of incumbents cannot be explained by variations in voter turnout;
therefore, it must be that some voters who would otherwise not have voted for the
incumbent are doing so once the province gets the Fatty.
We also examine whether the effect of lottery prizes on the number of votes received
by the incumbent varies depending on the characteristics of provinces. First, in the
left panel in Table 11 we split the sample into two subsamples, poor and rich provinces
respectively, using the median province as threshold. The estimated effect of lottery
prizes is larger for richer provinces, but the difference is not statistically significant.
Second, we investigate whether the effect is larger for provinces where people spend
more on Christmas Lottery. In the central panel of Table 11 we show results of running
regression (4) by level of Christmas Lottery expenditure. The effect does not seem to
be statistically different for low or high spenders. Finally, in the right panel of Table
11 we split the sample into small and big provinces. The effect is much larger in big
provinces but, again, the accuracy of the estimation is relatively low, and we cannot
reject the possibility that the effect is similar for both groups.
5.2.5 Timing of the Christmas Lottery effect
Thus far we have considered all the top prizes received by a province over the term
prior to the election. Next we would like to examine the timing of the effect. We dis-
tinguish between awards obtained the Christmas right before the election (on average,
four months before the election is held), and awards obtained two and three Christmas
before the election. In Table 12 we run regression (4) using the lottery prizes as per-
centage of GDP with lags. The coefficients of the lagged variables are not statistically
different, but the evidence is consistent with the effect of Christmas Lottery winnings
fading out over time.
30
Unfortunately, the authors do not examine whether subjective well-being could change voting
preferences altogether.
16You can also read