WELLINGTON CITY'S 2013 CLIMATE CHANGE ACTION PLAN - Capacity ...
←
→
Page content transcription
If your browser does not render page correctly, please read the page content below
WELLINGTON CITY’S
2013 CLIMATE CHANGE
ACTION PLAN
MESSAGE
                                  FROM THE
                                  MAYOR

 In July 2013, Sir Peter Gluckman, Chief Science Advisor to         enhancing Wellington’s role as a centre of excellence for
 the Prime Minister, released a climate change assessment           urban planning, resilience and ecological sustainability
 for New Zealand. He writes:                                        exploring opportunities for reducing emissions through an
                                                                    update of the Wellington Transport Strategy
“There is unequivocal evidence that the Earth’s
 climate is changing, and there is strong scientific                increasing the involvement of all communities in activities
 agreement that this is predominantly as a result of                for climate change mitigation and adaptation.
 anthropogenic greenhouse gas emissions.”
                                                                  Above all, this plan is about working together as a city to
 With significant climate impacts projected for our               safeguard our quality of life, our economic development and
 environment and economy, he makes the case that                  natural capital. In 2012, Wellington won a first-place prize
 New Zealand must prepare for change. Our vulnerability to        in the International Awards for Liveable Communities. The
 droughts and extreme storms has been driven home in the          actions we take now on climate change will help determine
 past year, and Wellington has just had its warmest winter        the liveability of our beautiful city for generations to come.
 on record. The climate change impacts we have seen so
                                                                  Meeting Wellington’s ambitious climate change objectives
 far are modest compared to those in other countries and
                                                                  will require a major change in investment choices as part
 the impact on the global economy.
                                                                  of – not instead of – our economic growth. We need to
 As climate science advances and we experience the                find cost-effective ways to increase renewable generation,
 realities of climate change, climate change action is shifting   make homes and buildings more efficient, shift to low-carbon
 into the mainstream and is becoming a great opportunity as       transport and enhance our forests. In the longer term, we need
 well as a challenge.                                             to shape our responses to sea-level rise, whether through
                                                                  accommodation, strategic use of natural or engineered
 This 2013 edition of Wellington City’s Climate Change Action
                                                                  defences or retreat. Improving our resilience is vital.
 Plan builds on our accomplishments under the previous
 award-winning plan: increasing local renewable generation,       In the coming year, the Council plans to launch major
 insulating homes, improving energy efficiency, investing in      engagement with the public and stakeholders on climate
 public transport and encouraging more people to walk and         change mitigation and adaptation, to build support
 cycle, trialling electric vehicles, planting more trees and      and commitment to action. We also expect to continue
 managing pests, increasing recycling and composting, and         our efforts as an advocate for regional, national and
 researching the impacts of a changing climate on our city.       international action on climate change.
 The plan sets out new initiatives that will help us to achieve   We cannot respond to these challenges with ‘more of the
 the goals of our strategy Wellington Towards 2040: Smart         same’. Instead, let us work together as a city to unlock the
 Capital. These include:                                          changes that will put us on a pathway toward resilient low-
                                                                  carbon development.
   implementing Smart Energy Capital, which co-funds
   innovation in reducing energy use
   participating in the UN-Habitat City Resilience
   Profiling Programme and UNISDR Making Cities                                        Wellington Mayor Celia Wade-Brown
   Resilient campaign                                                                                         October 2013

                                                                                                                                 1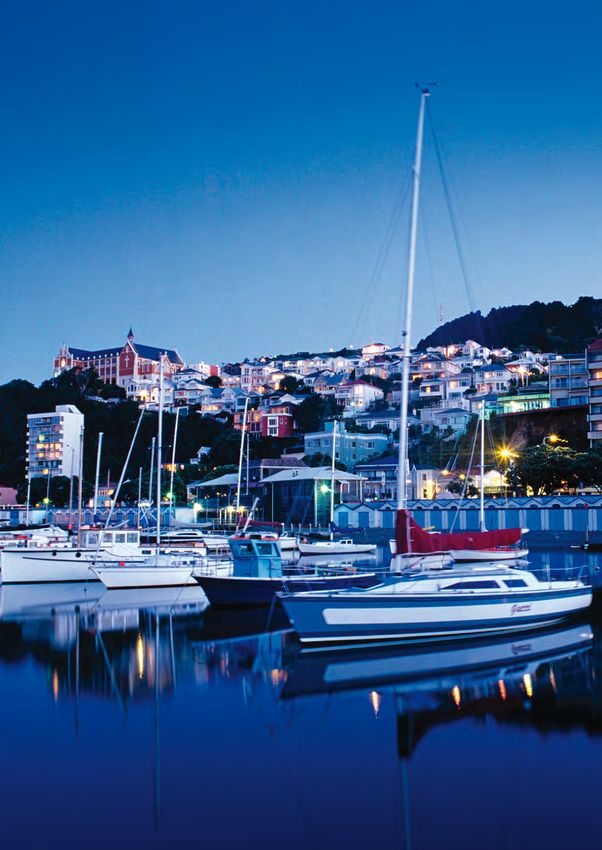
CONTENTS

Overview .................................................................................................................3
Introduction .............................................................................................................6
Action area 1: Adapting to a changing climate ........................................................19
Action area 2: Buildings and energy .......................................................................22
Action area 3: Land transport and shipping.............................................................26
Action area 4: Waste ..............................................................................................30
Action area 5: Council operations ...........................................................................32
Action area 6: Forestry ...........................................................................................36
Action area 7: Aviation ...........................................................................................38
2020 emissions-reduction target – how we will get there.......................................40
Wellington’s international connections ...................................................................44
Council budget for climate change action ...............................................................46
Conclusion ............................................................................................................47
Contact us .............................................................................................................48

TABLES
Greenhouse gas emissions-reduction targets ...........................................................7
Wellington City greenhouse gas inventory 2009–2010............................................15
Council expenditure specific to the Climate Change Action Plan..............................46

GRAPHS
Wellington City greenhouse gas inventory, excluding forestry 2009–2010...............15
Wellington’s target pathway: the wedge .................................................................41

2

OVERVIEW

1. For Wellington to thrive in a future of growing carbon     5. Achieving these targets and longer-term objectives for
   constraints and climate impacts, we need to take              change will require major shifts in the investments and
   action to reduce our greenhouse gas emissions and             choices we make as Wellingtonians.
   vulnerability to extreme weather events and sea-level
                                                              6. To help lead this change, the Council proposes to target
   rise. Wellington is responding to this challenge through
                                                                 areas where most gains can be made: how we generate
   mitigation and adaptation initiatives in the Council and
                                                                 energy and use it in our homes and buildings, how
   the community.
                                                                 we manage transport challenges, how we enhance
2. The actions we have taken since 2010 are helping to           our forests and get the most benefits from compact
   limit emissions growth in the context of an expanding         development.
   population and economy. They are also improving our
                                                              7. The 2013 plan provides a starting point for public
   quality of life, enhancing resilience, creating business
                                                                 and stakeholder engagement in the coming year. Our
   opportunities and helping to establish Wellington as a
                                                                 aim is to gain broad support for resilient low-carbon
   centre of excellence for urban planning, resilience and
                                                                 development from businesses, communities and Māori,
   ecological sustainability.
                                                                 as well as household and organisational commitment
3. In the 2013 Climate Change Action Plan, we are                to action. We want to leverage public and private
    extending and improving existing initiatives and             investment and create new partnerships for change.
    integrating new ones. Highlights include Smart
                                                              8. Wellington will need supporting policies from, and
    Energy Capital, an update of the Wellington Transport
                                                                 partnerships with, regional and central government to
    Strategy, participation in UN resilience programmes
                                                                 achieve its ambitious climate change goals. The Council
    and enhanced research partnerships.
                                                                 will advocate for improving regional and national policies
4. Both the city and the Council have ambitious emissions-       that have implications for climate change mitigation
   reduction targets. By 2020, the city aims for a 30            and adaptation.
   percent reduction from 2001 levels and the Council a
   40 percent reduction from 2003 levels. By 2050, both
   the city and Council aim for an 80 percent reduction
   relative to the respective base year.

                                                                                                                           3
CLIMATE CHANGE ACTION
IS SMART ACTION FOR NEW
ZEALAND’S CAPITAL

       QUALITY OF LIFE                      ECONOMIC DEVELOPMENT                               RESILIENCE

                         Making our homes warmer, drier and healthier while
                                       reducing energy bills

                                                Making our commercial buildings more
                                                  efficient, resilient and competitive

                     Increasing energy security through renewable power generation: wind, solar,
                                         geothermal, landfill gas and marine

                                                                    Using smart grid technologies
                                                                       to optimise energy use

                     Increasing public and active transport, changing our driving habits and using
                                  more efficient cars and low-carbon transport fuels

                         Waste avoidance, reuse,                                 Using water
                        recycling and composting                                more efficiently

                              Serving as a centre of excellence for urban planning,                  Engaging with
                                     resilience and ecological sustainability                         communities

    Enhancing green infrastructure and biodiversity: planting trees, maintaining green corridors and managing pests

                        Preparing for the impacts of sea-level rise and extreme weather events

                      Advocating for improvements to regional, national and international policies

4
WELLINGTON CITY’S
2013 CLIMATE CHANGE
ACTION PLAN

                     PRIORITIES FOR 2013–2015

                       Research climate impacts in Wellington
                       Integrate adaptation into strategic resilience planning
    Adaptation
                       Engage with communities and stakeholders on risk and resilience
                       Implement water-sensitive urban design

                       Implement the Smart Energy Capital fund
                       Implement NABERS NZ TM (energy efficiency) benchmarking
   Buildings and       Extend Home Energy Saver
      energy           Extend Warm Up Wellington
                       Develop a rental housing warrant of fitness
                       Incentivise solar energy development

                       Improve public transport and road networks, and encourage more walking and cycling
  Land transport
                       Support compact city development
   and shipping
                       Promote efficient vehicle technology and low-carbon fuels

                       Investigate improved methods of sewage sludge treatment
                       Develop a regional waste education strategy
       Waste
                       Improve packaging product stewardship
                       Expand Kai to Compost

                       Optimise the vehicle fleet
                       Verify and benchmark corporate emissions
                       Develop an energy management strategy
      Council
                       Implement the Karori Recreation Centre solar project
     operations
                       Improve water conservation and efficiency
                       Strengthen research partnerships
                       Update the Carbon Management Policy

                       Enhance forest carbon sinks
      Forestry         Extend pest management
                       Enhance local government forestry partnerships

                       Investigate emissions-reduction options under the proposed extension of the airport runway
      Aviation         Develop an agreement with Wellington International Airport
                       Advocate for climate mitigation in the aviation sector

                       Target areas where most gains can be made
  2020 emissions-      Measure our progress
  reduction target     Increase community ownership, investment and action
                       Advocate for progress beyond Wellington

                                                                                                                    5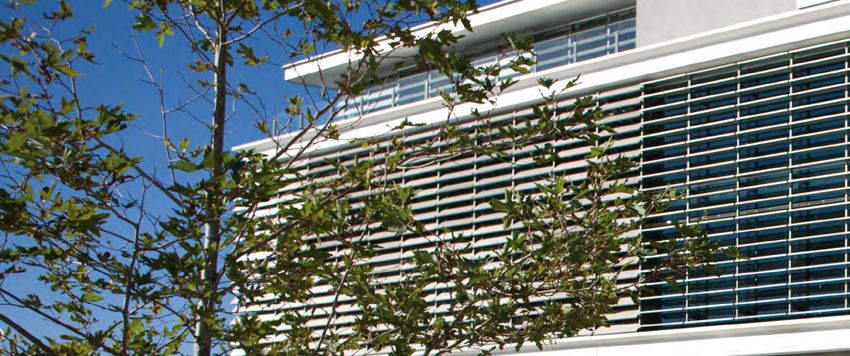
INTRODUCTION
CLIMATE CHANGE: A GLOBAL urban design and land-use planning, guides local economies
and operates closest to the point of production, consumption
AND LOCAL CHALLENGE and climate impacts.
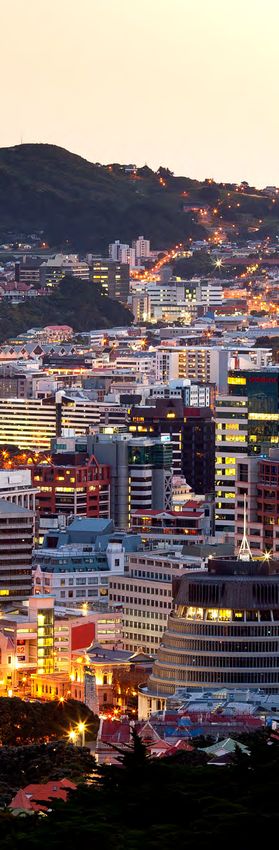
The climate has always shaped Wellington’s way of life Responding to climate change, however, is not just a matter
and helped to define our character. We are world famous of government policy. It is also up to individuals, organisations
for our wind, green spaces, harbour and exposed, and communities to take meaningful and responsible action.
rugged coastline. We all have a part to play in the choices we make
Globally, significant and sustained changes to the climate as producers, consumers and advocates for change.
system are being caused by emissions of greenhouse
gases from human activity. If emissions trends continue,
changes such as higher temperatures, more frequent
extreme weather events and sea-level rise will have RESPONDING TO CLIMATE CHANGE
serious and, in some cases, irreversible impacts on our
environment, health, economy and society. Although Adaptation means preparing for the impacts
countries have agreed on a long-term goal to limit of climate change so we can safeguard the
temperature rises to no higher than 2°C above pre community, environment and economy from
industrial levels, increasing global emissions threaten
likely risks.
to push this goal out of reach. Negotiations between
countries are ongoing and the Intergovernmental Panel Mitigation means avoiding or reducing
on Climate Change will issue its next comprehensive
greenhouse gas emissions or storing
assessment report in 2014.
(sequestering) carbon dioxide in forests
Leadership will be essential to deliver the required change
in global emissions and prepare for the impacts of climate
or geological formations.
change. This includes local government, which shapes
6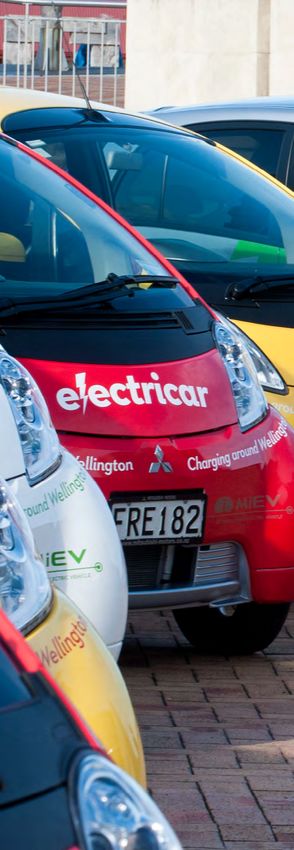
WELLINGTON’S APPROACH TO For the past decade, Wellington City Council has been
committed to reducing the city’s greenhouse gas emissions
CLIMATE CHANGE and planning for the effects of climate change. The Council
Wellington City’s approach to climate change will affect published a Climate Change Action Plan in 2007 and an
how we thrive as a city, demonstrate leadership and update in 2010 that was a category award-winner in the
support our international reputation. Smart actions Ministry for the Environment’s Green Ribbon Awards 2011.
we take will also enhance our quality of life, economic We have set ambitious emissions-reduction targets through
development and resilience. These can: until 2050. These are absolute targets and not linked to
population or economic growth.
help make our city’s environment, economy and
society more adaptable to change This plan builds on the progress made in the broader
context of the city’s Wellington Towards 2040: Smart Capital
promote biodiversity, effective land-use planning
strategy. It extends and improves measures started in 2010,
and improved air and water quality
and integrates more recent initiatives that will boost our
safeguard health effectiveness and improve how we measure progress.
improve housing quality and transport
Two main features of the plan are: more emphasis on
provide secure sources of energy engaging with the public and stakeholders, and active
make our commercial buildings more competitive partnerships on climate change mitigation and adaptation
by being more efficient to 2015 and beyond.
reduce waste and inefficient use of non
renewable resources
provide incentives for technological innovation
generate new business opportunities.
Greenhouse gas emissions-reduction targets for Wellington City and Wellington City Council
2010 2013 2020 2050
BASE YEAR (2009–2010) (2012–2013) (2019–2020) (2049–2050)
Wellington City 2001 (2000–2001) Stabilise (0% increase) -3% -30% -80%
Wellington City Council 2003 (2002–2003) Stabilise (0% increase) NA -40% -80%
7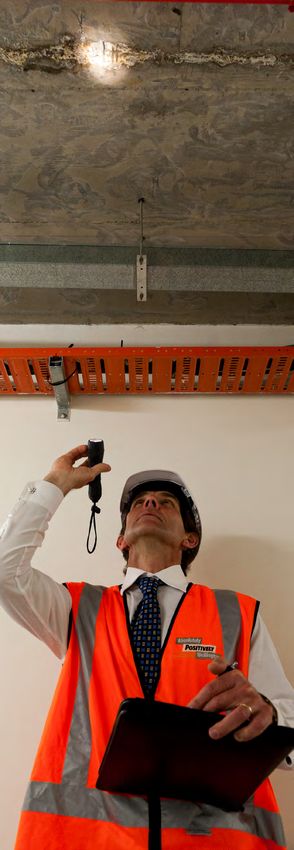
TAILORING SMART CLIMATE ACTION                                         our compact design, extensive public transport
                                                                       network, footpaths and cycleways help to reduce
TO THE SMART CAPITAL                                                   car use and improve travel efficiency in a city with a
The 2013 Climate Change Action Plan is designed to                     growing population and economy
accommodate the city’s geography, climate and economy.                 our local economy is dominated by service industries,
                                                                       creating opportunities for low-emission economic
Wellington can boast having over 200sq m of green space for
                                                                       development and links to clean-tech and knowledge-
every person. As a hilly, coastal city close to the intersection
                                                                       based global markets
of two major tectonic plates, Wellington experiences
considerable seismic activity and intense weather.                     new commercial buildings are reflecting market demand
                                                                       for competitiveness and efficiency as shown by Green
Most residents live within 3km of the sea, and significant             Star ratings
parts of the city’s infrastructure and economy are at risk             the city has world-class universities and institutions
from sea-level rise and tsunamis.                                      engaged in research on mitigating and adapting to
Wellington’s geographic location provides a critical transport         climate change
link between the North and South Islands. It maintains                 improving our resilience to natural events is important to
strong national and international connections through                  our government institutions, businesses and communities.
an international airport and a busy commercial and ferry
                                                                   In the 2010 Nielsen Quality of Life survey (which involves
port. Wellington has an exceptionally high quality of life, as
                                                                   the eight major cities in New Zealand), 82 percent of
reported by its citizens in regular surveys. Wellington was
                                                                   Wellingtonians agreed or strongly agreed that they would
awarded first place in our category in the 2012 International
                                                                   change their lifestyle to help prevent global warming if they
Awards for Liveable Communities.
                                                                   knew it would make a difference. This compares to 76
The city has some important features that support effective        percent for the eight cities as a group.1
climate action. In particular:

    there is access to renewable electricity generation
    within the city and from the national grid                     1
                                                                       See qualityoflifeproject.govt.nz/pdfs/Quality_of_Life_2010.pdf

8
CLIMATE IMPACTS FOR WELLINGTON Sea-level rise is a very important consideration for New
Zealand even though the specific rate is difficult to project.
In July 2013, Sir Peter Gluckman, Chief Science Advisor to While global sea-level has increased on average by about
the Prime Minister, released an overview of the projected 1.7mm per year over the last century, that rate has increased
impacts of climate change for New Zealand. An increase to 3.5mm per year since the early 1990s.3 Wellington
o
of 1 C has been observed since 1910. New Zealand’s Harbour has experienced an average rise in sea-level of
o o
temperature could increase by 0.9 C by 2040 and 2.1 C about 2mm per year over the past 100 years; this includes
by 2090, above the average for 1980–2000. He writes: the contribution from subsidence due to tectonic activity.
“For New Zealand, the resulting impact of changes in The Ministry for the Environment recommends that for
wind patterns, precipitation, and the chemistry of our planning out to 2090–2099, local government should use
oceans can be expected to be at least as significant as a base sea-level rise of 0.5m relative to 1980–1999, but
the changes in temperature itself. Such changes are consider the consequences of a 0.8m increase. Longer-term
not expected to be uniform across New Zealand; there planning should account for further increases of 10mm per
may be pronounced differences between the North and year. 4 A report from the Potsdam Institute concluded that
South Islands and between the East and West coasts, each degree of warming would lead to over 2m of sea-level
and there are also likely to be unequal and important rise in the long term.5
effects on seasonal patterns of rainfall and extreme
weather events.” 2
The impacts of climate change on Wellington over time could
include: 2
Gluckman, P. 2013. New Zealand’s Changing Climate and Oceans: The Impact of Human
Activity and Implications for the Future. Wellington: Office of the Prime Minister’s Science
more frequent extreme storms causing flooding, slips and Advisory Committee.
3
National Oceanographic and Atmospheric Administration. “Global Climate Change Indicators.”
wind damage Accessed in July 2013. See ncdc.noaa.gov/indicators
4
New Zealand Ministry for the Environment. 2008. Coastal Hazards and Climate Change: A Guidance
changing rainfall patterns and increased temperatures Manual for Local Government in New Zealand. Wellington: MfE. Available from mfe.govt.nz/
leading to pressures on water supplies and public health publications/climate/coastal-hazards-climate-change-guidance-manual/coastal-hazards-climate
change-guidance-manual.pdf
sea-level rise leading to increased coastal erosion and 5
Levermann, A., Clark, P., Marzeion, B., Milne, G., Pollard, D., Radic, V., Robinson, A. 2013. The
Multimillennial Sea-Level Commitment of Global Warming. Proceedings of the National Academy
effects on coastal infrastructure. of Sciences (early online edition) [DOI: 10.1073/pnas.1219414110 ].
9NATIONAL CONTEXT FOR CLIMATE In late 2012, the Government announced that it would
not enter into a second commitment period under the
CHANGE MITIGATION Kyoto Protocol, but would instead set a non-binding target
The national context for Wellington City’s climate through to 2020 under the UN Framework Convention
change action continues to evolve. From 2008–2012, on Climate Change. In August 2013, the Government
New Zealand’s target under the Kyoto Protocol was to announced an unconditional emissions-reduction target
reduce net greenhouse gas emissions (including forestry) of 5 percent below 1990 levels by 2020. This is less
to 1990 gross levels (excluding forestry) on average. The ambitious than the conditional pledge of a 10–20 percent
Government expects New Zealand to have complied with reduction initially tabled in the negotiations; however, it
this obligation when international reporting concludes is possible that during further negotiations New Zealand
in 2015. However, national emissions excluding forestry might increase its target ambition.
have increased over 22 percent from 1990–2011, and Wellington’s commitment to climate change action sends
Kyoto compliance has been achieved largely through an important signal. City leadership and partnerships
domestic forestry and purchasing Kyoto emission units across the city and at all levels of government will remain
generated from offshore reductions. critical to meeting Wellington’s ambitious greenhouse gas
The New Zealand Emissions Trading Scheme (NZ ETS), emissions-reduction targets for 2020 and beyond.
which came into force in 2008, is New Zealand’s primary
climate change measure. It covers all six greenhouse
gases under the Kyoto Protocol and all economic sectors
except agriculture (obligations for non-energy agriculture
emissions have been deferred). Wellington City Council and
other entities in the city with obligations must comply with
the NZ ETS. Eligible owners of forest land established after
1989 can opt into the NZ ETS to receive emission units.
1011
FACTS AND FIGURES FOR
WELLINGTON CITY
GENERAL                                                                        STATIONARY ENERGY
                                                                               (eg electricity and heat)
                                                      Land area:
                                                       28,990ha

                  2012:                  2031:
                 202,200                230,614                                                                 1000 households
                                                                                                                    powered from
                                                                                                              Wellington’s landfill
                                                                                                              gas-to-energy plant

                Current and projected population

                                                                                            42%                      77%

                           Total: 1.1 million
                            Per person: 5.8

                                                                                    Share of Wellington’s     Share of renewable
           Tonnes CO2 -e greenhouse gas emissions,                                    emissions from             electricity in
               excluding forestry (2009–2010)                                        stationary energy        New Zealand (2011)
                                                                                       (2009–2010)

TRANSPORT ENERGY
                                                                                      From land transport:
                                                                                        35% (2009–2010)

                                           Share of
                                           Wellington’s
                                           emissions

                                                                                    From aviation:
                                                                                 18% (2009–2010)

                                                                                                                                        70%
Average                                           Breakdown of weekly travel into central Wellington (2013)
number of
motor vehicles                              34%                                            6%
                     1.3                                                 20%                                                                  Share of
per household
                                                                                                                             Other 2%

                                                                33%                                           3%       2%                     workforce
(2006)
Wellington has
                                                                                                                                              located in
the lowest among                                                                                                                              central
New Zealand cities                                                                                                                            city (2006)
                                 Average distance per person travelled from home to work and back per day: 12.2km (2006)

12
FORESTS ADAPTATION
Current rate of
sea-level rise in
Wellington: about
2mm per year
Total sea-level rise in Wellington over
the last 100 years: 200mm
Council pine Council land enrolled Area of Council-
forest registered in Permanent Forest owned reserve
in NZ ETS: Sink Initiative: land: 3500ha
32.3ha 1464ha
Population living within
10% 5m above sea-level
Impact of forestry on Wellington’s emissions:
4% offset (2009–2010)
2013 WELLINGTON RESIDENTS MONITORING SURVEY
Share of Wellingtonians who Perceived proportion
agree or strongly agree of Wellington
businesses taking
Wellington is working at least some action
to reduce its greenhouse to reduce their
gas emissions environmental impact
Wellington is well 17%
prepared to respond
to natural events
77 %
Wellington is taking 36
% Notes: Carbon dioxide equivalent
appropriate action to (CO2-e) includes other greenhouse
prepare for long-term gases besides carbon dioxide.
sea-level rise Wellington City inventory data for
4 3%
2009–2010 are based on best available
information and may be revised.
Data on sea-level rise include
subsidence due to tectonic movement.
13WELLINGTON’S GREENHOUSE
GAS EMISSIONS
Most of Wellington’s greenhouse gas emissions come
from energy used to power homes, commercial buildings
and transport. Industrial production, waste management
and agriculture are relatively minor contributors. Forests
offset about 4 percent of the city’s emissions by removing
carbon dioxide from the atmosphere.
Overall, Wellington’s emissions differ significantly from
the national profile; nationally, nearly half of the emissions
are methane and nitrous oxide from agriculture, and
forests offset nearly 20 percent of emissions.
Wellington City’s most recent inventory of greenhouse
gas emissions was prepared for 2009–2010 using a
methodology developed under the Communities for
Climate Protection Programme. The table and graph on
the next page give an overview of the city’s emissions
profile using the best available data at the time of
publication.6 Excluding forestry, Wellington’s emissions
totalled about 1.1 million tonnes CO 2 -e (carbon dioxide
equivalent) in 2009–2010, which was equivalent to
5.8 tonnes CO 2 -e per person per year.
Based on the best available information at the time of
publication, the city appeared broadly to have tracked well
against the target to stabilise emissions at the 2000–2001
level in 2009–2010. The city’s progress against its targets will
be formally assessed when revised greenhouse gas inventory
data become available from the first quarter of 2014.7
It is worth noting that during 2000–2010, the city’s
population increased by about 20 percent and GDP by
about 29 percent, which suggests some decoupling of
economic growth and greenhouse gas emissions.
6
The methodology for Wellington City’s inventory diverges from the national GHG
inventory in some respects. Due to data limitations, Wellington City’s inventory currently
reports aggregate emissions from both domestic and international transport fuels;
emissions from international transport fuels are reported separately under the national
greenhouse gas inventory and excluded from the national emissions-reduction targets.
Wellington City’s inventory also accounts for all forest carbon stock changes, not just
those associated with land uses covered under the Kyoto Protocol.
7
Methodological differences and data uncertainties may mean that the two current data
sets are not fully comparable and further analysis is needed. The assessment that the
city was broadly on track against its target for 2009–2010 is supported by key drivers
of change: consumption of electricity and transport fuels and emissions from waste.
14Wellington City greenhouse gas inventory 2009–2010
kT CO2-e % OF TOTAL
GROSS EMISSIONS
Stationary energy 475.9 41.6
Transport (excluding aviation) 397.8 34.8
Aviation 199.8 17.5
Industry 39.8 3.5
Waste 17.1 1.5
Agriculture 12.3 1.1
Total gross emissions 1142.6 100.0
Forestry -48.9 -4
Total net emissions 1093.7 NA
Wellington City greenhouse gas inventory, excluding forestry 2009–2010
Natural Electricity
gas
Stationary
energy
Coal
Diesel
LPG
Transport
(excluding
aviation)
Stationary energy
Transport (excluding aviation) Petrol
Aviation
Industry
Waste
Agriculture 15resilient communities – Wellington’s communities,
OVERVIEW OF THE CLIMATE government agencies and businesses will be well
CHANGE ACTION PLAN prepared for the impacts of climate change
The 2013 Climate Change Action Plan builds on the approach centre of excellence – the Wellington region
taken in 2010. Actions are grouped into seven areas: becomes a centre of excellence for urban planning,
resilience and ecological sustainability, through
adaptation, buildings and energy, land transport and shipping,
partnerships with research institutions and support
Council operations, forestry, waste and aviation.
for clean technology development
We have adapted the 2013 plan to be consistent with renewable energy – Wellington generates more
the Council’s strategy Wellington Towards 2040: Smart renewable electricity than we need, with the surplus
Capital. Among other goals, this involves strengthening the going to the rest of the country, and supports broader
transition to a low-carbon city, achieving high standards fuel switching to renewable energy (eg for transport)
of performance against environmental measures, and growing sustainable transport – Wellington makes
integrating ‘green’ innovation into our economy. the most of its compact form and high use of public
transport by concentrating development around existing
In order to deliver on this strategy, a cross-Council
centres. More people are walking, cycling and using
programme – Our Living City – was set up to work on
public transport, and making fewer trips by car
projects that grow and enhance our natural capital,
early adopter of electric vehicles – Wellington
transform our economy, reduce our impact on the
encourages use of electric vehicles
environment and show leadership. The Climate Change
green office hub – Wellington’s CBD is recognised as
Action Plan now falls within the scope of Our Living City
a hub for sustainable, energy-efficient commercial
so it can be integrated with other Council projects.
buildings and green building design innovation
In 2010, we identified high-level objectives which remain warm, efficient homes – Wellington’s older housing stock
relevant to Wellington Towards 2040: Smart Capital. These is upgraded to create healthier living environments and
have been updated with minor modifications: more energy-efficient homes
16a city of forests – Wellington continues to expand
forest networks on public and private land through
natural regeneration of reserves and rural land,
plantation forestry, planting in road reserves and tree
planting along main streets
resources from waste – Wellington City and our
regional partners develop new approaches to waste
management that result in commercially-viable ways
of reducing the amount of waste going to landfills and
increasing the use of methane to produce energy
carbon neutral vision – Wellington City aspires to
become carbon neutral.
The 2013 Climate Change Action Plan reflects these
longer-term objectives for the city but focuses on
measures to be achieved from 2013–2015. These
measures are supported by budget allocations in
the Long-term Plan 2012–2022 and the Annual Plan
2013–2014.
During 2013–2014, we will start engaging with the public
to help us plan how the city will achieve its 2020 target
and broader goals for reducing greenhouse gas emissions,
and how to address city-wide planning in preparation
for sea-level rise. The outcome will form the basis of the
2015 Climate Change Action Plan and be reflected in
decisions under the Long-term Plan 2015–2025.
1718
ACTION AREA 1: ADAPTING TO A CHANGING CLIMATE

                                                     Our work on adapting to climate change has highlighted the
EXTREME WEATHER EVENTS                               importance of holistic assessment of the likely impacts and
                                                     including other major risks or hazards faced by the city –
Climate change is impacting on the conditions        such as earthquakes, tsunamis and storms. Our involvement
underlying extreme weather events, with more         in resilience programmes with UN agencies, and leadership
                                                     by the city’s research institutions on resilience planning, puts
frequent, higher-intensity storms and periods        us in a strong position to work collaboratively with a wide
of drought expected as temperatures increase.        range of organisations.
The combination of such events with sea-level        The Council has been recognised for its leading work in this
rise will pose significant challenges to the city.   area, particularly on sea-level rise. The Council was on the
                                                     organising committee for the New Zealand Climate Change
Our resilience has been tested by the                Centre’s annual conference in May 2012 on sea-level rise,
experience of extreme weather events over            and is a member of the steering committee for the Victoria
the past year.                                       University series of Climate Change Roundtables. However,
                                                     much work remains to be done.
The summer of 2012–2013 was the driest
                                                     Now is the right time for us to begin considering climate
in over 90 years in Wellington. The pressure         change adaptation in all that we do – as a city and as a
placed on regional water supplies, stormwater        Council. It is not just an issue for the distant future; there will
and sewerage systems was magnified because           also be significant short-term impacts. It is not just an issue
                                                     for city planning; businesses also need to consider how
the city’s bulk supply reservoirs were being
                                                     climate change will impact on their business models, supply
earthquake strengthened. The estimated cost          chains and customer demand.
of the drought to the country was $1–2 billion.      We have an array of choices in how we respond. For
In June 2013, the city was hit by a storm            example, in the case of sea-level rise, we can accommodate
                                                     the changes, enhance natural or engineered defences,
comparable to the 1968 Wahine storm, with            or retreat and focus longer-term development in less
significant damage to roads, seawalls and            vulnerable parts of the city.
houses. The cost to the city was initially           Planning and decision-making can take some time, so
estimated at $4 million.                             acting early allows time to explore the options and respond
                                                     appropriately to improve our resilience. We have a vision
The winter of 2013 was the warmest in                of becoming a true international centre of excellence in
Wellington since records began in the 1860s,         resilience planning.
with temperatures 1.3 oC above average.

                                                                                                                     19
PROGRESS: 2010–2012 COLLABORATION
We have worked closely on climate change adaptation
SEA-LEVEL-RISE IMPACT ASSESSMENT with other local authorities, particularly on coastal issues,
We have carried out scenario mapping and modelling, and and will strengthen links with Dunedin City Council on
completed an initial assessment of the likely impacts and coastal erosion and groundwater salination. We are
response options for sea-level rise. Areas of the city most learning from the development of coastal hazard zoning
likely to be affected are low-lying and often on reclaimed on the Kapiti Coast. A number of councils have sought our
land, including the CBD, Kilbirnie, Rongotai, State Highway expertise, including Auckland, Lower Hutt, Nelson and
2, Miramar and Makara Beach. Tasman, and we have also provided advice to Samoa (via
a referral by Local Government New Zealand).
Research commissioned in collaboration with Greater
Wellington Regional Council has shown that Wellington has The Council has worked with researchers at Victoria
the highest rate of relative sea-level rise in New Zealand, as University in the Psychology Department (which surveyed
the land is also subsiding. Further research has modelled public perceptions of sea-level rise), the Climate Change
storm-surge and wave run-up throughout the region, which Research Institute (which held workshops for invited
can be combined with sea-level scenarios to identify the local government participants in Nelson and Tasman
most at-risk areas. districts), and the Institute of Governance and Policy
Studies (which runs a regular series of roundtable
RESILIENCE AND ASSET MANAGEMENT discussions on climate change).
The vulnerability of Council assets to the effects of climate We have assisted the National Institute of Water and
change has been assessed, and comprehensive guidance Atmospheric Research (NIWA) in the development of its
for including climate change considerations in asset Urban Impacts toolbox for local government adaptation.
management plans has been provided to our asset managers. Collaboration with central government has included
Guidelines to encourage low-impact urban design are being giving presentations on climate change adaptation to the
developed and a new guide to water-sensitive urban design Ministry for the Environment and the Treasury’s National
will improve stormwater management through the use of Infrastructure Unit, and input into the climate change
natural drainage and planting. We are continuing to assess section of the Environmental Domain Plan by Statistics
the potential for a green roof on the Central Library. New Zealand.
In 2012, Wellington was selected as one of only 10
international cities for the four-year UN-Habitat City
Resilience Profiling Programme. This involves developing
measures of urban resilience and establishing links between
climate change adaptation and natural hazards. Wellington
has also been selected by an international scientific
committee8 as a centre of excellence in community
resilience research. This will provide opportunities for 8
Integrated Research on Disaster Risk (IRDR) is a decade-long research programme
scientific work in the Asia-Pacific region and put the city co-sponsored by the International Council for Science (ICSU), the International Social
Science Council (ISSC), and the United Nations International Strategy for Disaster
on the map for research into community resilience. Reduction (UNISDR).
20PRIORITIES: 2013–2015 reinforced by the recent experience with damage
from landslides, storms and the July 2013 Wellington
earthquakes, including damage to coastal margins at the
RESEARCH CLIMATE CHANGE
port and on the south coast.
IMPACTS IN WELLINGTON
The science of global warming is clear; however, some of ENGAGE WITH THE PUBLIC ON RISK
the impacts from climate change are not. For example, with
AND RESILIENCE
sea-level rise, the potential for damage from storm surges,
rising water tables and groundwater salination should be From 2014 we will engage on risk and resilience with
considered, but there are gaps in our knowledge regarding citizens and stakeholders. Using a mix of panel sessions,
these effects. community displays and discussions, design competitions
etc, we will gather ideas from communities which can
The Council will continue to work with research institutes be shared and will contribute to our asset management
on projects related to climate change adaptation and investment, review of the District Plan, and the Wellington
resilience. We are involved in a four-year project with NIWA spatial plan. We aim to:
and Landcare Research, with funding from the Ministry of
increase common understanding of the risks we face
Science and Innovation, on the impacts and implications of
climate change. clarify what decisions will be required, and when
encourage community discussion and problem-solving
As a City Council, we also need to better understand
the likely impact of the planning decisions we take (or guide decision-making, with broad public support,
the implications if we choose not to make decisions and on urban planning and economic development.
continue with business as usual).
IMPLEMENT WATER-SENSITIVE
INTEGRATE ADAPTATION INTO URBAN DESIGN
RESILIENCE PLANNING Water-sensitive urban design will be a big change in how
Planning for climate change adaptation must be considered we manage water and urban development. There is also
alongside other natural hazards. For example, a higher potential for significant cost savings.
water table caused by rising seas may increase the
This approach to urban design will reduce rainwater
potential for liquefaction in some areas.
inundation of the city’s drainage network, flooding and
It is also more efficient and effective to engage with sewer overflows to the sea. In turn it will improve sea
citizens on wider issues of risk and resilience. When talking water quality, reduce the amount of energy used for water
with a community about earthquake preparedness, we management, bring more native flora and fauna into urban
can include discussions on climate change adaptation and areas and improve quality of life for Wellingtonians.
response options. Preparation for tsunami hazard is also
Water-sensitive urban design principles will continue to
relevant to coping with sea-level rise.
be implemented throughout the city. One example is the
While the 2010 plan advocated a city climate change National War Memorial Park under construction, which
adaptation strategy, the Council is supporting a more will incorporate tree pits and rain gardens to hold and
holistic approach to city risk management. This is filter stormwater.
21ACTION AREA 2: BUILDINGS AND ENERGY
Stationary energy (ie energy consumption that excludes PROGRESS: 2010–2012
energy used for transport) accounts for over 40 percent
of Wellington’s greenhouse gas emissions. These mainly COUNCIL-LED INITIATIVES
come from burning fossil fuels (eg coal, natural gas and
Home Energy Saver programme
LPG) for electricity generation, heating and industrial
With our service provider Home&dry, we have completed free
production. In Wellington, most of this energy is used to
home energy assessments for over 1200 households since
power homes and buildings.
August 2011. As part of the programme, we have installed
In the Climate Change Action Plan, the buildings and 1400 energy-efficient light bulbs, 400 efficient showerheads
energy sector has three main components: and 370 draught-stoppers for doors and windows.
emissions from energy used in residential buildings Warm Up Wellington
emissions from energy used in commercial and We have worked with the Energy Efficiency and
industrial buildings Conservation Authority (EECA), Capital & Coast District
Health Board and other funding partners to insulate
large- and small-scale energy generation in Wellington.
over 560 low-income homes with our service providers
Wellington has around 70,000 rateable residential units, Eco Insulation and Sustainability Trust.
which include single family homes, apartments and Business Energy Saver programme
townhouses. The city also has several thousand commercial, In 2011, the Council entered into a funding partnership
institutional and industrial buildings – from office buildings, with EECA as part of their Energising Business
municipal facilities, schools, universities and hospitals to programme. This involved supporting businesses to
corner dairies. undertake energy assessments and energy retrofits. There
was very little uptake of the programme in Wellington,
On the energy-generation side, Wellington is proud to be which reflects a national trend. We have since focused our
home to one of the world’s most productive wind farms business partnerships in other areas, as discussed below.
and a new commercial wind farm under construction. We
Encouraging renewable energy
also have potential for more solar and marine generation.
We have initiated several projects to encourage and promote
While New Zealand typically generates over 70 percent of its
the uptake of renewable energy technology, including:
electricity from renewable sources (77 percent in 2011), the
rest comes from fossil fuels. The electricity that Wellington new rules in the District Plan to exempt solar panels
draws from the national grid reflects the national power from requiring a resource consent (which applies to
mix, and the associated emissions are counted in our city’s most installations)
greenhouse gas inventory. new rules in the District Plan to allow small-scale wind
turbines of less than 5kW in residential areas, providing
The buildings sector offers significant potential for a they comply with noise and height requirements
reduction in emissions. The main options in Wellington are
creating a solar map that allows residents, businesses
to increase renewable generation and improve the energy
and other users to calculate the solar energy potential
efficiency of households and businesses.
of their rooftops.
2223
WHAT OTHERS ARE DOING The 26-turbine project in Ohariu Valley will generate up
to 59MW. Unlike Project West Wind, which feeds into the
Green buildings
national grid, the Mill Creek wind farm will feed directly
Wellington has eight Green Star-rated commercial into the Wellington grid through the Otari sub-station.
buildings and three offices that have received Green Star
ratings for office fit-outs. The city is home to the first ever On a smaller scale, the Brooklyn wind turbine operates
Green Star-rated building in New Zealand, the first 6-Star with a 0.225MW capacity (enough to power about 80
rated office fit-out and the first 5-Star-rated building from homes) and the Southern Landfill gas generator has
a building renovation. Since 2007, nearly 95 percent of the capacity of 1MW.
net leasable area of newly-constructed office buildings of Low-carbon technologies
A-grade and above has been Green Star-rated.9 Business owners in Wellington are starting to invest in
The city’s universities are also leading the way with low-carbon technologies. Examples include:
innovative building designs. Victoria University’s Alan food wholesaler Moore Wilson’s has installed a 25kW
MacDiarmid Building won a gold award for excellence solar array to help power its operations
for its heating and ventilation system, and Massey the Wharewaka building on Wellington Waterfront uses
University’s new, award-winning College of Creative a seawater heat pump to heat the building.
Arts building, Te Ara Hihiko, uses world-leading seismic
engineering technology and passive heating and cooling. Marine energy testing centre
The Heavy Engineering Research Association (HERA)
Warm Up New Zealand is taking the lead on setting up a marine energy testing
EECA’s Warm Up New Zealand: Heat Smart programme centre, which would test devices for potential energy
started in July 2009. Up until June 2013 more than 12,000 generation off the Wellington coastline.
Wellington homes had insulation installed or topped up and
The Council provided a grant for HERA to develop a business
around 2160 homes received a clean-heat retrofit.
case that will be submitted to the Government later this
Including the substantial health benefits from insulating year. HERA is working with international companies and
homes, the benefit/cost ratio of Warm Up New Zealand organisations for sponsorship and to identify potential
has been assessed at 3.6.10 customers for the centre (should it be implemented).
Renewable generation
Wellington already has a significant renewable energy
resource with Meridian Energy’s Project West Wind.
Located 7km from the city centre, this 62-turbine, 142MW
wind farm last year produced 475GWh of electricity –
enough to power 71,000 average homes (roughly covering
Wellington’s residential demand). Prins, H. 2013. The Attributes of Wellington’s Green Buildings: Phase One. Report from the School
9
of Architecture, Victoria University of Wellington to Wellington City Council. Wellington.
10
Grimes, A. et al. 2012. Costs Benefit Analysis of the Warm Up New Zealand: Heat Smart
Meridian Energy has also commissioned work on the Mill Programme. Report prepared for the Ministry of Economic Development. Available from: med.govt.
nz/sectors-industries/energy/pdf-docs-library/energy-and-the-environment/energy-efficiency/nzif
Creek wind farm. cba-report.pdf/view
24PRIORITIES: 2013–2015 EXTEND HOME ENERGY SAVER
The Home Energy Saver programme will continue through
IMPLEMENT THE SMART ENERGY to 2015 with some refinements. We are working with
CAPITAL FUND banks, energy companies, energy specialists and social
The Council has allocated $250,000 per year from enterprises to explore a more integrated approach to the
2013–2015 to the Smart Energy Capital fund to catalyse home assessments, combining energy and water efficiency,
energy projects in Wellington. earthquake resilience and potential for renewable energy
generation such as solar power.
By partnering with organisations, we will co-fund projects
that can be implemented at a significant scale, focus
EXTEND WARM UP WELLINGTON
on reducing energy consumption and distributed energy
generation, and result in benefits such as improved health We are continuing to work closely with EECA, Capital &
or economic development. We have invited interested Coast District Health Board and the Sustainability Trust as
parties to submit ‘expressions of innovation’. our service provider, so that more low-income homes can
be insulated under the Warm Up scheme.
The first two projects are:
Warm Up Wellington – enabling insulation of 250 DEVELOP A RENTAL HOUSING WARRANT
low-income homes in the first year by increasing the OF FITNESS
Council’s contribution to $100,000, thereby leveraging
Work is under way with our partners in local government,
funding of $650,000 from project partners (see below).
research institutions and the health sector to develop a
Funding for future years will be confirmed
voluntary warrant of fitness tool for rental housing. If the tool
a three-year partnership with Genesis Energy’s is developed, we would run a pilot programme for stand
Schoolgen programme to install solar photovoltaic (PV) alone Council housing and responsible landlords.
panels in 16 Wellington schools and provide energy
management guidance.
ENCOURAGE UPTAKE OF SOLAR ENERGY
IMPLEMENT NABERS NZ TM (ENERGY Banks, energy companies and solar panel installers are
setting up new financial products to make solar technology
EFFICIENCY) BENCHMARKING
more affordable. We are working with the various partners to
We are working with EECA, commercial property owners and see how we can help to encourage uptake of solar energy.
tenants to encourage uptake of the NABERS NZ TM energy
benchmarking tool, which helps property owners and tenants
assess and improve their building’s energy performance.
25ACTION AREA 3: LAND TRANSPORT AND SHIPPING
Greenhouse gas emissions are generated by the use PROGRESS: 2010–2012
of fossil fuels such as diesel, petrol and LPG for road
transport and shipping. Emissions can be brought down by PUBLIC TRANSPORT, WALKING AND CYCLING
reducing traffic congestion and the number of car journeys To help speed up bus travelling times and reduce
(eg by carpooling and increasing use of public transport congestion, more bus lanes have been installed along
as well as walking and cycling), improving how we drive, the Golden Mile and on other main bus routes. Real-time
using more fuel-efficient vehicles, and switching to low- information screens also help to provide a more reliable
carbon fuels such as renewable electricity and biofuels. service. More bus shelters have also been installed. Cycle
Transport is one of the Council’s strategic priorities, lanes have been extended and cycle boxes installed in parts
of the city.
with funding made available for projects on walking,
cycling and public transport as well as urban transport The Council supports targets for increased public transport
planning. Encouraging people to use less fuel not only use as identified in the Regional Land Transport Strategy,
reduces the city’s greenhouse gas emissions but also and has partnered with Greater Wellington Regional
improves people’s health and safety, reduces noise and Council and the New Zealand Transport Agency (NZTA) in
vehicle operating costs and makes the city less reliant the development and implementation of the Ngauranga to
on oil supply. We also work with regional and central Airport corridor plan. We are involved in the development
government to prioritise, fund and implement major and delivery of the Regional Land Transport Programme.
transport projects.
COMPACT CITY DEVELOPMENT
New Zealand has 103 registered electric cars (as of June
The urban growth corridor continues to consolidate, and
2013); 23 are in the Wellington region. The region’s rate
aligns with public transport routes. Recent work to improve
of ownership of electric cars and motorcycles is about
infrastructure, redesign roads and implement policies that
twice the national average. Use of electric motorcycles,
encourage more mixed-use and higher-density development
scooters and bicycles has grown significantly in the city
has occurred in the central city, Kilbirnie, Johnsonville
in recent years.
and Miramar. The city also benefits from improvements
to broadband infrastructure, which gives more people
an opportunity to work from home, easing pressure on
transport infrastructure.
In 2012, an initial progress review under the 2006 Urban
Development Strategy found less greenfield and low-density
development than predicted (22 percent compared to a
projected 34 percent), more high-density and apartment
growth (41 percent compared to a projected 36 percent),
and more medium-density infill (37 percent compared to a
26projected 30 percent). This indicates a changing pattern
of settlement in Wellington and emphasises the growing
demand to live near convenient urban centres. In turn
this encourages more people to walk and cycle, and
reduces car dependency and greenhouse gas emissions.
NEW FUELS AND TRANSPORT
TECHNOLOGY
We led a pilot project with business partners to trial
eight Mitsubishi i-MiEV electric cars. Our partners
included New Zealand Post, The Wellington Company
and Meridian Energy, and Z Energy installed an electric
vehicle charging post. The Council continues to run one
pure electric car as part of its vehicle fleet.
EECA assisted with monitoring and analysis of vehicle
use, including a survey of users showing overwhelming
support. We also worked with EECA and others to
develop an online tool for comparing the costs of running
electric vehicles and petrol- or diesel-powered vehicles.
The Council ran a successful electric vehicle display
outside Te Papa in June 2012, featuring a range of
electric cars, motorcycles, scooters and bicycles.
We have also tested biofuels in some of our
fleet vehicles. We are monitoring progress in the
development of more advanced biofuels technologies.
FINANCIAL MECHANISMS AND
GOVERNMENT STANDARDS
The Council has advocated to regional and central
government for more efficient transport operations,
including improved infrastructure for all modes, higher
fuel-efficiency standards, electric vehicles, ethical
biofuels, investigating road-pricing regulations and
investment in public transport networks.
2728
PRIORITIES: 2013–2015                                             The Council is working with Victoria University and the New
                                                                  Zealand Centre for Sustainable Cities to assess the benefits
IMPROVE PUBLIC TRANSPORT AND ROAD                                 and costs of trends in housing demand towards centres
NETWORKS AND ENCOURAGE WALKING                                    which offer more compact, mixed land use and better access
AND CYCLING                                                       to amenities, goods and services.

We will review and update the Wellington Transport Strategy       Consistent with the ‘connected city’ goal of Wellington
to reflect the city’s desired outcomes for transport, land use    Towards 2040: Smart Capital, the Council will also continue
and spatial planning.                                             to assess opportunities for improved telecommunications
                                                                  technologies and infrastructure to reduce travel demand.
City Councillors have requested an emphasis on travel
demand management, emergency and freight priority,
                                                                  PROMOTE EFFICIENT VEHICLE TECHNOLOGY
better facilities for walking and cycling, and improved public
                                                                  AND LOW-CARBON FUELS
transport to provide real transport choices for more people.
                                                                  Our support of innovation in vehicle and fuel technologies will
The Council will also identify opportunities to enhance           continue. This includes encouraging more businesses to add
walking, cycling and public transport alongside Roads of          electric vehicles and bicycles to their fleets, and assessing
National Significance projects within Wellington.                 requirements for electric vehicle-charging infrastructure.
We will collaborate regionally on continued improvements          As part of this, we are working with stakeholders to set up
to public transport resulting from the Public Transport Spine     a consortium of fleet operators to purchase electric vehicles
Study. This study, commissioned jointly by Wellington City        in bulk. With combined buying power, the consortium would
Council, Greater Wellington Regional Council and NZTA,            aim to reduce capital or lease costs for electric vehicles to
assesses possible future public transport options for             make them more affordable. The feasibility of this project is
Wellington, including bus priority, bus rapid transit and light   being assessed.
rail. The study was completed in June 2013 and released for
public consultation.                                              We will also work with Centreport on options for reducing
                                                                  greenhouse gas emissions from shipping through efficiency
Consistent with the Ngauranga to Airport Corridor Plan,           improvements and fuel switching.
construction of the Basin Reserve bridge is planned within
this period. The bridge is seen as a significant opportunity
to ease congestion and improve public transport to the
southern and eastern suburbs.

SUPPORT COMPACT CITY DEVELOPMENT
The Council will continue to support compact development
in the city, which can reduce travel demand. This will be
addressed in the updated Wellington Transport Strategy, the
Urban Development Strategy and review of the District Plan.

                                                                                                                              29
You can also read