Shipbuilding Uncertainty and consolidation in the shipbuilding industry
←
→
Page content transcription
If your browser does not render page correctly, please read the page content below
Shipbuilding

Uncertainty and
consolidation in the
shipbuilding industry
In 2019, newbuilding orders were placed at
a monthly rate of about 5 to 6 million tons
deadweight, similar to that which prevailed in
the second half of 2018, compared to about
10 million tons deadweight in the first half of
2018. The reduced pace of ordering had several
causes. Firstly, the widening disparity between
newbuilding prices and earnings resulting from
price increases that prevailed in 2017 and
2018. Secondly, growing uncertainty within
the shipping industry as it prepared for the
introduction of the global 0.5% sulphur cap on
marine fuels. Thirdly, geopolitical instability and
fear of a further escalation in the trade dispute
between China and USA. Persistent financing
challenges and the difficulty to raise equity or
obtain long term employment in a world lacking
visibility constituted another cause, along with
nagging questions concerning the shipping
industry’s capability to ever generate profits.

MSC GRANDIOSA
Delivered by French shipbuilder Chantiers de l’Atlantique to MSC on 31
October 2019. GT 181544 - Loa 331 m – Beam 43 m – Height 67 m - 6634
pax – 1704 crew. 15th cruiseship built and delivered by the yard for MSC.

Photo: B.Biger -Chantiers de l’Atlantique
50
SHIPBUILDING SHIPBUILDING
KEY POINTS OF 2019 KEY POINTS OF 2019
0
2003 2004 2005 2006 2007 2008 2009 2010 2011 2012 2013 2014 2015 2016 2017 2018 2019
Deliveries vs demolitions Fleet evolution
Deliveries vs. Demolitions Fleet KEY POINTS OF 2019 Summary 2018 2019
Million
Million dwt
dwt Million
Million dwt
Ships 1,272 1,028
Orders
200 2,000 m dwt 93.8 73.2
In consequence, newbuilding orders declined significantly from 93.8 million
180
1,800 tons deadweight (1272 ships) in 2018 to 73.2 million tons deadweight (1028 Ships 1,151 1,266
160 Deliveries
ships) in 2019. Demand for bulkers, container carriers and special ships
140 1,600 m dwt 79.2 97.6
followed this global downward trend and receded sharply. However, demand
120
for tankers increased substantially thanks to a much better freight market, Ships 3,024 2,786
1,400 Orderbook
100
especially during the second half of the year. It is always interesting to note m dwt 225.7 201.2
80 1,200 how quickly the shipping market commits to huge investments that will last a Ships 37,588 38,449
60
1,000
generation, based on a temporary change of sentiment in the freight market. Active Fleet
40 m dwt 1,852.6 1,933.8
In spite of lower global demand, newbuilding prices hardly diminished (by
20 800 Ships 8.0% 7.2%
about 5%), with yards considering prices to be already depressed enough given Orderbook/Active Fleet
0
600 increased building costs driven by higher steel prices, new regulations and m dwt 12.2% 10.4%
-20
renewed pressure from marine equipment suppliers that they had to contend
-40 400
with. Prices softened less in the tanker segment and more in the bulker and
-60
200 container carrier segments.
-80
The three Asian shipbuilding giants, representing more than 95% of the global Orderbook 2018 2019
-100 0
2003 2004 2005 2006 2007 2008 2009 2010 2011 2012 2013 2014 2015 2016 2017 2018 2019
orderbook by deadweight, continued to fight fiercely in a poor market. In Market share 43.0% 45.4%
2019, China improved its existing top position with a further increase to 45.4%
China Ships 1309 1206
of market share. In second place, Korea maintained its market share at 28.1%,
Deliveries Demolitions Fleet Evolution while Japan’s market share in third place slipped back to 22 %. The "rest of m dwt 97.1 91.4
the world" (RoW) and Europe registered a 2.6% and 1.9% share of the global Market share 27.8% 28.1%
market, respectively.
Korea Ships 460 483
Orders After having declined in 2018 to 79.2 million deadweight as a result of the m dwt 62.7 56.6
Million dwt
reduction in newbuilding orders in 2016 (32.6m dwt), newbuilding deliveries
Market share 24.2% 22.0%
rebounded in 2019 to 97.6 million deadweight, reflecting the dynamism in
Orders
300 newbuilding orders seen in 2017 and 2018 (79m dwt and 93.8m dwt). As a Japan Ships 741 625
consequence of the imbalance between deliveries and newbuilding orders, m dwt 54.9 44.1
Million dwt
the global orderbook decreased from 225.7 million deadweight end of 2018
250 Market share 1.6% 1.9%
to 201.2 million deadweight end of 2019. Meanwhile, the world fleet has
continued to increase uninterrupted since 1993, growing in 2019 from 1,852 Europe Ships 288 285
200
million deadweight (37,588 ships) to 1,934 million deadweight (38,449 ships). m dwt 3.6 3.9
If shipowners shifted away from shipbuilders last year, the second-hand market Market share 3.3% 2.6%
150
followed the same trend as 2018 in respect of deadweight exchanged, with 146.6 ROW Ships 226 187
million deadweight in sales in 2019 versus 146.2 million deadweight in 2018.
m dwt 7.4 5.2
Sales slightly decreased in term of number of ships sold (2,780 vs 2,883) however.
100
50
2018 2019
0
GT Dwt N° Ships GT Dwt N° Ships
2003 2004 2005 2006 2007 2008 2009 2010 2011 2012 2013 2014 2015 2016 2017 2018 2019
Market Sales 93,350,590 146,224,032 2,883 92,295,104 146,626,204 2,780
Bulk Tanker Containers Others
Demolition Sales 12,044,517 20,914,799 226 3,720,014 5,692,169 96
NB Resales 10,603,026 16,828,220 166 8,833,669 14,344,794 163
Deliveries vs. Demolitions Fleet
Million dwt Million dwt
200 2,000
180
1,800
160
140 1,600
120
6 1,400
BRS GROUP - Annual review 2020 BRS GROUP - Annual review 2020 7
100
80 1,200
SHIPBUILDING SHIPBUILDING
WORLD ECONOMY, MARITIME TRADE AND FREIGHT RATES WORLD ECONOMY, MARITIME TRADE AND FREIGHT RATES
A two-tier market developed in the last quarter of 2019
WORLD ECONOMY, MARITIME Global Trade and World GDP & Active Fleet Growth Tanker
Global trade and world GDP & active fleet growth between scrubber-fitted and non-scrubber fitted tankers as
TRADE AND FREIGHT RATES In the clean segment, the Baltic Exchange Clean Tanker Index (BCTI) began
the spread between VLSFO and HSFO prices widened (see
12% below). Whether it will last beyond the first months of 2020
10.2%
9.3%
2019 at 666 and ended at 958, and averaged 607 over the year, compared remains to be seen.
with 579 in 2018.
World Economy 7.1%
9.8%
8%
6.5% Average 1-year Time Charter rates were as follows:
Global economic growth slipped back to 3.2% in 2019 5.4%
Container
against 3.6% in 2018 according to the IMF. This was the 4.2%
3.9%
4.1% 4.2% 4.4% • MR2.........: $13,703 in 2018 and $14,439 in 2019
3.6% 3.6% 3.4% 3.6%
slowest pace since the financial crisis of 2009. Amongst 4%
• LR1..........: $13,326 in 2018 and $16,072 in 2019
4.3%
3.5% 3.5% 3.4% 3.5% 3.7% 3.8%
The Alphaliner Charter Index grew by 44% in 2019, however
the reasons given by the IMF were: the uncertainties linked 3.4% 3.3% 3.2% 3.0% 2.7% 2.8%
3.2%
• LR1..........: $14,221 in 2018 and $20,311 in 2019
2.2% this healthy growth was not broad-based and larger ships
to Brexit, the imposition of sanctions on a growing list of 1.7%
0% During 2019, 1-year Time Charter rates fluctuated within the following bands: outperformed smaller sizes. 4,000 teu and larger performed
countries and trade tensions between the world’s two -0.1%
largest economic powers: China and the United States, which much better than sub 4,000 teu, while the 1,000 teu sector
• MR2........: between $13,750 and $16,000 per day
led to an increase in customs tariffs. All told, this damaged • LR1.........: between $15,000 and $18,000 per day was flat.
-4%
-4.1%
the confidence of companies and their capacity to invest. • LR1.........: between $18,000 and $26,000 per day IMO 2020 will significantly impact carriers’ operating costs.
Unfortunately, this had a negative impact on global trade In the crude segment, the Baltic Exchange Dirty Tanker Index (BDTI) started the Only 10% of the fleet in teu terms is fitted with scrubbers
-8%
and maritime transportation: seaborne trade growth slid year at 1009 and ended at 1597, with an overall average of 855 in 2019 versus and this ratio is largely biased in favour of the largest ships
2009 2010 2011 2012 2013 2014 2015 2016 2017 2018 2019
from 2.7% in 2018 to 1.7% in 2019. 2009 2010 2011 2012 2013 2014 2015 2016 2017 2018 2019
798 in 2018. (see below). But the scrubber retrofitting wave, which took
World
World GDP
GDP Seaborne
SeaborneTrade
Trade World
WorldActive
ActiveFleet
FleetGrowth
Growth Average Time Charter rates were: more than one million teu capacity out of service at end-
Maritime Trade 2019 countered to some extent the negative effects from
• Aframax: $14,395 in 2018 and $20,694 in 2019
the reduction in seaborne transportation growth.
Dry bulk trade growth dropped to 1.3% in 2019, in Maritime Trade Growth • Suezmax: $16,372 in 2018 and $26,356 in 2019
contrast to 3.9% in 2017 and 2.6% in 2018. Maritime trade growth • VLCC....... : $22,186 in 2018 and $34,856 in 2019
The deceleration in tanker trade growth was stopped as 16%
During 2019, 1-year Time Charter rates fluctuated within the following bands:
it accelerated slightly in 2019 to 0.8% from 0.6% in 2018.
However, growth remained significantly lower than over 14%
• Aframax: between $17,500 and $26,000 per day
12.2%
2016 and 2017 when it hit 4.0% and 2.7%, respectively. Alphaliner
12% Charter Index since 2010 • Suezmax: between $22,000 and $40,000 per day
10.7%
• VLCC....... : between $28,000 and $60,000 per day
Finally, container throughput growth fell to 2.3% in 2019, 10%
11.3%
down from 5.5% in 2017 and 4.1% in 2018. Time Charter rates for VLCCs started the year at $31,000, dropped to a low of
8%
120 $28,000 at end-February before ending the year at $48,000.
5.8%
Freight Rates 6%
100
5.5% 5.5%
5.2% 5% 4.3%
5.5%
The tanker market, especially the crude oil tanker segment benefited from the wave
4.3% 3.2% 3.9% 4.1%
80 of scrubber retrofitting, which took more than 30 million deadweight capacity out
Dry bulk 4%
4.7% 4.7% 4% 2.6%
60 1.8%
2.3% of service at the end of 2019. The market was also subject to several jolts in the
2%
2.1% 2.7% 0.6% 1.3% wake of the attacks carried out on tankers in the Gulf of Oman during May and
We all remember that 2016 was an extremely difficult 40 1.4%
0%
0.8% June and the drone attacks on two major Saudi oil installations in September. But
year in which the Baltic Exchange Dry Index (BDI) logged 20 0.1% -1% 0.2%
-1.7% the main shock came from the sudden move from US administration to impose
a record low of 290, the lowest since it started in 1985. -2%
0 sanctions on Chinese tanker owner, COSCO’s Dalian entity, which propelled rates
On the other hand 2019 was marked by the largest drop 2010 2011 2012 2013 2014 2015 2016 2017 2018 2019
2010 2011 2012 2013 2014 2015 2016 2017 to stratospheric six digits levels.
in the BDI since 2009, in the wake of the January Vale
Dry Bulk Trades Growth (Mt) Oil Trades Growth (Mt) Container Throughput Growth (Teu)
dam collapse in Brazil which potentially reduced iron ore
Dry Bulk Trades Oil Trades Container Throughput
exports by 80 million tons out of the 350 million tons Growth (mt) Growth (mt) Growth (teu)
exported annually. Alphaliner Charter Index since 2010 Charter rates for cellular ships (6-12 month fixtures)
The most extreme downward movement of the BDI over
2016 avg 2017 avg 2018 avg 2018 avg Change
a five-day period happened in October 2008 when a 35% Size
300
$/day $/day $/day $/day 2019/2018
fall was recorded. Removing 2008 from the dataset, the Average 1-year Time Charter rates were as follows:
biggest 5-day decline in the BDI was registered between 8,500 teu 8,667 13,396 15,538 25,875 131%
•250Supramax (50-60,000 dwt): $11,487 in 2018 and $9,948 in 2019
25 and 31 January 2019 as it plummeted by 26.2% from
• Kamsarmax.............................. : $13,008 in 2018 and $12,429 in 2019 5,600 teu 6,129 12,063 13,708 16,633 90%
905 to 668.
• Capesize.................................... : $16,529 in 2018 and $18,025 in 2019
200
The dry bulk market was thus characterized by large (Panamax) 4,000 teu 5,120 7,533 11,162 11,088 42%
fluctuations throughout 2019 with the BDI starting at During 2019, 1-year Time Charter rates fluctuated within the following bands:
1,282 before halving within one month or so (595 on 11 150 2,500 teu 5,979 8,179 10,792 9,275 5%
• Supramax... : between $4,837 and $15,233 per day
Feb 2020), before quadrupling eight months later (2,421
• Kamsarmax: between $5,898 and $19,918 per day 1,700 teu 6,983 7,404 9,646 8,096 11%
on 9 Sept 2029) and before finally halving again so that 100
• Capesize..... : between $3,460 and $38,012 per day
it touched 1,090 on 24 December 2019. In spite of these 1,000 teu 6,595 6,375 7,242 6,283 -2%
fluctuations, judged on an annual average basis, the BDI The
50 Baltic Capesize 5TC averaged $8740 in Q1, $11508 in Q2, $29514 in Q3, and
remained remarkably flat over 2018 and 2019, averaging Alphaliner Index 43.2 54.6 68.1 72.3 44%
$22,184 in Q4.
1,352 and 1,353 points respectively.
0
2000 2001 2002 2003 2004 2005 2006 2007 2008 2009 2010 2011 2012 2013 2014 2015 2016 2017
8 BRS GROUP - Annual review 2020 BRS GROUP - Annual review 2020 Picture: HAFNIA GUANGZHOU, Product/chemical tanker LR1: 74,999 dwt, built by Chinese shipbuilder GSI for HAFNIA in 2019. 9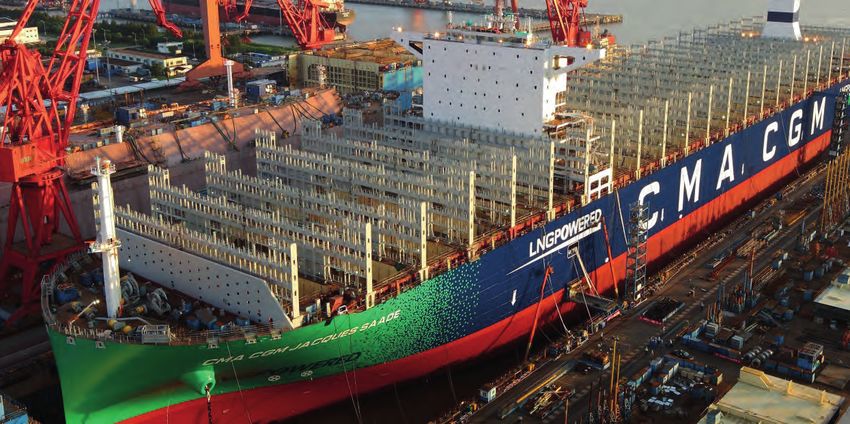
SHIPBUILDING SHIPBUILDING
ORDERS AND ORDERBOOKS ORDERS AND ORDERBOOKS
New Ordersfor
New orders forstandard
Standard Vessels
vessels per Year
per year
Million dwt
Million dwt
Tanker deliveries rebounded from 29.3 million deadweight in 2018 to 38.6 Tanker Summary 2018 2019
30
million deadweight in 2019. The active tanker fleet grew from 575.3 million
Orders m dwt 24.4 29.9
deadweight at the end of 2018 to 608.6 million deadweight at the close of
25 2019. The tanker orderbook represented about 9.9% of the active tanker fleet Deliveries m dwt 29.3 38.6
at year-end, distributed as follows: Orderbook m dwt 68.3 59.7
20
• MR1: orderbook 0.2m dwt; fleet 19.6m dwt; ratio 0.6% Active Fleet m dwt 575.3 608.6
• MR2: orderbook 7.7m dwt; fleet 78.2m dwt; ratio 4.7% Orderbook/Active Fleet 11.9% 9.9%
15
39
80 • Panamax and LR1: orderbook 1.1m dwt; fleet 33.3m dwt; ratio 1.9% m dwt 16.9 18.7
China
91 • Aframax and LR2: orderbook 11.2m dwt; fleet 113m dwt; ratio 4.8% Market share 24.7% 31.3%
10
• Suezmax and LR3: orderbook 11.7m dwt; fleet 93.5m dwt; ratio 3.5% m dwt 34.2 27.3
38 56 66 107 Korea
5 75 • VLCC: orderbook 23.9m dwt; fleet 242m dwt; ratio 9% Market share 50.1% 45.7%
1 65 36 Korea continued to dominate the segment but conceded market share which m dwt 12.9 10.5
- dropped from 50.1% in 2018 to 45.7% in 2019. China saw its market share rise Japan
Market share 18.9% 17.6%
VLCC
VLCC Suezmax
Suezmax Aframax/LR2
Aframax Panamax/LR1
/ LR2 Panamax / LR1 MR
MR Handy
Handy Capesize
Capesize Panamax
Panamax Supramax
Supramax Handysize
Handysize Containership
Containership from 24.7% in 2018 to 31.3% in 2019 while Japan succeeded in maintaining its
market share at 17.6%.
2017 2018 2019
2017 2018 2019
Containerships orders dropped in 2019, following two years of recovery, from Container Summary 2018 2019
New orders per year (2010-2019) 13.9 million deadweight in 2018 to 9 million deadweight, a figure also well
New Orders for Specialised Vessels per Year below the 2010-19 average of 12.4 million deadweight.
Orders m dwt 13.9 9.0
no.ships
m dwt 2010 2011 2012 2013 2014 2015 2016 2017 2018 2019 Deliveries m dwt 14.2 11.2
2017 was marked by groundbreaking orders of Very Large Containerships
Tanker 88.6 39.8 24.0 75.7 57.4 34.9 16.6 37.1 46.4 24.6 Orderbook m dwt 29.7 27.5
120 (VLCS) of 23,500 teu (400m length overall and 61m beam) by MSC, CMA CGM
Bulk 29.6 8.6 13.2 33.6 32.6 50.9 11.4 29.9 24.4 29.9 and Imabari Zosen (total 22). These were then followed in 2018 by Hyundai Active Fleet m dwt 266.5 275.0
Container
100 7.3 21.0 3.5 22.9 12.6 22.9 3.1 8.6 13.9 9.0 Merchant Marine which ordered 12 containerships of 23,000 teu. In 2019 Orderbook/Active Fleet 11.1% 10.0%
Other ships 4.4 6.7 6.0 8.9 12.3 7.1 1.7 3.8 9.0 9.7 Evergreen ordered 10 ships of about 23,750 teu and MSC 5 ships of about
m dwt 11 10.2
23,650 teu. But the focus of the year was more on the segments between China
Total
80 129.9 76.1 46.7 141.1 114.8 115.6 32.8 79.0 93.8 73.2
13,300 and 18,000 teu, 11,000 and 12,500 teu and 1,000 and 3,000 teu. It is Market share 37.0% 37.1%
interesting to note that there is basically no newbuilding activity between 4,000 m dwt 12.3 12
58
60 Bulker orders were halved from 46.4 million deadweight in 2018 to 24.6 and 10,000 teu. Korea
ORDERS AND ORDERBOOKS million deadweight in 2019, a level well below the 2010-19 average of 44.5
Market share 41.4% 43.6%
43 In contrast to the bulker and tanker segments, container carrier deliveries
40 million deadweight.
37 m dwt 5.6 4.6
declined in 2019 to 11.2 million deadweight from 14.2 million deadweight in Japan
27 Market share 18.8% 16.7%
Orders and24 orderbooks All bulker sizes were affected by this downward trend except for the over- 2018. The active container carrier fleet grew from 266 million deadweight at
panamax segment (85,000 to 16 100,000 dwt) which saw more newbuilding end-2018 to 275 million deadweight at end-2019. The orderbook represented
for standard vessels
20
activity in 2019. 7 about 9.9% of the active fleet at year end.
Newbuilding
0
orders decreased by 22% in 2019 to reach
A total of 41.1 million deadweight was delivered in 2019 versus 28.2 million In 2019, Korea succeeded in raising its market share to 43.4% from 41.2% in
72 million deadweight. 2019 figure is the third lowest
Chemical carriers stainless LPG carriers LNG carriers deadweight in 2018. The Ro-ro
Ferries & Ro-pax chiseling effect Car
of carriers
less orders andCruise
more deliveries
vessels 2018. This was to the detriment of Japan, whose market share fell from 19.2%
over the laststeel
10 years and well below the average of 90.2
meant the dry bulk orderbook dropped to 92.1 million deadweight from 108.7 to 17.7%. China consolidated its share at 37.1%.
million deadweight posted over the same period. While
2017 2018 2019 million deadweight whereas the dry bulk active fleet continued to grow from
orders for bulkers and container carriers decreased last
835 million deadweight to 868 million deadweight.
year by a half and a third respectively, those for tankers
Existing Orderbook O/E Orders in 2019
increased by about a fifth. Tonnage on order represented 10.6% of the active bulker fleet at end 2019,
Size range teu ships teu ships teu % ships teu
broken down as follows::
18,000-24,763 115 2,311,701 37 863,652 37.4% 15 355,888
Bulk Summary 2018 2019 • Handysize and Handymax: orderbook 6.1m dwt; fleet 122.1m dwt; ratio 5.0%
13,300-17,999 212 3,092,691 48 713,412 23.1% 22 331,500
Orders m dwt 46.4 24.6 • Supramax and Ultramax: orderbook 15.0m dwt; fleet 175.5m dwt; ratio 8.6%
12,500-13,299 82 1,069,278 5 63,450 5.9% - -
Deliveries m dwt 28.2 41.1 • Panamax and Kamsarmax: orderbook 18.5m dwt; fleet 176.2m dwt; ratio 10.5%
10,000-12,499 154 1,645,412 38 452,050 27.5% 8 94,800
Orderbook m dwt 108.7 92.1 • Post-Panamax and Babycape: orderbook 5.6m dwt; fleet 56.5m dwt; ratio 11.6% 7,500-9,999 486 4,281,666 0 0 0.0% - -
Active Fleet m dwt 834.5 867.8 • Capesize and Newcastlemax: orderbook 31.5m dwt; fleet 255.4m dwt; ratio 12.4% 5,100-7,499 448 2,785,467 0 0 0.0% - -
Orderbook/Active Fleet 13.0% 10.6% • VLOC: orderbook 14.5m dwt; fleet 77.8m dwt; ratio 18.7% 4,000-5,099 635 2,871,233 2 8,038 0.3% - -
Chinese shipbuilders once more consolidated their share of the dry bulk market 3,000-3,999 249 863,649 10 30,488 3.5% - -
m dwt 65.7 58.1
China at 63.1% in 2019, while Japan’s market share was maintained at 29.8% and 2,000-2,999 665 1,698,380 114 284,237 16.7% 23 55,358
Market share 60.5% 63.1%
Korea’s decreased to 4.0%. 1,500-1,999 570 984,966 54 96,533 9.8% 13 23 496
m dwt 5.3 3.7
Korea 1,000-1,499 704 817,526 51 57,443 7.0% 20 21,736
Tanker orders increased in 2019 to 29.9 million deadweight (24.4m dwt in
Market share 4.9% 4.0% 500-999 670 500,864 4 2,489 0.5% - -
2018) a figure above the average of the last ten years (26.3m).
m dwt 33.9 27.5 100-499 195 65,873 5 896 1.4% 1 300
Japan This was notably the case for suezmaxes, where contracted volumes doubled
Market share 31.2% 29.8% Total 5,185 22,988,706 368 2,572,688 11.2% 102 883,078
and for the aframax/LR2 segment where contracted volumes almost tripled.
Picture: TUKUMA ARTICA, Container carrier, ice class +1A Polar code, 2,150 teu.
10 BRS GROUP - Annual review 2020 BRS GROUP - Annual review 2020 Built and delivered in January 2020 by Chinese shipbuilder GWS to Royal Artic Line. Designed by Deltamarin. Photo: Royal Artic Line. 11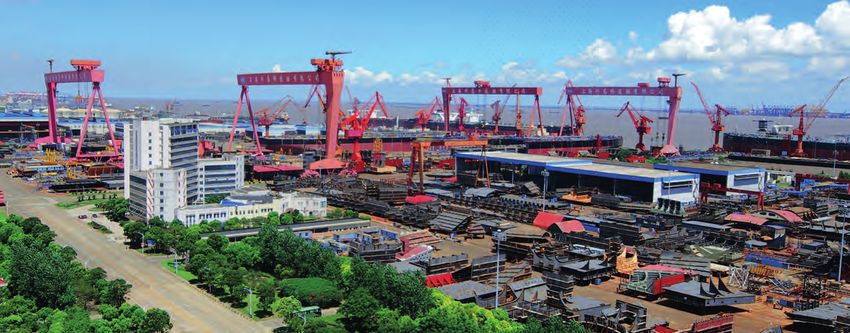
SHIPBUILDING SHIPBUILDING
ORDERS AND ORDERBOOKS ORDER CANCELLATIONS AND DEMOLITIONS
Historical LNG carriers orders
Cbm Ships Orders and orderbooks for specialised vessels ORDER CANCELLATIONS IN 2019
As a result of the drop or increase in demolition in each
segment, the average age of vessels demolished climbed in
New Orders for
2000 Standard 17
2,334,224 Vessels per Year The specialized vessels segment which had been buoyant in 2018 sustained its 2019 for tankers to 27 (23 in 2018) and fell for bulkers to 29
overall trajectory in 2019. (32 in 2018) or remained steady at 23 for container carriers.
2001
Million dwt 3,566,085 26
Order cancellations - a potent sign of the crisis in the shipbuilding industry after
2002 1,972,148 14 Orders for chemical carriers, LNG carriers, ro-ros, ferries and cruise ships cooled
30 2008 - fell to their lowest level since 2010 at 1.7 million deadweight. The long-awaited surge in scrapping which would bring some
2003 2,934,074 2 down but remain at historical high levels, while orders for LPG carriers increased.
relief to the shipping market did not materialize. This was
2004 9,940,342 66 initially anticipated given the costly implementation of the
25 Orders vs cancellations (2010-2019)
2005 7,469,846 42 upcoming rules and regulations related to the Ballast Water
2006 604,183 3 m dwt 2010 2011 2012 2013 2014 2015 2016 2017 2018 2019 Treatment System (BWTS) and the 2020 sulphur cap.
20
2007 4,170,072 22 Cancellations 38.4 23.3 16.6 31.1 15.1 11.3 12.1 4.4 6.1 1.6 December 2019 saw the entry into force of the Ban Amendment
2008 969,241 6 Orders 130.0 76.1 46.7 141.1 114.8 115.7 32.7 79.3 93.8 73.2 and India’s ratification of the Hong Kong Convention. The Ban
15
80
2009 39 142,741 1 Amendment bans the export of hazardous waste, including
2010 1,964,348 13 91 ships, from OECD to non-OECD countries. India’s accession
10
2011 7,335,677 46 to the Hong Kong Convention is a major milestone. All
2012 5,481,558
38
34
56
75
66 107 DEMOLITION IN 2019 Indian recycling yards will now need Hong Kong Convention
5
certification to operate, as per The Recycling of Ships Bill 2019.
2013 5,429,466 32
1 65 36 The Bill requires all ships entering a port, terminal or recycling
2014 11,110,014 68
- For the third year in a row, demolition activity declined as it fell to 15.7 million facilities in India to carry IHM documentation and prescribes
2015 VLCC 3,823,294
Suezmax 25 / LR2 Panamax / LR1
Aframax MR Handy Capesize Panamax Supramax Handysize Containership deadweight in 2019 from 27.0 million deadweight in 2018. certain shipping inspections to ensure compliance. Every ship recycler
2016 896,766 7 markets (tanker for instance). This trend was very much accentuated in the tanker must ensure safe and environmentally sound removal and
2017 2018 2019
2017 3,159,328 22 segment which had seen a ten-year demolition record in 2018 at 20.2 million management of hazardous materials from a ship and comply
2018 11,530,194 72 deadweight. In 2019 it fell to 4.4 million deadweight, the third lowest over the with the specified environmental regulations.
New Orders for Specialised last ten years. There was a rebound of demolition activity in the bulk (from 4.8m
2019 9,459,212 58 Vessels per Year
no.ships
dwt to 7.9m dwt) and container carrier (from 1.4m dwt to 2.7m dwt) markets, but
it is important to remember that in 2018 activity in these markets plummeted Demolitions in 2019
New
120 orders for specialised vessels per year from 14.4 million deadweight to 4.8 million deadweight, and from 5.7 million Others - 9%
N° of ships deadweight to 1.4 million deadweight, respectively. 128 Ships
100
Demolition prices that had risen sharply in 2018 in the Indian subcontinent to
reach an average of $420/ldt for bulkers and $430/ldt for tankers ($350 and Container - 16%
98 Ships
80 $375 in 2017) and container carriers ($445/ldt versus $375/ldt in 2017), softened
in 2019 to $384/ldt, $395/ldt and $398/ldt for bulkers, tankers and container Bulk - 47%
60
58 carriers, respectively. 91 Ships
43
37
40
Demolitions vs deliveries (2010-2019)
27
24
16 Tanker* - 27%
20 m dwt 2010 2011 2012 2013 2014 2015 2016 2017 2018 2019 87 Ships
7 Demolitions 29.5 41.5 59.6 44.8 34.5 36.2 44.4 32.1 28.4 16.5
* Incl. Chemical Tankers
0 Deliveries 149.9 162.4 152.5 107.3 88.0 94.4 98.7 96.1 79.2 97.6
Chemical carriers
Chemical stainless
carriers LPG
LPGcarriers
carriers LNG
LNGcarriers
carriers Ferries & Ro-pax
Ferries & Ro-pax Ro-ro
Ro-Ro CarCar
carriers
carriers Cruise vessels
Cruise vessels
steelsteel
stainless
2017
2017 20182018
2019 2019 Demolition Activity
Bulk Tanker Container
Orders for specialised vessels Year Dwt Ave Age of Scrap price Dwt Ave Age of Scrap price Dwt Ave Age of Scrap price
scrapped scrap range ($) scrapped scrap range ($) scrapped scrap range ($)
2014 2015 2016 2017 2018 2019 N° of Ships 2017 2018 2019
2010 7,612,665 32 390.4 14,317,073 27 436.7 2,179,852 26 399.2
Chemical carriers Chemical carriers
2,025,084 2,048,546 848,621 396,334 390,912 483,566 25 28 24
stainless steel (dwt) stainless steel 2011 24,988,666 30 484.6 9,370,165 28 510.8 1,222,145 29 491.7
LPG carriers (cbm) 4,207,137 3,490,529 26,768 1,092,503 1,362,199 2,350,476 LPG carriers 21 34 43 2012 35,358,976 28 426.3 14,232,739 24 450.0 4,835,001 24 446.7
2013 23,049,210 28 398.8 11,511,731 24 421.3 6,148,826 22 424.2
LNG carriers (cbm) 11,110,014 3,823,294 896,766 3,159,328 11,530,194 9,459,212 LNG carriers 22 72 58
2014 16,710,772 27 431.3 8,316,723 25 470.4 5,789,141 22 476.3
Ferries & Ro-pax (gt) 283,909 311,470 746,800 439,041 1,078,408 888,209 Ferries & Ro-pax 31 52 37 2015 28,956,532 25 335.6 2,687,019 28 361.5 2,767,783 22 371.3
Ro-ro (lm) 8,583 30,246 49,714 37,148 87,940 45,861 Ro-ro 11 17 16 2016 30,729,727 23 254.2 2,520,400 27 283.3 8,842,918 19 289.6
2017 14,444,107 25 354.0 9,283,189 24 375.4 5,734,244 20 375.0
Car carriers (cars) 148,263 209,982 19,248 38,310 22,810 32,620 Car carriers 6 6 7
2018 4,772,753 32 423.3 20,213,280 23 432.9 1,409,642 23 445.8
Cruise vessels (gt) 2,174,399 2,497,355 2,511,455 2,885,036 2,230,445 1,711,038 Cruise vessels 36 30 27 2019 7,852,879 29 384.4 4,427,162 27 394.6 2,697,098 23 398.4
Picture: MV GLOBAL MERCY, Hospital ship under construction for the humanitarian organization Mercy Ships. Construction is being done by China Shipbuilding Industry Corporation (CSIC) at the Tianjin Xingang Shipyard, Tianjin, China and is due to be completed in 2020.
12 The contract to build the vessel was awarded to Stena RoRo, Göteborg, Sweden in 2014. (to be continued on p13) BRS GROUP - Annual review 2020 BRS GROUP - Annual review 2020 Upon delivery, the Global Mercy will more than double the surgical capacity and patient beds of Mercy Ships. 13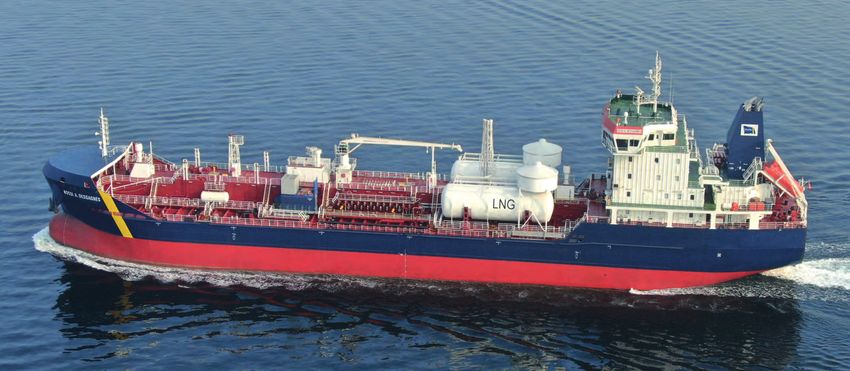
SHIPBUILDING SHIPBUILDING
SHIPBUILDING CAPACITY DELIVERIES AND WORLDWIDE SHIPBUILDING CAPACITY IN 2017
Sharp reduction in
the number of active Ship deliveries in China, Korea & Japan (2009-2019)
building facilities
from a peak of 684 Deliveries
(million dwt)
2009 2013 2014 2015 2016 2017 2018 2019
in 2007. Down to
281 in 2019 China 36.4 43.1 35.6 37.9 35.8 38.4 34.7 36.2
South Korea 43.0 33.4 24.5 29.2 35.9 30.8 19.0 32.4
DELIVERIES AND WORLDWIDE Japan 29.2 25.0 22.4 21.1 21.6 20.2 20.1 24.5
SHIPBUILDING CAPACITY IN 2019
The only solace for shipbuilders came from a stronger
NEWBUILDING PRICES IN 2019 US dollar, which saw Chinese and Korean currencies
Total deliveries increased to 97.6 million deadweight in In South Korea, annual production which more than doubled between
respectively go from 6.87 Yuan/$ and 1,112 Won/$ at the
2019, compared with 79.2 million deadweight in 2018. 2006 and 2011 from 25.0 million deadweight to 53.4 million deadweight
beginning of the year to 6.96 Yuan/$ and 1,154 Won/$ by
This was divided into 41.1 million deadweight of bulk rebounded to 32.4 million deadweight after having fallen quite significantly
Following stronger demand in 2018, shipbuilders had succeeded in raising the end of the year.
carriers (28.2m dwt in 2018), 38.6 million deadweight of from 30.8 million deadweight in 2017 to 19.0 million deadweight in 2018.
newbuilding prices by some 10% across the board. However, in 2019 lower
tankers (29.3m dwt in 2018) and 11.2 million deadweight
In Japan, annual output which increased by 10% between 2006 and 2011 demand put newbuilding prices under pressure again. This was less apparent in Prices in the second-hand market followed a similar
of containerships (14.2m dwt in 2018).
from 28.9 to 31.9 million deadweight bounced back from 20.1 million the tanker segment where prices remained almost stable but more pronounced pattern as the charter markets. Tanker prices increased
In China, annual shipbuilding production which increased deadweight in 2018 to 24.5 million deadweight in 2019. in the bulker and container carrier segments where discounts of about 5% could by double digit rates during the year with a low at the
by about 440% between 2006 and 2011 from 12.7 be seen. It was very difficult for yards to reduce prices further to attract new beginning of 2019 and a high at the end of the year,
million deadweight to 69.0 million deadweight inched It is notable that the number of active building facilities (yards that either won contracts as their building costs were also on the rise, with changes in regulations, whereas bulker prices (except for the panamax segment)
up from 34.7 million deadweight in 2018 to 36.2 million new contracts and/or delivered tonnage during a given year) dropped from the supply and installation of BWTS, Tier III requirements and scrubber ready or went down through the year to end up by a few percent
deadweight in 2019. 330 in 2018 to 281 in 2019, significantly lower than its peak of 684 in 2007. LNG ready notations all needing to be costed for and coped with. below the levels experienced at the beginning of the year.
Historical Building
Active building Facilities
facilities per
per year & year
region&(excluding
main areas (Excluding offshore)
offshore) Daily exchange rates with $
Million dwt N° of facilities Daily Exchange rates with US$
Million dwt N° of facilities Million $
350 800 1.40
684 1.30
700
300
1,111.8 1,154.1
1.20
600
250
1.10
500
109.7 108.6
200 1.00
281
400 0.87 0.89
0.90
150
270
300
0.80
100 6.87 6.96
200
0.70
50 100 0.60
- - 0.50
20002000
20012001
20022002
20032003
20042004
20052005
20062006
20072007
20082008
20092009
20102010
20112011
20122012
20132013
20142014
20152015
20162016
20172017
20182018
2019 2014 2015 2016 2017 2018 2019
2014 2015 2016 2017 2018 2019
CHINA JAPAN SOUTH KOREA EUROPE ROW N° of World Active Shipyards
China Japan South Korea Europe ROW N° of facilities 100 Yen 1,000 Won 10 Yuan 1 Eur
100 Yen 1000 Won 10 Yuan 1 EUR
Picture: HOLLANDIA SEAWAYS, delivered by Chinese shipbuilder Jinling to DFDS on 10 October 2019. Loa 237.4 m – Beam 34 m – 6700 lm or 450 trailers.
14 BRS GROUP - Annual review 2020 BRS GROUP - Annual review 2020 3 rd roro built and delivered by the yard for DFDS. 15
0rders
SHIPBUILDING
NEWBUILDING PRICES IN 2019
Newbuilding prices (million $)
Low 4Q Peak 2Q End 2017 End 2017 End 2018 End 2018 End 2019 End 2019 part of a global drop in newbuilding orders for bulkers
1993
2002 2008 China 1st tier** SK/Japan China 1st tier** SK/Japan China 1st tier** SK/Japan SHIPBUILDING IN THE WORLD (15.5 million vs 30.3 million tons deadweight) despite
Tankers the container carrier segment being on par with 2018
(3.2 million vs 3.3 million tons deadweight) and the
VLCC 100 64 140-155 78 83 85/90 90 84 90/95 Shipbuilding in China comparative bullishness of the tanker segment (9.9
Suezmax 63 44 90-100 53 58 55/59 64 55 63/65 China retained its position as the world’s leading shipbuilder in 2019, million vs 4 million tons deadweight).
Aframax (A) 45 (A) 34 (A) 70-75 (A) 46 (A) 50 (A) 47 (A) 51 (A) 44 (A) 53 (A) ranking first across the board with the largest orderbook of 91.4 million tons
LR2 48 (LR2) 52 (LR2) 48 (LR2) 55 (LR2) 44.5 (LR2) 55 (LR2) Chinese shipbuilding output grew in 2019 producing 36.2
deadweight (a 45.4% share), the greatest number of newbuilding orders at 30.5
million tons deadweight compared to 34.7 million tons
MR2 IMO 3 32,5 27 48-51 33 36 34/35 37 33.5 36 million tons deadweight (a 42% share) and the largest number of deliveries at
deadweight in 2018. However, the orderbook/yearly
36.2 million tons deadweight (a 37% share).
Bulkers output ratio slightly declined from 2.8 at the end of 2018
Newcastlemax In the dry bulk segment, China maintained its lead with 15.5 million tons to 2.5 at the close of 2019.
N/A N/A N/A 48 50 52/54 58/60* 51 63*
(205k dwt) deadweight of new orders (about 63% of the global bulk new orders). In the
Capesize tanker and containership segments, it had to settle for second place behind
48 36 90-101 46 48 50/52 55/57* 48 60*
(180k dwt) South Korea, with 33% (9.9 million tons deadweight) and 36% (3.2 million tons Rise of the new giants
Panamax (P) deadweight) respectively of world orders.
29 (P) 21.5 (P) 53-60 (K) 26.5 (K) 28.5 (K) 29/30 (K) 34 (K)* 27 (K) 35 (K)*
Kamsarmax (K)
However, new orders placed at Chinese yards were down by about 21% in 2019
Ultramax (U)
Supramax (S) 25 (H) 20 (S) 47-50 (S)
25.5 (U) 26.5 (U)
27/28 (U) 31 (U)*
25.5 (U) 32 (U) (30.5 million tons deadweight) versus 2018 (38.7 million tons deadweight), The Chinese shipbuilding landscape was significantly
23 (H) 24 (H) 23.5 (H) 26 (H) reshaped in 2019. Two new ‘giants’, CSSC and CMHI,
Handymax (H)
were created by the central government with the aim
* Japan only, ** Prices at China’s 2nd tier yards are an estimated 5% lower
2018 2019
of rationalizing China’s shipbuilding industry and as a
China countermeasure to the difficult newbuilding market,
m dwt Ships m dwt Ships
plagued with overcapacity and perpetually loss-making
Market share 43.0% 1,307 45.4% 1,204 companies. It appears that the Chinese authorities have
Second hand price evolution during 2019 for 5 year old vessels (million $)
Bulk 65.7 590 58.1 516 suddenly become more concerned with the industry’s
profitability than by conquest of new market-share.
Jan 2019 High Low Dec 2019 Variation Jan- Dec Orderbook Tanker 16.9 285 18.7 265
Container 11.0 239 10.2 198
Twenty years after their demerger which aimed to
VLCC 64.20 75.34 20 Dec 64.20 02 Jan 75.34 17.35%
enhance competition, CSSC and CSIC groups finally re-
All ships 97.1 1,309 91.4 1,206 merged on 25th October 2019 creating a new state-
Bulk 30.3 270 15.5 146 owned company named CSSC (China State Shipbuilding
Aframax 31.04 40.00 20 Dec 31.04 02 Jan 40.00 28.87%
Tanker 4.0 104 9.9 124 Corporation) re-grouping in total 12 groups of shipyards.
Orders In parallel with this high-level merger, some yards have
MR Tanker 26.34 29.50 13 Dec 26.34 02 Jan 29.50 12.00% Container 3.3 103 3.2 45
also been reorganized under common management
All ships 38.7 555 30.5 421 in spite of their differing geographical locations, for
Capesize 35.52 36.74 28 Jan 34.04 20 Dec 34.04 -4.17%
Bulk 17.0 145 23.0 220 example Dalian, Shanhaiguan and Bohai. At the end of
2019, the new group represents 50.6% of the Chinese
Panamax 21.55 23.87 06 Sep 21.00 20 May 22.96 6.54% Tanker 8.9 167 8.1 144
Deliveries orderbook and 23.2% of the world orderbook. It has
Container 7.3 106 4.0 86 instantly become the largest shipbuilding company in
Supramax 18.32 18.58 21 Jan 16.93 20 Dec 16.93 -7.59% the world.
All ships 34.7 510 36.2 524
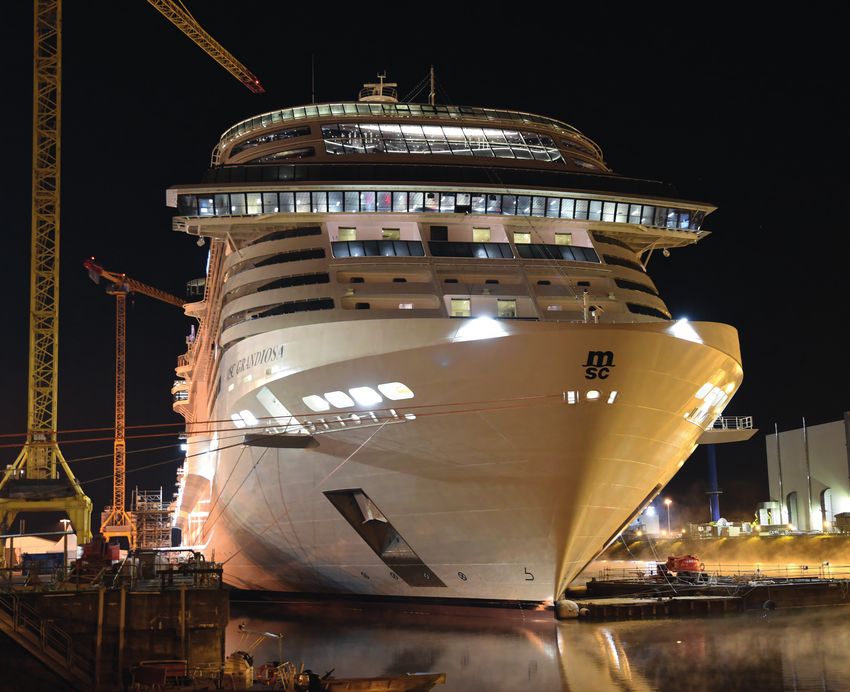
16 Picture: CHINESE SHIPBUILDER SWS, (Shanghai Waigaoqiao Shipbuilding Co. Ltd.) facilities (Pudong District, Shanghai).. BRS GROUP - Annual review 2020 BRS GROUP - Annual review 2020 Picture: TORM SUBLIME, Product chemical tanker MR2, delivered by Chinese shipbuilder GSI to TORM on 6 November 2019. 17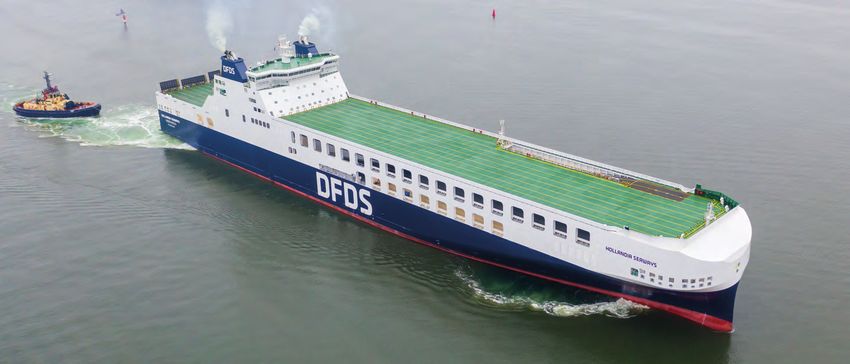
SHIPBUILDING SHIPBUILDING
SHIPBUILDING IN CHINA SHIPBUILDING IN JAPAN
Shipbuilding in Japan Japan maintained its position as the third largest
shipbuilder in 2019, ranking third overall for its 44.1
million tons deadweight orderbook (22% market share),
2018 2019 its 13.7 million tons deadweight of newbuilding orders
Japan (19% market share) and its tonnage output of 24.5
m dwt Ships m dwt Ships
million tons deadweight (25%).
Market share 24.3% 741 21.9% 625
The loss of newbuilding orders was particularly acute
Bulk 33.9 427 27.5 358
in Japan in 2019 compared to the general worldwide
Orderbook Tanker 12.9 165 10.5 115 trend with about 40 % fewer new orders in 2019 (13.7
Container 5.6 58 4.6 58 million deadweight) compared to 2018 (22.1 million tons
deadweight). This reduction hit all segments including
All ships 54.9 741 44.1 625
the bulk segment, Japan’s main center of excellence.
Bulk 14.9 190 7.9 118
Japan’s three largest shipyards Imabari, JMU and
Tanker 4.0 48 3.7 38
Orders Oshima picked up 11.6% of the total (5.3%, 4.2% and 2.1%
Container 2.8 36 1.4 21 respectively).
All ships 22.1 308 13.7 239 The ratio between the current orderbook and yearly
Bulk 9.2 134 14.3 187 output lowered from 2.8 at the end of 2018 to 1.8 at
Tanker 6.3 96 6.1 88
the end of 2019.
After the purchase of CSC group in 2018, CMHI group Hudong Zhonghua (HZ) won the world's most advanced LNG bunkering ship Deliveries
Container 2.9 26 2.4 21
(China Merchant Heavy Industry) acquired AVIC shipyards order. It is the second LNG bunker ship ordered by MOL at HZ to be chartered
in September 2019. The new CMHI group owned 5 shipyard by Total. This ship will be equipped with a mark III membrane provided by All ships 20.1 313 24.5 355 Some newsworthy events of the year
groups and at the end of 2019 representing 0.9% of the GTT and deployed in Marseilles, France, to provide LNG bunkering for ships in
Chinese orderbook and 0.4% of the world orderbook. the Mediterranean area. • Imabari Shipbuilding and Japan Marine United (JMU)
are in discussion to build a strong alliance with Imabari
Back in 2016, COSCO Group and China Shipping Group taking a 30% stake in JMU. The intention is to combine
Jiangnan delivered the first ultra large container carrier with dual fuel (LNG/
already merged to create China COSCO Heavy Industry forces when it comes to design for various types of
diesel) propulsion, MV Jacques Saadé, 23,000 teu for CMA CGM. The container
(CHI). CHI owns now 3 shipyard groups including NACKS ships and improve efficiency in vessel construction
giant also ordered 15 containerships of about 15,000 teu with LNG propulsion.
and DACKS. Joint-ventures with Japanese yard Kawasaki systems.
Jiangnan in addition received an order for 2 ethane carriers of 98,000 cbm
H.I and other yards like CHI Dalian, CHI Zhoushan, CHI
for Pacific Gas. • Mitsubishi Heavy Industries plans to turn its Nagasaki
Guangdong,… At the end of 2019, the group represented
10.9% of the Chinese orderbook. It has become the second shipbuilding facility into a cruise ship construction and
Stena ordered 2 methanol carriers MR2 with a dual fuel propulsion based this repair yard following the planned sale of its nearby
largest shipyard group in China and the sixth largest
time on methanol and diesel at GSI. Koyagi Shipyard to Oshima Shipbuilding. The decision
shipyard group in the world.
in selling Koyagi yard was taken as the group does
Ranking respectively number 3 and number 4 behind • China Merchants Cruise Shipbuilding (ex CMHI Jiangsu Haimen shipyard) not see a future in the construction of gas carriers,
CHI, it is interesting to mention that NTS and Yangzijiang delivered the first polar exploration cruise vessel for American owner containerships, tankers and bulkers.
are the two largest private shipbuilders in China with an Sunstone. This vessel, named Greg Mortimer, is the first ship of a series of
orderbook of about 8.4m and 7.7m deadweight. 7 + 3 polar exploration cruise ships that CMHI signed with Sunstone. This is • Sino-Japanese joint ventures NACKSand DACKS are
a breakthrough in the history of Chinese shipbuilding, threatening Europe’s looking to enter the LNG sector. At the same time,
At the end of 2019, the four Chinese shipbuilding groups Kawasaki Shipbuilding Heavy Industries, one of the
monopoly on cruise ship construction and creating a weighty precedent – "a
(CSSC, CHI, NTS and Yangzijiang) represented 69.1% of the shareholders of NACKS and DACKS is shutting down
cruise ship made in China".
Chinese orderbook (63.2 million tons deadweight) and 30% of capacity at its main shipyard in Sakaide, Japan,
31.4% of the world orderbook. • China Merchants Jinling (Weihai) shipyard (formerly AVIC Weihai shipyard)
with the closure of a dock.
delivered the first Ro-Ro ship for Stena Ro-Ro. The ship is the first out of
a series on nine ships ordered by Stena for their own needs and others’
needs - Some will be chartered out to other ferry companies. It is the most Some significant orders of the year
Some newsworthy events of the year
efficient, energy-saving model in the world at present and one of the most
advanced Ro-Ro/passenger ships ever built in China. • Oshima and Namura will build the first 95,000
• Newbuilding orders with dual-fuel propulsion (based • Jiangsu Yangzi Mitsui Shipbuilding Co., Ltd. was officially established in May deadweight LNG-fueled panamax bulkers. NYK
on either LNG or LPG or methanol together with diesel) 2019 as a joint venture between Chinese shipbuilder Yangzijiang and Mitsui contracted one unit at Oshima and MOL one unit at
2019 proved to be a turning point for orders of Dual- Engineering. The venture will focus on building all kinds of commercial ships, Namura. Both ships will be used exclusively to carry
Fuel propelled vessels in China. 42 ships were ordered especially LNG and oil tankers. coal to coal-fired power plants in Japan and service
based on DF designs (2 bulk carriers, 18 tankers, 6 a long-term contract with Kyushu Electric Power Co
• Some news about shipyards that ran into difficulties: Ouhua Shipbuilding
containerships, 16 others). Among the most notable (Kyuden).
which went bankrupt in 2018 has finally been auctioned to Zhoushan
orders, we can quote: Changhong International in August 2019. Zhejiang Zhenghe Shipbuilding was • Mitsubishi Shipbuilding will build 2x17,300 gt LNG
Eastern Pacific Shipping signed 2 newcastlemax with successfully purchased at auction by a domestic non-shipbuilding company. DF ropax ferries for MOL to be operated by domestic
dual fuel (LNG/diesel) propulsion with SWS and 2 Jiangsu East Heavy Industry started the process of being auctioned at the operator Ferry Sunflower when they are delivered in
suezmax tankers with dual fuel (LNG/diesel) propulsion end of 2019. 2022 and 2023.
with GSI.
Picture: CONTAINERSHIPS NORD, Container carrier, Ice class 1A, 1,400 teu, built by Chinese shipbuilder GWS and delivered on 12 December 2018.
18 Picture: LE BOUGAINVILLE, 9,900 gt, pax 184, crew 110, delivered by Norwegian shipbuilder Vard to Ponant on April 2019. Photo: Fred Michel, StudioPONANT. BRS GROUP - Annual review 2020 BRS GROUP - Annual review 2020 This is the first LNG-powered vessel delivered to CMA CGM through its subsidiary Containerships. 19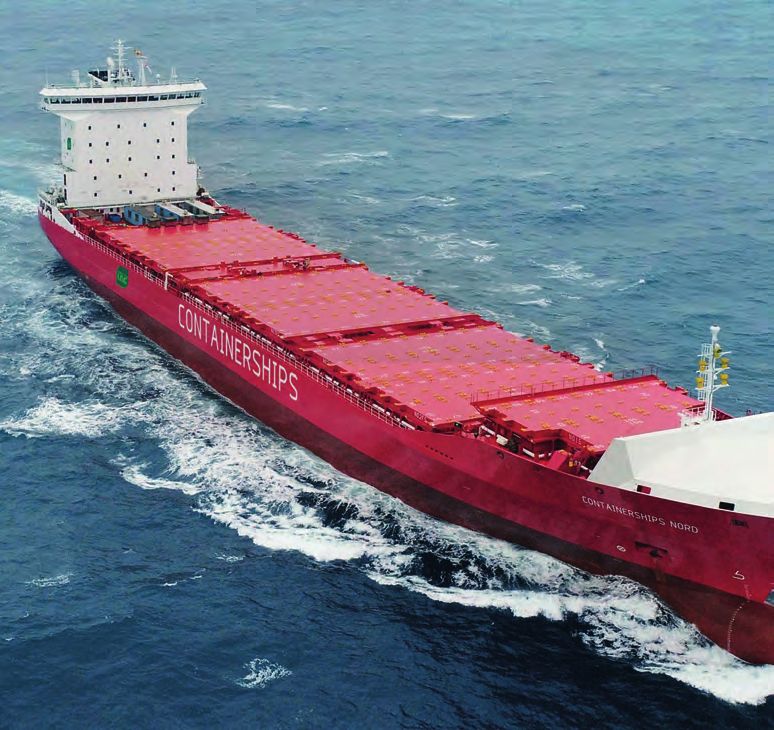
SHIPBUILDING
SHIPBUILDING IN SOUTH KOREA
Shipbuilding in South Korea 2018 2019
South Korea
Korea maintained its position as the second largest m dwt Ships m dwt Ships
shipbuilder in 2019, ranking second overall for its 56.6 Market share 27.8% 460 28.1% 483
million deadweight orderbook (28% market share), its Bulk 5.3 19 3.7 15
26.3 million tons deadweight of newbuilding orders
Orderbook Tanker 34.2 207 27.3 200
(36% market share) and its tonnage output 32.4 million
tons deadweight (33%). Container 12.3 95 12.0 96
In the tanker and container carrier segments, Korea All ships 62.7 460 56.6 483
maintained its lead with 15.5 million tons deadweight of Bulk 0.4 4 0.4 2
new orders (about 26 % of the global tanker orderbook) Tanker 15.6 99 15.5 121
and 4.4 million tons deadweight of new orders (about
Orders Container 7.3 66 4.4 40
16% of the global container orderbook). As for previous
years, Korean yards have only a marginal stake in the Gas 6.1 69 4.7 54
dry bulk segment, to the benefit of their Chinese and All ships 30.4 254 26.3 243
Japanese competitors, but this is largely compensated
Bulk 0.7 3 2.0 6
for by their dominant position in the construction of
sophisticated LNG carriers (45 new units out of 58 Tanker 11.9 100 22.5 128
worldwide in 2019). Deliveries Container 2.7 18 4.7 39
In line with the global downward trend, Korean yards lost Gas 3.7 53 3.2 43
new orders in 2019 but only about 13.5% (26.3 million All ships 19.0 178 32.4 220
tons deadweight) compared to 2018 (30.4 million tons
deadweight).
Daewoo Shipbuilding and Marine Engineering (DSME) secured 25.9% of over the facility located in Tongyeoung. Sungdong will no
A sign of the ongoing consolidation in the country’s new orders placed in Korea in 2019 with a total of $6.88 billion achieving longer build ships but will focus on hull block assembly.
shipbuilding industry, 94% of orders in 2019 were about 83% of their annual sales target of 8.3 billion. DSME is aiming for more The yard started out as an equipment manufacturer
secured by the Big Three, with Hyundai Heavy Industry Most newsworthy events of the year than $7 billion of orders in 2020. before becoming a block builder and then fully entered
netting 50.4%, DSME 25.9%, and Samsung 17.7%. into shipbuilding 15 years ago.
Hyundai Mipo Dockyard (HMD) continued to dominate the medium size
Korean shipbuilding output increased remarkably from Consolidation, Restructurings and Bankruptcies shipyard segment (below kamsarmax size), collecting about 85% of new orders Hanjin’s affiliate in the Philippines (Hanjin Subic) went
19 million to 32.4 million tons deadweight, but order to placed at Korean yards in 2019. It won 49 orders in 2019 against 54 in 2018, bankrupt at the beginning of 2019. Australian shipbuilder
The Korean shipbuilding industry has not completely finalized its
yearly output ratio decreased to dangerous low levels representing about 70% of its building capacity. Its main product remains the Austal and US private equity firm Cerberus have entered
reorganization. The merger of HHI and DSME is still subject to approval
from 3.4 at end 2018 to 1.7 at the end of 2019. MR tanker and together with its Vietnamese company (HVS), it succeeded in into exclusive talks to take over Hanjin Subic. The shipyard
from antitrust regulators in South Korea and other countries. Medium size
winning about 48% of MR orders placed worldwide. collapsed after its South Korean owned parent defaulted
yards are struggling for their survival.
on loans. Many parties, including HHI, have been linked
Daehan Shipbuilding is now focused on the construction of two types of
After the March 2019 acquisition contract signing for Daewoo Shipbuilding & to taking over the yard, which at its peak employed more
standard tankers (aframax/LR2 and suezmax) and secured orders for 6
Marine Engineering (DSME) by Hyundai Heavy Industry (HHI), the completion than 30,000 people.
aframax and 6 suezmax in 2019. They have 20 ships in their orderbook at
of the merger remains outstanding. Internally, both management teams are
the beginning of 2020 which puts them in quite a comfortable position for the
facing strong resistance from the unions and DSME workers in particular.
years to come.
Externally the deal needs to be approved by antitrust watchdogs in several
Reduction and countries. The resistance of just one country would be enough to revoke STX Offshore & Shipbuilding (STX) which used to be in 2012 the fourth
Some significant orders of the year
the deal. If the merger is finally approved, it will create the second largest largest shipbuilding group in the world now concentrates only on MR tankers
consolidation shipbuilding group in the world with a current orderbook evaluated at 27.5% and secured 6 units in 2019 from three different owners. The yard succeeded
• In 2019, Korean shipyards secured 18 ships with
Dual-Fuel Propulsion representing 23% of the total DF
of the world orderbook. in maintaining the same level of orders compared to last year.
of Korean Pending approval of the deal, Korea’s shipbuilding industry continues its Dae Sun Shipbuilding and Engineering secured 5 new orders in 2019 just as
ships ordered (9 tankers and 9 gas carriers).
• Samsung secured 10 Aframax with LNG propulsion
shipbuilding difficult transformation: in 2018 – 3 handy tankers, 1 small ferry and 1 small LPG. Dae Sun has been
selected by their compatriot GS Caltex to build their first LPG carrier (3,500 cbm).
from Sinokor.
Hyundai Heavy Industries (HHI) secured some 50.4% of new orders placed in
capacity are in Korea in 2019 (64% if we include DSME new orders) versus 45.7% in 2018. The Samkang Shipbuilding & Construction is mainly involved in steel-pipe
• HMD secured 12 MR tankers from Japanese Meiji
Shipping.
group has maintained its sales target for 2020 at the same 2019 level of $15.9 production and the manufacture of ship blocks for domestic shipyards. It is
full swing but billion, even though it did not meet that goal in 2019, finishing the year with currently building a 4,000 deadweight chemical tanker for a domestic owner • The Big Three secured 83% of the 54 large LNG
only $12 billion in orders. This can be explained by HHI’s expectation of more at its existing site. carriers ordered globally in 2019 (24 units for HHI, 13
are not yet over new orders created by the proliferation of stricter environmental regulations.
Sungdong Shipbuilding & Marine Engineering which in the late noughties was
for DSME and 8 for Samsung).
Samsung HI (SHI) almost met their sales target for 2019 with $7.1 billion one the 10 largest shipbuilders in the world, finally found a new buyer. Having
vs 7.8 billion in 2018 mainly thanks to an order for 6 mega containerships sought bankruptcy protection nearly two years ago, creditors after the fourth
from Evergreen and an order for 10 LNG-fueled aframax from their tentative acquisition attempt gave the green light to a local consortium to take
compatriot Sinokor.
20 BRS GROUP - Annual review 2020 BRS GROUP - Annual review 2020 Picture: HAFNIA BEIJING, Product tanker LR1, delivered by Chinese shipbuilder GSI to HAFNIA on 24 October 2019. 21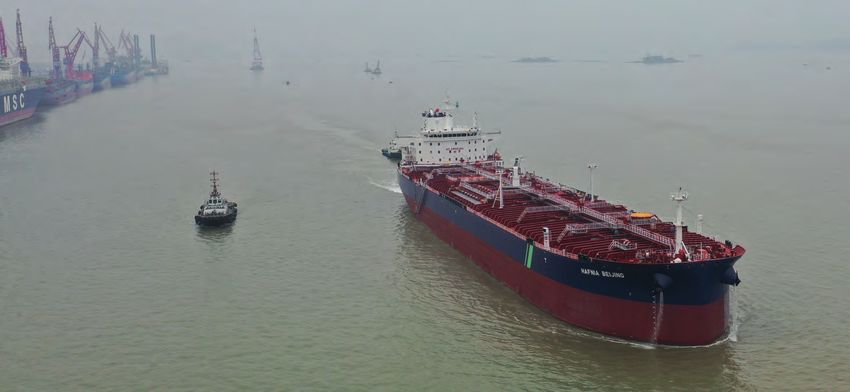
SHIPBUILDING SHIPBUILDING
SHIPBUILDING IN EUROPE SHIPBUILDING IN EUROPE
Shipbuilding in Europe
Orderbook of European shipyards 2019
Europe China Japan South Korea Orderbook of European shipyards 2019 (million GT) • Germany maintained its position in third place thanks
to two prolific shipyards, Meyer Weft and MV Werften.
Shipbuilding in 2018 2019 2018 2019 2018 2019 2018 2019 Ukraine
Ukraine 2
m gt Ships m gt Ships m gt Ships m gt Ships m gt Ships m gt Ships m gt Ships m gt Ships UnitedKingdom
United Kingdom 2 Meyer Werft continue to be one of the best shipbuilders
Portugal
Portugal 3 in the world of cruise vessels. End of 2018, they
Market share 7.7% 288 8.7% 285 38.5% 1309 39.9% 1206 21.7% 741 18.3% 625 29.1% 460 30.8% 483
Azerbaijan
Azerbaijan 8 delivered MV AIDAnova, the largest and cleanest
Bulk 0.03 5 0.03 3 35.6 590 31.3 516 18.8 427 15.4 358 2.7 19 1.9 15 cruise ship ever built in Germany. It is the world’s
Poland
Poland 6
Orderbook
Tanker 1.1 51 1.2 54 9.8 285 10.7 265 6.9 165 5.6 115 18.2 207 14.7 200 Germany
Germany 2 first ever ocean liner with an LNG drive system, which
Romania
Romania 7 fully prevents the release of particulate matter and
Container 0.01 2 0.01 2 10.1 239 9.4 198 5.3 58 3.9 58 11.8 95 11.5 96
Netherlands
Netherlands 32 sulphur oxides and significantly reduces the emission
Cruise 9.7 102 9.6 104 0.4 6 0.4 10 0 0 0 0 0 0 0 0 of nitrogen oxides and carbon dioxide. Thanks to this
Spain
Spain 8
All ships 12.1 288 12.6 285 61.0 1309 58.3 1206 34.3 741 26.7 625 46.1 460 45.0 483 Turkey
Turkey 38 technology, AIDAnova is the first cruise ship to be
Bulk 0.01 3 0.01 2 16.3 270 8.4 146 8.3 190 4.5 118 0.2 4 0.2 2 Croatia
Croatia 13 awarded the Blauer Engel environmental seal by the
Norway
Norway 28
German government. Two structurally identical sister
Tanker 0.2 10 0.3 16 2.4 104 5.5 124 2.1 48 2.0 38 8.4 99 8.3 121 ships are set to follow in 2021 and 2023.
Finland
Finland
Orders
11
Container 0 1 0 0 2.8 103 3.0 45 2.3 36 1.2 21 7.0 66 4.3 40 Russia
Russia 47
German shipyard MV Werften, consisting of three
Cruise 1.9 28 1.6 21 0.3 2 0.1 5 0 0 0 0 0 0 0 0 Germany
Germany 23 shipyards respectively Wismar, Stralsund and Varnemunde
France
France 12 was purchased by the Asian group Genting Hong Kong
All ships 2.8 103 2.9 80 23.8 555 19.6 421 13.1 308 8.5 239 24.1 254 20.2 243
Italy
Italy 42 from Nordic Group back in 2016 and continues to
Bulk 0 0 0.01 4 9.1 145 12.7 220 5.2 134 7.9 187 0.4 3 1.0 6
0 0.5 1 1.5 2 2.5 3 3.5 4 strengthen its position in the construction of cruise ships.
Tanker 0.3 14 0.3 13 5.0 167 4.6 144 3.5 96 3.3 88 6.3 100 11.8 128
Deliveries
N° of ships
N° ships
Million Gt
Million gt The construction in mega-sections of the first giant ocean
Container 0 0 0 0 6.6 106 3.7 86 3.0 26 2.5 21 2.6 18 4.5 39 liner MV Global Dream underwent an important stage
Cruise 1.3 12 1.6 21 0 0 0.01 1 0.1 1 0.1 2 0 0 0 0
with the huge central section of the future Global Dream
Most newsworthy events of the year left the MV Werften shipyard in Rostock (Warnemünde) to
All ships 1.9 55 2.4 83 22.5 510 22.3 524 14.4 313 16.1 355 13.9 178 21.3 220
join the Wismar shipyard.
It is necessary to drop deadweight (DEADWEIGHT) and of cruise vessels, the last of which will be delivered in 2030! A delivery so far • Italy retained its top spot amongst European shipbuilding nations on the basis
instead view shipbuilding through the lens of gross in advance is unheard of and shows how different the fundamentals of the of GT ranking in 2019 thanks to its ‘flagship’ shipbuilding group Fincantieri,
tons (GT) to enhance understanding of the relative shipbuilding industry have become in Europe and in Asia. the largest cruise ship builder in the world with a total of 37 large units to
importance of the European versus Asian shipbuilding be delivered before 2027. Fincantieri finalized the take-over of its affiliate
The outlook is not universally bright, however. There is a strong divide in
industry. This way an improved impression of the high- Norwegian group Vard and subsequent to its restructuring efforts the group
Europe between successful yards and their less successful counterparts.
value vessels in question, with a very low deadweight, decided to sell two of its Norwegian facilities, Aukra and Brevik.
Alongside fortunate shipyards that have specialized in the construction
can be obtained; a cruise ship of about 200,000 GT has
of sophisticated cruise ships for a long time, there are also shipyards that • France followed in second place thanks to its leading shipyard Chantiers de
a current value of about 1 billion euro, equivalent to the
have ventured into this new segment on the back of the expedition cruise l’Atlantique which secured 5 additional cruise ship orders in 2019 and enjoys a
price of 40 ultramax bulkers, but a deadweight of only
boom and failed. The case of Spanish shipyard Barreras serves as a poignant total orderbook of 13 large cruise units to be delivered before 2027. After the
10,000 deadweight versus 250,000 deadweight!
reminder – it would have gone bankrupt in 2019 were it not rescued by Ritz exit of its main shareholders, the Korean shipbuilding group STX, the company
When ranked by GT produced rather than deadweight, Carlton which placed there a cruiseship order. Likewise, Norwegian shipyard is temporarily 84.3% owned by the French State, the rest being shared between
Europe claims its place among the world’s main Kleven Verft ran into difficulties and was taken over by the Norwegian Naval Group (11.7%), local companies (1.6%) and employees (2.4%). Discussions
shipbuilding nations, particularly when the comparative shipping company Hurtingen to complete construction of the cruise ships with Fincantieri which was supposed to take a majority stake of 50% have
value of European-built GT is factored for. In 2019, already on order. At the beginning of 2020, it was announced that Croatia’s so far failed for several reasons including criticism made at European levels
China, Korea, Japan and Europe respectively accounted DIV Group (that owns Croatian shipyard Brodosplit) had entered into a against a dominant, even monopolistic, position (according to major cruise
for 58.3, 45.0, 26.7, 12.6 million GT of orderbook. preliminary agreement to take over Kleven Verft from Hurtigruten. shipowners) that would result from an association between Fincantieri, Vard
European shipyards saw their market share in gross ton and Chantiers de l’Atlantique; a lack of national independence for a domestic
A group of yards in Croatia - Uljanik and 3Maj - also filed for bankruptcy.
(GT) increase in 2019 from 7.7% to 8.7% mainly due to French shipbuilder that also builds for the French Navy and has a useful tool
It seems that 3Maj might find a way out and restart, but for the time being
the number of additional cruise ships ordered in 2019 knowledge for the construction of certain military ships; the unique expertise
Uljanik appears to be in a severely compromised state.
(21 ships). of Chantiers de l’Atlantique in the construction of giant cruise ships at a time
In Germany, Siem Europe signed an agreement with Tennor (ex Sapinda when Fincantieri has decided to sell cruise ship designs to a Chinese shipyard;
However, the downward trend in cruise ship orders seems
Holding B.V.) for the sale of a majority stake in German shipyard Flensburger resistance from the unions and the fact that the yard management succeeded
to be confirmed (21 in 2019, 28 in 2018, 30 in 2017, 25 in
Schiffbau-Gesellschaft (FSG) while Siem Europe holding the remainder. After in accruing a deep industrial expertise that needs to be retained in France.
2016, 21 in 2015, 16 in 2014, 10 in 2013 and 4 in 2012).
becoming a shareholder in 2014, Siem Europe became also one of FSG’s Interesting to note that the shipbuilder launched into offshore wind power
The three major specialist cruise ship builders: Fincantieri
largest customers. This included the construction of eight large roll-on/roll- to diversify its revenues and more traditional offshore work. A market of the
/ Vard, Meyer Werft and Chantiers de l’Atlantique, received
off freighters, with all but one now delivered. FSG built up a reputation within future, with strong regional spinoffs, at a time when relocation of industrial
16 orders, while the remaining 5 orders were shared by
the ferry and ro-pax sector for building highly efficient tonnage but has been activity is a major theme of the political debate.
four other European shipyards.
facing extensive competition from Chinese yards such as Avic Weihai, GSI,
Important to mention this year that the Piriou family decided to transfer control
The orderbook of the three major European cruise ship Xiamen over the last years. The Ropax ferry Honfleur for Brittany Ferries is
of the French shipyard to the management of the company thus closing a family
builders now stretches well into the late 2020s. Chantiers currently in the phase of extensive outfitting and commissioning alongside
cycle initiated with the creation of the company in 1965. Established in Europe,
de l’Atlantique announced at the beginning of 2020 that a the commissioning work of the RoRo Leevsten and the work on construction
Africa and Asia, Piriou shipyard has some 900 employees and has built and deli-
letter of intent had been signed with MSC for a new batch of the last unit for SIEM has been partially rescheduled.
vered since its creation more than 500 ships, including 430 in France.
22 BRS GROUP - Annual review 2020 BRS GROUP - Annual review 2020 Picture: CASTILLO DE ARTEAGA, Product tanker MR1, delivered by Chinese shipbuilder DSI (Shanhaiguan) to Empresa Naviera Elcano on 24 October 2019. 23You can also read