A STUDY ASSESSING INVESTMENT CAPACITY FOR APPALACHIAN COMMUNITY CAPITAL AND ITS MEMBERS
←
→
Page content transcription
If your browser does not render page correctly, please read the page content below
A STUDY ASSESSING
                               INVESTMENT CAPACITY
                               FOR APPALACHIAN
                               COMMUNITY CAPITAL AND
                               ITS MEMBERS
                               Palladium Impact Capital and Woodstock Institute

                               September 2021

Palladium Impact Capital Limited, Registered in England No. 08177779. Registered Office: 3 North Hill, Colchester, Essex, CO1 1DZ.
Palladium Impact Capital Limited is authorised and regulated by the Financial Conduct Authority (FCA) with firm reference number
587615. The FCA's address is 12 Endeavour Square, London, E20 1JN. Securities offered to US investors through Growth Capital
Services, member FINRA, SIPC, Office of Supervisory Jurisdiction located at 582 Market Street, Suite 300, San Francisco, CA 94104.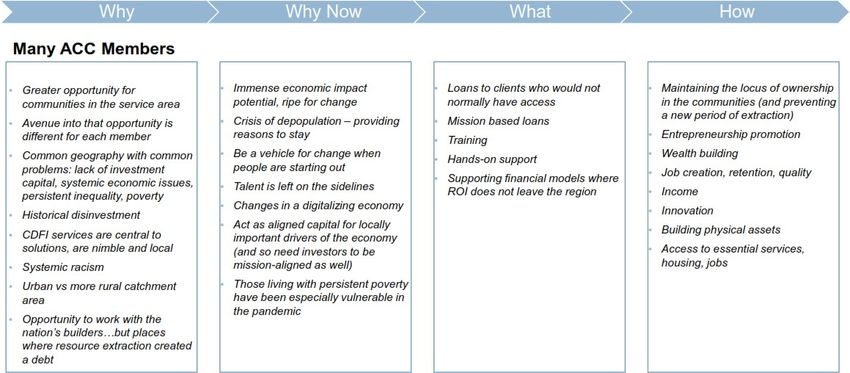
Executive Summary
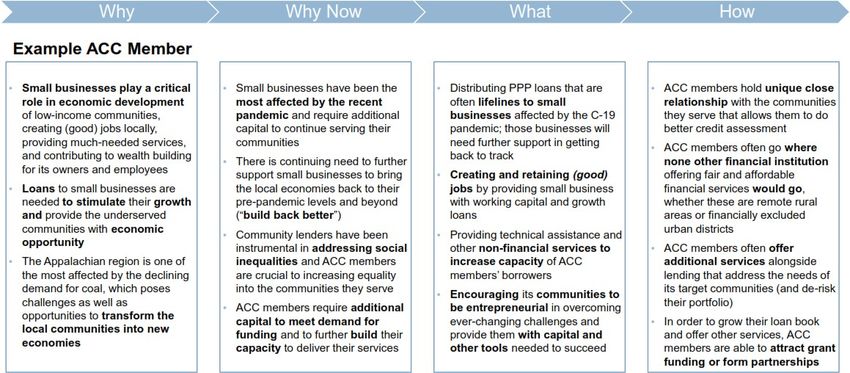
Appalachian Community Capital (ACC) is a network of 24 community development financial
institutions (CDFIs) and other mission-based lenders located throughout the Appalachian region that
works to increase small business lending by providing underserved communities with new sources
of capital. Started in 2013, ACC is a CDFI lending intermediary that raises and deploys capital
through its members. It serves as a clearinghouse that links its members and their clients with
information, funding, training, and technical assistance. It has grown from 11 founding members to
24 members in 2021. It has deployed over $18.5 million in leveraged debt that funded 92 small
business loans and helped to create or retain about 2,000 jobs.
In the summer of 2020, ACC engaged Palladium Impact Capital (PIC) and Woodstock Institute to
conduct an investment assessment of ACC members. The initial project goal was threefold:
• to assess ACC and its members in the context of the Appalachian region
• to identify capital sources and impact investors interested in investing in Appalachia.
• to create a narrative on the impact of capital investments on economic mobility
The objectives of the project were further refined in conversation with ACC’s CEO in the course of
the engagement, including putting more emphasis on some areas than others as the project evolved.
This report presents the findings of our assessment.
Appalachian region
Appalachia is one of the poorest regions in the United States.
The poverty rate in Appalachia is 12% above the national
average. For comparison, the poverty rate in neighboring non-
Appalachian counties (within the states that include
Appalachian counties) is only 4.5% higher than the national
average. The Region does have many rural counties with
primarily white populations and those counties are some of the
poorest in the country. However, 34.8% of the population in the
Appalachian states is non-white and often suffers from poverty
levels as severe. The minority population is growing and is
concentrated in southern Appalachian states and in metro
areas.
Appalachia has historically been financially underserved
compared to the rest of the country. The lower access to credit
and financial services has disproportionately affected small
businesses. Since 2010, the trend for Appalachia has moved in
a positive direction but the data shows that in the same period
CDFI lending increased significantly more in the non-
Appalachian counties. 20% of loans in Appalachia go to women-
owned businesses versus 19% in non-Appalachian counties.
18% of those loans in Appalachia go to minority-owned businesses versus 24% in non-Appalachian
counties.
ACC members
ACC members are growing in size and economic reach. As of YE 2019, total assets from ACC Aeris-
reporting members were more than $740 million representing a 13% compound annual growth rate
between 2015 and 2019. Despite the challenges of the pandemic, ACC members significantly
2 / 49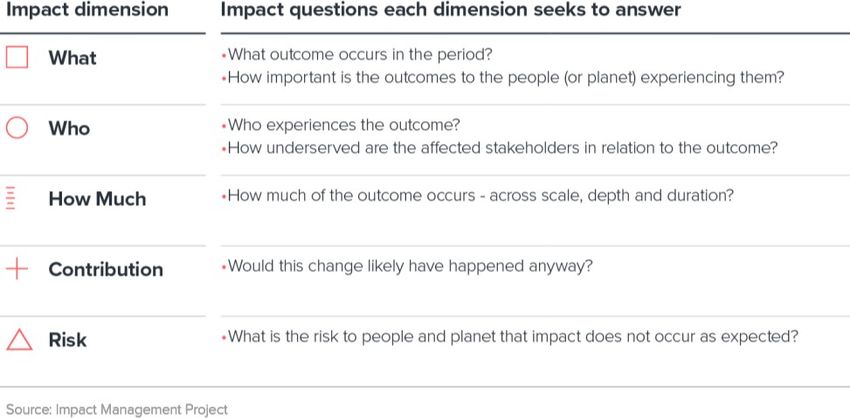
increased loan volume and grew their balance sheets in 2020. However, the need for grant support
and capital continues to be significant.

One of the most important roles played by ACC members is serving as a financing vehicle for small
businesses and non-profits that do not fit traditional bank credit requirements. Each member
defines their loan products and targets borrowers based on their assessment of unmet credit
needs in their market. The decreased presence of community banks in rural areas and their overall
move to larger loans in urban areas makes ACC members critical to the region’s economic
development. ACC members fill credit gaps and define their loan products to meet unmet credit
needs in their markets. ACC members are a critical part of the infrastructure needed to rebuild
local economies in rural Appalachia.

The ability to build trusted relationships with borrowers is the main competitive advantage of ACC
members and one of the key ingredients to their business model. The relationships they develop
with borrowers improve communication between lender and borrower and result in repeat borrowers,
high numbers of client referrals and low levels of defaulted loans. This relationship community
lending is by definition more expensive to underwrite and to service but typically leads to lower levels
of defaulted loans, even though target clients may be viewed as riskier for traditional banks. Instead
of competing, ACC members often forge partnerships and collaborate with other CDFIs and banks
that appreciate having an outlet for borrowers that they cannot service. To further enhance their
ability to reach deeper into unmet credit needs, ACC members develop partnerships with state and
local governments to deliver programs that serve specific markets.

The majority of ACC members are not large enough to achieve economies of scale in their loan
operations and financial performance is stressed by the cost of doing smaller hand-crafted loans to
relatively unsophisticated borrowers. ACC members typically operate through structures allowing
them flexibility in underwriting, product design and revenue streams. As such, ACC members
develop targeted solutions across several business lines: (1) community lending, (2) program/
fund management, (3) fee for service, (4) technical assistance and (5) policy and advocacy.

ACC members are distinguished by having highly committed boards and strong management teams,
relative to size of the institutions. They have seasoned staff with a wealth of experience that would,
however, be relatively hard to replace since talent with relevant background is hard to find, attract,
and train in their service areas. ACC members have varying capacities in terms of technology; for
some it is key advantage, for others – especially small ACC members - it is rather a challenge they
need to address. Nonetheless, the majority of ACC members see digitization as an opportunity and
are working on developing digital strategies.

Self-sufficiency is often unachievable due to the scale and business model of many ACC members,
but they typically have robust levels of self-sustainability that are supported by reliable sources of
grant funding. More unrestricted funding is needed to increase the ability of ACC members to grow
and invest in the institutional capacity.

Appalachian Community Capital

ACC is a CDFI lending intermediary that raises and deploys capital through its member network of
24 community lenders. Its goal is to be a cost effective and highly impactful intermediary that helps
funnel impact investment dollars to its members who then relend to Appalachian small businesses
in need of access to affordable capital to support the revitalization of their communities. ACC’s
activities go beyond its primary purpose and can be divided into three functional areas: (A) capital
intermediation, including capital raising and deployment, portfolio management and investor
relations, (B) member services, including member acquisition and community management, member
services and knowledge sharing, marketing, and communications, and (C) internal functions.

An engaged and growing membership base, a well performing portfolio and a highly regarded CEO
are among the key strengths of ACC. There are also a few challenges that need to be addressed
and turned into opportunities for ACC to thrive. For that to happen, ACC would benefit from renewed
commitment from founding and existing funders as well as new ones that are willing to support

                                                                                                  3 / 49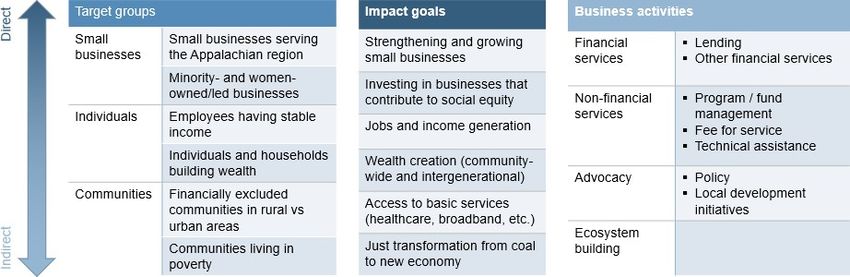
development of the Appalachian region by taking ACC to the next stage. Besides investment capital,
ACC should seek grant funding that would help reinforce its human resources and update its
strategic plan to further build on its strengths and exploit the current attention and market opportunity
for community lenders.

To reach this next stage and expand its impact, ACC will use the grant funding to create a concrete
roadmap, alongside the updated strategic plan, to recapitalize and fund more robust operation in a
continuous and sustainable fashion. It is expected the plan will include detailed projections of the
capital needed in the short and long term by ACC and its members, an enhanced impact narrative
aligned with the current market opportunity, considerations of alternative revenue sources and longer
term staffing needed to execute on the plan.

It is the right time for ACC and its members to be taking this step forward alongside mission-driven
funding and thought partners that are committed to attract more capital into the Appalachian region.

                                                                                                   4 / 49
1. Introduction
Appalachian Community Capital (ACC) is a network of 24 community development financial
institutions (CDFIs) and other mission-based lenders located throughout the Appalachian region that
works to increase small business lending by providing underserved communities with new sources
of capital. Started in 2013, ACC is a CDFI lending intermediary that raises and deploys capital
through its members. It serves as a clearinghouse that links its members and their clients with
information, funding, training, and technical assistance.
ACC has a broad and impactful goal: “to increase small business lending by providing ACC member
institutions that serve underserved people and communities with new sources of capital.” ACC
envisions its commitment “to providing reliable and sufficient capital for all its members” will lead “to
a growing economy, increased entrepreneurship, higher quality jobs and increased local wealth in
the Appalachian region.”1
ACC members are growing in size and economic reach. As of YE 2019, total assets from ACC Aeris-
reporting members were more than $740 million. This represents approximately a 13% compound
annual growth rate between 2015 and 2019. As of YE 2019 total loans outstanding from the reporting
ACC members totaled more than $475 million, approximately a 15% increase between 2015 and
2019, and disbursed more than $750 million.2 Despite the challenges of the pandemic, ACC
members significantly increased loan volume in 2020.
In summer of 2020, ACC engaged Palladium Impact Capital (PIC) and Woodstock Institute to
conduct an investment assessment of ACC members. The project goal was to assess ACC and its
members in the context of the Appalachian region, identify capital sources and impact investors
interested in investing in the Region and create a narrative on the impact of capital investments on
economic mobility. The objectives of the project were further refined in conversation with ACC’s CEO
in the course of the engagement, including putting more emphasis on some areas than others as
the project evolved. This report presents the findings of our assessment. Details on the methodology
are outlined in the Appendix A.1.
1.1. The Appalachian region
Geography and demographics
The ACC service area focuses on the Appalachian region as defined by the Appalachian Regional
Commission (ARC). The region includes 420 counties comprising all of West Virginia, and portions
of Alabama, Georgia, Kentucky, Maryland, Mississippi, New York, North Carolina, Ohio,
Pennsylvania, South Carolina, Tennessee, and Virginia.
1See more at: https://appalachiancommunitycapitalcdfi.org/
2 Based on data reported to Aeris by the following 13 ACC members: Access to Capital for Entrepreneurs
(ACE), Carolina Small Business Development Fund, CommunityWorks, Finance Fund Capital Corp.,
Kentucky Highlands Investment Corporation, LiftFund, Mountain Association, Mountain BizWorks Inc.,
Natural Capital Investment Fund Inc., Pathway Lending, South Carolina Community Loan Fund, Southeast
Kentucky Economic Development Corp., and Virginia Community Capital.
5 / 49The Appalachian region spans over 205,000 square miles (about twice the area of Arizona) in 13
states3 and is home to over 25 million people (about the population of Texas). It is primarily a rural
area with larger towns and a sprinkling of mid-sized cities that serve as regional supply hubs and
retail centers. The economy of Appalachia was built on resource extraction, primarily coal mining,
logging, and agriculture.
Poverty
Appalachia is one of the poorest regions in the United States. According to the Appalachia Region
Commission, the Appalachian average poverty rate is 15.8% almost 2% higher than the U.S.
average of 14.1%.4 Unemployment in the region has been high for decades. In the 1950s and 1960s
a high school graduate could get a good paying job in the coal mines and earn enough to raise a
family and buy a house. Since the 1950s, there has been a steady decline in coal mining jobs and
unemployment and poverty rates have risen as a result. The 2017 unemployment rate in Appalachia
ranged from 3.1% to 15.7%. The pandemic crisis has worsened unemployment and caused many
small businesses to close.
The issues of rural poverty are very evident in inferior housing, inadequate medical care, and low
education levels. A U.S. Department of Education study noted that “overall, educational attainment
is generally lower in the region than nationally, with the proportion of students obtaining a bachelor’s
degree or higher lower in all but one state”.5
Despite the progress made over the last decade, Appalachian states had nearly 5% higher poverty
rate than the U.S. average in 2014-2018 (see Table 1.1). Moreover, the poverty rate in the
Appalachian counties within those states is on average 12% higher than the U.S. average and, as
such, nearly 8% higher than in its non-Appalachian counterparts in the Appalachian states.
While the culture and the history of unemployment and low education levels may lead to the
perception that Appalachia is stuck in time, the region has been undergoing a quiet economic
resurgence over the last decade driven in large part by the ARC’s efforts in economic development.
Key economic indicators of poverty, per capita income, and high school graduation rates are
improving, as well as the number of Distressed Counties6 in the region – in 2021 there were 78
Distressed Counties out of 420 which is the lowest number since the pre-recession year of 2007.
Diversity
There are many stereotypes that exist about Appalachia, including that there are few to no residents
of color. The Region does have many rural counties with primarily white populations and those
counties are some of the poorest in the country. The most severely affected areas are Appalachian
counties in Kentucky (179.7% of U.S. average poverty rate), Ohio (121.1%) and West Virginia
(126.4%). Unfortunately, there is no easily available data on the diversity breakdown between
3 The 13 states are referred in this report as ‘Appalachian states’ although not all their counties are situated
in the Appalachian region. Or in other words, they include both ‘Appalachian counties’ forming the
‘Appalachian region’ and ‘non-Appalachian counties.
4 ARC, Poverty Rates, 2014-2018.
5 U.S. Department of Education, 2016. Identifying and Addressing Regional Education Needs.
6 Distressed County is an index-based economic classification based on (1) three-year average
unemployment rate, (2) per capita market income and (3) poverty rate that is calculated by the ARC and
compared against other counties nationwide. Distressed Counties are those that rand in the worst 10 percent
of the nation’s counties. See more at: https://www.arc.gov/distressed-designation-and-county-economic-
status-classification-system/
6 / 49Appalachian and non-Appalachian counties. However, there are observable trends in the state-level
data. For instance, 34.8% of the population in the Appalachian states is non-white and often suffers
from severe poverty levels. Mississippi’s poverty rate is 46.3% and Virginia’s is 34.4%, both well
above the U.S. average. The minority population is growing and is concentrated in southern
Appalachian states and in metro areas. For example, Memphis, Tennessee now has a majority
minority population with African Americans representing 62% of the population
Table 1.1: Appalachian demography and poverty rates
State Population7 Minority population8 Poverty Rate, of U.S. avg9
State-wide Appalachia State-wide State-wide Appalachia Difference
Alabama 4,742,208 3,038,330 34.5% 124.5% 115.4% -9.1%
Georgia 10,024,689 3,137,027 47.4% 114.1% 90.6% -23.5%
Kentucky 4,302,315 1,128,997 15.4% 127.7% 179.7% 52.0%
Maryland 5,862,050 233,931 49.3% 67.2% 95.1% 27.9%
Mississippi 2,890,347 608,053 43.4% 147.7% 146.3% -1.4%
New York 19,108,993 977,515 44.9% 104.2% 114.7% 10.5%
North Carolina 9,881,292 1,694,665 37.0% 109.7% 114.6% 4.9%
Ohio 11,319,092 1,941,714 21.1% 103.5% 121.1% 17.6%
Pennsylvania 12,380,149 5,487,525 23.6% 90.8% 92.6% 1.8%
South Carolina 4,814,032 1,220,566 36.4% 113.9% 104.1% -9.8%
Tennessee 6,488,786 2,796,656 26.1% 114.8% 118.6% 3.8%
Virginia 8,162,107 717,491 38.3% 77.9% 134.4% 56.5%
West Virginia 1,776,501 1,776,501 8.0% 126.4% 126.4% -
Total 101,752,561 24,758,971 34.8% 104.5% 112.2% 7.8%
1.2. Financial access in Appalachia
The Appalachian region has historically been financially underserved compared to the rest of the
country. A study commissioned by the ARC to assess the effects of the Great Recession provides
this summary:
“Access to banking remained a problem in Appalachia […]. While there was a modest increase in
bank branches in Appalachia between 2007 and 2010, the rate of lending was still much lower than
nationwide, despite regional bank assets of nearly $500 billion. In 2010, banks issued 41 small
business loans per branch across the nation, while in Appalachia, banks provided 25 loans per
7 ARC, Poverty Rates, 2014-2018.
8 U.S. Census Bureau, 2017.
9 ARC, Poverty Rates, 2014-2018.
7 / 49branch. Furthermore, the increase in branches of banks not headquartered in Appalachia
disproportionally occurred in the economically advantaged counties. As a result of all these trends,
small business owners in Appalachia […] were more likely to rely on credit cards and personal
savings to finance their businesses [than their counterparts in the nation as a whole].”10
Moreover, the lower access to credit and financial services in the Appalachian region, especially in
the years following the Great Recession, disproportionately affected small businesses. According to
the ARC-commissioned report, “Small-business lending declined sharply in Appalachia between
2007 and 2010 — from over 800,000 loans totaling $24 billion to 255,000 loans totaling $13 billion.
As a result, the percentage of small businesses receiving loans in Appalachia during this period
trailed the percentage for the nation as a whole.”10
Since 2010, the trend for Appalachian counties has moved in a positive direction – both the number
and total dollar amount of CDFI loans in these counties has significantly increased (see Chart 1.1).
Between 2010 and 2017, the total number of loans increased by 41% (5% CAGR) and their dollar
amount by 62% (7% CAGR) while the average loan amount increased by 15% (2% CAGR). Despite
the positive trend, data from the U.S. Treasury Department’s CDFI Fund shows that in the same
period CDFI lending increased significantly more in the non-Appalachian counties (in Appalachian
states).
Chart 1.1: CDFI lending by year in Appalachian and non-Appalachian counties, 2010-201711
Number of Loans Amount of Loans ($ million) Average Loan Amount ($)
8,000 2,000 350,000
7,000 1,800
300,000
1,600
6,000
1,400 250,000
5,000 1,200
200,000
4,000 1,000
150,000
3,000 800
600 100,000
2,000
400
1,000 50,000
200
0 0 0
2010
2011
2012
2013
2014
2015
2016
2017
2010
2011
2012
2013
2014
2015
2016
2017
2010
2011
2012
2013
2014
2015
2016
2017
Appalachia Non-Appalachia Appalachia Non-Appalachia Appalachia Non-Appalachia
10 ARC and National Community Reinvestment Coalition, July 2013. Access to Capital and Credit in
Appalachia and the Impact of the Financial Crisis and Recession on Commercial Lending and Finance in the
Region. Quote from the Press Release to the report with edits from the authors, see more at:
https://ncrc.org/ncrc-releases-report-on-capital-and-credit-access-for-small-businesses-in-the-appalachian-
region/
11 Data from the Community Investment Impact System (CIIS) collected by the CDFI Fund, 2010-2017.
8 / 49The data shows a similar picture for CDFI lending for the entire period of 2010-2017 (see Table 1.2).
In the 13 Appalachian states, the Appalachian counties received fewer loans by number (on average
7% less) as well as a lower dollar amount of loans (on average 9% less) compared to the population
percentage living in those counties. Similarly, the average loan amounts originated in the
Appalachian counties are lower (on average by 11%) than those being disbursed in the Appalachian
states in aggregate (i.e., including both Appalachian and non-Appalachian counties).
Table 1.2: CDFI lending in Appalachia by state, 2010-201712
State Population Number of loans Amount of loans Average loan amount
Appalachia Appalachia Difference Appalachia Difference Difference
Alabama 64% 72% 8% 70% 6% -2%
Georgia 31% 24% -7% 14% -17% -41%
Kentucky 26% 77% 51% 84% 58% 8%
Maryland 4% 2% -2% 6% 2% 170%
Mississippi 21% 7% -14% 7% -14% -6%
New York 5% 5% 0% 2% -3% -63%
North Carolina 17% 49% 32% 23% 6% -53%
Ohio 17% 5% -12% 6% -12% 13%
Pennsylvania 44% 31% -14% 33% -11% 7%
South Carolina 25% 9% -16% 2% -23% -73%
Tennessee 43% 18% -25% 27% -16% 51%
Virginia 9% 20% 12% 9% 0% -56%
West Virginia 100% 100% 0% 100% 0% 0%
Total 24% 17% -7% 15% -9% -11%
12 Data from the Community Investment Impact System (CIIS) collected by the CDFI Fund, 2010-2017.
‘Difference’ shows the difference between Appalachian and non-Appalachian counties.
9 / 49In the Appalachian region, only 36% of the number of loans and 20% of loan amounts go to women-
owned businesses (see Table 1.3). In terms of number of loans, Appalachia lags behind the state-
wide average (by 5%) but is slightly above the state-wide average in total dollar amount of loans (by
1%). There is a clear disparity in the loan amounts to women-owned businesses compared to loans
going to male-owned businesses across the Appalachian states. The loans in non-Appalachian
counties to women are on average half the amount of loans to men; the situation is marginally better
in the Appalachian counties with ‘only’ a 43% difference.
Table 1.3: CDFI Lending to women in Appalachia by state, 2010-201713
State Number of loans Amount of loans Average loan amount
State-wide Appalachia State-wide Appalachia State-wide Appalachia
Alabama 45% 42% 21% 19% -53% -56%
Georgia 43% 37% 33% 42% -24% 12%
Kentucky 36% 28% 24% 14% -33% -51%
Maryland 37% N/A 19% N/A -50% N/A
Mississippi 49% 43% 18% 3% -64% -92%
New York 45% 27% 37% 11% -16% -58%
North Carolina 42% 46% 15% 28% -64% -39%
Ohio 35% 14% 25% 8% -28% -43%
Pennsylvania 40% 36% 15% 24% -62% -32%
South Carolina 48% 49% 28% 31% -42% -36%
Tennessee 28% 26% 13% 8% -54% -70%
Virginia 32% 40% 33% 23% 5% -42%
West Virginia 33% 33% 15% 15% -56% -56%
Total 41% 36% 19% 20% -54% -43%
13 Data from the Community Investment Impact System (CIIS) collected by the CDFI Fund, 2010-2017;
including only loans with ‘male’ or ‘female’ gender information.
10 / 49On average, minority populations (35% across Appalachian states) receive proportionately a higher
number of loans (57% of state-wide total) than white populations but with much lower dollar amounts
(24% of state-wide total; see Table 1.4). That also results in average loan amounts to minority
borrowers being more than three quarters lower than white borrowers. The relative levels of minority
lending are significantly lower in the Appalachian counties than in the Appalachian states in
aggregate (inclusive of non-Appalachian counties). On the other hand, the difference between
average loan amounts for minority and majority borrowers is not that large in the Appalachian
counties. This is probably due to the lower average loan amounts in those communities overall (refer
to Table 1.2).
Table 1.4: CDFI lending to minority population in Appalachia by state, 2010-201714
State Minority Number of loans Amount of loans Average loan amount
population15
State-wide State-wide Appalachia State-wide Appalachia State-wide Appalachia
Alabama 35% 67% 64% 73% 69% 33% 26%
Georgia 47% 62% 41% 52% 28% -35% -45%
Kentucky 15% 11% 5% 14% 6% 32% 22%
Maryland 49% 67% N/A 41% N/A -65% N/A
Mississippi 43% 36% 92% 17% 94% -64% 31%
New York 45% 79% 66% 45% 87% -79% 234%
North Carolina 37% 50% 34% 19% 16% -76% -64%
Ohio 21% 49% 29% 25% 12% -64% -66%
Pennsylvania 24% 42% 28% 18% 19% -70% -40%
South Carolina 36% 56% 67% 31% 46% -64% -58%
Tennessee 26% 32% 13% 17% 10% -55% -29%
Virginia 38% 33% 3% 31% 1% -9% -65%
West Virginia 8% 7% 7% 8% 8% 19% 19%
Total 35% 57% 29% 24% 18% -76% -48%
14 Data from the Community Investment Impact System (CIIS) collected by the CDFI Fund, 2010-2017;
excluding loans with ‘blank’ race information.
15 Includes only loans going to non-white borrowers.
11 / 492. Assessment of ACC and its members
2.1. Appalachian Community Capital
ACC was launched in 2013 as a wholesale finance intermediary with the mission to increase small
business lending in the Appalachian Region by providing its members and other high-performing
loan funds in the region with new sources of capital. Any capital intermediated by ACC to its members
must be deployed in the 420 Appalachian counties as defined by ARC.
By year-end 2020, ACC had deployed over $18.5 million in leveraged debt that funded 92 small
business loans in Appalachia that helped to create or retain about 2,000 jobs. 40% of the loans were
made to minority- or women-owned businesses.
In addition to its primary focus on bringing new sources of capital to Appalachia, ACC has been
providing a broad range of other services designed to strengthen the organizational capacity of
member (and non-member) institutions, providing them with technical assistance, facilitating
knowledge sharing, and promoting the important work for their communities through conferences
and thought leadership.
ACC was recognized by Forbes as one of the top 20 Opportunity Zone catalysts in the country in
2020.
2.1.1. Functional areas and capacity
ACC’s activities can be divided into three functional areas: (1) Capital intermediation, (2) Member
services, and (3) Internal functions. “Internal functions” involves everyday administrative tasks as
well as strategic planning.
Table 2.1: ACC’s functional areas16
Functional Functions Selected activities Lead Support
area
Capital Capital raising Debt: From solicitation to CEO CONT
intermediation closing
Grant: Proposal writing
Capital deployment and Loan committee meetings CEO CONT
portfolio management Portfolio analysis
Investor relations and Regular investor interactions CEO
reporting Report preparation and
upload
Member Member acquisition and Growth of membership CEO
services community management Membership communications
Member services and Workshops, trainings CEO
knowledge sharing Technical assistance
Marketing and Articles, success stories CEO CONT
communications Conferences, events
16 Legend: CONT = Contractor; SVP FIN = Senior Vice President, Finance; OA = Opportunity Appalachia.
12 / 49Special projects OA, emergency grants CEO
Internal Strategy and governance Strategic plan, board CEO CONT
functions meetings
Finance and admin Budget, audit, admin CEO SVP FIN
ACC currently has only one full-time employee, its CEO, who is supported by a pool of contractors,
such as a Senior VP-Finance, underwriters, and grant writers, as well as Virginia Community Capital, a
CDFI that provides back office support. Nonetheless, the majority of the functional areas is led and
staffed solely by the CEO.
2.1.2. Strategic plans and business model
ACC was launched with a strategic plan anticipating that it would raise $6 million in grant and $42
million in debt capital. ACC’s initial fund-raising efforts fell short of these goals. In 2015, when ACC
closed its initial fundraising campaign, it had raised $3.4 million in grant and $12 million in debt
capital. Since 2015, ACC has been able to attract additional grant capital and disburse a total of
$18.2 million in loans to its members.
In 2019, ACC revised its strategic plan and set targets to attract an additional $28.4 million in new
capital that would allow it to diversify its portfolio (by increasing its share in loan participations) and
improve earned revenues. It prioritizes Capital intermediation, with ACC’s fundraising strategy being
the main area of focus.
The plan outlines a fundraising strategy with a clear timeline and targets. Very limited consideration
is given to alternative revenue streams, membership growth, type and level of Member services and
the human capital capacity needed to deliver on the plan. Similarly, the projections for the 2019 plan
do not provide a more detailed breakdown of financial assumptions and results by functional area.
Specific points for consideration include whether and when Capital intermediation may be self-
sufficient – on its own and when including expenses related to Internal functions – and how Member
services can be funded – whether solely through grants, or through a combination of grants,
membership fees, and contributions from Capital intermediation.
A clearer delineation of needed revenue streams and functional expenses would allow ACC to better
justify its asks to donors for strategic activities and help its members better understand what value
they receive for their membership fees. The latter is particularly relevant as larger ACC members
that have capacity to raise their own capital do not view themselves as strategically dependent on
ACC for capital raising and have less incentive to provide additional resources for ACC to build its
capacity. On the other hand, smaller ACC members that are more dependent on ACC for capital
raising do not have the resources to invest in ACC’s capacity.
Despite limited insight into assumptions underlying the strategic plan, the outlined fundraising
strategy seems rather ambitious given ACC’s existing resources, yet it may not bring ACC to the
desired level of financial self-sufficiency based on earned income from Capital intermediation.
2.1.3. Key strengths and weaknesses
ACC has a solid membership base composed of impressive and diverse institutions serving the
Appalachian region. Furthermore, over the past few years it has succeeded in attracting new
13 / 49members – increasing the membership from 11 founding members in 2014 to 19 members in 2019
and 24 members in 2021.
Although levels of engagement vary across the membership, member participation in sessions
organized by ACC is high and members find value in them. During interviews conducted as part of
this assessment, ACC members spoke very positively about ACC and the role it plays in supporting
their efforts. The strength of ACC’s membership is further evidenced by the good performance of its
portfolio of loans to members. To date, ACC has experienced no charge-offs or non-accruals as it
continues to lend in underserved communities in Appalachia.
ACC is led by a well-connected CEO who is one of the highest regarded leaders of the CDFI industry.
Through its CEO, ACC is often showcased at various conferences, events, and forums.
However, ACC has not been successful in raising the amounts of capital as planned. The reasons
for that are both external, e.g., the general limited interest in investing in Appalachia by traditional
CDFI investors, and internal, particularly due to limited human and financial resources.
2.2. ACC members
ACC members span the Appalachian region, from New York state in the Northeast (Alternatives
FCU) to Mississippi in the South (Three Rivers Planning and Development District). ACC members
for the most part have a focused footprint that rarely crosses state boundaries. They serve
communities as diverse as the Appalachian region itself, from urban markets in the metro areas of
Georgia and Tennessee to remote rural areas of Kentucky. The majority of ACC members operate
in Appalachian counties alongside other, often adjacent, markets. A minority of ACC members focus
exclusively on the Appalachian counties (e.g., Mountain Association, Mountain BizWorks, Kentucky
Highlands Investment Corporation).
The markets served strongly influence the nature of the CDFIs. Most ACC members serving
predominantly rural areas remain relatively small, with the exception of Kentucky Highlands, and
face challenges attracting the right talent to serve remote, rural areas. These rural areas tend to be
composed of lower income communities and have smaller, and in some cases no, minority
populations compared to the urban areas. All medium to large ACC members serve some urban
areas which has allowed them to scale more easily. However, serving urban areas comes with
another set of challenges including increased competition for clients and talent.
Geographic focus and size are key criteria in a more detailed analysis of the ACC membership (see
Table 2.2) and allows us to better understand their diversity, stage of development, and the related
challenges they typically face.
14 / 49Table 2.2: Categorization of ACC members by geographic focus and size
Category17 Members Description
Small Mountain Association Small institutions serving exclusively rural markets
Mountain BizWorks
rural
People Inc
SKED
Three Rivers Planning and Dev Facing limitations of local talent pools and low capacity to invest
Woodlands Com Lenders
in systems
Small Appalachian Dev Corp Mostly reliant on grant funding and below market debt capital
Appalachian Growth Capital
General
CommunityWorks
Piedmont Business Capital Small institutions serving urban markets and adjacent rural areas
Sabre Finance
Medium Access to Capital for Institutions serving multiple rural and urban markets
Entrepreneurs On the trajectory to scale up and become more self-sufficient
Carolina Small Biz Dev Fund Looking for new capital for further growth
Finance Fund Capital Corp
Natural Capital Inv Fund
SC Community Loan Fund
Large Alternatives FCU Established institutions with refined business models and strong
Bridgeway Capital teams and systems
Kentucky Highlands Inv Corp Being or close to becoming self-sufficient
Pathway Lending Stable capital raising channels and seeking diversification
Virginia Community Capital
2.2.1. Target markets and peers
The markets that ACC members serve are highly differentiated. Some members are lending in rural
areas traditional banks are leaving creating “banking deserts”. For example, Mountain BizWorks
serves 26 counties in North Carolina which are rural and mountainous. More than 60% of community
banks in this area have closed branches over the last six years and the remaining banks are
retreating from originating smaller loans. The gap left by the more traditional institutions is being
filled by alternative lenders, such as payday lenders and (to a lesser extent) digital platforms that
provide only standard products that are often usurious and not best suited to the client needs.
Some ACC members, on the other hand, are lending in urban areas where larger and well capitalized
borrowers are well served by traditional banks. There are few large national banks with a footprint in
the region but there are strong regional banks that are expanding and compete with some local
community banks for commercial customers. However, traditional underwriting standards limit their
lending to the most profitable customers. Community banks, on the other hand, often work in
partnership with ACC members. For example, Pathway Lending serves four urban markets in
17 Classificationto small, medium, and large is made based on the size of the institution’s loan portfolio (LP)
with the following criteria. Small: LP < $15m; Medium: $15m < LP < $40m; Large: $40m < LP. Classification
to rural and general is based on responses of the ACC members participating in a survey conducted by the
authors; members unable to participate in the survey were classified based on publicly available information.
15 / 49Tennessee and two in Alabama. It often lends to borrowers that do not meet traditional bank credit
criteria and about 75% of its loan applications are referred by community bank partners.
Table 2.3: Market characteristics by ACC member category
Category18 Market competition Competition type Competitive offerings
Small Competition only for most A wide range of financial Only very standard products
profitable customers (80%) service providers available (60%)
rural
Higher levels of payday
lenders and digital platforms
Small Very few lenders (75%) Mainly banks and CUs Wider range but too
Higher levels of payday conservative underwriting
general
lenders, not digital platforms (75%)
Medium Varying levels of competition Mainly mainstream banks Wider range but too
conservative underwriting
(75%)
Large Extremely competitive (67%) A wide range of financial Wide range of product
service providers offerings
Not digital platforms
ACC members fill credit gaps and define their loan products to meet unmet credit needs in their
markets. Both CommunityWorks and Mountain Association specialize in micro loans to sole
proprietors and very small businesses. Other ACC members seek out historically underserved
businesses with a particular focus on minority- and women-owned businesses. The decreased
presence of community banks in rural areas and the overall move to larger loans in urban areas
makes ACC members critical to the region’s economic development.
2.2.2. Business model
The vast majority of ACC members are non-profit loan funds, and they tend to share a similar
business model. ACC members are not only community lenders, but also typically have multiple
business lines to support their communities and to improve their own operational sustainability.
Relationship community lending
ACC members are relationship lenders that work with borrowers to build trusting partnerships that
provide the business insight needed to supplement standard underwriting processes while managing
risk. They secure grant funding and debt capital to support their lending and to help defray the cost
of technical assistance.
The ability to build trusted relationships with borrowers is the main competitive advantage of ACC
members. The partnerships they develop improve communication between lender and borrower and
result in repeat borrowers and low levels of defaulted loans. The strong relationships with existing
18 Classification to small, medium, and large is made based on the size of the institution’s loan portfolio
(LP)with the following criteria. Small: LP < $15m; Medium: $15m < LP < $40m; Large: $40m < LP.
16 / 49clients result in high numbers of new client referrals. Over 90% of ACC members rely on word-of
mouth marketing.
Chart 2.1: Marketing channels of ACC members
How do you market your products and services?
Word of mouth
Online
Financial advisors
Newspaper, radio, TV
0% 10% 20% 30% 40% 50% 60% 70% 80% 90% 100%
ACC members provide significant flexibility on payment terms and work closely with borrowers when
they encounter obstacles in repaying their loans. However, ensuring the stability of the loan portfolios
is key to the survival of the institution so delinquency and default rates are monitored closely so that
they stay within typical CDFI ranges.
Structures allowing flexibility
Two ACC members are structured as regulated financial institutions: Virginia Community Capital is
a state-chartered bank in Virginia and Alternatives FCU is a federally chartered credit union based
in New York. All other ACC members are structured as unregulated community loan funds. This
structure provides them the freedom to offer flexibility in underwriting and product design. To provide
itself with that flexibility, Virginia Community Capital has a nonregulated revolving loan fund as a
companion lender to its bank.
Forging partnerships
ACC members do not compete based on price or product. They often collaborate with other CDFIs
and banks. Local, regional and community banks are an especially important source of debt capital
and grant funding for many ACC members. Because banks are obligated under the Community
Reinvestment Act to meet the credit needs of low- and moderate-income communities in their service
areas, local banks refer borrowers to ACC members to expand their outreach to businesses that
need smaller loans and take more time to underwrite. Filling this niche is the goal of ACC members
and the banks appreciate having an outlet for borrowers that they cannot service.
The majority of ACC members are certified CDFIs and can secure capital and grant funding from the
CDFI Fund as well as other federal government sources. Most ACC members have a good
relationship with state government which is a source of debt capital and referrals. The goal of one
17 / 49ACC member, for instance, is to serve as the distribution channel for municipal funds for small
businesses.
All ACC members reported they partner with other institutions including banks, foundations, non-
profit organizations, state agencies, municipalities, and other technical assistance providers. Sixty
percent of ACC members have one or more close affiliates that support them in furthering their
mission.
Designing targeted solutions across several business lines
ACC members are often required to design a special loan pool, a special loan product, and/or open
new loan offices to secure needed capital. This requires investment to support increased lending
and build the needed infrastructure. As a result, ACC members now mostly require companion grant
funds to support their lending, not just debt capital. Two members reported that it takes about three
years to get a new loan office to break even at the cost of $250,000 a year. Without grant support
they cannot afford to expand.
This requires investment to support increased lending and to build the needed infrastructure to meet
the conditions of the funder. As a result, some ACC members now require companion grant funds
to support their lending, not just debt capital. Two members reported that it takes about three years
to get a new loan office to break even at the cost of $250,000 a year. Without grant support they
cannot afford to expand.
Some specialized loan pools are place-based. Pathway Lending has four loan pools targeted at
specific geographies: Memphis, Knoxville, Knox County, and Alabama. Some are designed to meet
specific impact goals. Mountain Association offers energy audits coupled with loans for needed
upgrades to save on energy bills. Their business customers have installed solar panels, energy
efficient equipment, and realized thousands of dollars in energy bill savings. CommunityWorks offers
affordable housing loans to community developers and non-profit organizations. Some are focused
on specific demographics. Many operate business development centers for women and at least one
for minority-owned businesses.
Technical assistance is another competitive advantage for ACC members. The assistance they offer
helps strengthen small business customers and provides the support they need to grow and thrive.
ACC members provide technical assistance to borrowers before and after loan origination to
backstop unsophisticated business plans and insufficient record keeping. Technical assistance can
include advice on business processes, help with debt structures, and cash flow priorities.
Table 2.4: Business lines of ACC members
Business lines Description Key features Funding sources
Community Traditional community lending based on Strong relationships Debt, incl. CRA
strong relationships, providing affordable Flexible terms Grants (various
lending
financing with focus on small businesses sources)
Program / fund Management of state and municipal Leveraging on-the-ground State
programs (may include both debt and grant knowledge, underwriting Municipalities
mgmt.
funding, processing applications and and portfolio management
managing related interventions) expertise
Fee for service Consultancy and other professional Tailored solutions for Municipalities
services leveraging ACC members’ target communities Corporations
proximity to communities and ability to
design and implement impactful solutions
18 / 49Technical Provision of business and other trainings to Typically provided Grants (various
the clients alongside other business sources)
assistance Often includes affiliated accelerators and lines
development centers
Policy and Influencing and advising policies critical for Policy changes unlock or Grants (various
delivering impactful community hamper impact at scale sources)
advocacy
interventions High level of uncertainty
Promoting the case for community lenders and ‘indirect’ outcomes
ACC members serve as a bridge between the unmet credit needs of small businesses and impact
investors. They have the capacity to identify specialized niches, design specialized loan products
and move quickly to meet the needs of their borrowers. They also often partner with local
governments to design and implement economic development programs in their communities.
2.2.3. Operations
This section looks at some key operational considerations of ACC members across four broader
areas.
Governance and management
ACC members have strong governing boards that provide strategic guidance, fiduciary oversight,
and market intelligence (see Chart 2.1). The CEOs value their board’s advice and guidance. The
area where some ACC members want to strengthen board skills is loan portfolio management. They
are anticipating weaknesses in their loan portfolios in 2021 due to the impact of the pandemic on the
overall economy and see value in board members who have experience to augment staff skills in
managing higher delinquencies and defaults.
Chart 2.2: ACC members have balanced Boards and strong management teams19
Our management capacity is sufficient to
undertake and grow the business according to the
strategic plan?
Strongly agree
Agree
Neither agree nor disagree
Disagree
Strongly disagree
0% 20% 40% 60% 80%
19 Basedon survey conducted for this report across ACC members. See Appendix for more detail about the
methodology.
19 / 49Our institution has a balanced Board that has the
right mix of skills and backgrounds and is actively
overseeing the business?
Strongly agree
Agree
Neither agree nor disagree
Disagree
Strongly disagree
0% 20% 40% 60% 80%
Strategic planning is a well-established discipline among ACC members although several have
delayed the creation of a new strategic plan until later in 2021 when the impact of COVID becomes
clearer. The capacity for strategic planning is heavily dependent on the size of the institution – wider
teams at larger ACC members allow for well thought-through strategies, whereas smaller institutions
suffer from the lack of capacity in their current team. Capacity development grants for strategic
planning will be helpful in 2021 particularly to those institutions. All the CEOs interviewed anticipate
balance sheet growth and institutional expansion over the next three years. Despite the potential
negative impact of COVID on the economy in 2021 they remain optimistic about the future.
Organizational structure and talent
Due to the specific features of the ACC members’ business models, they need to attract and retain
mission-aligned and high-quality talent. While ACC members report that they have access to the
talent they need (see Chart 2.2), many face challenges in recruiting new talent to grow the team or
replace departing staff. The barriers to recruitment include the inability to compete with banks on
total compensation; the perceived and real disadvantages of rural locations, especially in finding
talent with required financial and technical expertise; and the need to find staff that are committed to
the mission of the organization. Several ACC members would appreciate having more CDFI training
opportunities for their employees, for both junior and senior staff. Often staff come from outside the
CDFI industry and training in CDFI principles and practice would be helpful.
Several ACC members are reliant on seasoned, long-term core staff who would be extremely hard
to replace should they leave the organization. They recognize this risk, but limited budgets make it
difficult to deepen their talent pool.
Chart 2.3: Access to talent by ACC members20
20 Basedon survey conducted for this report across ACC members. See Appendix for more detail about the
methodology.
20 / 49Do you have access to the talent that you need to effectively run your
organization?
Agree
Strongly agree
Neither agree nor disagree
Disagree
Strongly disagree
0% 20% 40% 60% 80%
Technology
Operational capacity differs across the membership with probably the most glaring variance in
technology infrastructure. The immediate need to switch to remote working due to the pandemic
spotlighted the technology gaps between members. Several members have invested in technology
upgrades over the years and were well positioned to quickly pivot to remote working and online
lending. For example, Pathway Lending began to invest in its technology platform in 2002. It
originates loans through Salesforce and has real time dashboards for financial reporting. It has had
lenders working remotely across its broad service area for years. The impact of the pandemic on its
workforce was lessened by its strong technology infrastructure.
Others have older technology and are looking to improve both their back-end and front-end systems.
On the back end, some do not have robust digital systems to manage loan processing and servicing
in a remote work environment. On the front-end, the key challenge is subpar client-facing web
interface and inadequate means of collecting impact and financial information from clients. A few
ACC members face challenges integrating the various digital platforms used. Being smaller players
with limited IT support and reliance on third party providers causes additional challenges. ACC
members appreciate that with ongoing digitization comes increased IT risk that they need to manage.
Since the COVID crisis forced a pivot to remote working, ACC members’ clients have significantly
increased the usage of digital communication channels. Most ACC members now accept online loan
applications, and many are able to process, disburse and/or service loan requests online.
21 / 49Chart 2.4: Technological capacity21 of ACC members and uptake of digital channels by clients
How would you classify the IT systems of your What was the share of customers using digital
institution? channels at the following dates?
Mid 2020 End of 2019
State of the art 75-100%
Fully sufficient 50-75%
Somewhat sufficient 25-50%
Insufficient 0-25%
0% 20% 40% 60% 80% 0% 20% 40% 60% 80%
While some ACC members report dealing with less than adequate technology, 87% of ACC
members are developing new digital strategies and planning to invest in technology. Two thirds of
ACC members expect the move towards digital financial services to benefit their institutions. ACC
members are resilient and have found ways to adapt to COVID including with quick technology
upgrades, but this is one area where capacity grants in 2021 would be helpful.
Impact Management
ACC members’ impact management and measurement are mostly driven by investor requirements,
with only a few ACC members having a fully developed impact framework tightly aligned with their
strategy. Many ACC members measure their efficacy primarily through financial and business
indicators and report their impact on a case-by-case or anecdotal basis. Borrower stories are a
common impact reporting measure and one that impact investors appreciate. A few ACC members
measure the achievement of their mission against a wide range of impact metrics. The most
prevalent impact measure is the number of jobs sustained. Sixty percent of ACC members report
racial equity metrics and over 50% report gender metrics.
21 Full versions of the offered response options read: State of the art (one of the key strengths of the
institution), Fully sufficient (able to meet the needs of the institution but not exceeding the basic
requirements), Somewhat sufficient (causing occasional challenges), Insufficient (causing regular operational
challenges).
22 / 49Chart 2.5: Selected impact criteria/ metrics used in everyday operations
Do you use any of the following criteria in defining your strategy and in
your everyday operations?
Racial equity
Gender
Environmental
LGBTQ
Other
0% 20% 40% 60% 80% 100%
23 / 492.2.4. Loan portfolio
The loan portfolios of ACC members have similar delinquency/default characteristics as other CDFIs.
Although the 30-day delinquencies are higher than those of traditional banks, they remain solid given
the risk profile of their target clients. Between 2017 and 2019 the average 30-day delinquency rate
for ACC members was 3.0% and average net charge offs were only around 1.0%. The cited drivers
of bad loans between 2017-2019 were local market conditions (62%) and macroeconomic factors
(38%). This changed with the pandemic, in 2020 the key driver of delinquencies was the impact of
COVID 19 (62%) followed by local market conditions (46%).
COVID has negatively impacted ACC member loan portfolios. In the spring of 2020 loan deferrals
were high, and some members did routine deferrals to help borrowers survive the crisis. Since April
2020, ACC members originated high volumes of Paycheck Protection Program (PPP) loans and
Rapid Recovery loans funded by state CARES Act money. These relief loans reduced the number
of loan deferrals and, in some cases, improved delinquency rates relative to 2019. Several ACC
members reported that the small number of loans that were on their watch lists during the COVID
crisis were already troubled before the pandemic started.
Chart 2.6: Effects of COVID on ACC members’ target clients and portfolios
What is your projection for loan portfolio Which statement most closely describes the mid-
performance? 2020 condition of small businesses in your markets
compared to end of 2019?
End 2021 End 2020
Strongly improve Only certain Some Most
sectors businesses businesses
Somewhat improve
Severely
Stay the same 14% 36% 43%
impacted
Somewhat deteriorate
Modestly
Strongly deteriorate 7%
impacted
0% 20% 40% 60% 80%
The CARES Act is a major reason that borrowers and ACC members have been able to weather the
COVID crisis. Most ACC members (71%) received a PPP loan and/or a Rapid Recovery loan. Many
made PPP loans and/or Rapid Recovery Loans to their borrowers (71%). Several became
distribution channels for local and state pandemic relief loans and grants. While these loans helped
borrowers to weather the initial financial impact of the shutdown, ACC members see a need for
working capital loans and grant funding for their clients in 2021.
The institutional impact of the rapid deployment of new loan capital and grant funds has been
significant. 2020 loan volume has often been several times higher than in previous years, but staff
have responded very positively. During 2020, many ACC members have doubled, or tripled loan
originations compared to 2019. Simultaneously they have created new partnerships and products
and reinvented their working methods. One example is the Carolina Small Business Development
Loan Fund that in seven months originated 210 loans with an average loan size of $26,000. At the
same time as they ramped up lending, they became a distribution channel for grants from local
government and developed new partnerships with local universities, city, county and state
governments and private foundations.
24 / 49As a result of the dramatic increase in the number of loans originated and the decrease in loan
delinquencies, 2020 revenues have increased significantly. Many of the ACC members are wisely
increasing their loan loss reserves.
In addition to the hands-on approach that allows close monitoring of loans and facilitates risk
mitigation, most ACC members have good risk management systems. While none are at a size
where they undertake enterprise-wide risk assessments, all carefully monitor portfolio risk.
Chart 2.7: Levels of risk management systems of ACC members
How would you self-assess your risk management practice?
Equal to the best industry standards
Fully sufficient
Somewhat sufficient
Insufficient
0% 20% 40% 60% 80%
25 / 49You can also read