The early bird catches the term: combining twitter and news data for event detection and situational awareness
←
→
Page content transcription
If your browser does not render page correctly, please read the page content below
Thapen et al. Journal of Biomedical Semantics (2016) 7:61
DOI 10.1186/s13326-016-0103-z

 RESEARCH                                                                                                                                     Open Access

The early bird catches the term:
combining twitter and news data for event
detection and situational awareness
Nicholas Thapen*             , Donal Simmie and Chris Hankin

  Abstract
  Background: Twitter updates now represent an enormous stream of information originating from a wide variety of
  formal and informal sources, much of which is relevant to real-world events. They can therefore be highly useful for
  event detection and situational awareness applications.
  Results: In this paper we apply customised filtering techniques to existing bio-surveillance algorithms to detect
  localised spikes in Twitter activity, showing that these correspond to real events with a high level of confidence. We
  then develop a methodology to automatically summarise these events, both by providing the tweets which best
  describe the event and by linking to highly relevant news articles. This news linkage is accomplished by identifying
  terms occurring more frequently in the event tweets than in a baseline of activity for the area concerned, and using
  these to search for news. We apply our methods to outbreaks of illness and events strongly affecting sentiment and
  are able to detect events verifiable by third party sources and produce high quality summaries.
  Conclusions: This study demonstrates linking event detection from Twitter with relevant online news to provide
  situational awareness. This builds on the existing studies that focus on Twitter alone, showing that integrating
  information from multiple online sources can produce useful analysis.
  Keywords: Twitter, Situational awareness, Event detection

Introduction                                                                         sources would have to be tracked. These are usually pub-
Updates posted on social media platforms such as Twitter                             lished with some lag time, and any system monitoring
contain a great deal of information about events in the                              them programmatically would require customisation for
physical world, with the majority of topics discussed on                             each source since they are not formatted in any standard
Twitter being news related [1]. Twitter can therefore be                             way. Twitter provides a real-time stream of information
used as an information source in order to detect real                                that can be accessed via a single API. In addition a rich
world events. The content and metadata contained in the                              variety of sources publish information to Twitter, since it
tweets can then be leveraged to describe the events and                              is a forum both for the traditional media and for a newer
provide context and situational awareness. Applications                              brand of citizen journalists [5]. Tweets also contain meta-
of event detection and summarisation on Twitter have                                 data that can be mined for information, including location
included the detection of disease outbreaks [2], natural                             data, user-supplied hashtags and user profile information
disasters such as earthquakes [3] and reaction to sporting                           such as follower-friend relationships. The primary draw-
events [4].                                                                          back of using Twitter is that it is an unstructured source
  Using the Twitter stream for event detection yields a                              that contains a great deal of noise along with its signal.
variety of advantages. Normally in order to automatically                            Tweets can be inaccurate as a result of rumour, gossip or
detect real-world events a variety of official and media                             active manipulation via spamming.
                                                                                        In this paper we apply existing bio-surveillance algo-
*Correspondence: nicholas.thapen@imperial.ac.uk                                      rithms, which are those used to detect outbreaks of illness,
Institute for Security Science and Technology, Imperial College London,
Exhibition Road, London, UK                                                          to detect candidate events from the Twitter stream. We

                                         © 2016 The Author(s). Open Access This article is distributed under the terms of the Creative Commons Attribution 4.0
                                         International License (http://creativecommons.org/licenses/by/4.0/), which permits unrestricted use, distribution, and
                                         reproduction in any medium, provided you give appropriate credit to the original author(s) and the source, provide a link to the
                                         Creative Commons license, and indicate if changes were made. The Creative Commons Public Domain Dedication waiver
                                         (http://creativecommons.org/publicdomain/zero/1.0/) applies to the data made available in this article, unless otherwise stated.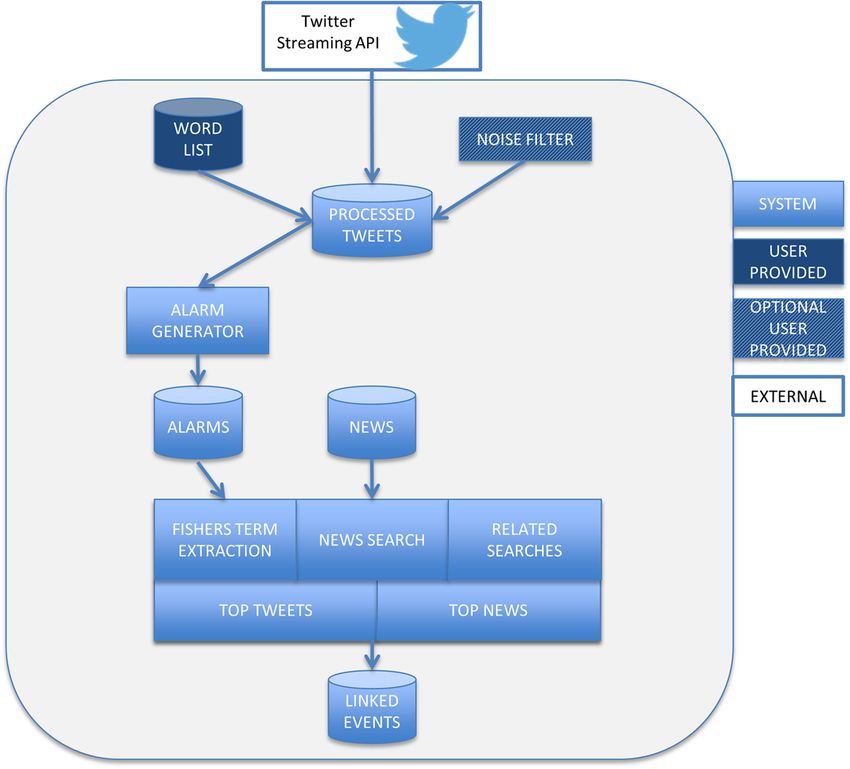
Thapen et al. Journal of Biomedical Semantics (2016) 7:61                                                       Page 2 of 14

employ customised filtering techniques to remove spu-           Diaz-Aviles et al. also attempted to summarize out-
rious events. We then extract the terms from the event        break events by selecting the most relevant tweets, using a
tweets which best characterise the event and are most effi-   customized ranking algorithm. Other studies which have
cacious in retrieving related news. These terms, in the       summarised events on Twitter by selecting the most rele-
form of unigrams and bigrams, are used to filter and rank     vant tweets include [4] and [16]. Analysis of using Twitter
the most informative tweets for presentation to the user      for situational awareness has been carried out in [17]
along with the most relevant news articles. Where the         and [18].
news articles cover the exact event being discussed on          There have been fewer related works on linking or sub-
Twitter they act as direct confirmation and explanation       stantiating events detected from Twitter with traditional
for the event. Where a Twitter event has not yet been cov-    news media. One study [19] analysed various methods
ered in the news media related background articles can        of contextualizing Twitter activities by linking them to
still provide additional context.                             news articles. The methods they examined included find-
  Our techniques are evaluated using two case studies,        ing tweets with explicit URL links to news articles, using
both using a dataset of geo-located tweets from England       the content of tweets, hashtags and entity recognition.
and Wales collected in 2014. The primary case study is the    The best non-URL based strategy that they found was
detection of illness outbreak events. We then generalise      the comparison of named entities extracted from news
our techniques to events strongly affecting Twitter sen-      articles using OpenCalais with the content of the tweets.
timent, such as celebrity deaths and big sports matches.
We evaluate our event detection using ground truth data       Methods
in the form of health practitioner and news reports. The      Problem definition
situational awareness techniques are evaluated by com-        Our definition of a real-world event within the context of
parisons to existing term extraction methods and human-       Twitter is taken from [8], with the exception that we have
coded event explanations.                                     added a concept of event location. We are interested in
                                                              only those events that attract discussion on Twitter, since
Background                                                    all others would be invisible to our methods.
Much of the work on event detection using social media        Definition 1. (Event) An event is a real-world occurrence
has focused on using topic detection methods to iden-         e with (1) an associated time period Te and (2) a time-
tify breaking news stories. Streaming document similarity     ordered stream of Twitter messages Me , of substantial
measures [6], [7] and online incremental clustering [8]       volume, discussing the occurrence and published during
have been shown to be effective for this purpose. These       time Te . The event has a location Le where it took place,
methods have no concept of location, and focus purely on      which may be specific or cover a large area, and the mes-
picking up distinct events being discussed in the general     sages have a set of locations LM1 ,. . . ,LMn which they were
stream of Twitter data.                                       sent from.
   Other approaches have aimed to pick up more localised         From the above definition, when given a time-ordered
events. These have included searching for spatial clus-       stream of Twitter messages M, the event detection prob-
ters in tweets [9], leveraging the social network structure   lem is therefore one of identifying the events e1 ,. . . ,en
[10], analysing the patterns of communication activity        that are present in this stream and their associated time
[11] and identifying significant keywords by their spatial    periods Te and messages Me . It is also valuable to iden-
signature [12].                                               tify the primary location or locations LMi that messages
   In the field of disease outbreak detection efforts have    have originated from, and if possible the event location
mostly focused on tracking levels of influenza by com-        Le . The situational awareness problem is one of taking
paring them to the level of self-reported influenza on        the time period Te and messages Me and producing an
Twitter, in studies such as [13] and [14]. Existing dis-      understandable summary of the event and its context.
ease outbreak detection algorithms have also been applied
to Twitter data, for example in a case study [15] of          Overview
a non-seasonal disease outbreak of Enterohemorrhagic          Our approach to the event detection problem incorpo-
Escherichia coli (EHEC) in Germany. They searched for         rates location by detecting deviations from baseline levels
tweets from Germany matching the keyword “EHEC”, and          of tweet activity in specific geographical areas. This allows
used the daily tweet counts as input to their epidemic        us to track the location of messages relating to events, and
detection algorithms. Using this methodology an alert for     in some cases determine the event location itself.
the EHEC outbreak was triggered before standard alert-          In this paper we focus on two distinct types of event:
ing procedures would have detected it. Our study uses a
modified and generalised version of this event detection        • Outbreaks of symptoms of illness, such as coughing
approach.                                                         or itching.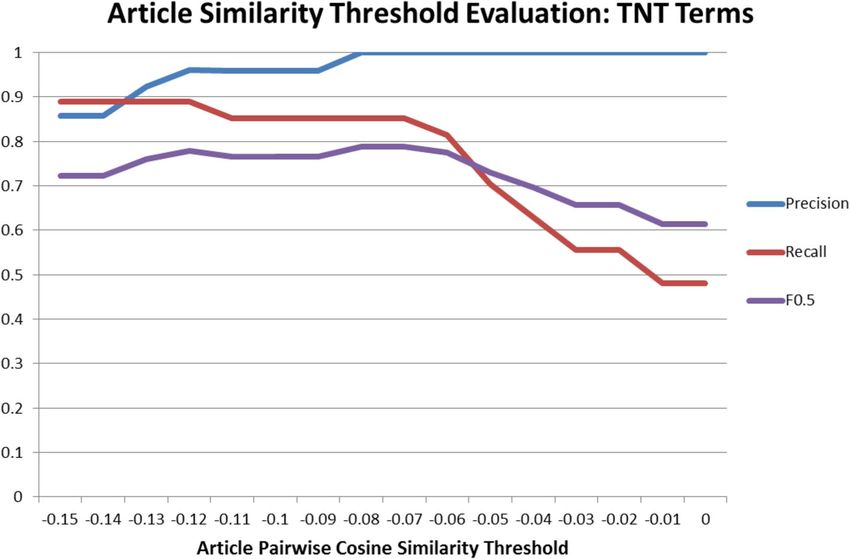
Thapen et al. Journal of Biomedical Semantics (2016) 7:61                                                                             Page 3 of 14

  • Events causing strong emotional reactions, such as                        We track the number of tweets mentioning each key-
    happiness or sadness.                                                  word (consolidating all that lie in the same keyword
                                                                           group), in each of the geographical areas and use bio-
  Initially the system was designed with disease outbreak                  surveillance algorithms to detect spikes in activity. Each
detection as the primary use case; this led to a system                    spike is treated as a potential event, and we use vari-
design focused around keywords and aliases for their                       ous criteria to single out those with a high probability
keywords, since a limited range of illness symptoms char-                  of being actual events as defined above, i.e. those that
acterises most common diseases and the vocabulary used                     are caused by discussion of real-world occurrences on
to describe these symptoms is also relatively limited. After               Twitter.
several iterations of this approach we noted that it could                    Our situational awareness approach is based on iden-
be viable as a general event detection and situational                     tifying terms from the event tweets which characterise
awareness method, so we added another type of event                        the events and using them to retrieve relevant news arti-
to determine the feasibility of the general approach. We                   cles and identify the most informative tweets. The news
chose events causing strong emotions as a contrasting and                  search uses metrics based on cosine similarity to ensure
less specific event type, with the intention of picking up                 that searches return related groups of articles.
a variety of localisable events such as important football
matches and rock concerts.                                                 Architecture
  For each type of event we define a list of keywords,                     The general approach can be described by the architecture
each describing a particular sub-type of that event. For                   in Fig. 1. Every new event type requires a list of keywords
example when looking at illness each keyword relates to                    and their associated aliases. Optionally a specific data pre-
a particular symptom, such as ‘coughing’ or ‘vomiting’.                    processing step can be included for the event type. For
When looking at events that cause emotional reactions                      example in the health symptom case we employ a machine
each keyword relates to a particular emotion. Each of                      learning classifier to remove noise (those tweets not actu-
these sub-type keywords is then expanded with a list of                    ally concerning health). These are the only two aspects
aliases, synonyms and related terms to form a keyword                      of the design that need to be altered to provide event
group. For more details on how we identified the relevant                  detection and situational awareness to a new problem
keywords and synonyms see the sections below.                              domain.

 Fig. 1 Event Detection and Situational Awareness architecture: To apply to a new example a user needs to provide a keyword group list and
 optionally a noise filter to remove tweets that do not strictly match the criteria of interest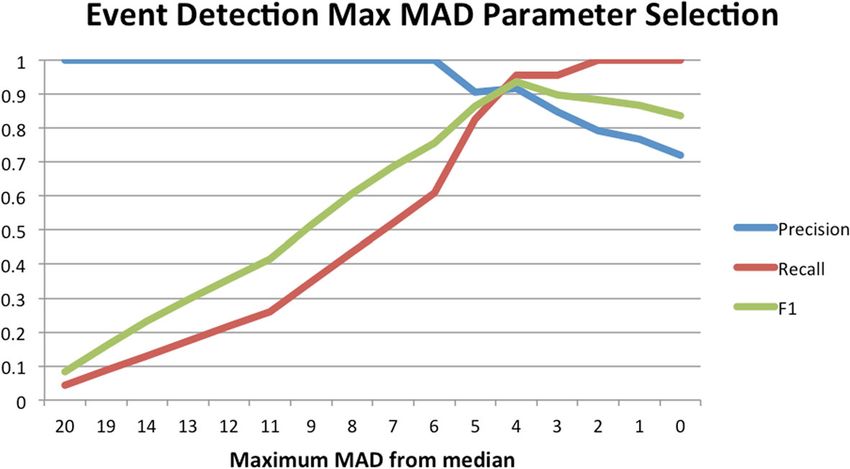
Thapen et al. Journal of Biomedical Semantics (2016) 7:61                                                                   Page 4 of 14

Event types                                                               events such as Valentine’s Day, Mother’s Day and Easter.
We now go into a more detailed explanation of our event                   It was also very often used on a daily basis due to peo-
types and how we formulated the keywords and associ-                      ple offering birthday greetings. We therefore separated
ated aliases. Each keyword group consists of a primary                    “happy” into its own category separate from “joy”.
keyword which is used to identify the group, e.g. vomit,                    In addition we employed SentiStrength [21], a sentiment
and a number of aliases that expand the group, e.g. throw-                analysis tool, to classify our tweets into positive and nega-
ing up, being sick, etc. see Tables 2 and 3 for the full list of          tive emotional sentiments. We took those tweets classified
keyword groups.                                                           as being very positive and very negative as additional
                                                                          categories.
Illness symptoms
To build up a list of symptoms and related keywords                       Data collection
we searched Freebase for /medicine/symptom. Each                          Using Twitter’s live streaming API we collected geo-
of these symptoms is defined as a keyword. They are                       tagged tweets between 11th February 2014 and 11th
returned with a list of aliases that are then associated with             October 2014. Tweets were collected from within a geo-
that keyword. This returned around 2000 symptoms. In                      graphical bounding box containing England and Wales.
order to filter down to a more manageable number we                       Retweets were excluded due to our focus on tweets as pri-
next filtered these symptoms by their frequency in the                    mary reports or reactions to events. This resulted in a
Twitter data; any symptoms not appearing frequently in                    data-set of 95,852,214 tweets from 1,230,015 users. 1.6 %
this data would not produce enough activity to gener-                     of users geo-tag their tweets [22], so our data is a lim-
ate events for analysis. All symptoms with fewer than 10                  ited sample of the total tweet volume from England and
mentions in the Twitter data were removed from the can-                   Wales during this period. We chose to use only geo-tagged
didate list. This excluded a large proportion of symptoms,                tweets since they contain metadata giving an accurate
reducing the set to around 200.                                           location for the user. This allows us to locate each tweet
  We further limited the set by removing symptoms                         within our geographical model. In total we found 240,928
not related to infectious diseases. We also added pri-                    matches for our symptom keywords in the set of tweets
mary keywords and aliases for some common condi-                          classified as health-related, and 20,570,753 matches for
tions such as hayfever and flu. This step resulted in a                   our emotion keywords. See Tables 2 and 3 for details.
reduction to the 46 symptoms which formed our search.
The average number of aliases per primary keyword                         Location assignment
was 3.8.                                                                  Our methodology relies on the collection of baseline levels
                                                                          of tweet activity in an area, so that alarms can be triggered
Emotion states                                                            when this activity increases. We therefore amalgamated
For a list of emotion states and associated keywords we                   the fine-grained location information from the geo-coded
used the work of Shaver et al. They conducted research                    tweets by assigning them to broader geographical areas.
[20] to determine which sets of words were linked to                      We used a data driven approach to generate the geograph-
emotions and how these cluster together. We took the                      ical areas rather than using administrative areas such as
six basic emotions identified in the work as primary key-                 towns or counties. This technique allowed us to select
words: love, joy, surprise, sadness, anger and fear. Shaver’s             only those areas with a minimum level of tweet activity,
work associated each of these with a list of terms to form                and also did not require any additional map data. It would
a tree. We took the terms from lower leaves on the tree for               therefore be be reusable for any region or country with a
each emotion as our alias sets (see Table 1 for examples).                sufficient level of Twitter usage.
The average number of aliases per primary emotion key-                      We began by viewing a sample of the collected tweets
word was 7.3. The only alteration we made was that after                  as geo-spatial points. Viewed on a map these clearly
some initial analysis we discovered that the term “happy”                 clustered in the densely populated areas of England and
from the “joy” category was a very strong signal of special               Wales. We therefore decided to use a clustering algo-
                                                                          rithm on these points in order to separate out areas for
                                                                          study. We employed the Density-Based Spatial Cluster-
Table 1 Selected emotion keyword groups and some of their                 ing of Applications with Noise (DBSCAN) algorithm [23]
aliases                                                                   for clustering, as this does not require a priori knowledge
Keyword                                Aliases                            of the number of clusters in the data. The features pro-
                                                                          vided to DBSCAN were the latitudes and longitudes of the
Surprise                               Amazed, astonished, surprised...
                                                                          tweets.
Sadness                                Depressed, unhappy, crying...
                                                                            The clusters produced by the algorithm matched the
Joy                                    Glad, delighted, pleased...        most populated areas, corresponding to the largest cities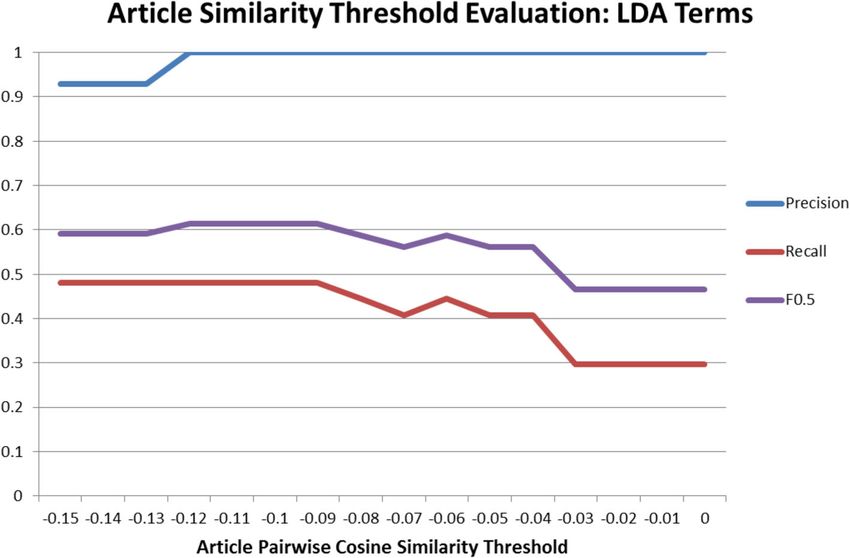
Thapen et al. Journal of Biomedical Semantics (2016) 7:61 Page 5 of 14
Table 2 Tweets matching each symptom keyword group Table 3 Tweets matching each emotion keyword group
Symptom Number of tweets Emotion Number of tweets
Headache 42947 Very negative 5716797
Vomit 30429 Love 4943706
Hayfever 24175 Very positive 3823994
Sore throat 21744 Joy 2129279
Pain 15142 Happy 1613447
Malaise 12354 Anger 1228890
Flu 10913 Sadness 562193
Cough 9589 Fear 395770
Tonsillitis 7283
Surprise 156677
Common cold 6768
Infection 5955
Abdominal pain 5582
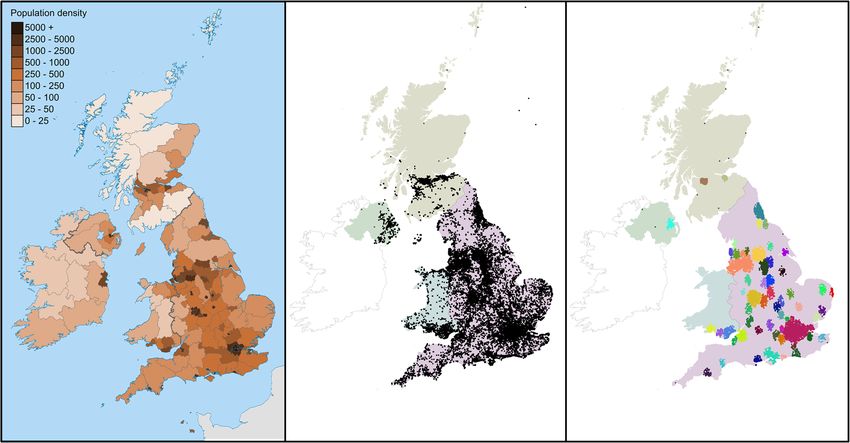
in the UK as shown in Fig. 2. They also separated most
Sneeze 5131
cities into distinct clusters (a notable exception being the
Asthma 4457
conglomeration of Liverpool and Manchester). In total 39
Shortness of breath 4037 clusters were created for England and Wales and each was
Earache 2990 given an ID and a label. We then created a convex hull
Nasal congestion 2930 around each cluster, providing a polygon that can be used
Tremor 2727 to check whether a point is in the cluster or outside it.
Itch 2410 Points outside all of the clusters were assigned to a special
‘noise’ cluster, and not included in the analysis. Overall
Anxiety 2250
80 % of tweets were assigned to specific clusters and the
Fever 2198
remainder to noise, giving us good coverage of geo-tagged
Nosebleed 1971
tweets using our cluster areas.
Faint 1944
Skin rash 1633 Tweet processing
Cramp 1444 As tweets are received by our system they are processed
Diarrhea 1365 and assigned to the symptom and emotion state classes
Chest pain 1293 if they contain one of the relevant keywords. They are
assigned a location by checking whether they fall into one
Swollen gland 1138
of our cluster areas.
Conjunctivitis 941
For the illness symptoms we introduce a noise removal
Stinging sensation 891
stage at this point. It is particularly relevant for this class
Bleeding 854 of events because there are many fewer tweets relating
Chickenpox 835 to illness than showing emotion states. This means that
Runny nose 785 the signal is more easily blocked out by random noise.
Swelling 692 To remove noise we construct a machine learning classi-
Meningitis 641 fier with the aim of removing tweets containing alterna-
tive word usages or general illness discussion rather than
Pneumonia 622
reporting of illness events. The classifier therefore classi-
Seizure 413
fies tweets into those that are self-reports of illness and
Constipation 389
those that are not. The classifier we use is a linear SVM
Palpitation 360 trained on a semi-supervised cascading training set, cre-
Norovirus 239 ated on the principles described in Sadilek et al. [24]. Our
Neck pain 203 classifier uses the LibSVM [25] library, and was initially
Scarlet fever 142 trained on 4600 manually classified tweets. It achieves a
Dehydration 68 classification accuracy of 96.1 % on a held out test set of
920 manually classified tweets.
Dysentery 28
The number of tweets assigned to each class in each area
Tearing 16
are then saved on a daily basis. These counts are first nor-
Dry mouth 10
malised to take account of Twitter’s daily effect pattern,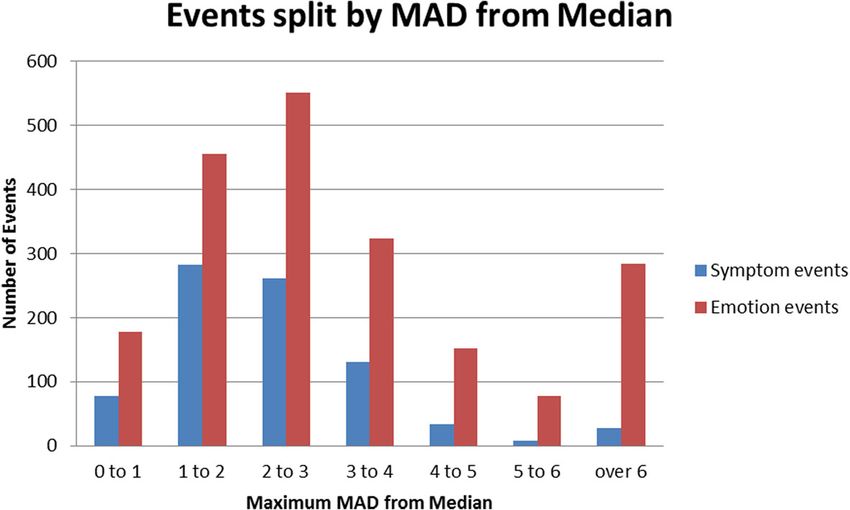
Thapen et al. Journal of Biomedical Semantics (2016) 7:61                                                                              Page 6 of 14

 Fig. 2 UK population density (left) compared to a sample of geo-located tweets (centre) and the clusters found (right). Note that only clusters
 located in England and Wales were used in this study. Contains Ordnance Survey data c Crown copyright and database right, CC BY-SA 3.0, https://
 commons.wikimedia.org/w/index.php?curid=26070175

which shows more tweeting on weekends than weekdays.                         These C2 and C3 candidate alarms are then grouped
Event detection is run daily since we are attempting to                    together so that alarms for the same keyword group and
pick up temporally coarse-grained events. Disease out-                     area on consecutive days are treated as a single alarm. An
breaks take weeks to develop, and events that shift public                 alarm is therefore made up of one or more days, each with
sentiment or emotion will generally take hours or days to                  an observed count of tweets. An alarm ends when the C2
unfold.                                                                    and C3 algorithms no longer signal an outbreak occurring.
                                                                             Some of our Twitter count time series data is zero-
Detecting events                                                           skewed and non-normal, since the number of geo-tagged
Our event detection methodology leverages considerable                     users reporting illness can be low. The number of stan-
existing syndromic surveillance research by using an algo-                 dard deviations from the mean used in the C2 and C3
rithm designed and developed by the Centers for Disease                    algorithms can be an unreliable measure of central ten-
Control and Prevention (CDC), the Early Aberration                         dency in those circumstances. Hence to determine how
Reporting System (EARS) [26].                                              far above general baseline activity an observed count
                                                                           is we employ the median of the series to date and its
Definition 2. (Alarm) An alarm is an alert produced by                     Median Absolute Deviation (MAD) to produce a new
the first stage of our event detection system. The alarm                   metric of alarm severity. Here the series is defined as all
has an associated keyword group and location. It also has                  of the previous observed counts for the keyword group
a start and end date, and associated tweet counts for each                 and location in question. The number of Median Abso-
date within this period. When certain criteria are met an                  lute Deviations from the median, μ, gives a comparable
alarm is deemed to be an event.                                            figure across alarms as to how sharp a rise has been over
  We employ the C2 and C3 variants of EARS. These algo-                    expected levels. This figure is produced from the following
rithms operate on a time series of count data, which in our                equation:
case is a count of daily symptomatic tweet activity. The C2
                                                                                μ = (observation − median)/MAD                                  (1)
algorithm uses a sliding seven day baseline, and signals an
alarm for a time t when the difference between the actual                    We then find the highest metric for an alarm, μmax ,
count at t and the moving average at t exceeds 3 standard                  by finding the highest value of μ within the observations
deviations. The C3 algorithm is based on C2, and in effect                 making up the alarm.
triggers when there have been multiple C2 alarms over the                       μmax = arg max(observations in alarm)                           (2)
previous 3 days.                                                                              μ
Thapen et al. Journal of Biomedical Semantics (2016) 7:61 Page 7 of 14
The μmax is the primary statistic which we use to deter- Algorithm 1 Terms, News and Tweets (TNT) Event Sum-
mine which events are real and which have just been marisation
generated by random noise. 1 Fetch gist tweets and baseline tweets
Another statistic which we employ in order to filter out 2 if gist tweets < 30 then
noise is the tweet-user ratio. This is the ratio of tweets in 3 Do not attempt to summarise event
an event to that of distinct users involved in an event. A 4 else
high value of this statistic would imply that some users 5 Extract unigrams and bigrams appearing in at
have tweeted a large number of times across a short time least 5% of the gist tweets
period, which is an indication that they may be spammers 6 for all ngrams extracted do
and that the alarm is spurious. 7 Perform Fisher’s Exact Test to determine
In summary, we use the output from EARS to produce whether ngram is significantly more likely to appear
alarms. We filter the alarms to a set of high likelihood in gist than baseline
events by using the μmax and tweet-user ratio parameters. 8 for Top 2 most significant unigrams and bigrams
From this point we refer to those alarms that are high- and the primary keyword do
likelihood as events, according to our earlier event defi- 9 Search news database using ngram for the
nition. The alarms have an associated stream of Twitter alarm’s date range and return the top 10 documents
messages and a location given by the node which they
10 Compute PCSS for documents returned
occur in. The following situational awareness results show
11 for ngrams with PCSS values above threshold do
that the Twitter messages in these alarms discuss real-
12 Compute title similarity PCSS between ngram
world occurrences, therefore fulfilling all of our definition. documents and those for each other ngram
13 Good search terms ← term with title similar-
Situational awareness
ity PCSS above threshold
Once an event has been identified our next objective is to
automatically provide additional context for it, which may
14 Good articles ← documents returned from good
provide an explanation of the underlying cause. A human search terms
interpreter could achieve this by reading all of the tweets
15 Filtered tweets ← tweets containing a good search
and synthesizing them into a textual explanation, which term
might be some text such as “People reacting to the death
16 Rank good articles by cosine similarity to average
of Robin Williams”. We do this in two main ways: by pro- vector of good news articles
viding the most representative tweets from those that trig-
17 Rank filtered tweets by cosine similarity to average
gered the alarm, and by linking to relevant news articles. vector of filtered tweets
The steps involved in the Terms, News and Tweets (TNT)
Event Summarisation process are detailed in Algorithm 1.
The steps and terminology are then explained in more includes a standard list, plus the 200 most frequent words
detail. from our tweet database. We select all non-stopwords that
1 The first step is to retrieve the relevant tweets from appear in at least 5 % of the tweets.
the processed tweet and alarm databases. Tweets are 7 We then do a Fisher’s Exact Test to determine which
fetched for both the alarm gist and from a historical base- of the common unigrams and bigrams in the gist appear
line.
3 We discard those events with fewer than 30 tweets significantly more frequently (α < 0.05) here than in the
as we found that they did not contain sufficient data to baseline set. Our candidate terms are the top two most
produce good summarisation results. significant unigrams and bigrams. We select the top two
Definition 3. (Gist) The gist consists of the tweets for the as this was found to give the best results on our test
time period of the event which match the event’s keyword examples. To this set we append the primary keyword that
group and area. triggered the alarm.
9 For this research Google was used as the news
Definition 4. (Baseline) The baseline consists of the database. Using the candidate terms we perform a search
tweets for the same keyword group and area as an event on Google for documents published in the United King-
from the 28 days prior to that event. dom during the time period of the alarm. Due to Google’s
5 The next task is to find unigrams and bigrams that Terms of Service this step was performed manually. A fully
are more prevalent in the gist than in the baseline. These automated system would replace this step with a search of
are likely to come from tweets discussing the event and a news database, which could be created by pulling down
will thus be characteristic of the event. We first extract the news articles from RSS feeds of major content providers.
most common unigrams and bigrams from both sets of 10 We take the first 10 documents retrieved for each
tweets, after removal of stopwords. Our list of stopwords search term, remove stopwords and apply stemming usingThapen et al. Journal of Biomedical Semantics (2016) 7:61 Page 8 of 14
a Lancaster stemmer. We then convert each document the most relevant tweets within that set. The set of tweets
into a Term Frequency/Inverse Document Frequency can either be:
(TF/IDF) vector. In order to determine whether the search
term has retrieved a coherent set of related documents we • 1) All tweets in the gist.
define a metric based on cosine similarity, the Pairwise • 2) The gist tweets containing one of the extracted
Cosine Similarity Score (PCSS): terms.
• 3) The gist tweets containing one of the ‘good’ search
terms (as determined by the TNT algorithm).
• The Pairwise Cosine Similarity Score of a group of
TF/IDF vectors is calculated by taking the cosine
1) is always available and is labelled the Gist Top Tweets
similarity between each pair of vectors and adding
(GTT). If the TNT algorithm has found terms that are
them to a set. The standard deviation of this set is
significantly different in frequency from the baseline then
subtracted from its mean to form a score.
set 2) is available for use and if terms from that set have
good news matches then set 3) can be used. The Summary
The PCSS rewards articles which are similar and Top Tweets (STT) are from set 3) if it exists and fallback
penalises any variance across those article similarities. to set 2) if the good news match terms are not available. If
This reduces the effect of some articles being strongly no terms were found to be significantly different from the
related in the document set and others being highly unre- baseline then only the GTT is available.
lated. Any term which retrieves a set of documents with a In order to choose the top tweets we rank them by their
score below a threshold value is not considered further. cosine similarity to the mean TF/IDF vector of all tweets
It is possible for a search term to hit on a coherent in the set, an approach similar to that of [4]. This attempts
set of documents purely by chance, perhaps by find- to finds tweets which capture and summarise the aggre-
ing news articles related to another event in a different gate information of all of those in the set. The top five
part of the world. In order to guard against this we tweets ranked by this measure are returned.
institute another check to ensure that the set of docu-
ments returned from a search term is sufficiently closely Results and discussion
related to the set returned from at least one other search Candidate event selection
term. Over the course of the study the bio-surveillance algo-
12 In order to perform this check we compare the titles rithms generated 820 disease-related alarms and 2021
of the articles returned from the two different searches emotion-related alarms. A brief survey of these revealed
using a similar process to our earlier document compar- that many were false alarms generated by random fluctu-
ison. We found it more effective to compare titles than ations in the noisy social media data. In order to separate
whole documents, since sets of documents with similar out alarms that could be labelled as events with high
topics can contain similar language even for fairly unre- confidence we conducted the following analysis.
lated search terms. For example the terms “ebola” and Firstly we compiled an initial set of 13 focus example
“flu” will both return health-related documents contain- alarms. These were taken from events that the authors
ing similar language, but we would not wish to say that knew had happened in the evaluation time period and
these search terms are related. To convert the titles to from those alarms in our dataset with low and high values
TF/IDF vectors we remove stopwords but do not apply of μmax .
stemming. Since the titles are so short we include all uni- The most important threshold parameter in the context
grams, bigrams and trigrams in the vector representation. of the event detection is the μmax figure which mea-
We then compute a PCSS between the two document sures the deviation of the alarm counts from the median
sets, pairing each document in the first set with each in level. Examining the distribution of the number of alarms
the second and vice versa. 13 A search term must be for each value of μmax revealed that it started to tail off
related to at least one other term for it to be used going sharply at μmax ≥ 5. The distribution of alarms for each
forward. value of μmax is shown in Fig. 3. We therefore took this as
14 Once TNT has identified good search terms we then a value to segment additional test examples, drawing ten
return the news articles fetched using those terms. 16 In more at random with a μmax less than 5 and ten with a
order to rank the top news articles for a search we take μmax greater than or equal to 5. The resulting evaluation
the mean TF/IDF vector of the articles. and then rank the set of 33 candidate events is shown in Table 4. The event
articles by cosine similarity to this mean vector. We return ID used to refer to the events is composed of the first two
the top ranked articles from each search term. letters of the event keyword followed by a 1–2 letter area
17 To select the summary tweets for an event we firstly code. The final part of the ID is the day and month of the
determine the set of tweets to consider and then choose event start date.Thapen et al. Journal of Biomedical Semantics (2016) 7:61 Page 9 of 14
Fig. 3 Alarms detected with differing values of μmax
Event detection evaluation coders found 26 YES answers, 5 NO answers and 2 DIS-
It is difficult to provide a completely automated evaluation AGREED answers, producing a 94 % agreement. Where
procedure for detecting previously unknown events. Diaz an event was present they wrote a short summary.
et al. used the time to detection on a known outbreak as For external verification of events two different meth-
their evaluation criterion [15]. In our case we do not know ods were used, depending on whether the event was
a priori that these are genuine outbreaks or events. Hence symptom-related or emotion-based. For symptom related
we need to make an assessment of the alarms produced events the activity spike was checked against official
to see what they refer to and if there is a way of exter- sources for the same time period. The General Prac-
nally verifying that they are genuine events. For all 33 of titioner (GP) in hours bulletin for England and Wales
the selected alarms the authors read the tweets and deter- [27] was used and an event was deemed verified if the
mined whether they described a real world event. The symptom exhibited an increasing trend for that period.
Table 4 Evaluation set of events
ID Event μmax Keyword Node ID Event μmax Keyword Node
SAL-11-08 YES 20 Sadness London HFB-10-04 YES 5 Hayfever Birmingham
HFM-01-06 YES 19 Hayfever Manchester VOL-20-04 YES 5 Vomit London
SAL-07-04 YES 14 Sadness London SAC-05-05 YES 5 Sadness Cardiff
FEL-18-07 YES 13 Fear London HFL-04-07 NO 5 Hayfever London
ASL-02-04 YES 12 Asthma London FLB-23-09 NOa 5 Flu Birmingham
FLP-06-10 YES 11 Flu Portsmouth VPBR-10-05 YES 4 VeryPos Bristol
HAM-02-04 YES 9 Happy Manchester FRL-30-05 YES 4 Fever London
HAM-18-04 YES 9 Happy Manchester FLM-19-09 YES 4 Flu Manchester
SAL-08-07 YES 8 Sadness London VOL-22-02 NO 3 Vomit London
HALE-01-08 YES 8 Happy Leeds HFB-29-04 NO 3 Hayfever Birmingham
HFL-14-05 YES 7 Hayfever Leeds JONO-23-02 YES 2 Joy Norwich
SUN-29-08 YES 7 Surprise Newcastle HEM-06-03 NO 2 Headache Manchester
ITL-08-06 YES 6 Itch London SUC-23-05 NO 2 Surprise Cardiff
SAB-09-06 YES 6 Sadness Birmingham SUL-16-08 NO 1 Surprise London
HABE-01-03 YES 5 Happy Bridgend FEBR-17-04 NO 0 Fear Bristol
SAL-21-03 YES 5 Sadness London STL-26-08 NO 0 Sore Throat London
HFC-09-04 YES 5 Hayfever Cardiff
Shows whether events were externally verifiable and their μmax value
a
Note: this event not confirmed by the GP in hours report of that week. However, the following week showed an increase and it is possible that social media detected
increased Influenza activity before this was confirmed by GP visitsThapen et al. Journal of Biomedical Semantics (2016) 7:61 Page 10 of 14
This detail is noted in the summary document pro- In summary the event detection mechanism based on
duced by Public Health England for that reporting period. the EARS C2 and C3 algorithms with the addition of the
Emotion-based events were verified by checking if there μmax and tweet-user ratio was found to perform well at
were any articles (via Web search) that could corroborate detecting events that could be externally verified as gen-
the cause of the event (as given by the summary). uine. The recommended μmax parameter (4) produced a
We manually investigated all examples from the initial good balance of precision and recall in our sample set. It
focus set and found initial parameters for the score func- must be noted however that we cannot gain a true picture
tions in our algorithms that worked reasonably well. These of the overall recall of the system, since we have no way
provided possible ranges of values which were evaluated of analysing the number of genuine events that were not
more systematically over the entire alarm set. For event picked up.
detection we evaluated which alarms were flagged as
events by the system for each parameter value against Situational awareness evaluation
whether those events were externally verifiable. The final Both situational awareness components were evaluated.
evaluation for all algorithms contains all 33 of the alarms Firstly the news linkage was tested to see whether rele-
in both sets, not just the twenty expanded ‘test’ examples. vant news was retrieved for the sample events. As part of
To determine if an alarm is an event that we should be this analysis we compared our method of extracting infor-
concerned about we consider two properties of the alarm. mative search terms (the TNT algorithm) with a compa-
The first is the tweet-user ratio. From exploratory testing rable automated technique. Secondly the tweet ranking
we found a value of 1.5 separated our spam and genuine was validated to determine whether highly ranked tweets
alarms very well, leaving only a small number of alarms effectively summarised the events.
with large tweet sets and some spam. The spam detection
problem should be straightforward and will be addressed Comparative news linkage evaluation
more completely in future work. The news linkage component works by selecting good
The second figure which gives the strength of the activ- search terms for articles based on the TNT algorithm.
ity above the usual baseline is the μmax figure. This is Within this there is a term extraction step to generate
the essence of the modified EARS algorithm and the search terms, and then a filtering step using PCSS to
value of this figure should generally separate events from remove terms which retrieve unrelated sets of articles.
non-events. We iterate over different threshold values for the PCSS
The criterion for selecting the best threshold for μmax score to find the optimum, using an F0.5 measure as
is context dependent. We have used the balanced measure the evaluation criterion. F0.5 was selected because preci-
for this scenario as that is a fair representation of both pre- sion was judged to be more important than recall in this
cision and recall. For each threshold value of μmax tested setting. As a further evaluation we compare the results
the classification success and error types are: of replacing our term extraction algorithm with Latent
• True positive: instances at or above the threshold Dirichlet Allocation (LDA). LDA is a popular topic mod-
that are verified events elling technique that extracts sets of terms characterising
• False positive: instances at or above the threshold each topic in a group of documents. The success and error
that are not verified events types used to compute the F0.5 measure are:
• True negative: instances below the threshold that • True positive: relevant news returned for
are not verified events newsworthy event
• False negative: instances below the threshold that • False positive: news returned for an event with no
are verified events genuine news
• True negative: no news returned for an event with
The precision, recall and F1 values for all the tested
no genuine news
values of μmax are displayed in Fig. 4. All figures were cal-
• False negative: no news returned for newsworthy
culated with reference to the set of 33 example events dis-
event
cussed above. The maximum F1 value, 0.9362, is observed
at μmax ≥ 4, so this is a well balanced threshold and The evaluation is presented in Figs. 5 and 6 as well as
the recommended parameter. Those seeking higher con- the different levels of article PCSS that were iterated over
fidence events (willing to accept that some events may be to find the maximum F0.5 value in a step-wise procedure.
missed) could use a value of 6 for this parameter which It is clear from these images that the TNT algorithm has a
yields a precision of 1. The maximum observed recall higher F0.5 at all tested values of the article PCSS, due to
value is at the minimum parameter value and is not very its higher recall. The outcome of the parameter selection
informative. Essentially it says that everything is an event process was that a PCSS threshold of −0.08 produced the
and hence does not produce any false negatives. best results. Using this value the F0.5 was 0.79, showingThapen et al. Journal of Biomedical Semantics (2016) 7:61 Page 11 of 14
Fig. 4 μmax event detection parameter selection
that our system was successful in retrieving relevant news cause. The tweet ranking match (to human-coded event
for the sample events. assessment) performance is presented in Table 5. The
Selecting top ranked relevant news articles is one part of tweets were considered a full match if a human summary
our situational awareness contribution. The second is the of the 5 top ranked tweets would match the human-coded
selection of tweets that provide a representative summary event explanation for the whole set of tweets.
of an event. The partial matches were: FRL-30-05 (Fever: London,
May) and FLP-06-10 (Flu: Birmingham, October).
Top ranked tweets evaluation These events had more than one explanatory cause. Cur-
We have employed two evaluations for the tweet ranking rently our algorithms work best in the single event case.
exercise: comparison to human-coded event explanation The three cases that did not match were: JONO-23-02
and comparison between GTT and STT. The human- (Joy: Norwich, February), STL-26-08 (Sore throat:
coded event explanations were created by two of the London, August) and SUN-29-08 (Surprise, Newcastle,
authors after reading through all of the tweets linked to August). The coders disagreed as to whether STL-26-08
each event. There were 26 alarms that had an identifiable was actually an event. The remaining two examples were
Fig. 5 News linkage accuracy from Terms, News, Tweets termsThapen et al. Journal of Biomedical Semantics (2016) 7:61 Page 12 of 14
Fig. 6 News linkage accuracy from Latent Dirichlet Allocation terms
not summarised well by the significant tweets as they both single event: Norwich City Football Club beating Totten-
exhibited high disparity in terms used to describe a con- ham Hotspur Football Club 1 − 0 in a football match. Both
textually related event and SUN-29-08 also included a TNT and LDA term extraction failed to find terms repre-
number of spam tweets that distorted the results of TNT. sentative of this event. This was due to the disparity of the
The second evaluation for the tweet ranking exercise language used; the following example tweets should help
was a comparison between the GTT and the STT. A qual- elucidate this point:
itative assessment of the tweets led to the conclusion that
• #canarycall absolutely delighted with the win :) good
STT tweets were better in 11 out of 33 cases and there
was no significant difference between the two for 21 cases performance, good result
• #yellows almost didn’t go today glad i did
out of 33. In one case, FLP-06-10, the GTT included a
• so glad i chose to come today!#ncfc
mention of “flu jab” (one of the manually selected terms)
which the STT did not include. Hence the STT provided It is difficult for a term-based solution to find any com-
an improvement over ranking based off the alarm tweets mon thread here. Finding the cause of this event would
in one out of three instances. require contextual knowledge of football matches, team
names and commonly employed aliases. The news linkage
Notable examples discussion algorithm did initially find a news story for the term “joy”
We now discuss four example events that highlight the on this date. The British Prime Minister “let out a little cry
strengths and limitations of our approach. These examples of joy” over David Bowie Scottish independence comments
are listed in Table 6. (Telegraph, Feb 24, 2014). The articles returned all con-
The first example case is JONO-23-02. From a read- cerned this story and were found to be closely related, but
ing of the tweets there were definitely some relating to a were dropped from the news linkage because they did not
match those returned from the other search terms. This
highlights the benefits of searching with multiple terms
and ensuring that the results are related.
Table 5 STT tweet ranking evaluation
The second example is ASL-02-04. This event was
Match Count due to increased levels of air pollution observed in Lon-
Full 21 don at the beginning of April, caused by a Saharan dust
Partial 2 cloud. This event had a μmax of 12 indicating a signifi-
No 3 cant increase in baseline activity for the alert period. It was
The STT tweet summary fully matched the human-coded event summarisation in
well summarised by all aspects of our situational aware-
21 cases. This yields a full match fraction of 0.81 ness algorithm. The top ranked tweets provided by ourThapen et al. Journal of Biomedical Semantics (2016) 7:61 Page 13 of 14
Table 6 Example cases and the terms extracted for them
ID TNT terms LDA terms
JONO-23-02 Joy, enjoy Enjoy, glad, loss
ASL-02-04 Asthma, air pollution, smog, pollution Asthma, smog, pollution, attack air
VOL-20-04 Vomit, chocolate, easter Chocolate, eaten, easter, vomit, headache
SAL-11-08 Sadness, robin williams, sad news, robin, williams Sad, robin, williams, rip, riprobinwilliams
summary method (STT) produced tweets more represen- tweets by TNT tweet filtering are better than those ranked
tative of the event than those from all tweets in the gist. on all tweets as they remove baseline general sadness
This is demonstrated by the top tweet selected by both: tweets from the ranking:
• STT top tweet: i can’t breathe #asthma #smog • STT top tweet: rip robin williams. sad day
• GTT top tweet: my asthma is literally so bad • GTT top tweet: yep , very sad
Here selecting the top tweets from the filtered event Conclusions
set captures tweets representative of the event as opposed We have presented techniques for event detection and sit-
to the baseline illness activity. The news linkage for this uational awareness based on Twitter data. We have shown
example worked well, with all five of the top selected that they are robust and generalisable to different event
articles being representative of the event. The top article, classes. New event classes could be added to this system
“Air pollution reaches high levels in parts of England - simply by producing a list of keywords of interest and
BBC”, gives the cause of the event in the first few lines: an optional noise filter. Our event detection is based on
“People with health problems have been warned to take the EARS bio-surveillance algorithm with a novel filtering
particular care because of the pollution - a mix of local mechanism. The maximum Median Absolute Deviations
emissions and dust from the Sahara.” from the median provides a robust statistic for determin-
The third case is VOL-20-04. Reading the tweets ing the strength of relative spikes in count-based time
makes it clear that this one day event is caused by peo- series. As it is based on the median, this measure handles
ple feeling sick after eating too much chocolate on Easter cases where data is non-normal as was the case for some of
Sunday. In this case the TNT summary and all tweet our symptom based geo-tagged tweets. The event detec-
ranking return similar tweets as there is little baseline tion approach achieved an F1 score of 0.9362 on our event
activity and that baseline activity is not strongly related. examples.
The top tweets from both sets therefore both produce By filtering to words that are significantly different (α <
good summaries: 0.05) in frequency from baseline levels we have extracted
• STT top tweet: seriously i feel sick having all this terms to search news sources for related articles. Where
chocolate good news matches are found these revise our event
• GTT top tweet: eaten too much chocolate feel sick term list. We have created two novel algorithms that pro-
vide additional situational awareness about an event from
While the top ranked tweets are similar the event tweet these event terms. The baseline tweet activity thus pro-
filtering does remove baseline tweets referring to general vides valuable context in allowing the character of the
illness. No good news searches were found in this case. detected event to be discerned.
This event may be valid in the context of social media but Firstly, we rank the filtered set of news articles to pro-
it is not newsworthy. duce the top five representative articles. The news linkage,
The fourth example is SAL-11-08 which is the UK weighted towards precision, achieved an F0.5 score of 0.79
Twitter reaction to the death of Robin Williams. These on our example set, with no false positives.
tweets from the sadness keyword group exhibit both the Secondly, we produce a top five ranked list of tweets
highest μmax (20) and the highest overall tweet count that summarise an event. These ranked tweets are cal-
for any single event (4472). The prominence of celebrity culated from the tweet set, filtered by those that contain
deaths within our detected events mirrors earlier find- the extracted event terms. The top ranked tweets fully
ings [6]. As with all of our high μmax events the TNT matched our human-coded event summaries in 21 out of
tweet ranking and news linkage work well. The top news 26 cases.
article returned is an article reporting the death of Mr. In future work we aim to improve our news linkage
Williams: “Robin Williams dies aged 63 in suspected sui- algorithm with a final step checking whether the arti-
cide” (Telegraph, August 12, 2014). The top five ranked cles returned are similar to the event tweets, using cosineThapen et al. Journal of Biomedical Semantics (2016) 7:61 Page 14 of 14
similarity or other features such as entities identified 13. Broniatowski DA, Paul MJ, Dredze M. National and local influenza
in the news articles. Additional improvements to event surveillance through twitter: An analysis of the 2012-2013 influenza
epidemic. PloS ONE. 2013;8(12):83672.
detection would lie in improving spam detection and 14. Li J, Cardie C. Early stage influenza detection from twitter. 2013. arXiv
adding sentiment classification to our emotion example preprint arXiv:1309.7340, https://arxiv.org/abs/1309.7340.
as a classifier. Collecting data over longer time periods 15. Diaz-Aviles E, Stewart A, Velasco E, Denecke K, Nejdl W. Epidemic
intelligence for the crowd, by the crowd. In: ICWSM. Dublin: AAAI
would also allow us to look into using bio-surveillance Publications; 2012.
algorithms which require seasonal baseline information. 16. Long R, Wang H, Chen Y, Jin O, Yu Y. Towards effective event detection,
tracking and summarization on microblog data. In: Web-Age Information
Management. Wuhan: Springer; 2011. p. 652–63.
Acknowledgements 17. Marcus A, Bernstein MS, Badar O, Karger DR, Madden S, Miller RC.
This research was carried out in cooperation with the UK Defence Science and Twitinfo: aggregating and visualizing microblogs for event exploration. In:
Technology Laboratory. It was funded by the U.S. Department of Defense’s Proceedings of the SIGCHI Conference on Human Factors in Computing
Defense Threat Reduction Agency (DTRA), through contract Systems. Vancouver: ACM; 2011. p. 227–36.
HDTRA1-12-D-0003-0010. 18. Yin J, Lampert A, Cameron M, Robinson B, Power R. Using social media to
enhance emergency situation awareness. IEEE Intell Syst. 2012;27(6):52–9.
Authors’ contributions 19. Abel F, Gao Q, Houben GJ, Tao K. Semantic enrichment of twitter posts
NT and DS jointly undertook the data collection, statistical analysis and writing for user profile construction on the social web. In: The Semanic Web:
the manuscript. CH conceived of the study, and participated in its design and Research and Applications. Springer; 2011. p. 375–89.
coordination as well as helping to draft the manuscript. All authors read and 20. Shaver P, Schwartz J, Kirson D, O’connor C. Emotion knowledge: further
approved the final manuscript. exploration of a prototype approach. J Pers Soc Psychol. 1987;52(6):1061.
21. Thelwall M, Buckley K, Paltoglou G, Cai D, Kappas A. Sentiment strength
detection in short informal text. J A Soc Inf Sci Technol. 2010;61(12):
Competing interests 2544–58.
The authors declare that they have no competing interests. 22. Leetaru K, Wang S, Cao G, Padmanabhan A, Shook E. Mapping the global
twitter heartbeat: The geography of twitter. First Monday. 2013;18(5).
Received: 2 December 2015 Accepted: 20 September 2016 23. Ester M, Kriegel HP, Sander J, Xu X. A density-based algorithm for
discovering clusters in large spatial databases with noise, Proceedings of
the 2nd International Conference on Knowledge Discovery and Data
Mining: AAAI Press, pp. 226–31.
References
24. Sadilek A, Kautz HA, Silenzio V. Predicting disease transmission from
1. Kwak H, Lee C, Park H, Moon S. What is twitter, a social network or a
geo-tagged micro-blog data. In: Twenty-Sixth AAAI Conference on
news media?. In: Proceedings of the 19th International Conference on
Artificial Intelligence. Toronto: AAAI; 2012.
World Wide Web. Raleigh: ACM; 2010. p. 591–600.
25. Chang CC, Lin CJ. LIBSVM: A library for support vector machines. ACM
2. Aramaki E, Maskawa S, Morita M. Twitter catches the flu: Detecting
Trans Intell Syst Technol. 2011;2:27–12727.
influenza epidemics using twitter. In: Proceedings of the Conference on
26. Hutwagner ML, Thompson MW, Seeman GM, Treadwell T. The
Empirical Methods in Natural Language Processing. EMNLP ’11.
bioterrorism preparedness and response early aberration reporting
Stroudsburg: Association for Computational Linguistics; 2011.
system (ears). J Urban Health. 2003;80(1):89–96.
p. 1568–76.
27. Public Health England. GP in hours bulletin 2014. https://www.gov.uk/
3. Sakaki T, Okazaki M, Matsuo Y. Earthquake shakes twitter users: real-time
government/publications/gp-in-hours-bulletin. (2014). Accessed 04 Aug
event detection by social sensors. In: Proceedings of the 19th
2014.
International Conference on World Wide Web. ACM; 2010. p. 851–60.
4. Zubiaga A, Spina D, Amigó E, Gonzalo J. Towards real-time
summarization of scheduled events from twitter streams. In: Proceedings
of the 23rd ACM Conference on Hypertext and Social Media. ACM; 2012.
p. 319–20.
5. Hermida A. Twittering the news: The emergence of ambient journalism.
Journal Pract. 2010;4(3):297–308.
6. Petrović S, Osborne M, Lavrenko V. Streaming first story detection with
application to twitter. In: Human Language Technologies: The 2010
Annual Conference of the North American Chapter of the Association for
Computational Linguistics. Association for Computational Linguistics;
2010. p. 181–9.
7. Osborne M, Moran S, McCreadie R, Von Lunen A, Sykora MD, Cano E,
Ireson N, Macdonald C, Ounis I, He Y, et al. Real-time detection, tracking,
and monitoring of automatically discovered events in social media. Submit your next manuscript to BioMed Central
Proceedings of the 52nd Annual Meeting of the Association for
Computational Linguistics: System Demonstrations, 23rd-24th June 2014. and we will help you at every step:
Baltimore: Association for Computational Linguistics. 2014. pp. 37–42.
• We accept pre-submission inquiries
8. Becker H, Naaman M, Gravano L. Beyond trending topics: Real-world
event identification on twitter. ICWSM. 2011;11:438–41. • Our selector tool helps you to find the most relevant journal
9. Walther M, Kaisser M. Geo-spatial event detection in the twitter stream. • We provide round the clock customer support
In: Advances in Information Retrieval. Moscow: Springer; 2013. p. 356–67.
• Convenient online submission
10. Aggarwal CC, Subbian K. Event detection in social streams. In: SDM.
Anaheim: SIAM; 2012. p. 624–35. • Thorough peer review
11. Chierichetti F, Kleinberg J, Kumar R, Mahdian M, Pandey S. Event • Inclusion in PubMed and all major indexing services
detection via communication pattern analysis. In: Eighth International
• Maximum visibility for your research
AAAI Conference on Weblogs and Social Media. Ann Arbor: AAAI Press;
2014. Submit your manuscript at
12. Abdelhaq H, Sengstock C, Gertz M. Eventweet: Online localized event www.biomedcentral.com/submit
detection from twitter. Proc VLDB Endowment. 2013;6(12):1326–29.You can also read