The Global Financial Centres Index 24 - SEPTEMBER 2018 - Financial Centre Futures - Long Finance
←
→
Page content transcription
If your browser does not render page correctly, please read the page content below
The Global
Financial Centres
Index 24
SEPTEMBER 2018

   Financial Centre Futures
We are pleased to present the twenty-fourth edition of the Global Financial Centres Index
(GFCI 24).

In March 2007 Z/Yen released the first edition of the GFCI, which continues to provide
evaluations of competitiveness and rankings for the major financial centres around the
world.

In July 2016 the China Development Institute (CDI) in Shenzhen and Z/Yen Partners in
London established a strategic partnership for research into financial centres. We
continue our collaboration in producing the GFCI.

The GFCI is updated every March and September and receives considerable attention
from the global financial community. The index serves as a valuable reference for policy
and investment decisions.

Z/Yen is the City of London's leading commercial think-tank. Z/Yen was founded in 1994 to
promote societal advance through better finance and technology. Z/Yen has built its
practice around a core of high-powered project managers, supported by experienced
technical specialists so that clients get expertise they need, rather than just resources
available. The firm is headquartered in London, but Z/Yen is committed to the ‘virtual
office’ concept and is an intense user of technology in order to improve flexibility and
benefit staff.

The CDI is a leading national think-tank that
develops solutions to public policy challenges
through broad-scope and in-depth research to
help advance China’s reform and opening-up to
world markets. The CDI has been working on the
promotion and development of China’s financial
system since its establishment 29 years ago.
Based on rigorous research and objective analysis,
CDI is committed to providing innovative and
pragmatic reports for governments at different
levels in China and corporations at home and
abroad.

The authors of this report, Mark Yeandle and
Mike Wardle would like to thank Bikash Kharel,
Shevangee Gupta, Michael Mainelli, Carol Feng,
Peng Yu, and the rest of the GFCI team for their
contributions with research, modelling, and ideas.

The Global Financial Centres Index 24 | 1

Preface
When 60% of an index moves from Western centres to Asian centres in a decade, it is a time
for reflection. Our Global Financial Centres Index was created in 2005 and, after nearly two
years of incubation, launched in March 2007. Back in 2002, our clients asked us to compare
just the four leading global financial centres, specifically London, New York, Paris, and
Frankfurt. Today, the Global Financial Centres Index explores these four, plus 96 others such
as Dalian, Panama, Cyprus, Mumbai, Buenos Aires, Helsinki, Baku, Almaty, Sofia, Athens, and
Trinidad & Tobago.
Yes, our clients 16 years ago were somewhat blinkered, but helped us start this index. Yes,
the world of 2002 was a bit Western-centric. Yes, we lacked the tools, such as instrumental
factor indices, to handle large numbers on comparative centres efficiently. Yet, the world
has changed enormously.
Some of the shifts have been geopolitical, ranging from the increasing economic importance
of China, to global conflicts, sanctions, trade flows, financial crises, and demography. Other
shifts have been deliberate and intentional policies directed at increasing the attractiveness
of specific financial centres for relocation and inward investment.
Still, as attributed to Abdul Kalam, President of India (2002-2007), “I was willing to accept
what I couldn't change” equally implies, I tried to change what I could. In this, our latest
edition, Global Financial Centres Index 24, it is clear that financial centres can change a lot
despite the geopolitical winds.
Far too much attention is focused on the top centres and the blow-by-blow rankings they
have. The long-term trend since our first published edition in 2007 has been the consistent
and persistent rise of Asian centres while the press and pundits focus on brief headlines
about London and New York City. London is overtaken, barely, by New York City in this
edition, but it was overtaken before in GFCI 15, 16, and 17 and will probably overtake New
York City again. The long-term news (a bit of a contradiction) is that Singapore, Hong Kong,
and Shanghai will be over-and-under taking for a while before ratings settle, if ever. It is
highly likely that an Asian centre will have the top slot very soon.
Financial centres can, and do, control large amounts of their destiny. GFCI 24 shows the
wide range of strategy, competition, specialisation, and, may I say, style in which they do
it. We look forward to sharing with you the exciting news of these improvements and
tussles in many future editions.

Professor Michael Mainelli
Executive Chairman, Z/Yen Group

2 | The Global Financial Centres Index 24

Foreword
In the aftermath of the US financial crisis of 2008, followed by Brexit in 2016, global financial
markets have become multi-polarized, with the center of global markets shifting from
conventional economic centers, such as the U.S. and UK, to emerging powerhouses, including
Germany, Canada and China.
In the face of the 4th Industrial Revolution, new types of financial products based on AI,
blockchain and cloud technology have enabled innovative forms of financial transactions
that transcend space and time to emerge .
In the course of this transition, the GFCI report published by Z/Yen Group, a leading think
tank in the City of London, has provided useful guidelines on the future growth of major
financial centers in the world.
In Asia, emerging financial hubs, such as China and Korea, as well as the existing financial
centers in Singapore and Hong Kong, are making dedicated efforts to promote the financial
sector as a new growth industry.
In particular, the Korean government designated the capital city of Seoul and the southern
port city of Busan as national financial hubs in 2009, with the strategy of nurturing the
capital into a comprehensive financial center and the port city into a major financial hub
which specializes in maritime finance and derivatives.
In addition, the government has made a continuous effort to enhance Korea’s financial
infrastructure. In 2007, the Financial Investment Services and Capital Markets Act was
enacted to improve the national system, and International Finance Centers were established
in both Seoul and Busan in 2012 and 2014 respectively.
Busan is a logistics hub city equipped with a tri-port system incorporating rail, sea and air
routes. The city is also a starting point and final destination for the Trans-Siberian Railway,
and logistics hub for the New Northern Policy and New Southern Policy.
Moreover, Geoje City in South Gyeongsang Province and Ulsan Metropolitan City, which
incorporate the surrounding area of Busan, form a cluster for the global shipbuilding
industry. Situated on the coast, the region is also home to advanced shipping businesses
and industries thanks to its advantageous geographical location. In addition, Busan is
located at the center of a metropolitan economic zone that connects Busan-Ulsan-
Gyeongsang Province and forms a supra-regional economic zone by carrying out exchanges
with major cities in Asia.
Based on its geographic strengths for the port, logistics, shipbuilding, shipping and fisheries
industries, Busan is set to launch a new strategy to respond to the 4th Industrial Revolution.
To begin with, the City Government will establish a system that supports the development
of maritime finance by creating a cluster of institutions and organizations related to
maritime finance, such as the Korea Ocean Business Corporation.
The Global Financial Centres Index 24 | 3

In addition, the city will mobilize development capital in collaboration with public financial
institutions and major state-invested banks in order to gain a foothold in the infrastructure
development market of North Korea, as the Inter-Korean Summit has opened the door for
increased inter-Korean economic cooperation.
Furthermore, the City Government plans to invite Fintech related businesses and
institutions to establish offices in BIFC in an effort to provide targeted support to leading
technologies in the era of the Fourth Industrial Revolution, such as AI and IoT, and launch a
program to incubate start-ups to create a cluster for Fintech businesses.
Lastly, the Korean Government and Busan Metropolitan City Government offer incentives to
financial firms moving into the Busan Financial Hub Zone. These include tax breaks and
exemptions, as well as subsidies.
Busan Metropolitan City is fully committed to developing the city into a business-
friendly city for international financial firms by reducing red tape and providing a
favorable environment for their successful operation.

Oh Keo-don
Mayor, Busan Metropolitan City

   “South Korea continues to be more competitive and
     I hear Busan cropping up in conversation more.”
 INVESTMENT BANKER BASED IN HONG KONG
4 | The Global Financial Centres Index 24

GFCI 24 Summary And Headlines
Overview
•   We researched 110 centres for this edition of the Global Financial Centres Index
    (GFCI 24). The number of financial centres in the main index has increased from 96
    to 100 with the addition of Cape Town, GIFT City (Gujarat), Hangzhou, and Sofia
    from the associate centres list. There are ten associate centres awaiting potential
    inclusion in the main index.
•   GFCI 24 was compiled using 137 instrumental factors. These quantitative
    measures are provided by third parties including the World Bank, The Economist
    Intelligence Unit, the OECD, and the United Nations. Details can be found in
    Appendix 4.
•   The instrumental factors were combined with 31,326 financial centre assessments
    provided by respondents to the GFCI online questionnaire
    (www.globalfinancialcentres.net). Details of the 2,453 respondents are at
    Appendix 2. Further details of the methodology behind GFCI 24 are in Appendix 3.
•   Performance across the index was mixed. Within the top 30 centres in the index,
    20 centres rose in the ratings while 10 fell. While in GFCI 23 all 25 leading centres
    rose in the ratings and the lower ranked centres’ ratings fell, there was a less clear
    pattern in GFCI 24.

The Results
Leading Centres in the Index
•   Not for the first time, New York took first place in the index, just two points head of
    London, although both centres fell slightly in the ratings;
•   Hong Kong is now only three points behind London;
•   Shanghai overtook Tokyo to move into fifth place in the index gaining 25 points in
    the ratings;
•   Beijing, Zurich, and Frankfurt moved into the top ten centres, replacing Toronto,
    Boston, and San Francisco.
Western Europe
•   Zurich, Frankfurt, Amsterdam, Vienna, and Milan moved up the rankings
    significantly. These centres may be the main beneficiaries of the uncertainty
    caused by Brexit;
•   Surprisingly, despite some evident success in attracting new business, Dublin,
    Munich, Hamburg, Copenhagen, and Stockholm fell in the rankings, reflecting
    respondents’ views of their future prospects.
The Global Financial Centres Index 24 | 5

Asia/Pacific
•   The leading Asia/Pacific Centres performed well, closing the gap on London and New
    York at the top of the rankings;
•   Centres in the Asia/Pacific region generally rose in the ratings, continuing the trend
    which has been apparent over several years;
•   There were steady increases for Shanghai, Sydney, Beijing, and Guangzhou;
•   GIFT City (Gujarat) and Hangzhou entered the index for the first time.

North America
•   North American centres fell back in the rankings and ratings overall, although Los
    Angeles and Washington DC gained places in the index, with Washington DC
    reversing the fall it experienced in GFCI 23.

Eastern Europe and Central Asia
•   There were significant gains for Astana, Budapest, St Petersburg, and Tallinn. Astana
    only officially launched their financial centre in July, and it is unusual for such a new
    centre to perform so strongly;
•   The strong performance of Tallinn may reflect Estonia’s development of the e-society,
    including digital identity and smart ledger development, providing an alternative
    focus for Tallinn’s competitiveness;
•   Cyprus and Warsaw fell significantly in the ratings and rankings;
•   Sofia was a new entrant to the index.

Middle East and Africa
•   Dubai, Abu Dhabi, and Doha all rose significantly reversing the trend from GFCI 23;
•   Cape Town is the highest new entrant to the index, ranking 38th in its first entry.

Latin America and the Caribbean
•   There were mixed results in the region. Bermuda, Sao Paulo, Mexico City, and Rio de
    Janeiro performed strongly, while other centres fell in the rankings.

Island Centres
•   Island and Offshore centres fell in the index, with the exception of Bermuda, which
    rose six places;
•   The British Crown dependencies of Jersey, Guernsey, and the Isle of Man all fell
    significantly in the rankings, with the Isle of Man dropping 27 places in the index.
6 | The Global Financial Centres Index 24

Table 1 | GFCI 24 Ranks And Ratings

                                 GFCI 24                   GFCI 23            Change in   Change in
        Centre
                          Rank             Rating   Rank             Rating     Rank        Rating
New York                    1               788       2               793       ▲1          ▼5
London                      2               786       1               794       ▼1          ▼8
Hong Kong                   3               783       3               781        0          ▲2
Singapore                   4               769       4               765        0          ▲4
Shanghai                    5               766       6               741       ▲1          ▲25
Tokyo                       6               746       5               749       ▼1          ▼3
Sydney                      7               734       9               724       ▲2          ▲10
Beijing                     8               733      11               721       ▲3          ▲12
Zurich                      9               732      16               713       ▲7          ▲19
Frankfurt                  10               730      20               708       ▲10         ▲22
Toronto                    11               728       7               728       ▼4           0
Shenzhen                   12               726      18               710       ▲6          ▲16
Boston                     13               725      10               722       ▼3          ▲3
San Francisco              14               724       8               726       ▼6          ▼2
Dubai                      15               722      19               709       ▲4          ▲13
Los Angeles                16               721      17               712       ▲1          ▲9
Chicago                    17               717      14               718       ▼3          ▼1
Vancouver                  18               709      15               717       ▼3          ▼8
Guangzhou                  19               708      28               678       ▲9          ▲30
Melbourne                  20               699      12               720       ▼8          ▼21
Luxembourg                 21               694      21               701        0          ▼7
Osaka                      22               693      23               692       ▲1          ▲1
Paris                      23               691      24               687       ▲1          ▲4
Montreal                   24               690      13               719       ▼11         ▼29
Tel Aviv                   25               689      34               661       ▲9          ▲28
Abu Dhabi                  26               686      25               683       ▼1          ▲3
Geneva                     27               685      26               682       ▼1          ▲3
Casablanca                 28               684      32               664       ▲4          ▲20
Cayman Islands             29               683      22               700       ▼7          ▼17
Bermuda                    30               680      36               656       ▲6          ▲24
Qingdao                    31               679      33               662       ▲2          ▲17
Taipei                     32               670      30               673       ▼2          ▼3
Seoul                      33               668      27               679       ▼6          ▼11
Doha                       34               662      47               617       ▲13         ▲45
Amsterdam                  35               657      50               613       ▲15         ▲44
Washington DC              36               655      48               616       ▲12         ▲39
Dublin                     37               652      31               666       ▼6          ▼14
Cape Town                  38               651     New               New       New         New
Munich                     39               639      35               660       ▼4          ▼21
Kuala Lumpur               40               638      40               632        0          ▲6
Hamburg                    41               636      29               676       ▼12         ▼40
Calgary                    42               635      38               642       ▼4          ▼7
Edinburgh                  43               634      43               628        0          ▲6
Busan                      44               631      46               618       ▲2          ▲13
Wellington                 45               630      44               621       ▼1          ▲9
Monaco                     46               629      54               604       ▲8          ▲25
Jersey                     47               628      39               637       ▼8          ▼9
Bangkok                    48               626      37               643       ▼11         ▼17
Mauritius                  49               625      56               601       ▲7          ▲24
Glasgow                    50               622      49               614       ▼1          ▲8
The Global Financial Centres Index 24 | 7

Table 1 (Continued) | GFCI 24 Ranks And Ratings

                                  GFCI 24                       GFCI 23            Change in   Change in
         Centre
                           Rank             Rating       Rank             Rating     Rank        Rating
Vienna                      51               621          64               583       ▲13         ▲38
Tallinn                     52               620          79               559       ▲27         ▲61
Madrid                      53               619          41               631       ▼12         ▼12
Brussels                    54               617          62               592       ▲8          ▲25
Sao Paulo                   55               616          67               574       ▲12         ▲42
Milan                       56               613          61               593       ▲5          ▲20
Johannesburg                57               612          52               610       ▼5          ▲2
Stockholm                   58               611          42               629       ▼16         ▼18
Bahrain                     59               607          51               612       ▼8          ▼5
Guernsey                    60               603          53               605       ▼7          ▼2
Astana                      61               599          88               548       ▲27         ▲51
Mexico City                 62               598          70               569       ▲8          ▲29
British Virgin Islands      63               597          60               594       ▼3          ▲3
Oslo                        64               596          55               602       ▼9          ▼6
Rio de Janeiro              65               594          81               557       ▲16         ▲37
Warsaw                      66               592          45               620       ▼21         ▼28
Bahamas                     67               591          59               596       ▼8          ▼5
Istanbul                    68               590          76               562       ▲8          ▲28
Riyadh                      69               588          68               573       ▼1          ▲15
Lisbon                      70               585          74               564       ▲4          ▲21
Budapest                    71               584          89               547       ▲18         ▲37
Rome                        72               583          65               579       ▼7          ▲4
Liechtenstein               73               582          69               570       ▼4          ▲12
Prague                      74               581          71               567       ▼3          ▲14
Gibraltar                   75               580          66               576       ▼9          ▲4
Jakarta                     76               579          90               546       ▲14         ▲33
GIFT City-Gujarat           77               578         New               New       New         New
Tianjin                     78               577          63               588       ▼15         ▼11
Chengdu                     79               576          82               556       ▲3          ▲20
St Petersburg               80               575          91               531       ▲11         ▲44
Copenhagen                  81               573          58               599       ▼23         ▼26
New Delhi                   82               572          78               560       ▼4          ▲12
Moscow                      83               571          83               555        0          ▲16
Reykjavik                   84               570          93               521       ▲9          ▲49
Isle of Man                 85               568          57               600       ▼28         ▼32
Manila                      86               566          84               554       ▼2          ▲12
Riga                        87               565          87               551        0          ▲14
Malta                       88               564          77               561       ▼11         ▲3
Hangzhou                    89               563         New               New       New         New
Panama                      90               562          80               558       ▼10         ▲4
Cyprus                      91               560          72               566       ▼19         ▼6
Mumbai                      92               558          73               565       ▼19         ▼7
Buenos Aires                93               557          75               563       ▼18         ▼6
Helsinki                    94               556          85               553       ▼9          ▲3
Baku                        95               555          95               511        0          ▲44
Almaty                      96               550          94               519       ▼2          ▲31
Sofia                       97               544         New               New       New         New
Athens                      98               518          92               525       ▼6          ▼7
Trinidad and Tobago         99               510          86               552       ▼13         ▼42
Dalian                      100              499          96               501       ▼4          ▼2
8 | The Global Financial Centres Index 24

We track centres which are included in the GFCI questionnaire but have yet to achieve
the number of assessments required to be listed in the main GFCI index. Table 2 lists
the ten centres which fall into this category of ‘associate centre’.
Table 2 | Associate Centres

                                                 Number of Assessments
                  Centre                                                  Mean of Assessments
                                                  in the last 24 months
Kuwait City                                                86                    549
Karachi                                                    83                    543
Tehran                                                     83                    494
Barbados                                                   80                    518
Stuttgart                                                  72                    676
Nairobi                                                    69                    491
Bratislava                                                 68                    499
Santiago                                                   49                    563
Andorra                                                    48                    442
San Diego                                                  47                    651

Regional Performance
Western Europe’s position as the leader in financial centres has been challenged over
time, with the average assessment of the top five centres in Asia/Pacific and North
America overtaking Western Europe. The top centres in other regions have improved
over time and narrowed the gap with other regions; and have rallied following a
downturn in GFCI 23.

Chart 1 | Average Ratings Of The Top Five Centres In Each Region
The Global Financial Centres Index 24 | 9
The Top Five Centres
New York took first place in the index in GFCI 24, though New York’s lead over London is
only two points (on a scale of 1,000). Shanghai has overtaken Tokyo to enter the top
five in GFCI 24. The rise of Chinese centres is marked at the top of the index. Hong
Kong, Singapore, and Shanghai have all continued to close the gap on the leaders, with
Hong Kong now only three points behind London.
Chart 2 | The Top Five Centres— GFCI Ratings Over Time
825
775
725
675
625
New York
London
575 Hong Kong
Singapore
Shanghai
525
“New York and London don’t seem to be doing
anything to fight off the Asian challenge.”
COMMERCIAL BANKER BASED IN PARIS10 | The Global Financial Centres Index 24
Future Prospects
The GFCI questionnaire asks respondents which centres they consider will become
more significant over the next two to three years. Table 3 shows the top 15 centres
mentioned. Eight of the top 15 centres are in the Asia/Pacific region.
Table 3 | The 15 Centres Likely To Become More Significant
Centre Mentions in last 24 months
Shanghai 198
Qingdao 107
GIFT City - Gujarat 101
Frankfurt 73
Singapore 65
Dublin 45
Hong Kong 39
Chengdu 37
Casablanca 30
Beijing 30
Paris 30
Shenzhen 27
London 25
Luxembourg 25
Seoul 22
“Frankfurt is definitely winning some business this
year and Brexit will continue to help it.”
INSURANCE UNDERWQRITER BASED IN LONDONThe Global Financial Centres Index 24 | 11
Areas Of Competitiveness
The instrumental factors used in the GFCI model are grouped into five broad areas of
competitiveness: Business Environment, Human Capital, Infrastructure, Financial Sector
Development, and Reputation. These areas and the instrumental factor groups which
comprise each area are shown in chart 3.
Chart 3 | GFCI Areas Of Competitiveness
Areas of
Competitiveness
Business Financial Sector
Human Capital Infrastructure Reputation
Environment Development
Depth and
Political Stability Availability of Built City Brand
Breadth of
and Rule of Law Skilled Personnel Infrastructure and Appeal
Industry Clusters
Institutional and
Flexible Labour ICT Availability of Level of
Regulatory
Market Infrastructure Capital Innovation
Environment
Attractiveness
Macroeconomic Education and Transport Market
and Cultural
Environment Development Infrastructure Liquidity
Diversity
Comparative
Tax and Cost Quality Sustainable Economic
Positioning with
Competitiveness of Life Development Output
Other Centres12 | The Global Financial Centres Index 24
To assess how financial centres perform in each of these areas, the GFCI factor
assessment model is run separately for each of the five areas of competitiveness at a
time. The top 15 ranked centres in each of these sub-indices are shown in table 4. The
top financial centres of the world are well developed and strong in most areas. The top
four financial centres overall hold the top four positions in five of the five sub-indices.
Table 4 | GFCI 24 Top 15 By Area Of Competitiveness
Business Financial Sector Reputational
Rank Human Capital Infrastructure
Environment Development and General
1 London Hong Kong Hong Kong New York New York
2 New York London New York London London
3 Hong Kong New York London Hong Kong Hong Kong
4 Singapore Singapore Singapore Singapore Singapore
5 Chicago Tokyo Shanghai Shanghai Chicago
6 Shanghai San Francisco Tokyo Tokyo San Francisco
7 San Francisco Shanghai Dubai Frankfurt Boston
8 Boston Chicago Beijing Sydney Shanghai
9 Toronto Dubai Sydney Dubai Los Angeles
10 Tokyo Los Angeles San Francisco San Francisco Tokyo
11 Dubai Boston Boston Zurich Zurich
12 Sydney Beijing Toronto Boston Toronto
13 Frankfurt Toronto Frankfurt Chicago Sydney
14 Montreal Frankfurt Zurich Toronto Dubai
15 Zurich Paris Paris Shenzhen DublinThe Global Financial Centres Index 24 | 13
Factors affecting Competitiveness
The GFCI questionnaire asks respondents to indicate which factors of competitiveness
they consider the most important at this time. The number of times that each area was
mentioned and the key issues raised by respondents are shown in table 5.
Table 5 | GFCI 24 Main Areas Of Competitiveness
Area of Competitiveness Number of Mentions Main Issues
Brexit continues as the major source of uncertainty for many centres
Business Environment 457
Protectionism / potential trade wars continue to worry many
Human rights and personal safety are now key concerns
Human Capital 407
UK and USA respondents fear restrictions in movement of talented staff
Promotion is more important than ever
Reputation 401
Fears about terrorism and war have increased
How to foster a FinTech environment is a hot topic
Infrastructure 347
Great need for increased air travel connectivity in some centres
Will London lose its critical mass after Brexit?
Financial Sector Development 322
Banks looking to rationalise locations
“Getting very fed up with Brexit - we cannot continue
to operate with some much uncertainty. Many of
the staff here are trying to plan for their futures.”
PENSION FUND MANAGER BASED IN LONDON14 | The Global Financial Centres Index 24 Regulatory Quality In developing our research into financial centres, we have found that the quality of regulation in a centre, as well as overall government effectiveness are significant factors in a financial centre’s competitiveness. Charts 4 and 5 map two instrumental factors that relate to the quality of regulation and government and demonstrate the correlation of these factors with the GFCI 24 rating (the size of the bubble indicates the relative GDP of each centre). Chart 4 | Rating Against Regulatory Quality Factor Chart 5 | Rating against Government Effectiveness Factor
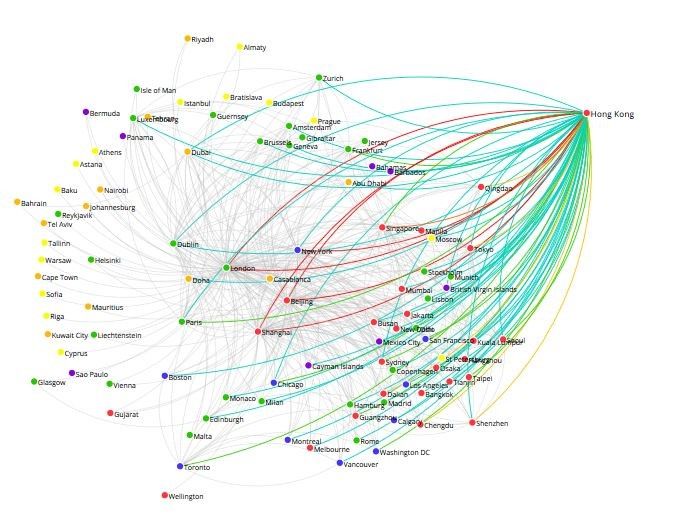
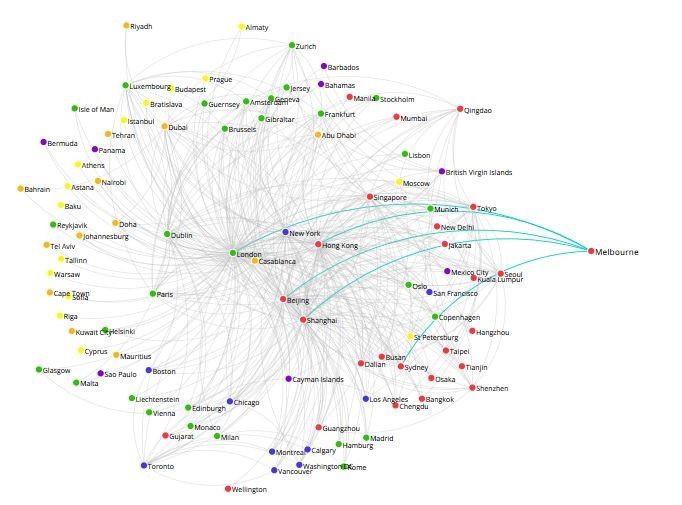
The Global Financial Centres Index 24 | 15

Connectivity
Financial centres thrive when they are develop deep connections with other centres.
The GFCI allows us to measure connectivity by investigating the number of assessments
given to and received from other financial centres. Charts 6 and 7 show the different
levels of connectivity enjoyed by Hong Kong and Melbourne to demonstrate the
contrast.
Chart 6 | GFCI 24 Connectivity — Hong Kong

Chart 7 | GFCI 24 Connectivity — Melbourne
16 | The Global Financial Centres Index 24

Financial Centre Profiles
                                                     Chart 8 | GFCI 24 Profile Elements
Using clustering and correlation analysis we
have identified three measures (axes) that
determine a financial centre’s profile along
different dimensions of competitiveness.
‘Connectivity’ – the extent to which a
centre is well connected around the world,
based on the number of assessments given
by and received by that centre from
professionals based in other centres.
A centre’s connectivity is assessed using a combination of ‘inbound’ assessment
locations (the number of locations from which a particular centre receives
assessments) and ‘outbound’ assessment locations (the number of other centres
assessed by respondents from a particular centre). If the weighted assessments for a
centre are provided by over 55 per cent of other centres, this centre is deemed to be
‘Global’. If the ratings are provided by over 40 per cent of other centres, this centre is
deemed to be ‘International’.
 ‘Diversity’– the instrumental factors used in the GFCI model give an indication of a
range of factors that influence the richness and evenness of areas of competitiveness
that characterise any particular financial centre. We consider this span of factors to be
measurable in a similar way to that of the natural environment. We therefore use a
combination of biodiversity indices (calculated on the instrumental factors) to assess a
centre’s diversity taking account of the range of factors against which the centre has
been assessed – the ‘richness’ of the centre’s business environment; and the
‘evenness’ of the distribution of that centre’s scores. A high score means that a centre
is well diversified; a low diversity score reflects a less rich business environment.
 ‘Speciality’ – the depth within a financial centre of the following industry sectors:
investment management, banking, insurance, professional services, and the
government and regulatory sector. A centre’s ‘speciality’ performance is calculated
from the difference between the GFCI rating and the industry sector ratings.
In table 6 ‘Diversity’ (Breadth) and ‘Speciality’ (Depth) are combined on one axis to
create a two dimensional table of financial centre profiles. The 100 centres in GFCI 24
are assigned a profile on the basis of a set of rules for the three measures: how well
connected a centre is, how broad its services are, and how specialised it is.
The 14 Global Leaders (in the top left of the table) have both broad and deep financial
services activities and are connected with many other financial centres. This list
includes the top nine global financial centres in GFCI 24.
Significant changes in GFCI 24 include Dublin, Seoul and Frankfurt moving out of the
Global Leaders section to feature as Global Diversified Centres. An asterix by a centre’s
name indicates a movement from the profile in GFCI 23
The Global Financial Centres Index 24 | 17
Brussels has moved from International Diversified to Global Diversified and San Francisco
has moved from Established International to Global Diversified. Astana has moved to
become a Global Specialist.
Table 6 | GFCI 24 Financial Centre Profiles
Broad & Deep Relatively Broad Relatively Deep Emerging
Global Leaders Global Diversified Global Specialists Global Contenders
Abu Dha bi Ams terda m As tana * Luxembourg*
Beijing Brus s els * Shenzhen Qingda o
Duba i Chica go
Hong Kong Dublin*
London Fra nkfurt*
New York Mila n
Pa ris Mos cow
Global
Sha ngha i Sa n Fra ncis co*
Singa pore Seoul*
Sydney Wa s hington DC
Tokyo
Toronto
Zurich
Established International International International
International Diversified Specialists Contenders
Ba ngkok* Copenha gen Alma ty* Bus a n*
Bos ton* Edinburgh Bermuda * Chengdu*
Ca lga ry* Ha mburg* Britis h Virgin Is la nds GIFT City-Guja ra t (New)
Geneva Joha nnes burg Ca s a bla nca Da lia n
International Is tanbul Ma drid Ca yma n Is la nds
Kua la Lumpur Munich Doha *
Los Angeles Stockholm* Gua ngzhou*
Melbourne Wa rs a w* Guerns ey
Montrea l Jers ey*
Rio de Ja neiro New Delhi*
Va ncouver Ta ipei*
Established Players Local Diversified Local Specialists Evolving Centres
Buda pes t* Athens Ba ha ma s Ba hra in
Buenos Aires * Hels inki Ca pe Town (New) Ba ku
Gla s gow* Lis bon Gibra ltar* Cyprus
Mexico City Mumba i Is le of Ma n Ha ngzhou
Os a ka Os lo Liechtens tein Ja ka rta
Local
Pra gue Vienna * Ma nila Ma lta
Rome* Ma uritius Reykja vik
Sa o Pa ulo Mona co Riga
Tel Aviv Pa na ma * Riya dh
Wellington* Sofia (New) Tia njin
St Peters burg* Trinida d a nd Toba go*
Ta llinn*18 | The Global Financial Centres Index 24
The GFCI 24 World
82
42 See Detailed
18
11
24
Map Below
13
14
17 1
16
36
30 28
67
62
29 63
88 99
65
55
38
92
The numbers on the map indicate the GFCI 24 rankings. Black dots denote Associate Centres:
Broad and Deep Relatively Broad Relatively Deep Emerging
Global Leaders Global Diversified Global Specialists Global Contenders
Established International International Diversified International Specialists International Contenders
Established Players Local Diversified Local Specialists Evolving CentresThe Global Financial Centres Index 24 | 19
81
61
68 94 95 33
8 77
6
100 44
90 25 31
89 22
5 98
59 80 19
34 15 12 32
69 83
26 3
91 48 85
40
4
76
49
57
7
20
45
93
78
64
58 52
79 86
50 43
84 35 41
37 2 66
54
10
47
21 74
60 39
23 71
51
9
73
27 56
46 96
53 72
70 97
75
8720 | The Global Financial Centres Index 24
Regional Analysis
In our analysis of the GFCI data, we look at six regions of the world to explore the
competitiveness of their financial centres.
Alongside the ranks and ratings of centres, we look at trends in the leading centres in
each region; and investigate the average assessments received by regions and centres in
more detail.
We display this analysis in charts which show:
• the mean assessment provided to that region or centre;
• the difference in the mean assessment when home region assessments are
removed from the analysis;
• the difference between the mean and the assessments provided by other regional
centres;
• the proportion of assessments provided by each region.
Charts 9 and 10 show examples of these analyses. Coloured bars to the left of the
vertical axis indicate that respondents from that region gave lower than the average
assessments. Bars to the right indicate respondents from that region gave higher than
average assessments. It is important to recognise that assessments given to a centre by
people based in that centre are excluded to remove ‘home’ bias.
The additional vertical axis (in red) shows the mean of assessments when assessments
from the home region are removed. The percentage figure noted by each region
indicates the percentage of the total number of assessments that are from that region.
“My single biggest concern is the looming trade war
between the USA and China. That could really have
a devastating effect on the world economy.”
ECONOMIST BASED IN CASABLANCAThe Global Financial Centres Index 24 | 21
Chart 9 | Example 1: Assessments Compared With The Mean For Region 6
This line shows that the assessments
given by other regions and excluding
those from region 6 had an average 10
points lower than the overall mean.
Respondents from region 6 rated their
home centres higher than
respondents from other regions.
This percentage shows
This bar shows that that 32 per cent of
assessments from assessments for region
centres in this region 6 came from centres in
Region 1 (32%)
averaged 41 points region 1.
below the mean for Region 2 (24%)
region 6.
Region 3 (7%)
Region 4 (5%)
Region 5 (9%) This bar shows that
assessments from centres in
Region 6 (15%) this region averaged 72
points above the mean for
Multi-Regional (8%) region 6.
-125 -75 -25 623 25 75 125
This figure is the mean of all
assessments in the GFCI for
region 6.
Chart 10 | Example 2: Assessments Compared With The Mean For An Individual Centre22 | The Global Financial Centres Index 24
Western Europe
Assessments show a range of movement, with Zurich, Frankfurt, Amsterdam, Vienna
moving up the rankings significantly. Dublin, Munich, Hamburg, and Stockholm fell in
the rankings. These movements are likely to be the result of perceptions of the likely
winners and losers from Brexit.
Western European centres were on average rated lower by other centres in the region
and by centres in Eastern Europe & Central Asia. Other regions gave higher
assessments than the overall mean.
Table 7 | Western European Top 15 Centres In GFCI 24
GFCI 24 GFCI 23 Change in Change in
Centre
Rank Rating Rank Rating Rank Rating
London 2 786 1 794 ▼1 ▼8
Zurich 9 732 16 713 ▲7 ▲19
Frankfurt 10 730 20 708 ▲10 ▲22
Luxembourg 21 694 21 701 0 ▼7
Paris 23 691 24 687 ▲1 ▲4
Geneva 27 685 26 682 ▼1 ▲3
Amsterdam 35 657 50 613 ▲15 ▲44
Dublin 37 652 31 666 ▼6 ▼14
Munich 39 639 35 660 ▼4 ▼21
Hamburg 41 636 29 676 ▼12 ▼40
Edinburgh 43 634 43 628 0 ▲6
Monaco 46 629 54 604 ▲8 ▲25
Jersey 47 628 39 637 ▼8 ▼9
Glasgow 50 622 49 614 ▼1 ▲8
Vienna 51 621 64 583 ▲13 ▲38
Chart 11 | Top Five Western European Centres Over TimeThe Global Financial Centres Index 24 | 23
Chart 12| Average Assessments By Region For Western Europe – Difference From The Overall Mean
Western Europe (43%)
Asia/Pacific (28%)
North America (5%)
Eastern Europe & Central Asia (5%)
Middle East & Africa (8%)
Latin America & the Caribbean (3%)
Multi-Regional (8%)
-150 -100 -50 0
640
657 50 100 150
Chart 13 | Assessments By Region For London — Difference From The Overall Mean
Wes tern Europe (23%)
As i a/Pacific (43%)
North Ameri ca (8%)
Ea s tern Europe & Central As ia (6%)
Mi ddle East & Afri ca (8%)
La ti n America & the Caribbean (3%)
Mul ti -Regional (9%)
845
-150 -100 -50 0
845 50 100 150
Chart 14 | Assessments By Region For Zurich — Difference From The Overall Mean
Wes tern Europe (42%)
As i a/Pacific (28%)
North Ameri ca (7%)
Ea s tern Europe & Central As ia (5%)
Mi ddle East & Afri ca (7%)
La tin America & the Caribbean (3%)
Mul ti -Regional (9%)
766
-150 -100 -50 0
766 50 100 150
Chart 15 | Assessments By Region For Frankfurt — Difference From The Overall Mean
Wes tern Europe (44%)
As i a/Pacific (33%)
North Ameri ca (4%)
Ea s tern Europe & Central As ia (5%)
Mi ddle East & Afri ca (5%)
La ti n America & the Caribbean (1%)
Mul ti-Regional (9%)
748
-150 -100 -50 0
748 50 100 15024 | The Global Financial Centres Index 24
Asia/Pacific
The majority of the leading centres in the Asia/Pacific region rose in the ratings.
Shanghai overtook Tokyo to take fifth place in the index. Melbourne and Seoul fell in
the rankings. GIFT City (Gujarat) and Hangzhou were new entrants to the index.
Respondents from centres in the Asia/Pacific region assessed other centres in the
region slightly higher than the mean. All other regions other than Western Europe
assessed Asia/Pacific centres higher than the mean.
Table 8 | Asia/Pacific Top 15 Centres In GFCI 24
GFCI 24 GFCI 23 Change in Change in
Centre
Rank Rating Rank Rating Rank Rating
Hong Kong 3 783 3 781 0 ▲2
Singapore 4 769 4 765 0 ▲4
Shanghai 5 766 6 741 ▲1 ▲25
Tokyo 6 746 5 749 ▼1 ▼3
Sydney 7 734 9 724 ▲2 ▲10
Beijing 8 733 11 721 ▲3 ▲12
Shenzhen 12 726 18 710 ▲6 ▲16
Guangzhou 19 708 28 678 ▲9 ▲30
Melbourne 20 699 12 720 ▼8 ▼21
Osaka 22 693 23 692 ▲1 ▲1
Qingdao 31 679 33 662 ▲2 ▲17
Taipei 32 670 30 673 ▼2 ▼3
Seoul 33 668 27 679 ▼6 ▼11
Kuala Lumpur 40 638 40 632 0 ▲6
Busan 44 631 46 618 ▲2 ▲13
Chart 16 | Top Five Asia/Pacific Centres Over Time
800
750
700
650
600
550
Hong Kong
Singapore
500 Shanghai
Tokyo
Sydney
450The Global Financial Centres Index 24 | 25
Chart 17 | GFCI 24 Average Assessments By Region For Asia/Pacific – Difference From The Overall Mean
Western Europe (18%)
Asia/Pacific (60%)
North America (6%)
Eastern Europe & Central Asia (3%)
Middle East & Africa (4%)
Latin America & the Caribbean (1%)
Multi-Regional (8%)
-150 -100 -50 0
657 50 100 150
Chart 18 | Assessments By Region For Hong Kong — Difference From The Overall Mean
Wes tern Europe (25%)
As i a/Pacific (50%)
North Ameri ca (8%)
Ea s tern Europe & Central As ia (3%)
Mi ddle East & Afri ca (4%)
La ti n America & the Caribbean (2%)
Mul ti -Regional (9%)
-150 -100 -50 0
844 50 100 150
Chart 19 | Assessments By Region For Singapore — Difference From The Overall Mean
Wes tern Europe (31%)
As i a/Pacific (41%)
North Ameri ca (7%)
Ea s tern Europe & Central As ia (6%)
Mi ddle East & Afri ca (6%)
La ti n America & the Caribbean (2%)
Mul ti-Regional (9%)
-150 -100 -50 859
0 50 100 150
Chart 20 | Assessments By Region For Shanghai — Difference From The Overall Mean
Wes tern Europe (13%)
As i a/Pacific (68%)
North Ameri ca (6%)
Ea s tern Europe & Central As ia (2%)
Mi ddle East & Afri ca (3%)
La ti n America & the Caribbean (1%)
Mul ti -Regional (9%)
-150 -100 -50 0
825 50 100 15026 | The Global Financial Centres Index 24
North America
New York overtook London to take top place in the index. Most other North American
centres fell in the rankings. Washington DC rose 12 places, regaining some of the
ground it lost in GFCI 23.
Respondents from North American centres assessed other centres in the region very
slightly higher than the average for all assessments. The Middle East and Africa and
Western Europe scored North American centres lower than the mean.
Table 9 | North American Centres In GFCI 24
GFCI 24 GFCI 23 Change in Change in
Centre
Rank Rating Rank Rating Rank Rating
New York 1 788 2 793 ▲1 ▼5
Toronto 11 728 7 728 ▼4 0
Boston 13 725 10 722 ▼3 ▲3
San Francisco 14 724 8 726 ▼6 ▼2
Los Angeles 16 721 17 712 ▲1 ▲9
Chicago 17 717 14 718 ▼3 ▼1
Vancouver 18 709 15 717 ▼3 ▼8
Montreal 24 690 13 719 ▼11 ▼29
Washington DC 36 655 48 616 ▲12 ▲39
Calgary 42 635 38 642 ▼4 ▼7
Chart 21 | Top Five North American Centres Over Time
850
800
750
700
650
New York
Toronto
600 Boston
San Francisco
Los Angeles
550The Global Financial Centres Index 24 | 27
Chart 22 | Average Assessments By Region For North America – Difference From The Overall Mean
Multi-Regional (7%)
772
Chart 23 | Assessments By Region For New York — Difference From The Overall Mean
Wes tern Europe (30%)
As i a/Pacific (40%)
North Ameri ca (8%)
Ea s tern Europe & Central As ia (4%)
Mi ddle East & Afri ca (7%)
La ti n America & the Caribbean (3%)
Mul ti -Regional (9%)
-150 -100 -50 0
861 50 100 150
Chart 24 | Assessments By Region for Toronto — Difference From The Overall Mean
Wes tern Europe (27%)
As i a/Pacific (40%)
North Ameri ca (14%)
Ea s tern Europe & Central As ia (1%)
Mi ddle East & Afri ca (7%)
La ti n America & the Caribbean (4%)
Mul ti-Regional (9%)
-150 -100 -50 0
766 50 100 150
Chart 25 | Assessments By Region For Boston — Difference From The Overall Mean
Wes tern Europe (29%)
As i a/Pacific (35%)
North Ameri ca (17%)
Ea s tern Europe & Central As ia (2%)
Mi ddle East & Afri ca (7%)
La ti n America & the Caribbean (3%)
Mul ti-Regional (9%)
-150 -100 -50 0
746 50 100 15028 | The Global Financial Centres Index 24
Eastern Europe And Central Asia
In Eastern Europe & Central Asia, Tallinn, Astana, Budapest and St Petersburg rose
sharply in the index. Astana showed considerable gains following its launch at the
beginning of 2018. Other centres reversed the trend from GFCI 23. Sofia entered the
index for the first time.
Respondents from centres in the Eastern Europe & Central Asia region assessed other
regional centres higher than the mean, as did those from other regions except for
Western Europe and North America.
Table 10 | Eastern European And Central Asian Centres In GFCI 24
GFCI 24 GFCI 23 Change in Change in
Centre
Rank Rating Rank Rating Rank Rating
Tallinn 52 620 79 559 ▲27 ▲61
Astana 61 599 88 548 ▲27 ▲51
Warsaw 66 592 45 620 ▼21 ▼28
Istanbul 68 590 76 562 ▲8 ▲28
Budapest 71 584 89 547 ▲18 ▲37
Prague 74 581 71 567 ▼3 ▲14
St Petersburg 80 575 91 531 ▲11 ▲44
Moscow 83 571 83 555 0 ▲16
Riga 87 565 87 551 0 ▲14
Cyprus 91 560 72 566 ▼19 ▼6
Baku 95 555 95 511 0 ▲44
Almaty 96 550 94 519 ▼2 ▲31
Sofia 97 544 New New New New
Athens 98 518 92 525 ▼6 ▼7
Chart 26 | GFCI 24 Top Five Eastern European And Central Asian Centres Over TimeThe Global Financial Centres Index 24 | 29
Chart 27 | Average Assessments By Region For Eastern Europe And Central Asia — Difference From The
Overall Mean
Western Europe (33%)
Asia/Pacific (26%)
North America (7%)
Eastern Europe & Central Asia (16%)
Middle East & Africa (8%)
Latin America & the Caribbean (2%)
-238 Multi-Regional (8%)
-150 -100 -50 0
657 50 100 150
Chart 28 | Assessments By Region For Tallinn — Difference From The Overall Mean
Wes tern Europe (43%)
As i a/Pacific (21%)
North Ameri ca (4%)
Ea s tern Europe & Central As ia (13%)
Mi ddle East & Afri ca (10%)
La ti n America & the Caribbean (N/A)
Mul ti -Regional (9%)
-150 -100 -50 0
567 50 100 150
Chart 29 | Assessments By Region For Astana — Difference From The Overall Mean
Wes tern Europe (30%)
As i a/Pacific (31%)
North Ameri ca (9%)
Ea s tern Europe & Central As ia (11%)
Mi ddle East & Afri ca (8%)
La ti n America & the Caribbean (1%)
Mul ti -Regional (9%)
-150 -100 -50 0
581 50 100 150
Chart 30 | Assessments By Region For Warsaw — Difference From The Overall Mean
Wes tern Europe (44%)
As i a/Pacific (19%)
North Ameri ca (9%)
Ea s tern Europe & Central As ia (13%)
Mi ddle East & Afri ca (8%)
La ti n America & the Caribbean (0%)
Mul ti -Regional (9%)
-150 -100 -50 582
0 50 100 15030 | The Global Financial Centres Index 24
The Middle East and Africa
The leading centres in the Middle East and Africa rose in the index, while Johannesburg,
Bahrain,and Riyadh fell. Cape Town entered the index for the first time with a high
placement at 38 in the index.
Respondents from centres in the Middle East and Africa scored other regional centres
lower than the mean, as did respondents from Western Europe and Latin America & the
Caribbean.
Table 11 | Middle East And African Centres In GFCI 24
GFCI 24 GFCI 23 Change in Change in
Centre
Rank Rating Rank Rating Rank Rating
Dubai 15 722 19 709 ▲4 ▲13
Tel Aviv 25 689 34 661 ▲9 ▲28
Abu Dhabi 26 686 25 683 ▼1 ▲3
Casablanca 28 684 32 664 ▲4 ▲20
Doha 34 662 47 617 ▲13 ▲45
Cape Town 38 651 New New New New
Mauritius 49 625 56 601 ▲7 ▲24
Johannesburg 57 612 52 610 ▼5 ▲2
Bahrain 59 607 51 612 ▼8 ▼5
Riyadh 69 588 68 573 ▼1 ▲15
Chart 31 | GFCI 24 Top Five Middle East And African Centres Over TimeThe Global Financial Centres Index 24 | 31
Chart 32 | Average Assessments By Region For The Middle East And Africa — Difference From The
Overall Mean
Western Europe (32%)
Asia/Pacific (27%)
North America (7%)
Eastern Europe & Central Asia (6%)
Middle East & Africa (18%)
Latin America & the Caribbean (2%)
Multi-Regional (8%)
-150 -100 -50 0
640 50 100 150
Chart 33 | Assessments By Region For Dubai — Difference From The Overall Mean
Wes tern Europe (34%)
As i a/Pacific (29%)
North Ameri ca (6%)
Ea s tern Europe & Central As ia (8%)
Mi ddle East & Afri ca (13%)
La ti n America & the Caribbean (1%)
Mul ti -Regional (9%)
-150 -100 -50 0
730 50 100 150
Chart 34 | Assessments By Region For Tel Aviv — Difference From The Overall Mean
Wes tern Europe (45%)
As i a/Pacific (17%)
North Ameri ca (13%)
Ea s tern Europe & Central As ia (4%)
Mi ddle East & Afri ca (9%)
La ti n America & the Caribbean (4%)
Mul ti-Regional (8%)
-150 -100 -50 0
644 50 100 150
Chart 35 | Assessments By Region For Abu Dhabi — Difference From The Overall Mean
Wes tern Europe (33%)
As i a/Pacific (32%)
North Ameri ca (6%)
Ea s tern Europe & Central As ia (7%)
Mi ddle East & Afri ca (12%)
La ti n America & the Caribbean (2%)
Mul ti -Regional (8%)
-150 -100 -50 0
673 50 100 15032 | The Global Financial Centres Index 24
Latin America and the Caribbean
There were mixed results in Latin America and the Caribbean. Bermuda, Sao Paulo,
Mexico City, and Rio de Janeiro all rose in the index, while other centres fell.
Centres in the region assessed other centres higher than the average assessments from
other regions. Respondents from Western Europe and the Middle East and Africa gave
lower assessments than the average.
Table 12 | Latin American And Caribbean Centres In GFCI 24
GFCI 24 GFCI 23 Change in Change in
Centre
Rank Rating Rank Rating Rank Rating
Cayman Islands 29 683 22 700 ▼7 ▼17
Bermuda 30 680 36 656 ▲6 ▲24
Sao Paulo 55 616 67 574 ▲12 ▲42
Mexico City 62 598 70 569 ▲8 ▲29
British Virgin Islands 63 597 60 594 ▼3 ▲3
Rio de Janeiro 65 594 81 557 ▲16 ▲37
Bahamas 67 591 59 596 ▼8 ▼5
Panama 90 562 80 558 ▼10 ▲4
Buenos Aires 93 557 75 563 ▼18 ▼6
Trinidad and Tobago 99 510 86 552 ▼13 ▼42
Chart 36 | Top Five Latin American And Caribbean Centres Over TimeThe Global Financial Centres Index 24 | 33
Chart 37 | Average Assessments By Region For Latin America And The Caribbean – Difference From The
Overall Mean
Western Europe (30%)
Asia/Pacific (26%)
North America (9%)
Eastern Europe & Central Asia (4%)
Middle East & Africa (9%)
Latin America & the Caribbean (14%)
Multi-Regional (8%)
-150 -100 -50 591
0
640 50 100 150
Chart 38 | Assessments By Region For The Cayman Islands — Difference From The Overall Mean
Wes tern Europe (38%)
As i a/Pacific (22%)
North Ameri ca (11%)
Ea s tern Europe & Central As ia (2%)
Mi ddle East & Afri ca (8%)
La ti n America & the Caribbean (12%)
Mul ti -Regional (7%)
-150 -100 -50 660
0 50 100 150
Chart 39 | Assessments By Region For Bermuda — Difference From The Overall Mean 198
Wes tern Europe (40%)
As i a/Pacific (15%)
North Ameri ca (9%)
Ea s tern Europe & Central As ia (4%)
Mi ddle East & Afri ca (11%)
La ti n America & the Caribbean (13%)
Mul ti -Regional (7%)
-150 -100 -50 640
0 50 100 150
Chart 40 | Assessments By Region For Sao Paulo — Difference From The Overall Mean
Wes tern Europe (28%)
As i a/Pacific (29%)
North Ameri ca (9%)
Ea s tern Europe & Central As ia (2%)
Mi ddle East & Afri ca (5%)
La ti n America & the Caribbean (20%)
Mul ti -Regional (7%)
-150 -100 -50 629
0 50 100 15034 | The Global Financial Centres Index 24 Home Centre Prospects While the GFCI is calculated using only assessments from other centres, we ask respondents about the prospects of the centre in which they are based; and specifically whether their ‘home’ centre will become more or less competitive. In general, people are more optimistic about the future of their own centre than people outside that centre. However, respondents in London are less optimistic than those in other centres, reflecting the uncertainty over Brexit. Chart 41 | Home Centre Prospects — New York Chart 42 | Home Centre Prospects — London Chart 43 | Home Centre Prospects — Hong Kong Chart 44 | Home Centre Prospects — Singapore
The Global Financial Centres Index 24 | 35

Stability
    The GFCI model allows for an analysis of the volatility in financial centre competitiveness.
    Chart 45 contrasts the ‘spread’ or variance of the individual assessments given to each of
    the top 40 centres with the sensitivity to changes in the instrumental factors.

    The chart shows three bands of financial centres. The unpredictable centres in the top
    right of the chart have a higher sensitivity to changes in the instrumental factors and a
    higher variance of assessments. These centres have the highest potential future
    movement. The stable centres in the bottom left have a lower sensitivity to changes in
    the instrumental factors and a lower variance of assessments.

    We have only plotted the top 40 centres (for clarity) but it is worth noting that most of
    the centres lower in the index would be in the dynamic and unpredictable areas of the
    chart if plotted.

Chart 45 | The Stability Of The Top 40 Centres In GFCI 24

                                                    Dynamic Centres                                                          Unpredictable Centres

                                                                                                 Casablanca                              Tel Aviv

                                                                               Bermuda
                                                                                                                 Cayman Islands
                                                                                                                               Doha
Increasing Standard Deviation Of GFCI Rankings

                                                                                       Seoul
                                                                           Abu Dhabi                                       Luxembourg
                                                                       Munich
                                                                              Amsterdam
                                                                                                   Cape Town
                                                                                        Dublin
                                                                        Paris                Frankfurt       Geneva
                                                               Dubai                                              Osaka
                                                                                                              Melbourne
                                                                           Zurich                           Kuala Lumpur   Taipei Montreal
                                                                            Washington DC
                                                               Toronto       San Francisco Beijing            Vancouver
                                                      London                                      Sydney Guangzhou
                                                                            Shanghai Chicago Los Angeles
                                                                 Boston        Tokyo
                                                                             New York Shenzhen
                                                             Hong Kong
                                                 Singapore                       Qingdao

                                                   Stable Centres

                                                                       Increasing Variance Of Assessments
36 | The Global Financial Centres Index 24
We can also look at the stability of rankings in the index over time. Chart 46 shows the
standard deviation of index rankings against the variance in assessments over the last 24
months.
Chart 46 | Variance In Index Rankings And Assessments Over Time
Dynamic Centres Unpredictable Centres
Increasing Standard Deviation Of GFCI Rankings
Stable Centres
Increasing Variance Of Assessments
“We all know about Hong Kong and Shanghai but a
number of secondary Chinese centres are appearing
on the radar now.”
INVESTMENT BANKER BASED IN NEW YORKThe Global Financial Centres Index 24 | 37
Reputation
We look at reputation in the GFCI model by examining the difference between the
weighted average assessment given to a financial centre and the overall rating in the
index.
The first measure reflects the average score a centre receives from financial
professionals across the world, adjusted for time, with more recent assessments given
more weight. (see Appendix 3 for details).
The second measure is the GFCI rating itself, which represents the assessments
adjusted to take account of the instrumental factors. If a centre has a higher average
assessment than its GFCI rating, this indicates that respondents’ perceptions of a centre
are more favourable than the quantitative measures alone suggest.
Table 13 shows the top 15 centres with the greatest positive difference between the
average assessment and the GFCI rating. Ten of the top 15 centres in terms of reputational
advantage are in the Asia/Pacific region. Washington DC, New York, and London also show
a strong reputational advantage. This may be due to strong marketing or general
awareness.
Table 13 | GFCI 24 Top 15 Centres Assessments And Ratings — Reputational Advantage
Weighted Average GFCI 24 GFCI 24 Reputational
Centre - Top 15
Assessment Rating Advantage
Qingdao 816 679 137
Washington DC 775 655 120
Hangzhou 635 516 119
Wellington 731 630 101
Singapore 865 769 96
New York 862 788 74
Sydney 806 734 72
Tokyo 817 746 71
Shanghai 835 766 69
Hong Kong 848 783 65
London 848 786 62
San Francisco 776 724 52
Melbourne 745 699 46
Shenzhen 770 726 44
Zurich 773 732 4138 | The Global Financial Centres Index 24
Table 14 shows the 15 centres with the greatest reputational disadvantage. This
indicates that respondents’ perceptions of a centre are less favourable than the
quantitative measures alone would suggest.
Five centres in Western Europe, and four each in Asia/Pacific and Eastern Europe and
Central Asia appear in this list.
Table 14 | GFCI 24 Bottom 15 Centres Assessments And Ratings — Reputational Disadvantage
Weighted Average GFCI 24 GFCI 24 Reputational
Centre - Bottom 15
Assessment Rating Advantage
Baku 510 555 -45
Athens 473 518 -45
Reykjavik 524 570 -46
Tallinn 571 620 -49
Guernsey 553 603 -50
Guangzhou 655 708 -53
Jersey 574 628 -54
Riyadh 529 588 -59
Trinidad and Tobago 446 510 -64
Riga 497 565 -68
Glasgow 550 622 -72
Sofia 469 544 -75
Chengdu 464 561 -97
Busan 478 631 -153
Dalian 339 499 -160
“Is seems strange to me that Jersey and Guernsey
are not higher in your index. They have been
marketing strongly in the last year.”
ASSET MANAGER BASED IN LONDONThe Global Financial Centres Index 24 | 39
Industry Sectors
We investigate the differing assessments provided by respondents working in relevant
industry sectors by building the index separately using the responses provided only
from those industries. This creates separate sub-indices for Banking, Investment
Management, Insurance, Professional Services and Government & Regulatory Sectors.
Table 15 shows the top 15 financial centres in these five industry sectors.
Table 15 | GFCI 24 Industry Sector Sub-Indices — Top Fifteen
Investment Professional Government &
Rank Banking Insurance
Management Services Regulatory
1 London Hong Kong London New York London
2 Hong Kong New York New York London Hong Kong
3 New York London Singapore Hong Kong New York
4 Shanghai Shanghai Hong Kong Singapore Singapore
5 Singapore Singapore Shanghai Shanghai Zurich
5 Tokyo Tokyo Tokyo Tokyo Tokyo
7 Beijing Toronto Zurich Sydney Shanghai
8 Dubai Sydney Shenzhen Zurich San Francisco
9 Frankfurt Beijing San Francisco Dubai Frankfurt
10 Chicago Zurich Sydney Boston Boston
11 Sydney Boston Frankfurt San Francisco Toronto
12 Boston Shenzhen Paris Los Angeles Vancouver
13 Zurich San Francisco Boston Toronto Luxembourg
14 Shenzhen Melbourne Beijing Frankfurt Seoul
15 Toronto Dubai Dubai Shenzhen Sydney40 | The Global Financial Centres Index 24 Size of Organisation We have analysed how the leading centres in the index are viewed by respondents working for organisations of difference sizes. New York is favoured over London in four of the size categories that we use. London has a strong lead in mid-sized organisations (500 to 1,000 employees) but remains significantly behind New York in terms of the largest organisations. Singapore scores consistently high across all categories. Chart 47 | Average Assessments By Respondents’ Organisation Size (Number Of Employees)
The Global Financial Centres Index 24 | 41

Appendix 1: Assessment Details
Table 16 | GFCI 24 Details Of Assessments By Centre
                                                                               GFCI GFCI ----- Assessmemts -----
                                                              Centre            24    24
                                                                                           Number Average St. Dev
                                                                               Rank Rating
                                                      Vienna                    51   621    226     589    234
                                                      Tallinn                   52   620     90     567    260
                                                      Madrid                    53   619    287     627    186
                                                      Brussels                  54   617    407     608    205
                                                      Sao Paulo                 55   616    117     629    187
                                                      Milan                     56   613    266     634    182
                                                      Johannesburg              57   612    145     594    206
                                                      Stockholm                 58   611    197     586    234
                                                      Bahrain                   59   607    145     590    202
                                                      Guernsey                  60   603    223     556    217
                                                      Astana                    61   599    264     581    270
                                                      Mexico City               62   598    122     575    199
                                                      British Virgin Islands    63   597    180     604    233
                                                      Oslo                      64   596    153     567    216
                                                      Rio de Janeiro            65   594     81     590    208
                                                      Warsaw                    66   592    193     582    236
                                                      Bahamas                   67   591    135     577    216
                                                      Istanbul                  68   590    187     561    219
                                                      Riyadh                    69   588    120     525    239
                                                      Lisbon                    70   585    209     567    230
                                                      Budapest                  71   584    121     558    202
                                                      Rome                      72   583    239     563    209
                                                      Liechtenstein             73   582    171     557    238
                                                      Prague                    74   581    160     566    203
                                                      Gibraltar                 75   580    176     532    248
                                                      Jakarta                   76   579    136     572    206
                                                      GIFT City-Gujarat         77   578    143     513    271
                                                      Tianjin                   78   577    185     610    203
                                                      Chengdu                   79   576    753     474    210
                                                      St Petersburg             80   575    172     553    232
                                                      Copenhagen                81   573    241     556    202
                                                      New Delhi                 82   572    201     539    192
                                                      Moscow                    83   571    382     553    219
                                                      Reykjavik                 84   570    116     523    229
                                                      Isle of Man               85   568    187     538    226
                                                      Manila                    86   566    183     556    185
                                                      Riga                      87   565     87     503    238
                                                      Malta                     88   564    201     542    222
                                                      Hangzhou                  89   563    235     640    175
                                                      Panama                    90   562    127     560    247
                                                      Cyprus                    91   560    152     511    219
                                                      Mumbai                    92   558    222     533    189
                                                      Buenos Aires              93   557     69     516    234
                                                      Helsinki                  94   556    146     541    202
                                                      Baku                      95   555    138     500    212
                                                      Almaty                    96   550    143     528    227
                                                      Sofia                     97   544     79     466    236
                                                      Athens                    98   518    125     458    234
                                                      Trinidad and Tobago       99   510     43     456    263
                                                      Dalian                   100   499    915     348    165
42 | The Global Financial Centres Index 24
Appendix 2: Respondents’ Details
Table 17 | GFCI 24 Respondents By Industry Sector
Number of
Industry Sector
Respondents
Banking 694
Finance 129
Government & Regulatory 131
Insurance 189
Investment Management 326
Professional Services 382
Trade Association 97
Trading 159
Other 346
Total 2453
Table 18 | GFCI 24 Respondents By Region
Number of
Region
Respondents
Western Europe 653
Asia/Pacific 1099
North America 168
Middle East & Africa 159
Eastern Europe & Central Asia 125
Latin America & the Caribbean 54
Multi-Regional 195
Total 2453
Table 19 | GFCI 24 Respondents By Size Of Organisation
Number of
Size of Organisation
Respondents
Fewer than 100 601
100 to 500 433
500 to 1,000 399
1,000 to 2,000 281
2,000 to 5,000 188
More than 5,000 487
Not Specified 64
Total 2453The Global Financial Centres Index 24 | 43
Appendix 3: Methodology
The GFCI provides ratings for financial centres calculated by a ‘factor assessment
model’ that uses two distinct sets of input:
Instrumental factors: objective evidence of competitiveness was sought from a wide
variety of comparable sources. For example, evidence about the telecommunications
infrastructure competitiveness of a financial centre is drawn from the ICT Development
Index (supplied by the United Nations), the Networked Readiness Index (supplied by the
World Economic Forum), the Telecommunication Infrastructure Index (by the United
Nations) and the Web Index (supplied by the World Wide Web Foundation). Evidence
about a business-friendly regulatory environment is drawn from the Ease of Doing
Business Index (supplied by the World Bank), the Government Effectiveness rating
(supplied by the World Bank) and the Corruption Perceptions Index (supplied by
Transparency International) amongst others.
A total of 137 instrumental factors are used in GFCI 24 of which 51 were updated since
GFCI 23 and 35 are new to the GFCI). Not all financial centres are represented in all the
external sources, and the statistical model takes account of these gaps.
Financial centre assessments: by means of an online questionnaire, running
continuously since 2007, We received 3,301 responses to the questionnaire in the 24
months to June 2018. Of these, 2,453 respondents provided 31,326 valid assessments
of financial centres. Financial centres are added to the GFCI questionnaire when they
receive five or more mentions in the online questionnaire in response to the question:
“Are there any financial centres that might become significantly more important over
the next two to three years?”
A centre is only given a GFCI rating and ranking if it receives more than 150 assessments
from other centres within the previous 24 months in the online survey. Centres in the
GFCI that do not receive 50 assessments in a 24 month period are removed and added
to the Associate list until the number of assessments increases.
At the beginning of our work on the GFCI, a number of guidelines were set out.
Additional Instrumental Factors are added to the GFCI model when relevant and
meaningful ones are discovered:
• indices should come from a reputable body and be derived by a sound
methodology;
• indices should be readily available (ideally in the public domain) and be regularly
updated;
• updates to the indices are collected and collated every six months;
• no weightings are applied to indices;
• Indices are entered into the GFCI model as directly as possible, whether this is a
rank, a derived score , a value, a distribution around a mean or a distributionYou can also read