Rapid in situ quantification of the strobilurin resistance mutation G143A in the wheat pathogen Blumeria graminis f. sp. tritici
←
→
Page content transcription
If your browser does not render page correctly, please read the page content below
www.nature.com/scientificreports
OPEN Rapid in situ quantification
of the strobilurin resistance
mutation G143A in the wheat
pathogen Blumeria graminis f. sp.
tritici
Kejal N. Dodhia1, Belinda A. Cox2, Richard P. Oliver3 & Francisco J. Lopez‑Ruiz1*
As the incidence of fungicide resistance in plant pathogens continues to increase, control of
diseases and the management of resistance would be greatly aided by rapid diagnostic methods.
Quantitative allele-specific PCR (ASqPCR) is an ideal technique for the in-field analysis of fungicide
resistance as it can quantify the frequency of mutations in fungicide targets. We have applied this
technique to the fungal pathogen Blumeria graminis f. sp. tritici (Bgt), the causal agent of wheat
powdery mildew. In Australia, strobilurin-resistant Bgt was first discovered in 2016. Molecular
analysis revealed a nucleotide transversion in the cytochrome b (cytb) gene in the cytochrome bc1
enzyme complex, resulting in a substitution of alanine for glycine at position 143 (G143A). We have
developed an in-field ASqPCR assay that can quantify both the resistant (A143) and sensitive (G143)
cytb alleles down to 1.67% in host and Bgt DNA mixtures, within 90 min of sample collection. The
in situ analysis of samples collected during a survey in Tasmania revealed A143 frequencies ranging
between 9–100%. Validation of the analysis with a newly developed laboratory based digital PCR
assay found no significant differences between the two methods. We have successfully developed
an in-field quantification method, for a strobilurin-resistant allele, by pairing the ASqPCR assay on
a lightweight qPCR instrument with a quick DNA extraction method. The deployment of these type
of methodologies in the field can contribute to the effective in-season management of fungicide
resistance.
One of the major challenges that the agricultural industry faces is the control of fungal crop diseases during the
emergence of fungicide r esistance1–4. The presence of fungicide resistant pathogen populations in a crop, not only
results in lower efficacy of chemical control methods but also, lower yields and quality due to increased disease
pressure5. In addition, unnecessary treatment with inefficacious products would represent an additional cost to
the grower and contribute to adverse environmental effects6. An optimal approach to combat this would be to
determine what chemistries the populations are resistant to and use other, more efficacious chemicals i nstead2.
Many cases of fungicide resistance have been functionally linked to specific genotype changes in target
genes4,7,8. The detection of these genotypic changes is a valuable complement to the phenotypic screening of
suspect pathogen isolates. Phenotypic screening requires the isolation of numerous pure cultures of the pathogen
and testing for quantitative growth and/or germination inhibition. Such assays are very demanding of space,
resources and time, taking many days or weeks. The potential of screening using genotypic methods has been
recognised for more than 25 years9,10. A wide range of techniques have been used but all are limited by the need
to isolate pure strains of the pathogen and to carry out the analyses in a laboratory environment. As such the
minimum time for such an assay is still several days. Therefore, the time-frame within which to spray a fungicide
can be lost by the time the samples are sent for analysis to a laboratory and results received. In addition, all the
assays whether phenotypic or genotypic, which require the establishment of pure strains would induce a bias as
this strain may not be representative of the entire population causing the infection11,12.
1
Centre for Crop and Disease Management, School of Molecular and Life Sciences, Curtin University, Bentley,
Perth, WA 6102, Australia. 2Faculty of Science and Engineering, Curtin University, Perth, WA 6102, Australia. 3Curtin
University, Perth, WA 6102, Australia. *email: fran.lopezruiz@curtin.edu.au
Scientific Reports | (2021) 11:4526 | https://doi.org/10.1038/s41598-021-83981-9 1
Vol.:(0123456789)
www.nature.com/scientificreports/
Other methodologies such as loop-mediated isothermal amplification (LAMP) are rapid and can be used
with infected plant s amples13–15. Based on this, LAMP has been used for the successful in-field and laboratory
detection of different organisms including chemical resistance in fungi and weeds16–21. However, the results from
this test are not quantitative and prone to false positives22,23.
An ideal solution is an assay which can be performed rapidly, in situ, to quantify the population of fungal
pathogens, that are resistant to a given fungicide, with high confidence results. This would prevent the spraying of
a fungicide to which a fungus is resistant, as that would both fail to control the disease and increase the selection
of fungicide resistant p opulations24. A rapid assay diagnosing the disease, its quantity and fungicide sensitivity
status would allow farmers to select the optimum fungicide regime for on-going protection of the crop.
Allele-specific polymerase chain reaction (ASPCR)25 is a specific and sensitive assay that was developed for
detecting point mutations using PCR followed by gel electrophoresis. This method has been adapted for use with
both intercalating dyes and probe-based assays to quantify fungi with genetic changes correlated with fungicide
resistance26–28. If combined with crude DNA extraction and a ‘fast’ and robust polymerase that can tolerate field
conditions, this assay could be conducted in the field with minimal laboratory equipment.
Blumeria graminis [DC.] E.O. Speer f. sp. tritici Em. Marchal (synonym Erysiphe graminis DC) (Bgt) is an
obligate biotrophic pathogen of wheat (Triticum aestivum L.) causing wheat powdery mildew (WPM)29. Bgt can
be controlled with strobilurins [quinone outside inhibitors (QoI)], which target the cytochrome bc1 enzyme (cytb)
complex, in regions where resistance is not present or at low levels30,31. The selection of genotypes resistant to
this group of chemicals is facilitated by the combination of Bgt’s large population size and its intensive control
using fungicides. Strobilurin-resistant genotypes of Bgt were first discovered in 1998 in Germany, just 2 years
after their introduction for the control of various crop diseases, and have since been reported in wheat growing
regions around the world30,32,33. Globally, strobilurins make up 20–25% of fungicide sales of which azoxystrobin
represents a third and is the world’s largest selling fungicide34. The development of resistance to strobilurins not
only threatens effective crop protection, but also reduces the number of mode of actions (MOAs), available to
growers, contributing to the increase of fungicide resistance risk on those s ystems5.
Sequencing of the cytb gene from Bgt showed that a single nucleotide polymorphism (SNP) of a guanidine
to cytosine at position 428 (g428c), was the only difference between the sensitive and resistant isolates30. This
mutation results in the amino acid change of glycine to alanine at position 143 (G143A) in the Cytb protein,
(homologous to the archetypal G143A mutation in the Cytb of Zymoseptoria tritici)30,35. However, due to cytb
being a multi-copy mitochondrial gene, it can exhibit heteroplasmy whereby within any given fungal cell, the
SNP maybe present only in a few copies within a mitochondrion and/or a few of these organelles36. Any fungal
cultures with 100% abundance of the cytb G143 or A143 allele are referred to as homoplasmic c ultures26.
In Australia, over 10 Mha are sown with wheat annually, thus providing a large breeding ground for this
pathogen37. However, due to the range of climatic zones within the Australian wheat belt, mildew infections are
most common in areas with medium to high rainfall, as cool humid conditions are required for optimal disease
development. In the regions of Australia where WPM is prevalent, it can cause up to 25% yield losses due to a
reduction of photosynthetic leaf area and nutrients available to the c rop38. The analysis of the cost of WPM to
the Australian wheat industry, for production in the 1990s and 2000s, shows that in the absence of control losses
of up to AU$18 million/year can be e xpected38. However, due to control measures these losses are currently at
AU$3 million/year38. Of the AU$15 million in mitigated losses, use of chemical control attributes to one-third
(AU$5 million) of the reduction in potential losses due to m ildew38. The first report of strobilurin resistance in
Australian Bgt, attributed to field failure observations, was from the states of Victoria and Tasmania in 2 01639.
Here we report the development of a quantitative allele-specific PCR (ASqPCR), performed on a portable
thermal cycler, which can be powered by a battery, coupled with a simple 2-step DNA extraction protocol. The
method successfully generated accurate genotype frequencies of the Bgt Cytb G143A fungicide resistance muta-
tion, on-site, within 90 min of sample collection. To our knowledge, this is the first in situ ‘closed tube’ allele
quantification in a plant pathogen.
Results
Identification of the G143A mutation in the CytB protein. A 465 bp PCR amplicon of the cytb gene
was amplified from one barley powdery mildew and 10 WPM samples, and sequenced as described in the “Mate-
rials and methods” (Tables 1 and 2). The alignment of these sequences together with QoI-sensitive and resistant
Bgt cytb reference sequences, revealed the presence of the mutation g428c (Cytb amino acid substitution G143A)
only in the samples which had been collected from paddocks where the use of QoI fungicides had failed to con-
trol the disease i.e. two samples each from Tasmania and Victoria (Fig. 1). No mutations in the cytb gene were
found in any of the remaining samples, which agreed with the successful control of WPM with QoI-containing
fungicides in the paddocks where these samples had been collected. The analysis of the chromatograms also
shows that for the Victorian samples Geelong 1 and 2 there was only a peak for a C base at the mutation site,
whereas for the Tasmanian samples Launceston 1 and 2, there was an additional smaller peak for a G base. All
samples analysed from Western Australia and South Australia were wild-type.
dPCR and ASqPCR successfully quantify Bgt cytb g428c.
The dPCR analysis successfully quantified the A143 allele in total DNA from field samples collected in 2016
corroborating the results from the sequencing of the cytb gene (Tables 1 and 3; Fig. 1). To evaluate the accu-
racy and sensitivity of the assay, genomic DNA from infected leaves with Bgt from Goomalling (100% G143;
QoI sensitive) and Geelong 1 (100% A143; QoI resistant), were mixed in known allelic ratios and subjected to
dPCR analysis. Scatter plot representation of the results showed well-defined, discrete groups of either wild type
(G143) or mutant (A143) allele only, both alleles and neither allele present (Fig. 2a). The analysis of the dilution
series indicated a high correlation between percentage of A143 allele detected and known G143/A143 allele
Scientific Reports | (2021) 11:4526 | https://doi.org/10.1038/s41598-021-83981-9 2
Vol:.(1234567890)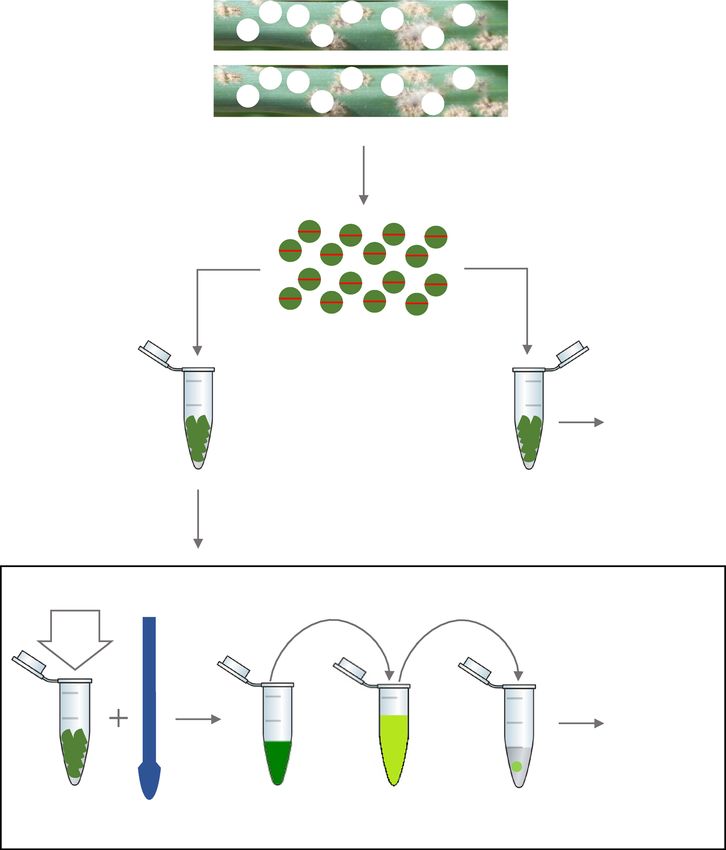
www.nature.com/scientificreports/
Year Town/region, statea No of samples Cultivarb A143 frequency (%)c
Arthur River, WA 1 – 0
Geraldton, WA 1 Wyalkatchem 0
Goomalling, WA 1 Zen 0
Moora, WA 1 Corrack 0
2016
Neuton, SA 2 – 0
Launceston, TAS 1 Golden Promised 0
Launceston, TAS 2 Mackellar, Forrest 92.66, 93.05
Geelong, VIC 2 Gazelle 99.96, 99.73
Table Cape site 1, TAS 6 – 50.51 ± 22.30
Table Cape site 2, TAS 6 – 44.14 ± 30.17
2018
Conara site 1, TAS 5 Manning 98.05 ± 2.29
Conara site 2, TAS 5 Trojan 93.39 ± 6.78
Chief 0
Chief 0
Trojan 0
Sceptre 1.94
Chief 2.34
– 3.02
2019 Northern Yorke Peninsula, SA 12
– 6.67
Chief 7.22
Sceptre 27.79
Sceptre 33.50
Chief 34.01
Chief 53.72
Table 1. Sample details and cytb A143 allele frequency of Blumeria graminis f. sp. tritici from infected wheat
collected in this study. a WA Western Australia, SA South Australia, TAS Tasmania, VIC Victoria. bUnknown
cultivars are denoted as –. cAll values as per dPCR analysis except the 2019 samples which are from ASqPCR.
For 2018 samples, the values represent averages (± s.d.) per site. dBarley sample.
Anneal temperature
Primer namea Sequence (5′–3′) Product size (bp) (°C) Purpose Source
CTGCATTCCTGG
BgCytB_G143A_F
GTTATGTATTGC
TGGTATAGCGCT 86 See below dPCR/qPCR primers This study
BgCytB_G143A_R CATTAGGTTAGT
GA
FAM-CGGTTG
BgCytB_G143A_dP1 CAGCCCAGT
G-NFQ - 58 dPCR probes This study
VIC-ACGGTTGCA
BgCytB_G143A_dP2
CCCCAGTG-NFQ
FAM-CGGTTGCA
BgCytB_G143A_mP1
GCCCAGTG-BHQ1
- 67 qPCR probes This study
HEX-ACGGTTGCA
BgCytB_G143A_mP2
CCCCAGTG-BHQ1
GCGGGATGTTAA
WM-Cb-f
TAACGGATGAT
465 55 Sequencing primers Bäumler et al. (2003)
GGAGCCATAGGT
WM-Cb-R
AATCTATCG
Table 2. PCR, Digital PCR and qPCR primers and probes used in this study. a The probes dP1 and mP1 target
the cytb A143 allele whereas probes dP2 and mP2 target the G143 wild-type allele. Italics—fluorophore/
quencher; bold—single nucleotide polymorphism; underlined—locked nucleic acid.
ratios (R2 = 0.999), with the lower level of quantification of the mutant allele determined to be 0.33%, and the
allele detectable at 0.07% (Table 4; Supplementary Fig. S1). No cross-reaction was found when genomic DNA
from other common wheat pathogens was tested, however, the closely related barley powdery mildew pathogen
Blumeria graminis f. sp. hordei was positive for the G143 allele (Table 3).
Scientific Reports | (2021) 11:4526 | https://doi.org/10.1038/s41598-021-83981-9 3
Vol.:(0123456789)www.nature.com/scientificreports/
Figure 1. Multiple sequence alignment of the cytb gene sequence and its translation (yeast mitochondrial
translation table_3) flanking the g428c mutation for samples collected in 2016 (Table 1). AF343441.1 and
AF343442.1 correspond to strobilurin sensitive and resistant Bgt cytb reference sequences, respectively. The
samples Launceston 1 and 2, and Geelong 1 and 2 contain the substitution G143A. Codon 143 is boxed; *
denotes a mix of the G and C base; # shows C base only. Arthur River, Geraldton, Goomalling and Moora—
Western Australia; Neuton—South Australia; Launceston—Tasmania; Geelong—Victoria.
CI copies µL−1 CI copies µL−1
DNA samplea % A143 CI % A
143b Copies µL−1 G143 G143 Copies µL−1 A143 A143
Arthur river, WA 0 – 3231 3165.80–3297.60 0 –
Moora, WA 0.04 1.59E-2–7.75E-2 1275.50 1250.70–1300.80 0.45 0.20–1.01
Geraldton, WA 0.02 5.17E-3–7.08E-2 826.48 807.76–845.63 0.16 4.01E-2–0.64
Goomalling, WA 0 – 1524.60 1495.90–1553.70 0 –
Neuton 1, SA 0 – 401.88 389.95–414.18 0 –
Neuton 2, SA 0.01 2.50E-3–8.30E-2 530.47 516.65–544.67 7.77E−02 1.09E-2–0.55
Launceston 1, Tas 92.66 88.80–96.56 94.07 88.90–99.54 1187.30 1163.80–1211.40
Launceston 2, Tas 93.05 89.06–97.12 50.08 46.32–54.15 670.21 654.18–686.64
Geelong 1, Vic 99.96 95.74–104.24 0.42 0.17–1.00 1170.10 1145.60–1195.20
Geelong 2, Vic 99.73 94.51–105.16 0.80 0.43–1.49 300.65 290.60–311.05
Blumeria graminis f.
0 – 7547.60 7214.10–7896.60 0 –
sp. hordei
Parastagonospora
6.64 1.12–39.51 1.36 0.80–2.29 9.68E–02 1.36E-2–0.69
nodorumc
c
Wheat leaf rust 23.02 10.77–48.40 2.14 1.47–3.13 0.64 0.32–1.27
Wheat leaf (unin-
74.29 18.75–299.31 0.09 1.24E-2–0.62 0.26 8.51E-2–0.82
fected) c
Waterc 50 6.53–381.59 7.37E−02 1.04E-2–0.52 7.37E−02 1.04E-2–0.52
Table 3. Specificity of detection of the G143A dPCR assay on total DNA from Blumeria graminis f. sp. tritici
infected wheat leaf field samples and controls. a WA Western Australia, SA South Australia, Tas Tasmania, Vic
Victoria. bCI—95% confidence interval. cTotal copies µL−1 (copies µL−1 G143 + Copies µL−1 A143) must be over
200 for a valid result.
Scientific Reports | (2021) 11:4526 | https://doi.org/10.1038/s41598-021-83981-9 4
Vol:.(1234567890)www.nature.com/scientificreports/
Figure 2. Sensitivity and specificity of the dPCR and ASqPCR assays targeting the cytb G143A. (a) Scatter
plots for Blumeria graminis f. sp tritici (Bgt) G143A dPCR assay using known ratios of genomic DNA for the
strobilurin resistant Bgt sample Geelong 1 (A143 allele) and sensitive Bgt sample Goomalling (G143 allele).
Scatter plots were prepared with Quantstudio 3D AnalysisSuite. Wells with the A143 allele are represented by
blue signals (FAM), G143 alleles are represented by red signals (VIC), detection of both alleles are represented
by green signals, wells without any alleles (passive reference) are represented by yellow signals (ROX) and
outliers represented by grey signals. (i) 100% Goomalling gDNA (G143 allele only); A143 frequency = 0.04%.
(ii) 0.33% Geelong1 gDNA; A143 frequency = 0.23%. (iii) 3.39% Geelong 1 gDNA; A143 frequency = 3.10%. (iv)
6.90% Geelong 1 gDNA; A143 frequency = 7.87%. (b) Correlation of threshold cycle in ASqPCR and amount of
DNA of either G143 ( R2 = 0.9998) or A143 ( R2 = 0.9999) alleles, respectively.
The assay identified very high frequencies of the A143 allele in locations where QoI control failure had previ-
ously been reported (Tables 1 and 3). Where QoIs controlled the disease satisfactorily, the frequency of the A143
allele remained below the assay detection level. The double peaks observed in the sequencing chromatograms
of samples Launceston 1 and 2 were in agreement with the A143 allele frequencies determined by the dPCR
assay (92.66 and 93.05%, respectively). In a similar manner, samples Geelong 1 and 2 showed A143 frequencies
of virtually 100%, which correlated with the single peaks observed in the chromatograms of these two samples
(Fig. 1; Table 3).
The SensiFast Probe No-Rox master mix was considered the most suitable for ASqPCR with crude DNA
samples on a magnetic induction cycler (MIC) qPCR instrument (Bio Molecular Systems, Australia) under field
conditions. In the reactions where the iQ multiplex Supermix was used, the G143 allele was detected in both the
HEX and FAM channels. In the case of the samples analysed using the Immomix, no amplification was observed
from any of the crude DNA extracts (Table 5).
The test for the interassay repeatability showed that the frequency of the A143 allele, for the 51% A143 sample,
when calculated from the standard curves for both tests had a mean of 52.9% (n = 16; CV = 1.2%; variation from
theoretical value = 3.7%). Subsequent analysis of the dilution series, with ASqPCR showed that the lower level of
quantification of the mutant allele in mixture with the wild type was in this case 1.67% (Table 4; Supplementary
Fig. S1). In addition, in homoplasmic reactions, the assay quantified down to seven copies per reaction for both
G143 and the A143 alleles (Fig. 2b). As with the dPCR assay, wheat pathogens Parastagonospora nodorum and
Pyrenophora tritici-repentis were not detected. The assay however detected the closely related barley mildew B.
graminis f. sp. hordei, but not the grape mildew Erysiphe necator (data not shown).
Scientific Reports | (2021) 11:4526 | https://doi.org/10.1038/s41598-021-83981-9 5
Vol.:(0123456789)www.nature.com/scientificreports/
dPCR ASqPCR
DNA samplea % A143 CI % A143b % A143 CI % A143
100% Goo 0.04 1.19E-2–0.16 0 –
0.07% Gee 1 0.30 0.18–0.51 0 –
0.17% Gee 1 0.10 4.41E-2–0.25 0 –
0.33% Gee 1 0.23 0.13–0.42 0 –
0.67% Gee 1 0.57 0.37–0.88 0 –
1.68% Gee 1 2.01 1.63–2.48 1.48 1.32–1.64
3.39% Gee 1 3.10 2.61–3.68 4.06 3.82–4.30
6.90% Gee 1 7.87 6.98–8.87 8.00 7.22–8.77
18.18% Gee 1 21.72 19.98–23.59 20.24 19.96–20.51
40% Gee 1 38.45 36.00–41.04 NAc –
66.67% Gee 1 65.15 61.41–69.05 68.40 67.90–68.89
100% Gee 1 99.67 94.43–105.11 100 –
Table 4. Sensitivity of the G143A dPCR and ASqPCR assays on a mixture of total DNA of leaves infected with
mutant (A143) and wild type (G143) Blumeria graminis f. sp. tritici. a Goo Goomalling (G143), Gee1 Geelong 1
(A143). bCI 95% confidence interval. cThis concentration was not tested with ASqPCR.
G143 target (HEX channel) A143 target (FAM channel)
Mix 1 Mix 2 Mix 3 Mix 1 Mix 2 Mix 3
100% G143 (L)a 19.02 ± 0.50d 19.22 ± 0.50 34.25 ± 1.21 25.65 ± 0.34 – –
100% G143 (Q)b 23.79 ± 0.56 24.49 ± 0.44 – – – –
100% A143 (L) – – – 18.39 ± 0.40 18.64 ± 0.35 32.52 ± 0.22
100% A143 (Q) – – – 23.43 ± 0.25 23.89 ± 0.22 –
51% A143 (L)c 23.53 ± 0.63 23.78 ± 0.65 38.24 ± 0.09 21.60 ± 0.09 21.99 ± 0.15 36.73 ± 0.27
NTC – – – – – –
Table 5. Cq values obtained from the assessment of three qPCR mastermixes. Mix 1 (iQ Multiplex Supermix),
Mix 2 (Sensifast Probe No-Rox mix) and Mix 3 (Immomix), with total DNA of leaves infected with wild
type (G143) and mutant (A143) wheat powdery mildew. Non-target amplification is indicated in bold. aDNA
extracted using a standard laboratory method. bDNA extracted using the quick field extraction method. c49%
G143. ds.d. (5 replicates).
Optimisation of the in‑field allele frequency quantification pipeline. The suitability of the in-
field Bgt cytb A143 allele quantification method was assessed as part of a two-day field trip across the Northern
wheat-growing region of Tasmania (Fig. 3). The ASqPCR assay conducted on the MIC qPCR instrument (Bio
Molecular Systems), with crude DNA extracted in the field as described in the “Materials and methods”, suc-
cessfully distinguished between G143 and A143 alleles under field conditions. The resistant genotype could be
detected in all of the 22 samples tested across the four collection sites, albeit at varying levels (Fig. 4a).
The largest variation in the frequency of the cytb mutant allele was observed in the samples collected on day
1. Frequencies of the A143 allele in the Table Cape region ranged from 27.3–86.0% (average = 52.3% ± 19.7) in
the first site (Fig. 4a, 1A–1F) and from 9.0–94.0% (average = 40.6 ± 30.7) in the second site (Fig. 4a, 2A–2F).
The analysis of the samples collected at the two sites in the Midlands region revealed a higher frequency of the
A143 allele, with the majority of the samples showing values above 99% (average = 98.7 ± 3.6) (Fig. 4a, 3A–3E
and 4A–4E).
In‑lab analysis of samples. The second set of powdery mildew infected wheat disc halves was sent by
overnight courier and analysed in our laboratory as described earlier. The frequency of the A143 allele in both
the dPCR and ASqPCR analyses was comparable to the results from the field analysis (Fig. 4a). Samples collected
on day 1 had, in general, lower and more variable A143 allele frequencies than those from day 2. The frequency
of the mutant allele in the samples collected from site one was 36.8% to 85.9% and 21.8% to 78.0% for the dPCR
and ASqPCR assays, respectively (Fig. 4a, 1A–1F). For these analyses as well, the largest variation in the A143
frequency was found in the samples from the second site, which had frequencies ranging from 16.9 to 98.6% for
dPCR and 18.9 to 96.8% for ASqPCR (Fig. 4a, 2A–2F).
As with the in-field analysis, the mutant allele was found at frequencies close to 100% in the majority of sam-
ples collected on day 2. In this case, the frequency of the A143 allele observed ranged from 82.0 to 99.9% and 84.1
to 100% for dPCR and ASqPCR, respectively (Fig. 4a, 3A–4E). No results were obtained when the crude extract,
which had been shipped with the set 2 of infected material, was analysed using the dPCR assay (data not shown).
Scientific Reports | (2021) 11:4526 | https://doi.org/10.1038/s41598-021-83981-9 6
Vol:.(1234567890)www.nature.com/scientificreports/
Figure 3. Map showing sampling locations in Tasmania (Australia).
Comparison of test methods. To determine the accuracy of the in-field ASqPCR method, A143 allele
frequency data was compared to that from ASqPCR and dPCR experiments performed in our laboratory. Paired
sample t test analysis showed that the frequency results obtained in the field were not significantly different from
those of the same experiment performed in the laboratory using a standard method to extract DNA from the
original samples (p value = 0.190). The same was observed when the A143 allele frequencies from the field analy-
sis were compared to the results obtained with dPCR using DNA extracted in the laboratory (p value = 0.677).
The box plots (Fig. 4b) also showed that the mean and median values of the results for each method were within
the interquartile range (IQR) of the other methods, which reinforces the observation that the results are not
dissimilar.
The Bland–Altmann analysis also showed a good correlation between the field ASqPCR and the laboratory
dPCR methods, with data points distributed about the line of bias (Fig. 5). On average, the A143 allele frequen-
cies calculated using the field ASqPCR were overestimated by 0.86% (bias), compared to the dPCR results.
Twenty out of 22 samples (90.91%) were within the upper and lower limits of agreement of 19.21 and -17.48,
respectively (Fig. 5).
Deployment of the field Bgt cytb G143A ASqPCR. Towards the end of the 2019 growing season,
South Australian agronomists were reporting poor control of wheat powdery mildew after treatment with QoI
fungicides. The A143 ASqPCR method was showcased as part of an extension activity organised within an
industry field day in Bute, Yorke Peninsula (South Australia). A total of 12 symptomatic samples were brought
by participants from surrounding wheat fields and analysed on the spot. The frequency of the cytb A143 allele
ranged from 1.9 to 53.7% (average = 14.2 ± 17.4; n = 9 samples which showed the presence of the cytb A143 allele)
Scientific Reports | (2021) 11:4526 | https://doi.org/10.1038/s41598-021-83981-9 7
Vol.:(0123456789)www.nature.com/scientificreports/
100.0
a
90.0
80.0
Frequency of A143 allele (%)
70.0
60.0
50.0
40.0
30.0
20.0
10.0
0.0
1A 1B 1C 1D 1E 1F 2A 2B 2C 2D 2E 2F 3A 3B 3C 3D 3E 4A 4B 4C 4D 4E
Sample name
L + ASqPCR Q + ASqPCR L + dPCR
p=0.190 p=0.677 b
Figure 4. Comparison of cytb A143 frequency results of samples from Tasmania. Q + ASqPCR—crude
DNA + ASqPCR, L + ASqPCR—Lab DNA + ASqPCR, L + dPCR—Lab DNA + dPCR. (a) Individual sample
results 1A-1F and 2A-2F—samples collected from sites 1 and 2 in the Table Cape region; 3A-3E and 4A-4E—
samples collected from sites 1 and 2 in the Midlands region. Error bars show standard error of mean of
triplicates. (b) Box plots of average results for each analysis type and paired t test. Boxed area represents the
inter-quartile range, horizontal line within box represents the median, x represents the mean.
suggesting a relatively high spread of the mutation in the area (Table 1). Three samples had no detectable levels
of the A143 allele.
Discussion and conclusion
Failure of QoI fungicides to control Bgt in wheat paddocks in the Australian states of Tasmania and Victoria was
first reported in 201639. Sequencing analysis of the cytb gene revealed that the well characterised mutation G143A
was present in all samples collected from wheat fields in these two Australian states where adequate control of
the disease could not be achieved with the use of QoI fungicides (Fig. 1)30. As the G143A genotype continues
to spread, and possibly emerge, across other wheat growing regions in the world, due to the overexposure to
this group of fungicides, the availability of a rapid and robust field-based allele-specific detection method could
provide a key advantage for the in-season management of QoI resistance.
Scientific Reports | (2021) 11:4526 | https://doi.org/10.1038/s41598-021-83981-9 8
Vol:.(1234567890)www.nature.com/scientificreports/
30.000
20.000 19.21
Differences (field ASqPCR vs dPCR)
10.000
0.000 0.86
-10.000
-17.48
-20.000
-30.000
-40.000
0.000 25.000 50.000 75.000 100.000
Averages (field ASqPCR vs dPCR)
Figure 5. Bland–Altman analysis to check agreement between the results from the field qPCR and lab dPCR
(n = 22). The bias of 0.86 represented the average difference between the results from the methods and shows
that the results from the ASqPCR are overestimated by 0.86 compared to the latter. The upper and lower limits
of agreements at 19.21 and -17.48 respectively represent the “bias ± 1.96 s.d.” (s.d. of differences is 9.36) 90.1% of
samples are within the limits of agreement.
The detection of fungicide resistance in crop pathogens, previously mostly conducted using bioassays, now
largely relies on the use of molecular methods when the genetic mechanism associated with the resistance is
known7. For novel field failures, where the target gene is known, capillary sequencing methods are used to deter-
mine if any known mutations are the c ause3,40. Once a mutation has been confirmed, PCR and LAMP are com-
monly used for its detection, whereas for quantification qPCR and more recently digital PCR are used18,26,41–43.
Except for LAMP, none of the other methods have been used in the field for the detection of fungicide resistance,
therefore currently the quantification of mutations associated with fungicide resistance is exclusively laboratory
based20. We have demonstrated the successful development of a TaqMan probe-based ASqPCR assay, which
allows for both the mutant and wild-type alleles to be detected within the same reaction. This has been coupled
with a quick, field-friendly DNA extraction method and a robust DNA polymerase to enable the in-field quan-
tification of the QoI resistant mutation G143A in Bgt on a portable and fast qPCR instrument.
The quantification of the CytB G143A mutation in Bgt using ASqPCR was first conducted by Fraaije et al.26
using the intercalating dye SYBR 1, with the assay detecting as low as 1 in 10,000 copies of the mutant A143 allele
in a sample extraction that contained a mix of fungal and wheat DNA. A qPCR assay developed for the analysis
of mutation Y136F in the Cyp51 target site of E. necator had a limit of detection and a limit of quantification of
0.85 and 2.85%, respectively44. More recently, Zulak et al.43 developed a chip dPCR assay able to quantify muta-
tions S509T and Y136F in the Cyp51 of B. graminis f. sp. hordei infected samples down to 0.2%. In our study, the
quantification limit of the field-based G143A ASqPCR assay, when using a DNA extract containing a mixture
of both A143 and G143 alleles, and wheat DNA, was 1.67% (Table 4). However, in samples with homogenous
(homoplasmic) genotypes, in a background of wheat DNA, the assay successfully detected seven copies of the
G143 or A143 alleles per reaction (Fig. 2b). The latter could be considered as the equivalent to a single spore
detection, as each spore has multiple mitochondria and each mitochondrion may have multiple copies of the
cytb gene within i t36. A laboratory based G143A chip dPCR assay was also developed for comparative purposes.
The G143A dPCR assay successfully quantified the cytb A143 allele in a background of G143 and wheat DNA
down to a level of 0.33%, whereas its detection limit was estimated at 0.07% (Fig. 2a; Table 4). In general, dPCR
has lower target detection limits and higher reproducibility, than qPCR, the latter due to the use of absolute
quantification rather than relying on standard curves43,45,46. Due to these properties, dPCR could be considered
the gold-standard in molecular detection of fungicide resistant populations.
The assessment of the ASqPCR analysis pipeline under field conditions revealed a marked A143 allele fre-
quency difference between two wheat growing regions of Tasmania (Fig. 4). While the average frequencies of the
A143 allele in samples collected at two sites in the Table Cape region remained between 40–50%, the values found
in the sites sampled in the Midlands region showed levels above 99% in nine out of ten analysed samples. The
accuracy of the in-field G143A ASqPCR method was validated by comparing the A143 allele frequency results
obtained in the field to those from the laboratory using the same method with DNA extracted from the original
samples following standard laboratory procedures. The lack of significant differences between the two datasets
Scientific Reports | (2021) 11:4526 | https://doi.org/10.1038/s41598-021-83981-9 9
Vol.:(0123456789)www.nature.com/scientificreports/
indicated that neither the quick in-field DNA extraction nor the lack of a controlled laboratory environment
had an important effect on the outcome of the in-field analysis (p value = 0.190).
The ideal way to directly compare the results from the ASqPCR with dPCR would have been using the
same crude extract on both methods. However, when the crude extract was tested on dPCR, no results could
be obtained. This could be attributed to the incompatibility of potential inhibitors in the crude extract with
the dPCR reagents or with the degradation of the DNA. Therefore, the results from the DNA extracted in the
laboratory were used for all further comparison of the analysis methods. To assess the level of sensitivity of the
in-field G143A ASqPCR method, we compared the A143 allele frequency results to those obtained from dPCR
using Bland–Altman analysis. When this analysis is applied to two testing methods and the results are identical,
the average of the differences between paired results should be zero47. In this study, the comparison of the two
tests indicated that ASqPCR is, on average, overestimating the mutant allele in a sample by just 0.86 units (line
of bias; Fig. 5). This is quite remarkable considering that the dPCR method used DNA extracted in the labora-
tory as opposed to the crude extractions analysed in the field. In our analysis, the limits of agreement, which
ranged from 19.21 to -17.48 units, represents 95% of the range of the differences between the measurements,
and eight of the 12 differences greater than 5% are due to the field analysis showing higher frequencies than
the dPCR analysis. The biggest differences were observed in the samples from the Table Cape region where the
more moderate A143 levels seemed to display better the overestimating effect (Fig. 4a, 1A–2F). We believe a few
factors to be causing this effect, the most likely to be a consequence of the higher sensitivity of the dPCR assay.
The DNA analysed by the two methods was extracted from different areas of the same leaf disc and when one
allele is very rare, the ratio will have high inherent variability due to stochastic sampling issues. This could also
be reflected in a higher variability in the G143A frequency in WPM pustules from samples collected in paddocks
where strobilurin resistance is emerging.
Over the past 5 years, the Northern region of Tasmania (Midlands region) had on average greater than six
times the area dedicated to growing wheat compared to the North-western region (Table Cape; Cradle Coast)
(Supplementary table S2)48–52. This could suggest that larger pathogen populations and more frequent use of
fungicides from the QoI group could be responsible for the higher A143 allele frequency observed in the Mid-
lands region, as the Bgt population would be saturated with strobilurin-resistant mutants. Recently, the G143A
mutation has been found at high frequencies in the Yorke Peninsula region of South Australia following new
QoI control failure episodes in 2019. The deployment of the in-field G143A ASqPCR method during a field day
allowed to correlate higher frequencies of the A143 allele in fields displaying high disease levels after QoI treat-
ment. The results of the analysis were provided on site and the fact that many participants decided to review
their chemical control strategies highlights the power of this approach not only as an in-season tool for the
management of fungicide resistance, but also as part of more broader extension efforts.
Although there is a lack of specific knowledge about the threshold abundance of the A143 allele which would
translate into QoI control failure for the wheat powdery mildew system, studies of this mutation in other organ-
isms have shown that its frequency would have to exceed 60% before resistance to QoIs becomes apparent53,54.
This can be used as a guide to demark the threshold for control failure of QoIs in Bgt containing the A143 allele.
Future research in this space should assess the level of A143 required for control failure of WPM.
We believe that the ASqPCR conducted in the field is a reliable tool that can be used for rapid and on-site
quantification of Bgt mutants carrying the G143A Cytb mutation, and provide valuable information to chemi-
cally tackle the disease. An additional advantage of this method is that it can be adapted to detect changes in
other genes encoding different fungicide targets. To that effect, a similar assay for the detection of pyrimethanil
resistance in the grape pathogen Botrytis cinerea has already been trialled in the field (Harper et al., unpublished).
The technology we describe here substantially increases the speed with which quantitative pathogen diagno-
sis and fungicide resistance evolution can be measured and delivered to growers. These techniques promise to
markedly increase the flexibility of growers to modify fungicide application timing, dose and product choices
within a few hours of sampling.
The methodology could be enacted using portable instruments housed in the cab of a vehicle. However, we
recognise that the true value of rapid diagnosis will be realised only when it is coupled with reliable advice and
product choices. As such, the technology is perhaps best suited to implementation via testing stations located
within cropping zones where information from the tests can be coupled with local pathology experience and
weather forecasts. This would mean that the treatments used would be tailored to the disease and resistance
problems within the crop, which in turn would eliminate the use of unnecessary treatments and reduce the
selection pressure that occurs when using unsuitable treatments.
Materials and methods
Blumeria graminis f. sp. tritici (Bgt) field sample PCR and cytb sequencing. Ten wheat and one
barley powdery mildew samples were collected from the states of Western Australia, South Australia, Victoria
and Tasmania in 2016 (Table 1). The leaf samples were placed in 15 ml polypropylene tubes filled with 2 ml of
50 mg L−1 benzimidazole water agar55, sealed and placed in polystyrene containers with ice packs for express
shipment to the laboratory for DNA extraction. For each sample, approximately 3 cm length of the infected tis-
sue was cut into small pieces and DNA was extracted using a BioSprint 15 instrument and BioSprint 15 DNA
plant kit (Qiagen, Australia) according to the manufacturer’s protocol. The resulting mix of fungal and wheat
DNA was eluted in 1 × TE buffer pH 8.0 and stored at − 20 °C. The remaining sample was stored at − 20 °C until
further analysis.
The cytb gene from Bgt was amplified and sequenced using primers WM-Cb-f and WM-Cb-R56 (Table 2).
Each 100 µl PCR reaction contained 5 U of MyTaq DNA polymerase (Bioline, Australia), 20 µl 5 × MyTaq reac-
tion buffer, 0.4 µM each primers, 50–100 ng DNA template and water. The thermal-cycling was conducted with
Scientific Reports | (2021) 11:4526 | https://doi.org/10.1038/s41598-021-83981-9 10
Vol:.(1234567890)www.nature.com/scientificreports/
initial denaturation for 5 min at 95 °C, followed by 34 cycles of 30 s at 95 °C, 1 min at 55 °C and 1 min at 72 °C,
followed by final extension for 10 min at 72 °C. The PCR products were sequenced by Macrogen (Seoul, South
Korea) and the results aligned on Geneious (Biomatters Ltd) with existing Bgt cytb gene reference sequences
(GenBank accessions: AF343441.1, AF343442.1) to determine if mutation g428c, responsible for amino acid
substitution G143A, was present.
Design of digital PCR and ASqPCR for the analysis of g428c. The digital PCR (dPCR) primers
and TaqMan probes used to quantify the presence of mutation g428c in this study were designed as per Zulak
et al.43 with some modifications (Table 2). The sequence of cytb flanking 100 bp of the mutation was added to
the Custom TaqMan Assay Design Tool, with the species/scale set at ‘Non-Human: small scale’. Resulting Bgt
cytb wild type (G143 allele; strobilurin-sensitive) and mutant (A143 allele; strobilurin-resistant) primers and
probe combinations were ordered as a single-tube mix containing 36 µM of each primer and 8 µM of each probe
(Thermo Fisher Scientific, Australia). The probe targeting A143 allele was labelled with the fluorophore FAM
on its 5′ end and the probe targeting the G143 allele labelled with VIC. The 3′ ends of both probes were labelled
with a non-fluorescing quencher (NFQ).
Each 17 µl dPCR reaction consisted of 8.5 µl QuantStudio 3D Digital PCR 2 × Master Mix (Applied Biosys-
tems, Australia), 0.3 µl primer probe pre-mix, and 3 µl of 10–20 ng DNA template and made up to 17 µl with
water. Fifteen µl of this reaction was loaded onto a QuantStudio 3D Digital PCR Chip v2 (Applied Biosystems)
and cycled on a Geneamp 9700 flat block thermal cycler (Applied Biosystems) under the following conditions:
10 min at 96 °C, then 40 cycles of 2 min at 58 °C and 30 s at 98 °C, followed by 2 min at 58 °C, and 10 min at
22 °C. Chips were read on a QuantStudio 3D Digital PCR Instrument (Applied Biosystems). The copy ratio of
mutant to wild type allele in each sample was determined using QuantStudio 3D AnalysisSuite software (Applied
Biosystems). The DNA from the sequenced samples was tested along with DNA from uninfected wheat leaf, wheat
leaf infected with Puccinia triticina and pure P. nodorum DNA. In addition, a dilution series of the DNA from
the Goomalling sample (G143 allele, Table 1) and Geelong 1 sample (A143 allele, Table 1) was tested with their
respective target probes to determine the detection limits of the assay (A143 abundance: 100%, 66.67%, 40.50%,
18.18%, 6.90%, 3.39%, 1.68%, 0.67%, 0.33%, 0.17%, 0.07% and 0%; DNA concentration 5000–6000 copies µl−1
template). Each test was conducted in triplicate.
The dPCR primers and modified dPCR probes (Sigma-Aldrich, Australia) were used to detect mutation g428c
on a magnetic induction cycler (MIC) qPCR instrument (Bio Molecular Systems, Australia). In order to increase
probe Tm and specificity, three bases in each probe were modified to Locked Nucleic Acids (LNA) (Table 2). In
addition, the fluorophore on the probe targeting the G143 allele was changed from VIC to HEX.
Three different qPCR mixes were tested using the Goomalling and Geelong 1 DNA and a DNA sample
adjusted to 51% A143 (Table 1). Each 20 µl ASqPCR reaction consisted of 10 µl of 2 × mastermix [iQ Multilplex
Powermix (Bio-Rad, Australia), Sensifast Probe No-Rox mastermix (Bioline) or ImmoMix™ (Bioline)], 0.5 µl
each of 10 µM forward and reverse primers, 0.3 µl each of 5 µM FAM and HEX probes, 5 µl of up to 20 ng DNA
template and 3.4 µl water. The assay was conducted under field conditions using the following parameters:
initial denaturation for 5 min at 95 °C, followed by 40 cycles of 10 s at 95 °C, and 30 s at 67 °C for annealing
and extension. This was tested twice with samples run in triplicate in the first experiment and in duplicate in
the second. The Sensifast Probe No-Rox mastermix (Bioline) was chosen for future testing. The repeatability of
the quantification of the ASqPCR assay, was tested as above with the 51% A143 DNA sample and its frequency
calculated based on standard curves generated using the Goomalling and Geelong 1 DNA. This was tested twice
with samples replicated ten times in the first experiment, and six times in the second.
A dilution series similar to that described for dPCR including single and mixture of known allele proportions
was tested to determine the detection limits of the assay (A143 abundance: 100%, 66.67%, 18.18%, 6.90%, 3.39%,
1.68%, 0.67%, 0.33%, 0.17%, 0.07% and 0%; DNA concentration 5000–6000 copies µl−1 template). A standard
curve was also constructed using a serial dilution of the Goomalling and Geelong 1 DNA to calculate the amount
of fungal DNA in the mixtures. The A143 allele frequency was calculated as percentage value using micPCR
software v2.8.0 (Bio Molecular Systems). The species specificity of the assay was tested using DNA from plant
material infected with closely related pathogens B. graminis f. sp. hordei and E. necator, as well as pure DNA from
pathogens sharing the same host; P. nodorum and P. tritici-repentis.
Development of an in‑field allele frequency quantification pipeline. To enable the testing to be
conducted in a field setting, a quick DNA extraction protocol was developed as a part of this study. Preliminary
testing of this extraction method was conducted using approximately 100 mg of infected plant tissue (Goomaling
and Geelong 1) that had been kept at -20 °C. The material was crushed with a plastic micro pestle in 400 µl of the
lysis buffer (0.5% w/v SDS, 1.5% w/v NaCl) until the plant tissue fragmented and turned the solution green. This
lysate was then diluted 100-fold in 1 × TE buffer pH 8.0 and 5 µl used as DNA template in ASqPCR reactions.
DNA extraction and its thermal cycling was conducted under field conditions on a lightweight qPCR instrument
(Magnetic induction cycler, Bio Molecular Systems) powered using a ITECH200 12 V 200AH lithium ion bat-
tery (iTechWorld, Australia) connected to a 2000 W 12 V pure sine wave inverter (iTechWorld). The cycling run
(56 min) was initiated and analysed using the micPCR software on a laptop connected to the qPCR instrument.
Twenty-two wheat powdery mildew samples were collected in 2018 from four locations in the Northern
region of Tasmania during a two-day collection trip (Fig. 3; Table 1). On day 1, six samples were collected from
each of two fields; each sample, consisting of up to 2 leaf fragments, came from an individual plant chosen
at random within a 200 m2 area in their respective fields. The sampling on day 2 was conducted in the same
manner, however only 5 samples per field were collected. The samples were maintained in polypropylene tubes
Scientific Reports | (2021) 11:4526 | https://doi.org/10.1038/s41598-021-83981-9 11
Vol.:(0123456789)www.nature.com/scientificreports/
Sent to
laboratory
Field ASqPCR
100x diluon
in TE buffer Crude DNA
Lysis
buffer
Cycling
& data
analysis
PCR reagents
primers
probes
Figure 6. Schematic representation of the procedure followed in the field for the extraction of DNA.
containing benzimidazole agar, as previously described, and stored in a polystyrene box with ice bricks to prevent
deterioration prior to processing.
On each day, once sampling was concluded, sixteen 7 mm discs per infected leaf sample were excised using a
WellTech Rapid-Core-7.0 (RapidCore, Australia) disinfected with 70% v/v ethanol between samples. The discs
were halved and separated into two 1.5 ml microfuge tubes to obtain two sets of tubes (1 and 2) with 16 halves
each, per sample. The material in set 1 was used for immediate processing and that of set 2 shipped on ice by
overnight courier to our laboratory in Perth for dPCR analysis (Fig. 6). Samples in set 1 were processed using
the quick DNA extraction method described earlier. The ASqPCR reactions were set-up as described above
and 5 µl of the DNA extract was used directly in the reaction mix. Each sample was tested in triplicate and the
amount of fungal DNA was measured using a standard curve constructed from Goomalling and Geelong 1
DNA of known concentrations amplified alongside the samples. The amount of mutant allele in each sample
was reported as a percent value. Remaining crude DNA was shipped with the tubes from set 2 for subsequent
dPCR analysis in the laboratory.
In‑lab sample processing. Upon receiving set 2 in the laboratory, tissue was frozen in liquid nitrogen then
crushed to a fine powder using a 2 mm stainless steel ball bearing in a Retsch mixer mill MM400 (Retsch, Ger-
many), followed by DNA extraction with a Biosprint Plant DNA 15 kit (Qiagen), as per manufacturer’s instruc-
tions. The DNA was eluted in 200 µl of 1 × TE buffer and tested using both dPCR and ASqPCR in the same
manner as above. Any sample that fell outside the 200–2000 copy range on the dPCR was diluted/concentrated
and re-tested as required.
Scientific Reports | (2021) 11:4526 | https://doi.org/10.1038/s41598-021-83981-9 12
Vol:.(1234567890)www.nature.com/scientificreports/
Statistical analysis of dPCR and ASqPCR results. The results from all three methods were simul-
taneously compared using a box-plot as well as comparing paired results using a two tailed t test on Microsoft
Excel. Additionally, the results of the dPCR and field ASqPCR analyses were compared using SigmaPlot v13
(Systat Software, San Jose, CA). A Bland–Altman analysis, also known as the Tukey’s mean difference test was
conducted. The Bland–Altman plot was constructed by plotting the difference between the paired data points
(method 1 minus method 2) on the y-axis and the mean of the paired data points on the x-axis47. The mean of
the difference between the pairs represents the bias i.e. whether the method 1 is overestimating (positive bias) or
underestimating (negative bias) compared to method 2. The upper and lower limits of confidence are calculated
as the mean (bias) ± 1.96 standard deviation of the differences.
In‑field application of the ASqPCR pipeline for the detection of cytb mutation g428c. In Octo-
ber 2019, suspected strobilurin-resistant wheat powdery mildew samples (n = 12) collected from different farms
and brought by growers attending an industry field day at Northern Yorke Peninsula (South Australia), were pro-
cessed in-field (Table 1). The tissue was not excised using the coring tool, rather cut into small fragments using
scissors and forceps disinfected with 70% v/v ethanol between samples. Each sample was added up to the 100 µl
graduation in 1.5 ml microfuge tubes. This was followed by a quick DNA extraction and ASqPCR assay on the
MIC qPCR instrument (Bio Molecular Systems) as detailed above, and mutant frequency results communicated
to the growers upon assay completion.
Received: 9 September 2020; Accepted: 8 February 2021
References
1. Brent, K. J. Fungicide resistance in crop pathogens: How can it be managed? FRAC Monogr. (1995).
2. Russell, P. E. Fungicide resistance: Occurrence and management. J. Agric. Sci. 124, 317–323 (1995).
3. Hobbelen, P. H. F., Paveley, N. D. & van den Bosch, F. The emergence of resistance to fungicides. PLoS ONE 9, e91910 (2014).
4. Lucas, J. A., Hawkins, N. J. & Fraaije, B. A. The evolution of fungicide resistance, chapter 2. In Advances in Applied Microbiology
Vol. 90 (eds Sariaslani, S. & Gadd, G. M.) 29–92 (Academic Press, New York, 2015).
5. Brent, K. J. & Hollomon, D. W. Fungicide Resistance: The Assessment of Risk (Global Crop Protection Federation Brussels, Belgium,
1998).
6. Leadbeater, A. J. Plant health management: Fungicides and antibiotics. In Encyclopedia of Agriculture and Food Systems (ed. Van
Alfen, N. K.) 408–424 (Academic Press, New York, 2014). https://doi.org/10.1016/B978-0-444-52512-3.00179-0.
7. Hollomon, D. W. Fungicide resistance: 40 years on and still a major problem. In Fungicide Resistance in Plant Pathogens: Principles
and a Guide to Practical Management (eds Ishii, H. & Hollomon, D. W.) 3–11 (Springer, Tokyo, 2015). https: //doi.org/10.1007/978-
4-431-55642-8_1.
8. De Miccolis Angelini, R. M., Pollastro, S. & Faretra, F. Genetics of fungicide resistance. In Fungicide resistance in plant pathogens:
Principles and a guide to practical management (eds Ishii, H. & Hollomon, D. W.) 13–34 (Springer, Tokyo, 2015).
9. Luck, J. E. & Gillings, M. R. Rapid identification of benomyl resistant strains of Botrytis cinerea using the polymerase chain reac-
tion. Mycol. Res. 99, 1483–1488 (1995).
10. R4P Network. Trends and challenges in pesticide resistance detection. Trends Plant Sci. 21, 834–853 (2016).
11. Tsao, P. H. Selective media for isolation of pathogenic fungi. Annu. Rev. Phytopathol. 8, 157–186 (1970).
12. Allen, T. R., Millar, T., Berch, S. M. & Berbee, M. L. Culturing and direct DNA extraction find different fungi from the same ericoid
mycorrhizal roots. New Phytol. 160, 255–272 (2003).
13. Notomi, T. et al. Loop-mediated isothermal amplification of DNA. Nucleic Acids Res. 28, E63 (2000).
14. Nagamine, K., Hase, T. & Notomi, T. Accelerated reaction by loop-mediated isothermal amplification using loop primers. Mol.
Cell Probes 16, 223–229 (2002).
15. Fukuta, S., Mizukami, Y., Ishida, A. & Kanbe, M. Development of loop-mediated isothermal amplification (LAMP)-based SNP
markers for shelf-life in melon (Cucumismelo L.). J. Appl. Genet. 47, 303–308 (2006).
16. Kogovšek, P. et al. LAMP assay and rapid sample preparation method for on-site detection of flavescence dorée phytoplasma in
grapevine. Plant Pathol. 64, 286–296 (2015).
17. Pan, L., Li, J., Zhang, W. N. & Dong, L. Detection of the I1781L mutation in fenoxaprop-p-ethyl-resistant American sloughgrass
(Beckmanniasyzigachne Steud.), based on the loop-mediated isothermal amplification method. Pest Manag. Sci. 71, 123–130 (2015).
18. Duan, Y. et al. Development and application of loop-mediated isothermal amplification for detection of the F167Y mutation of
carbendazim-resistant isolates in Fusarium graminearum. Sci. Rep. 4, 7094 (2014).
19. Harrison, C., Tomlinson, J., Ostoja-Starzewska, S. & Boonham, N. Evaluation and validation of a loop-mediated isothermal
amplification test kit for detection of Hymenoscyphusfraxineus. Eur. J. Plant Pathol. 149, 253–259 (2017).
20. Hu, X. R., Dai, D. J., Wang, H. D. & Zhang, C. Q. Rapid on-site evaluation of the development of resistance to quinone outside
inhibitors in Botrytiscinerea. Sci. Rep. 7, 13861 (2017).
21. Wu, J. Y., Hu, X. R. & Zhang, C. Q. Molecular detection of QoI resistance in Colletotrichumgloeosporioides causing strawberry
anthracnose based on loop-mediated isothermal amplification assay. Plant Dis. 103, 1319–1325 (2019).
22. Suleman, E., Mtshali, M. S. & Lane, E. Investigation of false positives associated with loop-mediated isothermal amplification
assays for detection of Toxoplasmagondii in archived tissue samples of captive felids. J. Vet. Diagn. Investig. Off. Publ. Am. Assoc.
Vet. Lab. Diagn. Inc. 28, 536–542 (2016).
23. Hardinge, P. & Murray, J. A. H. Reduced false positives and improved reporting of loop-mediated isothermal amplification using
quenched fluorescent primers. Sci. Rep. 9, 7400 (2019).
24. van den Bosch, F., Oliver, R., van den Berg, F. & Paveley, N. Governing principles can guide fungicide-resistance management
tactics. Annu. Rev. Phytopathol. 52, 175–195 (2014).
25. Ugozzoli, L. & Wallace, R. B. Allele-specific polymerase chain reaction. Methods 2, 42–48 (1991).
26. Fraaije, B. A., Butters, J. A., Coelho, J. M., Jones, D. R. & Hollomon, D. W. Following the dynamics of strobilurin resistance in
Blumeriagraminis f. sp. tritici using quantitative allele-specific real-time PCR measurements with the fluorescent dye SYBR Green
I. Plant Pathol. 51, 45–54 (2002).
27. McCartney, H. A., Foster, S. J., Fraaije, B. A. & Ward, E. Molecular diagnostics for fungal plant pathogens. Pest Manag. Sci. 59,
129–142 (2003).
Scientific Reports | (2021) 11:4526 | https://doi.org/10.1038/s41598-021-83981-9 13
Vol.:(0123456789)www.nature.com/scientificreports/
28. Selim, S. Allele-specific real-time PCR for quantification and discrimination of sterol 14α-demethylation-inhibitor-resistant geno-
types of Mycosphaerellagraminicola. J. Plant Pathol. 91, 391–400 (2009).
29. Robinson, H. L., Ridout, C. J., Sierotzki, H., Gisi, U. & Brown, J. K. M. Isogamous, hermaphroditic inheritance of mitochondrion-
encoded resistance to Qo inhibitor fungicides in Blumeriagraminis f. sp. tritici. Fungal Genet. Biol. 36, 98–106 (2002).
30. Sierotzki, H., Wullschleger, J. & Gisi, U. Point mutation in cytochrome b gene conferring resistance to strobilurin fungicides in
Erysiphe graminis f. sp. tritici field isolates. Pestic. Biochem. Physiol. 68, 107–112 (2000).
31. Chin, K. M., Chavaillaz, D., Kaesbohrer, M., Staub, T. & Felsenstein, F. G. Characterizing resistance risk of Erysiphegraminis f. sp.
tritici to strobilurins. Crop Prot. 20, 87–96 (2001).
32. Sauter, H., Steglich, W. & Anke, T. Strobilurins: Evolution of a new class of active substances. Angew. Chem. Int. Ed. Engl. 38,
1328–1349 (1999).
33. Fraaije, B. A., Butters, J. A. & Hollomon, D. W. In planta genotyping of Erysiphe graminis f. sp. tritici isolates for strobilurin-
resistance using a fluorometric allele-specific PCR assay, 401–406 (2000).
34. Leadbeater, A. Resistance risk to QoI fungicides and anti-resistance strategies. In Fungicide Resistance in Crop Protection: Risk and
Management (ed. Thind, T. S.) 144–154 (CABI, Wallingford, 2012). https://doi.org/10.1079/9781845939052.0000.
35. Mair, W. et al. Proposal for a unified nomenclature for target-site mutations associated with resistance to fungicides. Pest Manag.
Sci. 72, 1449–1459 (2016).
36. Bäumler, S. et al. Evaluation of Erysiphegraminis f. sp. tritici field isolates for resistance to strobilurin fungicides with different SNP
detection systems. Pest Manag. Sci. 59, 310–314 (2003).
37. ABARES. Australian crop report. Aust. Bur. Agric. Resour. Econ. Sci. Canberra (2020).
38. Murray, G. M. & Brennan, J. P. Estimating disease losses to the Australian wheat industry. Australas. Plant Pathol. 38, 558–570
(2009).
39. Watt, S. & Novelli, P. Fungicide resistance discovery calls for urgent action. GRDC news and media release https://grdc.com.au/
news-and-media/news-and-media-releases/national/2017/03/fungicide-resistance-discovery-calls-for-urgent-action (2017).
40. Mair, W. J. et al. Demethylase inhibitor fungicide resistance in Pyrenophorateres f. sp. teres associated with target site modification
and inducible overexpression of Cyp51. Front. Microbiol. 7, 1279 (2016).
41. Vela-Corcía, D., Bellón-Gómez, D., López-Ruiz, F., Torés, J. A. & Pérez-García, A. The Podosphaerafusca TUB2 gene, a molecular
‘Swiss Army knife’ with multiple applications inpowdery mildew research. Fungal Biol. 118, 228–241 (2014).
42. Hollomon, D. W. & Ishii, H. Monitoring resistance using molecular methods. In Fungicide Resistance in Plant Pathogens: Prin-
ciples and a Guide to Practical Management (eds Ishii, H. & Hollomon, D. W.) 295–309 (Springer, Tokyo, 2015). https://doi.
org/10.1007/978-4-431-55642-8_18.
43. Zulak, K. G., Cox, B. A., Tucker, M. A., Oliver, R. P. & Lopez-Ruiz, F. J. Improved detection and monitoring of fungicide resistance
in Blumeriagraminis f. sp. hordei with high-throughput genotype quantification by digital PCR. Front. Microbiol. 9, 706 (2018).
44. Dufour, M.-C., Fontaine, S., Montarry, J. & Corio-Costet, M.-F. Assessment of fungicide resistance and pathogen diversity in
Erysiphe necator using quantitative real-time PCR assays. Pest Manag. Sci. 67, 60–69 (2011).
45. Cao, L. et al. Advances in digital polymerase chain reaction (dPCR) and its emerging biomedical applications. Biosens. Bioelectron.
90, 459–474 (2017).
46. Quan, P.-L., Sauzade, M. & Brouzes, E. dPCR: A technology review. Sensors (Basel) 18, 1271 (2018).
47. Bland, J. M. & Altman, D. G. Statistical methods for assessing agreement between two methods of clinical measurement. Lancet
327, 307–310 (1986).
48. Australian Bureau of Statistics. Agricultural Commodities, Australia, 2014–15, ‘Table 07. Agricultural commodities, state and
NRM region—Tasmania—2014–15’. Data cube Excel spreadsheet cat. no. 7121.0 (2016).
49. Australian Bureau of Statistics. Agricultural Commodities, Australia, 2015–16, ‘Table 07. Agricultural commodities, state and
NRM region—Tasmania—2015–16’. Data cube Excel spreadsheet cat. no. 7121.0 (2017).
50. Australian Bureau of Statistics. Agricultural Commodities, Australia, 2016–17, ‘Table 07. Agricultural commodities, state and
NRM region—Tasmania—2016–17’. Data cube Excel spreadsheet cat. no. 7121.0 (2018).
51. Australian Bureau of Statistics. Agricultural Commodities, Australia, 2017–18, ‘Table 07. Agricultural commodities, state and
NRM region—Tasmania—2017–18’. Data cube Excel spreadsheet cat. no. 7121.0 (2019).
52. Australian Bureau of Statistics. Agricultural Commodities, Australia, 2018–19, ‘Table 07. Agricultural commodities, state and
NRM region—Tasmania—2018–19’. Data cube Excel spreadsheet cat. no. 7121.0 (2020).
53. Villani, S. M. & Cox, K. D. Heteroplasmy of the cytochrome b gene in Venturiainaequalis and its involvement in quantitative and
practical resistance to trifloxystrobin. Phytopathology 104, 945–953 (2014).
54. Vielba-Fernández, A. et al. Heteroplasmy for the cytochrome b gene in Podosphaeraxanthii and its role in resistance to QoI fun-
gicides in Spain. Plant Dis. 102, 1599–1605 (2018).
55. Heun, M. Virulence frequencies influenced by host resistance in the host–pathogen system wheat-powdery mildew. J. Phytopathol.
118, 363–366 (1987).
56. Bäumler, S., Felsenstein, F. G. & Schwarz, G. CAPS and DHPLC analysis of a single nucleotide polymorphism in the cytochrome
b gene conferring resistance to strobilurins in field isolates of Blumeriagramims f. sp. hordei. J. Phytopathol. 151, 149–152 (2003).
Acknowledgements
This study was supported by the Centre for Crop and Disease Management, a co-investment of Curtin University
and the Australian grains industry through the Grains Research and Development Corporation (research grant
CUR00023). The authors wish to thank Rose Kristoffersen and Wesley Mair for the technical assistance during
the Tasmanian and South Australian field trips, respectively. They also wish to thank Dr. Ayalsew Zerihun for
providing assistance with the Bland-Altman analysis, Foundation for Arable Research (FAR) for sample contri-
bution and, Sam Trengove for coordinating sample submission at the field day in South Australia.
Author contributions
F.L.-R. designed the project. K.D. and R.O. contributed to the conception of the work. K.D. and B.C. performed
the analysis and interpretation of data. K.D. and F.L.-R. wrote the main manuscript and KD prepared Fig. 6. All
authors reviewed the manuscript.
Competing interests
The authors declare no competing interests.
Additional information
Supplementary Information The online version contains supplementary material available at https://doi.
org/10.1038/s41598-021-83981-9.
Scientific Reports | (2021) 11:4526 | https://doi.org/10.1038/s41598-021-83981-9 14
Vol:.(1234567890)You can also read