Cadastral Land Value Modelling Based on Zoning by Prestige: A Case Study of a Resort Town
←
→
Page content transcription
If your browser does not render page correctly, please read the page content below
sustainability

Article
Cadastral Land Value Modelling Based on Zoning by
Prestige: A Case Study of a Resort Town
Elena Bykowa 1 , Maria Hełdak 2                  and Julia Sishchuk 3, *
 1    Department of Engineering Geodesy, Saint Petersburg Mining University, 21-line, 2,
      St Petersburg 199106, Russia; Bykova_EN@pers.spmi.ru
 2    Department of Spatial Economy, Wrocław University of Environmental and Life Sciences, ul.
      Grunwaldzka 55, 50-357 Wrocław, Poland; maria.heldak@upwr.edu.pl
 3    Department of Foreign Languages, Saint Petersburg Mining University, 21-line, 2,
      St Petersburg 199106, Russia
 *    Correspondence: Sischuk_yum@pers.spmi.ru; Tel.: +7-921-951-12-65

 Received: 27 August 2020; Accepted: 21 September 2020; Published: 24 September 2020

 Abstract: The article discusses cadastral land valuation in Russian resort towns, a procedure flawed
 by the fact that it does not take into account territorial prestige. Researchers in Russia and other
 countries state that it is essential to redistribute the land tax burden as the current situation creates
 tax injustice, which is reflected in the undervaluation of prestigious areas and the overvaluation
 of non-prestigious ones in resort towns. Competition for the most prestigious areas in such towns
 mainly stems from the opportunity for landowners to earn higher rental incomes during the high
 season. In view of this, the study aims to provide a method for cadastral land valuation in resort
 towns based on zoning by prestige. The application of the proposed method is demonstrated using
 the town of Anapa (a Russian resort town by the Black Sea) as a case study. The method is based
 on several research and analysis methods, including the following: the analytical method, which is
 used for a preliminary analysis of urban areas to identify the most attractive parts of resort towns; a
 modification of Saaty’s methodology combined with Pareto analysis, which is used to identify criteria
 for assessing how prestigious and important a part of the town is; cluster analysis, which is used for
 ranking areas in resort towns; correlation and regression analysis, which is used for land valuation
 modelling. The article describes the key criteria for ranking areas in resort towns by prestige, gives a
 definition of prestige applied to resort town districts, and proposes an equation for calculating the
 integral indicator of prestige and a method for assessing prestige. The validity of the prestige map
 that was created for the town of Anapa was proved by analyzing the average market prices for land
 plots located within the identified zones. The cadastral land valuation models describing land plots
 in Anapa that are intended for private housing construction can be correctly interpreted and are of
 acceptable quality.

 Keywords: territorial prestige; mass valuation; cadastral land valuation; modelling; cadastral value;
 zoning; resort towns; land plots; private housing

1. Introduction
     Calculating the cadastral value of land is one of the topical issues in the current market system of
Russia, as its results have an impact on the amount of land value tax collected and, consequently, on
sustainable local development. According to the theory of taxation and the experience of developed
countries, the main goal of a fair land tax is to ensure sustainable local development rather than simply
to contribute to state revenue. However, this goal can only be achieved if several minimum conditions
are met. Among them are the following: land tax rates should be calculated as a percentage of market

Sustainability 2020, 12, 7904; doi:10.3390/su12197904                      www.mdpi.com/journal/sustainability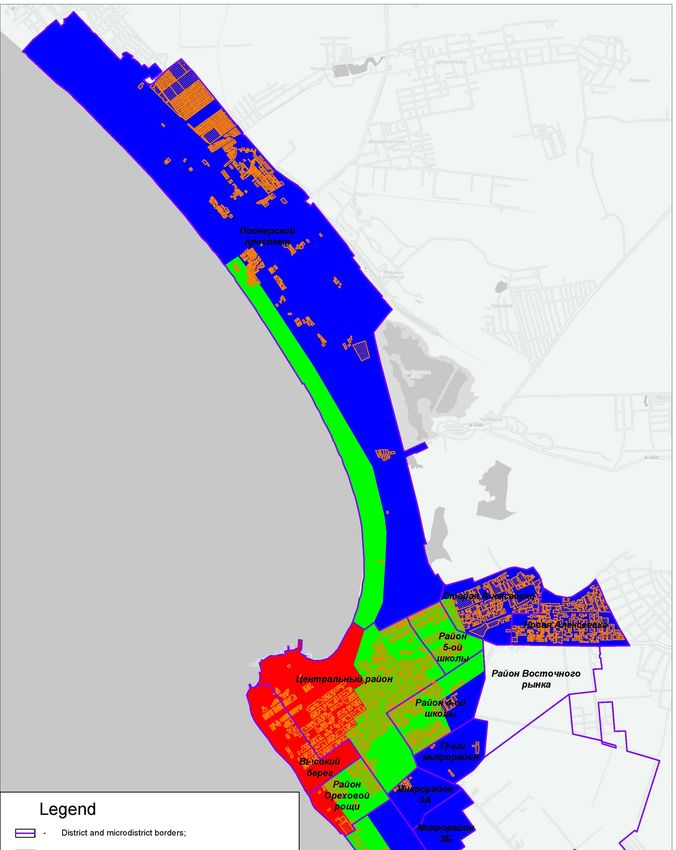
Sustainability 2020, 12, 7904                                                                        2 of 26

value; land valuation should be carried out by professionals who know the characteristics of the local
market very well; land valuation methods that are used should be simple and readily verifiable by
taxpayers; the characteristics of the property being evaluated should be logged in the Unified State
Register of Real Estate; market prices for land plots should be declared and information on them should
be freely available; land tax revenues should go to local governments and be used to improve public
utilities and the quality of the environment [1]; the local community should be able to monitor how
these funds are spent. Ideally, rather than evade taxes by any means, the population will indirectly
invest money by paying land tax in increasing the market value of real estate through improving the
territory as well as its environmental characteristics [2]. Thus, fair land taxation has a direct effect on
sustainable local development. To achieve this effect, the right institutional environment needs to be
created, which can be done, among other things, by improving the methodology of cadastral land
valuation in Russia.
      Currently, in many constituent entities of Russia, cadastral land valuation assessments that were
produced by private valuation companies in the previous valuation period before the year 2017 are
still valid, and Appendix A shows that the number of disputes in commissions and courts grew
until that year. According to publications that appeared in mass media in 2016, interest in cadastral
land valuation procedures and their results grew more than threefold compared to the previous
period [3]. In addition, Vladimir Putin, President of Russia, noted in his annual call-in show that
Russian people were interested in this issue. At the end-of-year board meeting of the Federal Service
for State Registration, Cadastre and Cartography (Rosreestr), when summing up the results of 2015
and discussing the prospects for 2016, Igor Vasiliev, the head, noted that cadastral land valuation
was increasing in social importance, and landowners were paying closer attention to the results of
cadastral land valuation procedures. In 2016, against this background, a new plan [4] for land and
property taxation began to be implemented, which implied the creation of publicly funded institutions
for cadastral land valuation. One of the goals set for these institutions was to make land valuation
assessments more objective, the effect of which can be seen in the graph (Appendix A) as a decrease in
the number of valuation disputes from 2017 to 2019. It should be noted that, in general, 85% of appeals
were filed concerning land plots, which makes the assessments of this particular type of real estate
questionable. A significant portion of real estate tax revenues in many regions is accounted for by land
tax. For example, in Krasnodar Krai, it accounts for 5.1% of budget revenue [5]. As can be seen from
the statistics and the analysis performed, the issues related to cadastral land valuation are topical for a
reason, making one of the tasks for the state and the scientific community to ensure that valuation
procedures are accurate and correct.
      What makes lands in populated areas special is the fact that their cost significantly exceeds that
of other categories of land. This is due to a high level of urbanization and the amount of capital
investment spent on construction, facilities, social infrastructure, etc. In the course of the study, about
one hundred settlements were identified in Russia that can be classified as resort towns, among which
are Sochi, Arkhyz, Kislovodsk, Gelendzhik, Zelenogorsk, Tuapse, Undory, Khadyzhensk, and others.
An analysis of their features showed an increase in their appeal with tourists in recent years, and,
accordingly, an increase in landowners’ rental incomes. This means that there are several features
characteristic of resort towns that influence the cadastral value of land plots and are not typical of
other settlements. These include, for example, access to the sea coast in the municipal district, the
distance from the land plot to the sea, the distance to the centre of Sochi, as well as the presence of and
the distance to a ski resort. After analyzing cadastral land valuation reports covering Russian resort
towns [6], several problems were revealed.
      First, valuation procedures do not take into account some important factors that have an impact
on the cadastral value of real estate and reflect the specific features of the land in resort towns and
coastal towns (for example, such factors as the distance from entertainment venues, a unique climate,
and hotel ratings).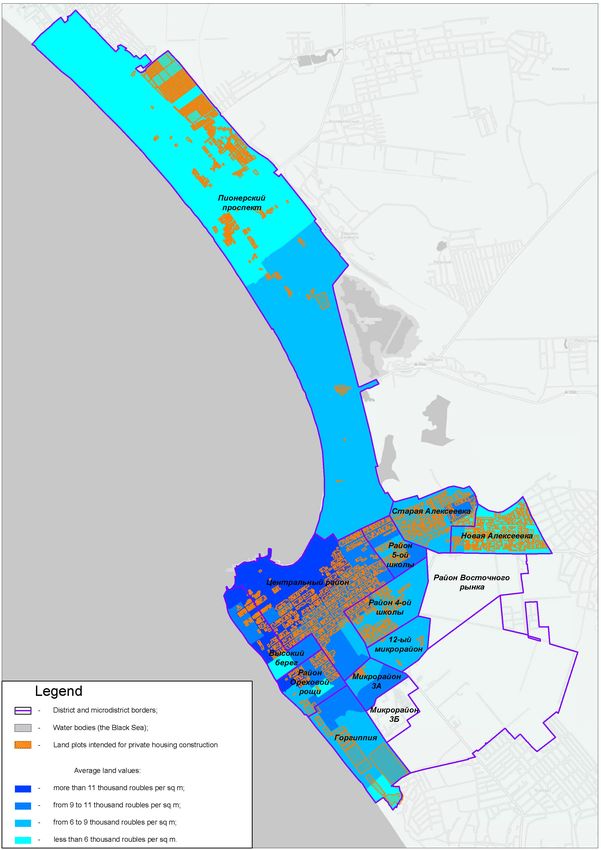
Sustainability 2020, 12, 7904                                                                             3 of 26

     Second, as the above factors are not taken into account, there is not enough information and legal
background to ensure that the cadastral values of these particular territories are objective and reliable.
     Third, due to technical and cadastral errors, incorrect information is entered into the Unified State
Register of Real Estate, which leads to errors in calculating both the cadastral value of some land plots
and land tax.
     To prove that this is a topical issue and it is necessary to improve the cadastral land valuation
methodology that is applied to resort towns, the cadastral values of land plots intended for private
housing construction were compared with the market prices (using the town of Anapa as an example)
(Appendix A). As a result, it was identified that major parts of such districts as Vysokiy Bereg and
Gorgippia are undervalued by about 2.5 times, with the district of Novaya Alekseevka demonstrating
the opposite situation.
     This situation creates tax injustice, which is reflected in the undervaluation of prestigious areas,
and the overvaluation of non-prestigious ones in resort towns. This means that the existing cadastral
land valuation methodology is imperfect as it does not take into account the impact of profit from the
value of land that is obtained by the residents of the towns located on the Black Sea coast, especially
during the high season. This is why the study aims to develop a method for cadastral land valuation
in resort towns based on zoning by prestige, which will make it possible to redistribute the land tax
burden and ensure social justice.
     The article is divided into sections. Section 2 discusses studies on mass land valuation and those on
the influence of prestige on land prices. Section 3 describes the land valuation methodology proposed
by the authors. Section 4 presents the results of testing this methodology on the Russian resort town of
Anapa. Section 5 contains conclusions that were made based on the results of the research and also
discusses the limitations of the proposed methodology and the areas where the results of the research
can be applied.

2. An Overview of Works on Mass Land Valuation and the Influence of Prestige on Land Prices
      Both Russian researchers and researchers from other countries have been discussing the issues
of improving cadastral land valuation methods. Among the latest works, one should mention those
by Lisi, G. [7]; Baumane, V. [8]; Balsera, M.C.M. and Martínez-Cuevas, S. [9]; Kovyazin, V.F. and
Romanchikov, A.Y. [10]; Wang, D., Li, V.J., and Yu, H. [11]; Aydinoglu A.C. and Bovkir, R. [12]; Bencure,
J.C. et al. [13]; Augustyniak, H. et al. [14]; Tajani, F. et al. [15], Calka, B. [16]; Morano P. et al. [17], and
others. Quite a good review of literature on the mass valuation of real estate and its prospects is made
in the article by Wang, D. and Li, V.J. [18].
      A study by Demetriou, D. showed that both linear and nonlinear regression models are valuable
tools that can be used to analyze the dependence of land prices on price factors [19]. Combining
classical linear regression models with spatial regression models and using geostatistical methods
were found to be adequate for developing a plan of values for rural properties of the North Fluminense
Region (RJ, Brazil) [20]. Comparing linear regression results with geographically weighted regression
(GWR) results obtained for Thessaloniki (Cyprus) showed that the GWR method has a much higher
coefficient of determination, which means that the created model fits much better in the data [21].
Artificial neural networks (ANNs) can produce much better results, which is demonstrated by Lin,
C.C. and Mohan, S.B. [22]. The problem with using ANNs is how this process works in practice. As
the model does not have a definable structure, it becomes difficult to explain why an object has a
particular value [23]. According to Doszyń, M., a combination of econometric, statistical, and expert
opinion approaches, accompanied by using Kendall’s coefficients in the process of land valuation,
makes it possible to create a hybrid model with a high degree of flexibility. However, this methodology
has some disadvantages. First, when calculating Kendall’s coefficients, the measurement scale for
real estate values is weakened by “transitioning” from the quotient to the ordinal scale. Second, the
assumption that transitions between attribute categories are relatively constant is not always true [24].
Sustainability 2020, 12, 7904                                                                         4 of 26

      To make cadastral or mass valuation models verifiable, the methods through which the results are
obtained must be clear and simple for taxpayers. Therefore, complex methods are often rejected by
policymakers regardless of their statistical merits [25].
      Territorial prestige is one of the factors influencing cadastral land valuation that has been least
studied to date. Humanity has been classifying territories as prestigious or not since the first states
emerged. The Soviet academician Yulian Bromley notes that it was due to the formation of specific
groups and clans in those days that some territories were classified as prestigious, resulting in social
stratification [26]. Currently, prestige plays an important role and has an impact on real estate prices,
which is confirmed by the opinions expressed by professionals involved in the construction sector.
They note that prestige is important but not critical and goes after such factors as transport accessibility,
the availability of health care, education, and service facilities, and the availability of public amenities.
According to an expert, prestige is an addition to the factors mentioned above and depends on public
opinion [27].
      Considering prestige as an attribute that is ascribed to objects or subjects by a society based on
their significance and attractiveness, it can be concluded that when an object or subject is tagged as
prestigious, it is viewed as having a permanent position (status) in this society. According to Henrich,
J. and Gil-White, F.J, the common meaning of prestige means respect and reverence that are bestowed
upon an individual by others without being influenced by violence, threat, or coercion [28]. The idea
that material goods can serve as indicators of social status dates back to the theory of the leisure class
proposed by Veblen, T. [29]. Within the functionalist theory of stratification, Davis, K. and Moore, W.E.
define prestige as what we get for our accomplishments, stating that differences in prestige constitute
a system of social inequality [30]. Prestigious goods are goods that are bought by the consumer to
improve his or her social standing [29]. The supply for such goods is inevitably limited as a result of
their shortage. As land has long been traded in the Russian real estate market, land plots can also be
classified as prestigious goods, provided that they are advantageously located (for example, in good
neighbourhoods or places popular with tourists). The main task in identifying prestigious territories is
to give reliable assessments of their importance and influence, which will ensure investment flows.
The very concept of prestige should be seen as an increase in the value of real estate located on a given
territory by making it unique and, in the case of resort towns, ensuring that it will generate profit.
The authors believe that the prestige of a land plot in a resort town depends on the opportunity for
the landowner to make a profit through renting it to tourists; therefore, it can be assumed that an
area where tourists want to comfortably stay for their holidays is considered to be prestigious. An
important aspect is that holidaymakers differ in terms of their preferences concerning holiday and
accommodation types.
      If a territory is to be considered prestigious, it has to meet particular social, economic, and
environmental requirements. As a rule, prestigious places in resort towns are attraction spots (such as
local centres, the town centre, or the historic centre) with housing facilities and social infrastructure of
a specific quality.
      The issue of the need to take into account this factor has been raised by several Russian researchers,
including Vandanimaeva, O.M. [31]; Romm, A.P. [32]; Nanazashvili, I.Kh. and Litovchenko, V.A. [33];
Portnoy, B.A. [34], as well as one of the authors of this article in one of her earlier works [35]. An
analysis of the works by other Russian authors (Gerasimova, E.; Truschenko, O., etc.) leads to the
conclusion that they mainly focus on patterns in the development of social segregation in urban areas
and suggest that it should be evaluated depending on urban morphology (the location of objects), the
city’s social structure, and attendance at culture and entertainment facilities [36–41]. As for Western
researchers, their works are mainly focused on measuring the phenomenon of social and spatial
segregation in the city by using population census data, statistics, polls, as well as in-depth interviews
with locals, the results of which are expressed in scores [42–46]. Multidimensional scaling methods
were used by Logan, J.R. and Collver, O.A. [47]; and Semyonov, M., and Kraus, V. [48] to study the
relationships between the objective characteristics of objects in prestigious areas and their category
Sustainability 2020, 12, 7904                                                                           5 of 26

memberships. An interesting and innovative approach to zoning geographic areas is the prestige
density-based spatial clustering of applications with a noise algorithm (P- DBSCAN) proposed by Hao,
F. [49]. At the same time, Hyötyläinen, M. and Haila, A. [50] claim that until recently, when Helsinki
began to implement an entrepreneurial public real estate policy, there were no districts in Finland
that wealthy citizens considered to be prestigious due to the state’s monopoly on area planning. As
a result of the new policy, private developers started implementing projects for the construction of
luxury homes, thereby creating prestigious territories in the city. In Chile, the pattern of places where
representatives of the upper class reside is changing as beautiful landscapes and hedonism are starting
to outweigh prestige [51].
      Despite the fact that there is already some theoretical background to the matter under
consideration [52,53], the conceptual and methodological issues of territorial prestige assessment
carried out as part of cadastral land valuation have not yet been properly addressed.
      When studying the issue of cadastral land valuation, it was previously concluded that a significant
factor influencing the specifics of land pricing in big cities is territorial prestige. Prestige discussed
in an earlier article [52] is considered in reference to highly urbanized areas, where the emergence of
prestigious districts is mainly associated with the processes of social and spatial segregation, or the
isolation of social groups from each other, and with the development of the land market according to
marketing and pricing laws. Also, the main criteria were identified for a district to be called prestigious,
which include the average income, the quality of landscaping, proximity to water bodies, etc. It should
be noted that the prestige factor is not applicable to all towns and cities. For example, provincial towns
or so-called monotowns (factory towns) do not have prestigious districts. However, there is a separate
group of settlements where some districts are starting to be considered prestigious based on processes
and factors other than those previously discussed. Resort towns belong to this group.
      In the context of this study, the prestige of an area that is located in a resort town and intended for
private housing construction is understood as the result of a subjective attractiveness assessment that
is given to this area by a group of people employed in the tourism industry by using rental income as
the main assessment criterion. Some areas are considered to be more attractive and promising in terms
of generating rental income due to the following reasons:

•     interest on the part of potential buyers that is caused by such qualities of a land plot as being
      unique, luxurious, and of limited supply in the real estate market;
•     complementarity, which means that the location possesses several attractive characteristics, such
      as proximity to the sea coast, being surrounded by entertainment venues that attract tourists,
      good ecology, and favourable microclimatic conditions;
•     eagerness expressed by tourists and travellers to spend a long time in these areas.

     As a rule, the city centre is considered to be the most prestigious district. In Russian resort towns,
the centre is usually the district that is located closest to the sea coast and also considered to be the
most prestigious and expensive.
     The article [53] explains the choice of several criteria for assessing the prestige of districts in resort
towns, which include: proximity to the sea coast with public beaches; availability of entertainment
venues; environmental quality, including the sea coast and the sea itself [54,55]; microclimatic
conditions [56,57]; the opportunity to install utility lines [58]; population density; hotel ratings. These
criteria will make it possible, first, to state if there any prerequisites for the emergence of prestigious
districts in resort towns; second, to state where their boundaries are; third, to confirm or refute the
hypothesis that pricing processes differ depending on how prestigious areas are; fourth, to find the
cadastral value of a land plot taking into account the prestige of the area where it is located. The latter
will make assessments more objective since it is in resort towns that the differentiation of rental income
obtained by landowners depends on location. This causes competition for land plots located in the
most prestigious areas. In addition, it will make it possible to achieve social justice by redistributing
the tax base.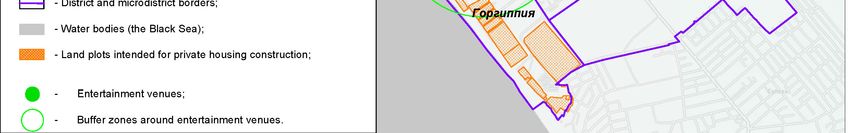
Sustainability 2020, 12, 7904 6 of 26
3. Materials and Methods
The proposed method of cadastral land valuation in resort towns based on zoning by prestige
Sustainability
consists of a 2020, 12, x FOR
sequence of PEER
stepsREVIEW 6 of 27
(Figure 1) that combine a modification of Saaty’s methodology [59],
Pareto analysis [60], cluster analysis, and also correlation and regression analysis.
Figure 1. An algorithm for cadastral land valuation in resort towns based on zoning by prestige.
Figure 1. An algorithm for cadastral land valuation in resort towns based on zoning by prestige.
The first step was to conduct a preliminary analysis of the urban area to see whether some
prestigious areasstep
The first could wasbe to
identified.
conduct This step implied
a preliminary using analysis,
analysis synthesis,
of the urban andsee
area to comparison.
whether some
In the second step, a questionnaire (Appendix C) was developed and distributed
prestigious areas could be identified. This step implied using analysis, synthesis, and comparison. among experts in
the fields of land and property services, urban planning, architecture,
In the second step, a questionnaire (Appendix C) was developed and distributed among ecology, and real estate valuation
experts
toincreate a combination
the fields of land and of objective
property criteria
services, forurban
assessing prestige.
planning, Thirty-seven
architecture, experts
ecology, andtook
real part
estate
invaluation
the study,toa create
number that meets the
a combination requirement
of objective specifying
criteria the minimum
for assessing prestige. number
Thirty-sevenof participants
experts took
(thirty-three
part in theindividuals)
study, a numberthat wasthatcalculated
meets according to [61]. To
the requirement ensure that
specifying thethe results arenumber
minimum reliable,of
anparticipants
error value (thirty-three
of 0.05 was accepted as permissible, with the optimal value being
individuals) that was calculated according to [61]. To ensure that the0.1, as stated inresults
[62].
The results of the expert opinion analysis were processed using the methodology
are reliable, an error value of 0.05 was accepted as permissible, with the optimal value being 0.1, as presented in detail
in stated
[63], asinwell[62].as The
in [59,64].
resultsAof Pareto chart, one
the expert of theanalysis
opinion quality control methods according
were processed using thetomethodology
the Union
ofpresented
Japanese Scientists and Engineers, was used to find out which criteria were important.
in detail in [63], as well as in [59,64]. A Pareto chart, one of the quality control methods The Pareto
principle
according states thatUnion
to the 20% of ofthe effortsScientists
Japanese bring 80%and of the results while
Engineers, the other
was used to find80%
outofwhich
the efforts
criteriabring
were
only 20% of the results. In Pareto charts, a horizontal line is usually drawn at
important. The Pareto principle states that 20% of the efforts bring 80% of the results while the other 80% from the y-axis to
intersect the curve. All the values to the left of the intersection show important factors,
80% of the efforts bring only 20% of the results. In Pareto charts, a horizontal line is usually drawn at with all the rest
showing
80% from otherthefactors.
y-axis to intersect the curve. All the values to the left of the intersection show important
The choice
factors, with all ofthe
a model (additive,
rest showing multiplicative,
other factors. quasi-additive, etc.) showing the relationship
between the integral indicator of territorial prestige
The choice of a model (additive, multiplicative, quasi-additive, (IITP) and the assessment criteria is
etc.) showing made
the based
relationship
onbetween
checkingthe theintegral
criteriaindicator
for multicollinearity
of territorialasprestige
complying (IITP)with
andthe
theadditivity
assessment rule. This was
criteria donebased
is made by
calculating the matrix determinant, whose elements are the correlation coefficients
on checking the criteria for multicollinearity as complying with the additivity rule. This was done by between the criteria.
Incalculating
finding the the correlation
matrix coefficient,
determinant, thewhose
following algorithm
elements are was used:
the correlation coefficients between the
(1)criteria. In finding
Formulating the correlation
a regression coefficient,
equation y = a · xthe following
+ b, algorithm
with a and b being was used:
found as follows:
(1) Formulating a regression equation y = a ⋅ x + b , with a and b being found as follows:
x·y−x·y
b= , (1)
2
xx2⋅ − ( x
y−x⋅y )
b= , (1)
2 2
a = yx −−b( x· )x, (2)
where x and y are the values of the criteria for which the correlation coefficient is calculated; x,
a = y −b⋅ x , (2)
and y are the average values of the criteria; x · y is the average of the product of the values.
where x and y are the values of the criteria for which the correlation coefficient is calculated; x , and
y are the average values of the criteria; x ⋅ y is the average of the product of the values.
(2) Calculating variance for each criterion as follows: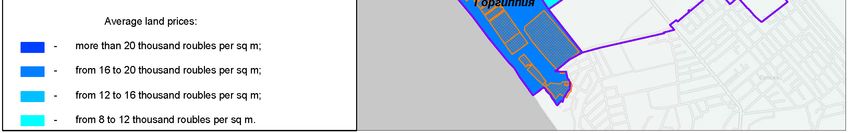
Sustainability 2020, 12, 7904                                                                            7 of 26

(2)    Calculating variance for each criterion as follows:

                                                  σ2x = x2 − (x)2 ,                                         (3)

                                                  σ2y = y2 − ( y)2 ,                                        (4)

(3)    Finding the correlation coefficient using the following equation:

                                                                  σx
                                                      rxy = b ·      .                                      (5)
                                                                  σy

     Territories were ranked in MapInfo, a GIS product that provides different data grouping options,
for example, “equal number of records”, “equal range of values”, “groups formed naturally”, etc [65].
In this study, territories were ranked based on the integral indicator of territorial prestige (IITP) using
cluster analysis, which enables researchers to classify the results of their observations and split data
into homogeneous groups with great precision [66]. The number of zones that differ from each other
by their levels of prestige was found with the help of the Euclidean distance according to the principle
of “the nearest neighbour” [67]. The method was applied in the following sequence:
1.     For each cluster, a new IITP value was found in order to normalize the results using the
       following equation:
                                                IITPi − IITPmin
                                      IITPN =                   ,                            (6)
                                              IITPmax − IITPmin
      where IITPN is the new IITP value; i is the criterion (cluster); IITPi denotes the values of the integral
      indicators of territorial prestige; IITPmin is the minimum IITP value; IITPmax is the maximum
      IITP value.

2.     Using the new IITPN value, the Euclidean distance was calculated between the new values of the
       integral indicators of territorial prestige:
                                                      q
                                         Ri,(i+1) =    IITPNi − IITPN(i+1) ,                                (7)

      where IITPNi is the value of the new i-th integral indicator of territorial prestige; IITPN(i+1) is the
      value of the new i+1 integral indicator of territorial prestige; Ri,(i+1) is the Euclidean distance
      between IITPNi and IITPN(i+1) (the value of the new integral indicator of territorial prestige for
      various clusters).

3.     The k-means clustering iterative algorithm was used to cluster the values according to the
       principle of the “nearest neighbour“ until the Euclidean distance from the value of the integral
       indicator to its “nearest neighbour“ did not exceed the threshold (maximum) value.

     Cadastral land-value modelling should be carried out separately for each zone distinguished in a
resort town by its level of prestige. To do this, the following algorithm is proposed:
1.     Identifying the list of factors affecting cadastral values of land plots intended for private
       housing construction.
2.     Obtaining initial data on the situation in the market, finding the values of the factors, and
       conducting an analysis.
3.     Identifying the functional relationship between pricing factors and the price variable.
4.     Developing a valuation model and calculating its parameter values.
5.     Assessing the statistical significance of the model.
     Initial data and base maps were taken from such official sources as the Unified State Register of
Real Estate, the rules for land use and development in resort towns, the general plan of Anapa, and the
Sustainability 2020, 12, 7904                                                                                  8 of 26

land use plan for Krasnodar Krai (the region where Anapa is located). Information on market prices
for land plots was taken from real estate market databases compiled by the Federal Service for State
Registration, Cadastre, and Cartography and from real estate websites such as Avito.ru, Domofond.ru,
Gde.ru, Irr.ru, Rosrealt.ru, Realty.dmir.ru, Vestum.ru, Ubu.ru, Uberega.ru, Tourister.ru, and others. To
find the values of numerical and distance factors (those associated with the distance of a land plot
from an object that has a significant effect on its cadastral value), the MapInfo geographic information
system was used.
      To develop statistical models, the value factors that were selected based on the analysis of the real
estate market were studied using correlation and regression analysis, which made it possible to reveal
multicollinearity between them and their combined influence.
      To determine the kind of functional relationship, value distribution can be analyzed. If the
distribution graph is asymmetric and shifted to the left, and the distribution of the logarithms of this
value is close to normal, preference is given to the multiplicative model. However, nonlinear models
are difficult to apply, but nowadays they are often used to estimate the hedonic price function for
private housing as they produce more accurate results [68]. Some Russian researchers believe that
these models produce less accurate results than linear models [69,70]. This makes it preferable to use
linear models and necessary to linearize nonlinear models, including multiplicative ones.

4. Results and Discussion
      As an example, the proposed method of cadastral land valuation in resort towns based on zoning
by prestige is applied here to the town of Anapa, a green settlement with flat topography, which has a
unique environment and is comfortable for living. Anapa’s real estate market is considered to be one
of the most promising along with those of Sochi and Gelendzhik (other Russian resort towns by the
Black Sea), which was the reason for selecting this particular settlement for the study.
      Currently, new houses are being built and infrastructure is being improved in all districts and
microdistricts of Anapa. The existing buildings can be divided into several groups: new high-rise and
low-rise buildings of the upper class, blocks of flats that were built from the 1970s to the 1990s, private
houses, and cottages. In Anapa, as in all resort towns, the so-called private sector is a widespread
phenomenon. This is a form of real estate ownership in which there is a well-maintained territory
with private houses and bungalows that are intended for renting during the high season. To analyze
whether there are territories in Anapa that can be viewed as prestigious, its districts and microdistricts
were considered separately (Appendix B). Based on the analysis, it can be concluded that there are all
the prerequisites necessary for zoning the town map by prestige.
      To develop a system of objective criteria for assessing territorial prestige, the eigenvalues of the
experts’ answer matrices were found, which are presented in Table 1. It can be seen that some values
of λi exceed the permissible value (7.797). The answer matrices with such values were excluded from
the analysis.

                                Table 1. The eigenvalues of the experts’ answer matrices.

       Expert Number             Matrix Eigenvalue (λi )       Consistency Index            Consistency Ratio, %
               1                          8.364                       0.23                          17
               2                          7.280                       0.05                           4
               3                          7.322                       0.05                           4
               4                          7.499                       0.08                           6
               5                          7.357                       0.06                           5
               6                          7.628                       0.10                           8
               7                          7.780                       0.13                          10
               8                          7.196                       0.03                           2
               9                          7.655                       0.11                           8
               10                         7.417                       0.07                           5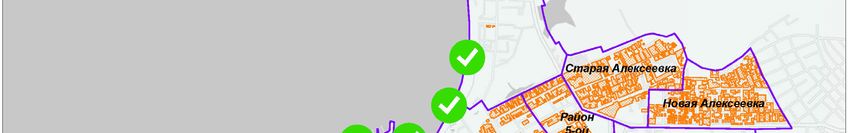
Sustainability 2020, 12, 7904                                                                           9 of 26

                                                    Table 1. Cont.

       Expert Number            Matrix Eigenvalue (λi )       Consistency Index      Consistency Ratio, %
               11                       7.338                        0.06                       4
               12                       7.142                        0.02                       2
               13                       7.155                        0.03                       2
               14                       7.314                        0.05                       4
               15                       7.617                        0.10                       8
               16                       7.784                        0.13                      10
               17                       7.282                        0.05                       4
               18                       7.230                        0.04                       3
               19                       7.324                        0.05                       4
               20                       9.116                        0.35                      27
               21                       7.294                        0.05                       4
               22                       7.760                        0.13                      10
               23                       7.263                        0.04                       3
               24                       7.509                        0.08                       6
               25                       7.673                        0.11                       8
               26                       7.174                        0.03                       2
               27                       7.297                        0.05                       4
               28                       7.456                        0.08                       6
               29                       7.462                        0.08                       6
               30                       7.545                        0.09                       7
               31                       7.302                        0.05                       4
               32                       7.400                        0.07                       5
               33                       7.410                        0.07                       5
               34                       7.254                        0.04                       3
               35                       8.887                        0.31                      24
               36                       7.586                        0.10                       7
               37                       7.237                        0.04                       3
             λσmax                      7.792                        0.13                      10

     The weighting factors of the criteria for assessing territorial prestige in resort towns were calculated
as the arithmetic mean of the experts’ weights, whose answers were consistent and are presented in
Table 2. The general level of expertise was 83%.

      Table 2. The weighting factors of the criteria for assessing territorial prestige given in order
      of importance.

                Number                            Criterion                       Weighting Factor
                     1          Proximity to the sea coast with public beaches          0.26
                     2              Availability of entertainment venues                0.22
                     3                     Environmental quality                        0.17
                     4                          Hotel ratings                           0.13
                     5                        Population density                        0.11
                     6               Opportunity to install utility lines               0.07
                     7                    Microclimatic conditions                      0.04

     As can be seen from Figure 2, the following criteria remained significant according to the
Pareto chart: proximity to the sea coast with public beaches, availability of entertainment venues,
environmental quality, and hotel ratings.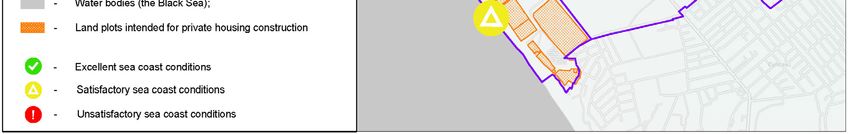
Sustainability 2020, 12, 7904 10 of 26
Sustainability 2020, 12, x FOR PEER REVIEW 10 of 27
1.00
0.90
0.80
0.70
Weighting factor
0.60
0.50
0.40
0.30
0.20
0.10
0.00 Proximity to the sea coast Availability of Environmental quality Hotel ratings Population density Opportunity to install Microclimatic conditions
with public beaches entertainment venues utility lines
Figure
Figure 2. Identifying
2. Identifying criteria
criteria thatthat
areare significant
significant forfor assessing
assessing territorial
territorial prestige
prestige in in resort
resort towns.
towns.
Correlation analysis in this case showed that the additive function is the most appropriate as it
Correlation analysis in this case showed that the additive function is the most appropriate as it
fulfils the condition that the criteria should be independent of each other (Table 3).
fulfils the condition that the criteria should be independent of each other (Table 3).
Table 3. Criteria for assessing territorial prestige: a multicollinearity check.
Table 3. Criteria for assessing territorial prestige: a multicollinearity check.
Proximity to the Availability of
Proximity to Environmental
Prestige
Prestige Assessment Criterion
Assessment Seathe Availability
Coast with of
Entertainment Environmental Hotel Rankings
Hotel
Quality
Sea Coast Public
with BeachesEntertainment
Venues
Criterion Quality Rankings
Proximity to the sea coastPublic
with Beaches 1 Venues0.32 0.43 0.12
public beaches
Proximity to the sea
Availability of entertainment venues 0.32 1 0.51 0.20
coast with public quality
Environmental 1 0.43 0.32 0.51 0.431 0.12
0.21
beachesHotel rankings 0.12 0.20 0.21 1
Availability of
entertainment
The integral indicator that 0.32reflects the prestige1 of territories intended
0.51 for private 0.20housing
venues in resort towns will be calculated as the sum of pairwise products of the weights
construction
Environmental
of the prestige assessment criteria 0.43 and the values of 0.51
the significant prestige1assessment criteria:
0.21
quality
n
Hotel rankings 0.12 X 0.20 0.21 1
IITP = (pi · Ki ), (8)
i=1
The integral indicator that reflects the prestige of territories intended for private housing
construction
where IITPinisresort towns will
the integral be calculated
indicator as the sum
of territorial of pairwise
prestige; products
pi denotes of the weights
the weights of the
of the prestige
prestige assessment
assessment criteria,criteria
whoseandsumthe values
is equal to of the
1; K i significant
denotes the prestige
values of assessment
the criteria:
significant prestige assessment
criteria; n is the number of prestige assessment criteria.
n
Ki values are determined as follows: IITP = ( pi ⋅ Ki ) , (8)
i =1
• Proximity to the sea coast with public beaches is determined by measuring the distance from the
where IITP is the integral indicator of territorial prestige; pi denotes the weights of the prestige
sea coast to each land plot.
assessment criteria, whose sum is equal to 1; Ki denotes the values of the significant prestige
• The availability of entertainment venues is determined based on the density of the objects [71]
assessment criteria; n is the number of prestige assessment criteria.
located around the land plot that are attractive to tourists (within a distance of no more than 1
Ki values are determined as follows:
km). This makes it possible to identify areas where tourism infrastructure is highly developed
• Proximity to the sea coast with public beaches is determined by measuring the distance
(Figure 3a).
• from the sea coastquality
Environmental to each[72]
land plot.
is determined based on beach quality rankings as the sum of normalized
• The availability
values for eachofbeach
entertainment venueswithin
(Table 4) located is determined based on(no
walking distance themore
density
thanof1 km)
the objects
from the land
[71] located around
plot (Figure 3b). the land plot that are attractive to tourists (within a distance of no more
• than 1 km). This makes it possible to identify areas where tourism infrastructure is highly
Hotel ratings are analyzed regarding the number of objects (temporary accommodation facilities
developed
having a (Figure
number3a).
of stars greater than three) per m2 of the district or microdistrict.• Environmental quality [72] is determined based on beach quality rankings as the sum of
normalized values for each beach (Table 4) located within walking distance (no more than
1 km) from the land plot (Figure 3b).
• Hotel2020,
Sustainability ratings are analyzed regarding the number of objects (temporary accommodation
12, 7904 11 of 26
facilities having a number of stars greater than three) per m of the district or microdistrict.
2
(a) (b)
Figure3.3. Spatial
Figure Spatialdistribution
distributionofofIITP
IITPcriteria:
criteria:(a)
(a)a amap
mapofof
buffer zones
buffer around
zones entertainment
around venues
entertainment in
venues
Anapa; (b) (b)
in Anapa; a map of beaches
a map in Anapa.
of beaches in Anapa.
Table 4. Beach quality and water-quality rankings in Anapa.
Table 4. Beach quality and water-quality rankings in Anapa.
Rank Beach Normalized Criterion Value
Normalized Criterion
Rank1 Zolotaya Beach
Bukhta Hotel Beach 0.130
Value
2 Malaya Bukhta Beach (Vysokiy Bereg Hotel) 0.120
1 Zolotaya Bukhta Hotel Beach 0.130
3 Anapa Central Beach 0.110
2 4 Malaya Bukhta
Vysokiy Beach
Bereg (Vysokiy
Beach (near theBereg Hotel)
lighthouse) 0.120
0.100
3 5 Anapa Central
Odysseus Beach
Hotel Beach 0.110
0.095
4 6 Vysokiy Bereg
A wild Beach
beach (near
located the lighthouse)
in Malaya Bukhta 0.100
0.090
5 7 Chernomorets
Odysseus Hotel BeachBeach 0.080
0.095
8 Malaya Bukhta Health Resort Beach 0.070
6 A wild beach located in Malaya Bukhta 0.090
9 A wild beach located in Vysokiy Bereg behind the lighthouse 0.060
7 10 Chernomorets
Beach of Beach of Victory
the 40th Anniversary 0.080
0.050
8 11 Malaya Bukhta Health
Lazurny Resort Beach
Beach 0.070
0.040
12 A beach
A wild beach located in near Vityazevo
Vysokiy Bereg behind the 0.030
9 13 A beach near Dzhemete 0.060
0.020
lighthouse
14 Dobrodeya Beach 0.010
10 Beach of the 40th Anniversary of Victory 0.050
11 Lazurny Beach 0.040
12To calculate IITP values,AKbeach
i values must
near be normalized because otherwise the classification
Vityazevo 0.030 will be
impacted
13 by the criteria withAthe
beachbiggest
nearranges of values. IITP values are calculated 0.020
Dzhemete for each land plot
under
14 consideration. Dobrodeya Beach 0.010
Using the hierarchical clustering method (the agglomerative approach) to analyze the sample
of landTo plots based
calculate onvalues,
IITP their IITP values,
Ki values 160
must beclusters werebecause
normalized identified (Figurethe
otherwise 4a). After finding
classification will
the normalized
be impacted by IITP values
the criteria
N using
with theEquation
biggest (6),
ranges the
of Euclidean
values. distance
IITP values was
are calculated
calculated (Figure
for each 4b).
land
According
plot underto the principle of “the nearest neighbour”, k-means clustering was performed using the
consideration.
iterative method until the Euclidean distance from the value of the integral indicator being considered
to its “nearest neighbour” did not exceed the threshold value of 0.164, as this is the maximum value. In
the end, the results formed three clusters.land plots based on their IITP values, 160 clusters were identified (Figure 4a). After finding the
normalized IITPN values using Equation (6), the Euclidean distance was calculated (Figure 4b).
According to the principle of “the nearest neighbour”, k-means clustering was performed using the
iterative method until the Euclidean distance from the value of the integral indicator being
considered2020,
Sustainability to its “nearest neighbour” did not exceed the threshold value of 0.164, as this 12
12, 7904 is ofthe
26
maximum value. In the end, the results formed three clusters.
0.800
0.700
0.600
0.500
0.400
0.300
0.200
0.100
0.000
0 50 100 150 200
Integral indicator value
(a)
0.25
0.2
0.15
0.1
0.05
0
1 2 3 4 5 6 7 8 9 10 11 12 13 14 15 16 17 18
Growth in the Euclidean distance
(b)
Figure 4. Graphs: (a)
(a) IITP
IITP value
value distribution;
distribution; (b)
(b) growth
growth in the Euclidean distance.
The map of Anapa
Anapa was
was then
then divided
dividedinto
intozones
zonesusing
usingthe
thedata
dataon
onthe
theclusters
clusterspresented
presentedininTable
Table5.
5.
Table 5. The results of k-means clustering applied to the integral indicator of territorial prestige.
Table 5. The results of k-means clustering applied to the integral indicator of territorial prestige.
Cluster Number
Indicator
1 Cluster Number2 3
Indicator
Cluster boundaries 1
0.441–0.726 2
0.160–0.426 3
0.023–0.147
Cluster boundaries
Cluster centre 0.441–0.726
0.583 0.160–0.426
0.293 0.023–0.147
0.085
Cluster centre 0.583 0.293 0.085
The resulting cluster boundaries (denoting territories which differ by the level of prestige) are
The resulting cluster boundaries (denoting territories which differ by the level of prestige) are
shown on the map of Anapa (Figure 5). The lines were drawn along natural or artificial boundaries
shown on the map of Anapa (Figure 5). The lines were drawn along natural or artificial boundaries
(such as streets and roads, rivers, as well as district or microdistrict borders). In addition, only those
(such as streets and roads, rivers, as well as district or microdistrict borders). In addition, only those
districts and microdistricts of the town of Anapa were analyzed that have plots of land where private
districts and microdistricts of the town of Anapa were analyzed that have plots of land where private
housing construction is permitted. As a result, three zones were identified: Zone 1—prestigious
territories; Zone 2—standard territories; Zone 3—non-prestigious territories.Sustainability 2020, 12, x FOR PEER REVIEW 13 of 27
Sustainability
housing 2020, 12, 7904 is permitted. As a result, three zones were identified: Zone 1—prestigious
construction 13 of 26
territories; Zone 2—standard territories; Zone 3—non-prestigious territories.
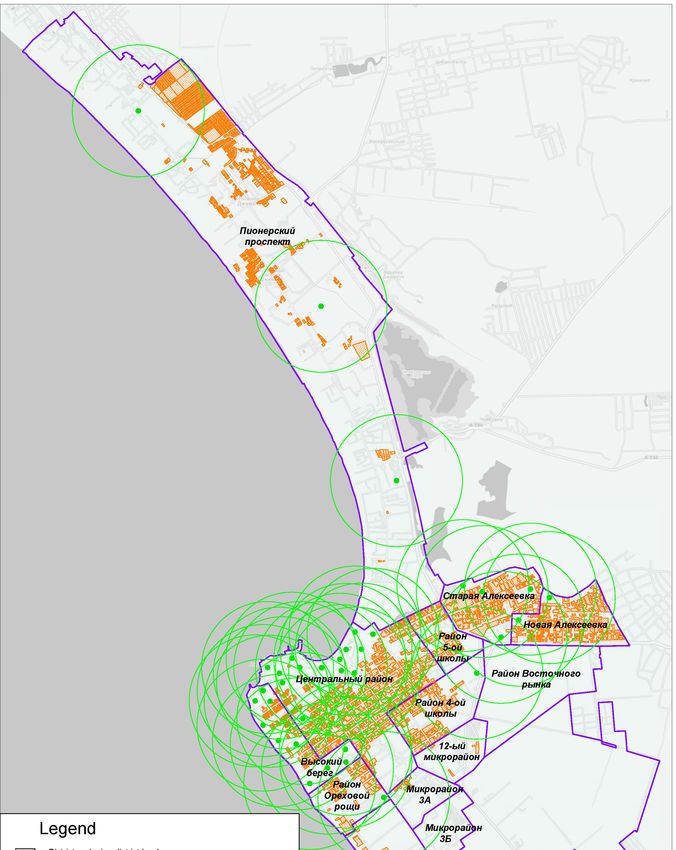
Figure5.5.Anapa
Figure Anapa zoning by prestige.
zoning by prestige.
The map shows that territories closest to the sea coast are prestigious. In addition, Central District
has the biggest concentration of entertainment venues that attract tourists who prefer active recreation.
Standard territories usually have access to good beaches, tourist accommodation facilities, and good
customer service. On the contrary, non-prestigious territories are located at a great distance from theSustainability 2020, 12, 7904 14 of 26
Black Sea coast and entertainment venues. When comparing the results of Anapa zoning by prestige
(Figure 5) and the map showing the distribution of market prices for land plots in Anapa (Appendix A),
it was concluded that these maps are similar and commensurable. This confirms that the methodology
for assessing territorial prestige in resort towns can be put into practice and used in land valuation.
However, including territorial prestige assessed by the method considered above as a price factor in
cadastral land valuation procedures is inappropriate, since it may result in the multicollinearity of
the variables included in the regression equation and, as a consequence, in biased assessments and
statistically insignificant models. For this reason, it is proposed that territorial prestige should be
considered as a criterion for dividing the town into zones, with cadastral value modelling applied
to each of them separately, i.e., it is necessary to formulate a hypothesis that pricing processes differ
depending on the level of territorial prestige.
The list of factors that have a significant impact on the cadastral value of land plots in the resort
town of Anapa was compiled based on the list of pricing factors that is present in the current cadastral
land valuation report and the results of analyzing the real estate market. It is presented in Table 6.
Table 6. Pricing factors.
Code. Factor
F1 Availability of a shopping facility
F2 Availability of recreational facilities
F3 Availability of a medical facility
F4 Availability of a cultural facility
F5 Connection to a gas supply system
F6 Connection to a water supply system
F7 Connection to a heating system
F8 Connection to a power supply system
F9 Connection to a sewer system
F10 Distance to the nearest bus stop
F11 Distance to the nearest railway platforms and stations
F12 Distance to the nearest bus terminal
F13 Distance to the airport
F14 Distance to the nearest port
F15 Distance to sea coast
F16 Distance to the town centre
F17 Number of hotels
F18 Quality of the sea coast
F19 Availability of entertainment venues
The number of land plots used in modelling was 225. As developing a model requires analyzing
at least five or six land plots per each factor under study [73] and there are nineteen factors to be
considered, it is necessary to analyze from 95 to 114 land plots. It should be noted that this is more of a
guideline rather than a requirement since the number of objects will be sufficient only if it is possible to
create a statistically significant model based on the data that was collected.
First of all, it should be noted that such factors as F1, F3, F6, F7, F8, and F9 have the same values for
all objects within the three zones and are therefore excluded from the analysis (Table 8). For the same
reason, factors F5 and F18 are also excluded from the analysis of the zone of prestigious territories.
A multicollinearity check showed multicollinearity between factors in all three zones. As an
example, Table 7 presents a matrix of partial correlation coefficients for Zone 2 (the zone of standard
territories), where multicollinear factors are shown in bold. Of the two multicollinear factors, the factor
with the lower t-statistic was excluded from further modelling.Sustainability 2020, 12, 7904 15 of 26
Table 7. Checking pricing factors in Zone 2 (the zone of standard territories) for multicollinearity: a
matrix of partial correlation coefficients.
F2 F4 F5 F10 F11 F12 F13 F14 F15 F16 F17 F18 F19
F2 1
F4 0.47 1
F5 0.18 0.23 1
F10 0.16 0.27 0.16 1
F11 0.28 0.56 0.33 0.72 1
F12 0.27 0.54 0.31 0.76 0.99 1
F13 0.29 0.58 0.36 0.64 0.99 0.97 1
F14 0.08 −0.37 −0.38 −0.19 −0.38 −0.37 −0.41 1
F15 −0.20 0.19 0.30 0.09 0.23 0.21 0.26 −0.96 1
F16 0.45 0.44 0.23 0.16 0.26 0.25 0.27 −0.11 −0.02 1
F17 0.46 0.35 0.16 0.21 0.30 0.30 0.29 −0.08 −0.00 0.27 1
F18 0.11 0.32 0.14 0.17 0.25 0.25 0.26 −0.02 −0.04 0.23 0.01 1
F19 0.48 0.66 0.42 0.23 0.48 0.46 0.51 −0.32 0.13 0.69 0.32 0.14 1
Multicollinear factors are shown in bold.
Table 8 shows the results of selecting the factors that will serve as a foundation for developing
models for each of the three zones. Factors with values lower than 0.2–0.3 are marked with * [74],
along with multicollinear factors are marked with **, both are excluded from modelling.
Table 8. Significance values of the pricing factors in the three zones of Anapa.
Non-Prestigious
Factor Prestigious Territories Standard Territories
Territories
Availability of a shopping facility (F1) - - -
Availability of recreational facilities (F2) 0.75 1 0.25 *
Availability of a medical facility (F3) - - -
Availability of a cultural facility (F4) −0.68 ** 0.64 −0.20
Connection to a gas supply system (F5) - 0.24 −0.60
Connection to a water supply system (F6) - - -
Connection to a heating system (F7) - - -
Connection to a power supply system (F8) - - -
Connection to a sewer system (F9) - - -
Distance to the nearest bus stop (F10) −0.07 * 0.20 ** −0.03 *
Distance to the nearest railway platforms
0.24 0.37 ** −0.01 *
and stations (F11)
Distance to the nearest bus terminal (F12) 0.04 * 0.35 ** −0.52 **
Distance to the airport (F13) 0.04 * 0.37 0,84 **
Distance to the nearest port (F14) −0.29 0.06 * −0.73 **
Distance to sea coast (F15) 0.02 * −0.20 ** −0.19 *
Distance to the town centre (F16) 0.21 * 0.50 1
Number of hotels (F17) 1 0.55 −0.20
Quality of the sea coast (F18) - 0.25 0.01 *
Availability of entertainment venues (F19) 0.56 0.57 0.27
*: Factors with values lower than 0.2–0.3. **: Multicollinear factors.
Table 8 clearly shows the differences in pricing factors and their influence on the market value
in each of the three zones, which confirms that pricing processes differ depending on the level of
territorial prestige.
In modelling the process of cadastral land valuation applied to land plots intended for private
housing construction, the price in roubles per square metre was used as a dependent variable, with its
values calculated for each land plot located in one of the three zones.
When there is no multicollinearity, a linear regression model is used to find the cadastral value
of an object, which is sufficient to prove that pricing factors differ for the three identified zones. The
models that were developed in order to find the price per square metre (Y) for land plots intended for
private housing construction in the town of Anapa are as follows:Sustainability 2020, 12, 7904 16 of 26
The zone of prestigious territories:
Y = 9472.14 + 12179.84 · XF2 − 724.07 · XF11 − 678.89 · XF14 + 155058.72 · XF17 + 5051.68 · XF19 (9)
The zone of standard territories:
Y = 12779.67 + 12136.5 · XF2 + 11044.31 · XF4 + 327.55 · XF5 − 11014.6 · XF13
(10)
−762.02 · XF16 + 1048.76 · XF17 + 2106.5 · XF18 + 589.65 · XF19
The zone of non-prestigious territories:
Y = 5648.28 + 11.6 · XF4 + 1080.92 · XF5 − 4337.3 · XF16 + 3132.01 · XF17 + 608.53 · XF19 (11)
Each of the models was assessed in terms of its quality and statistical significance. The results are
presented in Table 9.
Table 9. Model quality parameters.
Non-prestigious
Parameter Prestigious Territories Standard Territories
Territories
Coefficient of multiple correlation (R) 0.76 0.92 0.84
Coefficient of determination (R2 ) 0.58 0.85 0.72
Adjusted R2 0.53 0.83 0.70
Standard error 1710.07 1212.19 838.68
F-test (cut-off value) 2.45 1.86 2.07
F-test (calculated value) 11.63 64.68 36.46
Significance (F) 4.34 × 10⁻⁷ 3.20 × 10⁻³⁴ 2.55 × 10⁻¹⁸
Darbin–Watson test 1.70 1.76 1.61
Darbin–Watson critical values 1.34–1.77 1.506–1.85 1.51–1.77
As a result of the study, a method was developed for cadastral land valuation in resort towns based
on zoning by prestige. Within this method, a way of assessing territorial prestige was also developed.
For resort towns in general, a list of significant criteria was formulated for assessing territorial
prestige based on the method of expert analysis and the Pareto chart. The criteria were ranked by
significance and included proximity to the sea coast with public beaches (with a criterion weight of
26%), availability of entertainment venues (22%), environmental quality (17%), and hotel ratings (13%).
This combination confirms theoretical assumptions and the results of analytical studies devoted to the
emergence of territories in resort towns that are considered to be prestigious due to generating higher
rental incomes.
By applying the proposed method to the town of Anapa, the following results were obtained:
First, when zoning the map of Anapa by prestige, three zones were identified, whose values of the
integral indicator of prestige range from 0.023 to 0.147 for the zone of non-prestigious territories, from
0.160 to 0.426 for the zone of standard territories, and from 0.726 to 0.441 for the zone of prestigious
territories. K-means clustering was used to obtain these values. The boundaries of the zones were
drawn on the map along the closest natural or artificial boundaries.
Second, by comparing the results of zoning by prestige (Figure 5) and the map indicating market
prices (Appendix A) for land plots intended for private housing construction, it was revealed that
prices were higher within the zone of prestigious territories (the central part of the town spreading
along the sea coast with excellent public beaches and a large number of entertainment venues) and
lower for land plots located at a distance from the Black Sea coast and entertainment venues. This
proves that the results of zoning the map of Anapa by prestige are objective.
Third, cadastral land valuation models were developed that describe land plots intended for
private housing construction in Anapa and can be interpreted as follows:Sustainability 2020, 12, 7904 17 of 26
• The zone of prestigious territories: the coefficients of XF2 , XF17 , XF19 show an average increase of
12,179.84 roubles, 155,058.72 roubles, and 5051.68 roubles in the price for 1 m2 of land with an
increase in the number of recreational facilities within a 2-km radius, hotels within a 2-km radius,
and entertainment venues within a 1-km radius, respectively, and the coefficients of XF11 , XF14
show a decrease of 724.07 roubles and 678.89 roubles in the average price for 1 m2 of land with
an increase in the distance to the nearest railway platforms and stations and an increase in the
distance to the nearest port, respectively.
• The zone of standard territories: the coefficients of XF2 , XF4 , XF5 , XF17 , XF18 , XF19 show an average
increase of 12,136.5 roubles, 11,044.31 roubles, 327.55 roubles, 1048.76 roubles, 2106.5 roubles,
and 589.65 roubles in the price for 1 m2 of land with an increase in the number of recreational
facilities within a 2-km radius, an increase in the number of cultural facilities within a 1-km radius,
a connection to a gas supply system, an increase in the number of hotels within a 2-km radius, a
better quality of the sea coast, and an increase in the number of entertainment venues within a
1-km radius, respectively, and the coefficients of XF13 , XF16 show a decrease of 1516.18 roubles and
743.74 roubles in the average price for 1 m2 of land with an increase in the distance to the airport
and the town centre, respectively.
• The zone of non-prestigious territories: the coefficients of XF4 , XF5 , XF17 , XF19 show an average
increase of 11.6 roubles, 1080.92 roubles, 3132.01 roubles, and 608.53 roubles in the price for 1 m2
of land with an increase in the number of cultural facilities within a 1-km radius, a connection
to a gas supply system, an increase in the number of hotels, and an increase in the number of
entertainment venues within a 1-km radius, respectively, and the coefficient of XF16 shows an
average decrease of 4337.3 roubles in the price for 1 m2 of land with an increase in the distance to
the town centre.
Fourth, model adequacy checking showed that the regression models are adequate, which is
proved by:
• the coefficients of determination (0.58, 0.85, 0.72), whose values exceed 0.5, which shows that the
models are of acceptable quality;
• F-test values that, at a significance level of 0.05, are much higher than the reference values, which
suggests that the factors included in the model quite fully explain the market price indicator as a
dependent variable (i.e., the models are significant);
• the analysis of the residuals, which showed that Durbin–Watson test values lie within the critical
values, i.e., there is no autocorrelation of the residuals (i.e., the model is of good quality).
5. Conclusions
Amendments to the Tax Code of the Russian Federation that came into force in 2015 defined the
cadastral value as a tax base, which resulted in its growth. This spurred research into cadastral land
valuation practices based on the principle of justice. This principle underlies the proposed cadastral
land valuation method based on zoning by prestige.
Summing up the results of the study, several conclusions can be made:
First, a comparative analysis of the cadastral values used for calculating land tax and the real
market prices in the resort town of Anapa showed that plots of land intended for private housing
construction were not evaluated objectively. Currently, there is an inequity in the distribution of the
cadastral values of land plots, as some of those located in prestigious territories are undervalued, while
some land plots located in standard territories or non-prestigious territories are overvalued.
Second, the concept of territorial prestige in resort towns should be introduced into legislation and
land valuation procedures that are connected with land plots intended for private housing construction.
This concept can be described as the result of a subjective attractiveness assessment that is given to
an area by a group of people employed in the tourism industry by using rental income as the main
assessment criterion.You can also read